
Abstract
Background:
The glucose transporter 1 (GLUT1) is a key protein that facilitates the extensive glucose uptake of cancer cells, and its overexpression is associated with more aggressive tumor phenotypes. In cases of BRAF mutations, GLUT1 seems to be a target of the constitutive activation of the RAF/MEK/ERK pathway. In this study, we hypothesized that the common BRAF V600E mutation was associated with GLUT1 overexpression and proliferation in papillary thyroid carcinomas (PTCs).
Methods:
A total of 57 cases of paraffin-embedded PTC (31 BRAF V600E, 26 wild-type BRAF) were investigated using immunohistochemistry with antibodies against GLUT1 and Ki-67 (MK167) protein. The BRAF V600E mutations were detected using direct sequencing of genomic DNA that was isolated from formalin-fixed paraffin-embedded tumor tissues. GLUT1 expression was assessed using the Remmele immunoreactive score and subdivided into three groups (I=negative, II=weakly positive, and III=positive). The Ki-67 labeling index (Ki-67 LI) was determined by counting Ki-67–positive nuclei.
Results:
GLUT1 expression was found in 39/57 (68.4%) samples of PTC. The occurrence of the BRAF V600E genetic variant was significantly correlated with GLUT1 overexpression (p=0.007) and showed a trend toward higher proliferation, which was indicated by Ki-67 LI (p=0.06). Moreover, GLUT1 overexpression was positively associated with Ki-67 labeling (p=0.023).
Conclusions:
The V600E BRAF mutation in PTC may contribute to the initiation of the glycolytic phenotype and confers growth advantages in cancer cells. Better understanding of the molecular mechanisms of cancer cell energy metabolism may lead to the implementation of targeted treatment modalities, which regulate cancer glucose uptake.
Introduction
The glucose transporter 1 (GLUT1) is a key transporter protein that promotes glucose uptake to satisfy the increased demand for glucose in various human malignancies. GLUT1 facilitates bidirectional energy- and insulin-independent glucose transport via the plasma membrane. In various cancers, overexpression of GLUT1 is associated with higher grades of malignancy and poorer outcome (2). In this context, our group recently demonstrated a significant correlation between GLUT1 expression and cell proliferation and grade of differentiation in various types of thyroid malignancies (3). GLUT1 overexpression is not usually detected in normal tissues or benign epithelial tumors (4).
At least 45% of papillary thyroid carcinomas (PTCs) harbor the oncogenic BRAF V600E mutation, which leads to a constitutive activation of the RAF/MEK/ERK pathway (5). PTCs with this BRAF mutation behave more aggressively than wild-type BRAF (WT) tumors, which has been correlated to extrathyroidal extension, positive nodal status, disease recurrences, and mortality (6 –11).
GLUT1 gene expression is regulated by several factors such as stimulation by growth factors, hormones, or hypoxia under malignant or nonmalignant conditions. Additionally, previous studies have shown that GLUT1 is the target of mutated KRAS or BRAF leading to GLUT1 protein overexpression and increased glucose uptake of mutated cultured cells of colorectal carcinomas and PTCs. Therefore, GLUT1 overexpression is suggested as a modulator of the metabolic signature of cancer cells (12,13). Increased GLUT1 mRNA levels have been noted in PTC compared with normal thyroid tissue. In addition, GLUT1 mRNA is significantly increased in BRAF-mutated PTC when compared with BRAF WT tumors (14).
This study tested the hypothesis that the BRAF V600E (c.1799T>A) mutation in PTC was positively associated with GLUT1 protein expression and increased tumor proliferation. For this purpose, we used immunohistochemistry (IHC) to analyze the protein expression of GLUT1 and determined the Ki-67 labeling index in 57 PTCs with and without the BRAF V600E mutation.
Materials and Methods
Tumor samples
For the IHC study, 60 cases of PTC with known BRAF status (31 BRAF V600E, 29 BRAF WT) were initially retrieved from the archived formalin-fixed paraffin-embedded tissue blocks of the Institute of Pathology and Neuropathology, University Hospital, Essen, Germany (Table 1). After GLUT1 IHC, three cases were excluded due to the lack of internal staining controls (erythrocytes). Finally, the study was performed with 57 cases of PTC. Informed consent from individual patients was not necessary because all data were made anonymous. This investigation was performed according to the guidelines of the Ethics Committee of the University Hospital Essen and in accordance with the precepts established by the Helsinki declaration.
Nodal status was available in 30/57 cases (52.6%).
PTC, papillary thyroid cancer; WT, wild type; sd, standard deviation.
Histopathology
PTC variants were classified using the World Health Organization Classification of Tumors (“Tumors of Endocrine Organs”) that was published in 2004 (15). The tumor subtyping in conventional (CLPTC), follicular variant (FVPTC), and tall-cell variant (TCVPTC) of PTCs and TNM classification were performed by two expert pathologists for thyroid pathology (S.Y.S. and K.W.S.).
Immunohistochemistry
For IHC, 4-μm sections were cut from paraffin-embedded tissue blocks. We used a rabbit polyclonal antibody against GLUT1 (dilution, 1:400; IgG; Abcam, Cambridge, United Kingdom) and a mouse monoclonal antibody against Ki-67 (dilution, 1:2000; IgG1: clone, K-2; Zytomed Systems, Berlin, Germany) together with a highly sensitive and specific polymer detection system utilizing horseradish peroxidase (ZytoChem-Plus HRP Polymer Kit; Zytomed Systems). The process for development was performed using a permanent brown chromogenic substrate system (Permanent AEC Kit; Zytomed Systems). Finally, nuclei were counterstained with hematoxylin for 5 minutes.
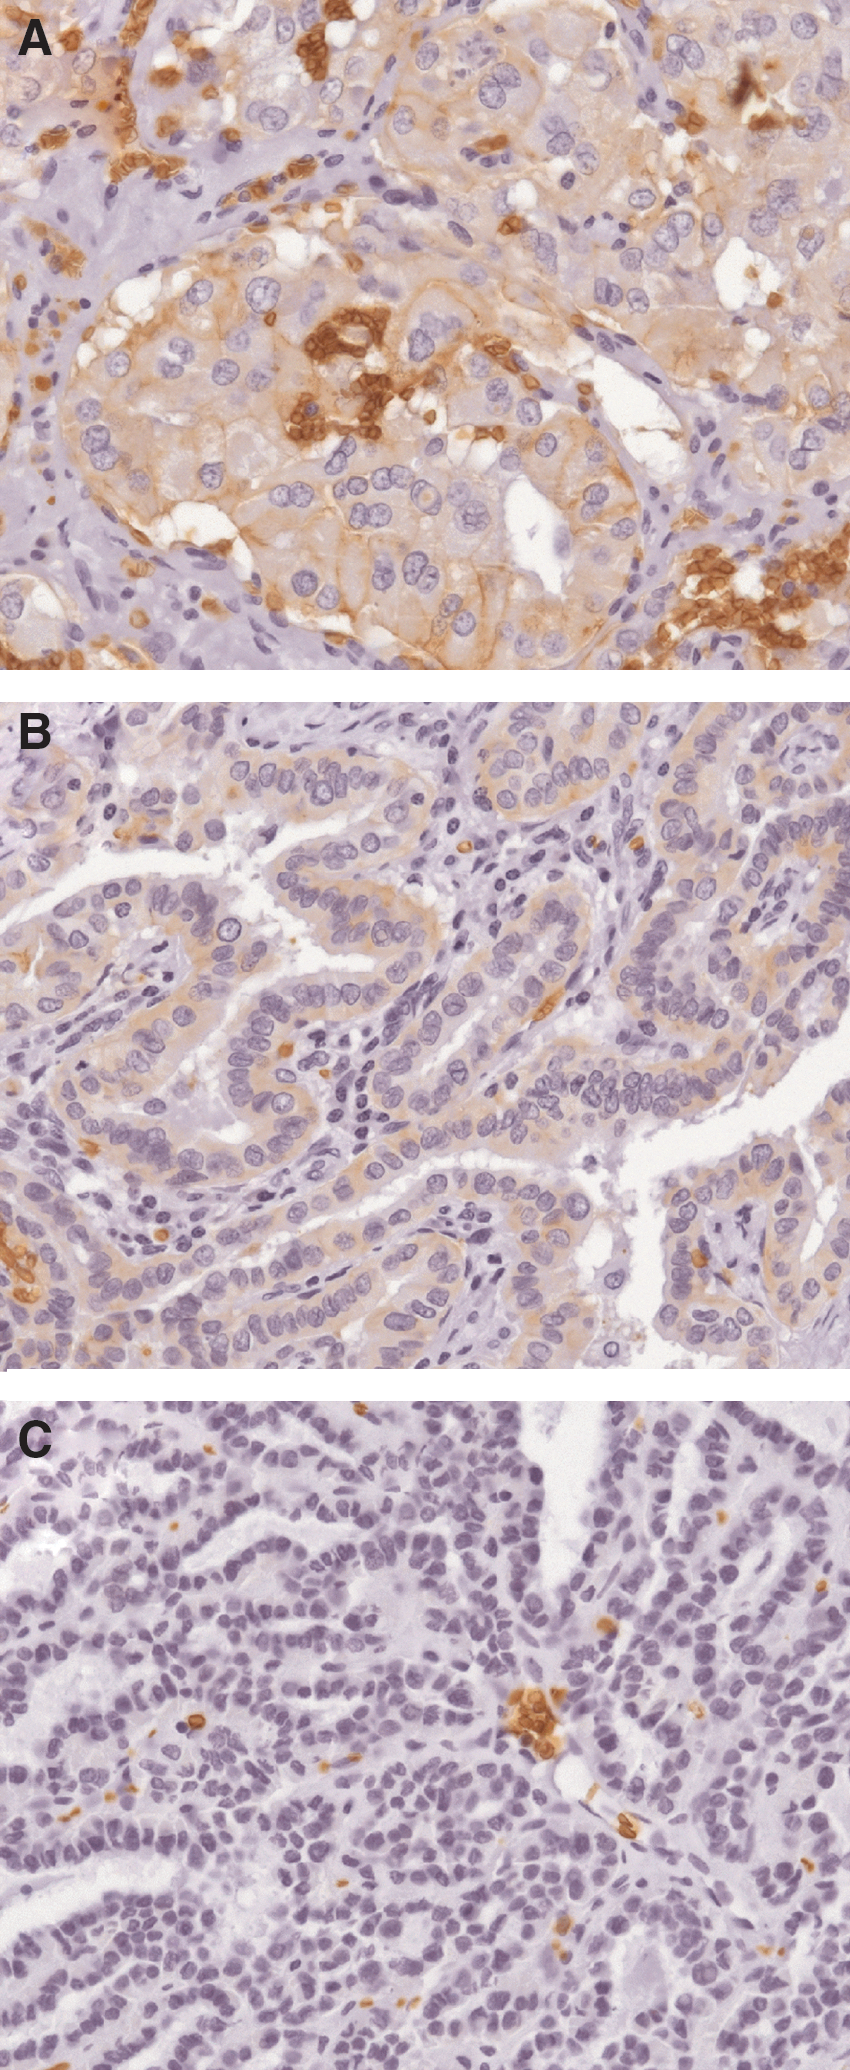
The staining of GLUT1 was assessed using the Remmele immunoreactive score (IRS) (16) by multiplying the level of staining intensity (0–3 points: absent, weakly, intermediate, strong) with the percentage of positive tumor cells (0–4 points; cutoffs: 0%, <10%, 11%–50%, 51%–80%, >80%). The staining intensity was evaluated according to the following scale: negative (0 points), weakly positive (1–2 points), and positive (>2 points). Intratumoral erythrocytes served as positive controls (see Fig. 1).
Ki-67 LI was expressed as the number of positive nuclei per 1 high-power field (HPF) by using an MIB-1 antibody and counting positive nuclei in three areas with the highest density of immunoreactive nuclei (“hot spots”). Three HPFs with an HPF area of 0.23 mm2 were examined using an Olympus BX50 microscope (UplanFl 40x/0.75 objective).
For analysis of the BRAF gene mutation, genomic DNA was isolated from formalin-fixed paraffin-embedded tumor tissues. The samples were deparaffinized using xylene/ethanol treatment. DNA was extracted using the QIAamp DNA Mini Kit (Qiagen, Hilden, Germany) according to the manufacturer's protocol. Exon 15 of BRAF was amplified using the polymerase chain reaction (PCR) with the following primers—BRAF-F: 5′-TCA TAA TGC TTG CTC TGA TAG GA-3′ and BRAF-R: 5′-GGC CAA AAA TTT AAT CAG TGG A-3′ (amplicon of 224 bp) (17). Briefly, 2 μL of DNA was amplified with 10 pmol of each primer, 200 μM deoxynucleotide triphosphates, 1 × PCR buffer (Qiagen), and 1.25 U of Hot Star Taq DNA Polymerase (Qiagen) in a final volume of 50 μL. The PCR conditions were initial denaturation at 95°C for 10 minutes followed by 40 cycles (denaturation at 94°C for 30 seconds; annealing at 55°C for 60 seconds; synthesis at 72°C for 60 seconds) and a final extension at 72°C for 8 minutes using a Primus 25 thermocycler (MWG Biotech, Ebersberg, Germany). Amplification products were analyzed using a 2.3% agarose gel and purified with the MinElute PCR Purification Kit (Qiagen). Nucleotide sequence analysis was performed using the BigDye Terminator v1.1 Cycle Sequencing Kit (Applied Biosystems, Foster City, CA). The purified PCR products were sequenced in both directions using BRAF-R and BRAF-F primers. Cycle sequencing products were analyzed using the ABI PRISM 310 Genetic Analyzer (Applied Biosystems, Darmstadt, Germany).
Statistics
Statistical analysis was performed using IBM SPSS® Statistics 19.0 for Windows®. We used the Chi-square test, t-test, Spearman correlation test, Kruskal–Wallis test, or Mann–Whitney U-test as indicated in the text. p-Values ≤0.05 were considered statistically significant, and p-values ≤0.10 were regarded as a trend.
Results
Patients and basic clinicopathological characteristics
Patients' and tumor characteristics are shown in Table 1. The BRAF V600E mutation status or the GLUT1 immunohistochemical data showed no significant association with the occurrence of extrathyroidal extension, positive nodal status, multifocality, or tumor size (Chi-square test, Mann–Whitney U-test, or Kruskal–Wallis test for calculations with tumor size).
BRAF V600E sequencing
The study comprised 31 (54.4%) of PTC with the BRAF V600E mutation and 26 (45.6%) of PTC with BRAF WT. The BRAF V600E PTCs include 16 TCVPTC, 8 FVPTC, and 7 CLPTC (Table 2). An association between age and BRAF mutation status was not detected (p=0.8; t-test).
CLPTC, conventional PTC; FVPTC, follicular variant of PTC; TCVPTC, tall-cell variant of PTC; GLUT1, glucose transporter 1; IHC, immunohistochemistry.
Immunohistochemistry
GLUT1 expression was found in 39 of 57 cases (68.4%; Table 2). According to the Remmele IRS, all positive cases displayed only a weak or intermediate degree of staining (maximum IRS 6). The PTC variants revealed no significant differences in the GLUT1 expression (Table 2).
Ki-67 LI: Mean Ki-67 LI was 7.4±7.3 positive nuclei/HPF. No differences in the proliferative activity between the various PTC subtypes were detected (Table 2).
However, Ki-67 LI showed a significant positive association with the immunohistochemical grade of GLUT1 overexpression (GLUT1-negative, 4.5±4.6 Ki-67 LI; GLUT1-weakly positive, 7.7±8.4 Ki-67 LI; GLUT1-positive, 11.1±6.9 Ki-67 LI; p=0.023, Kruskal–Wallis test, Fig. 2).
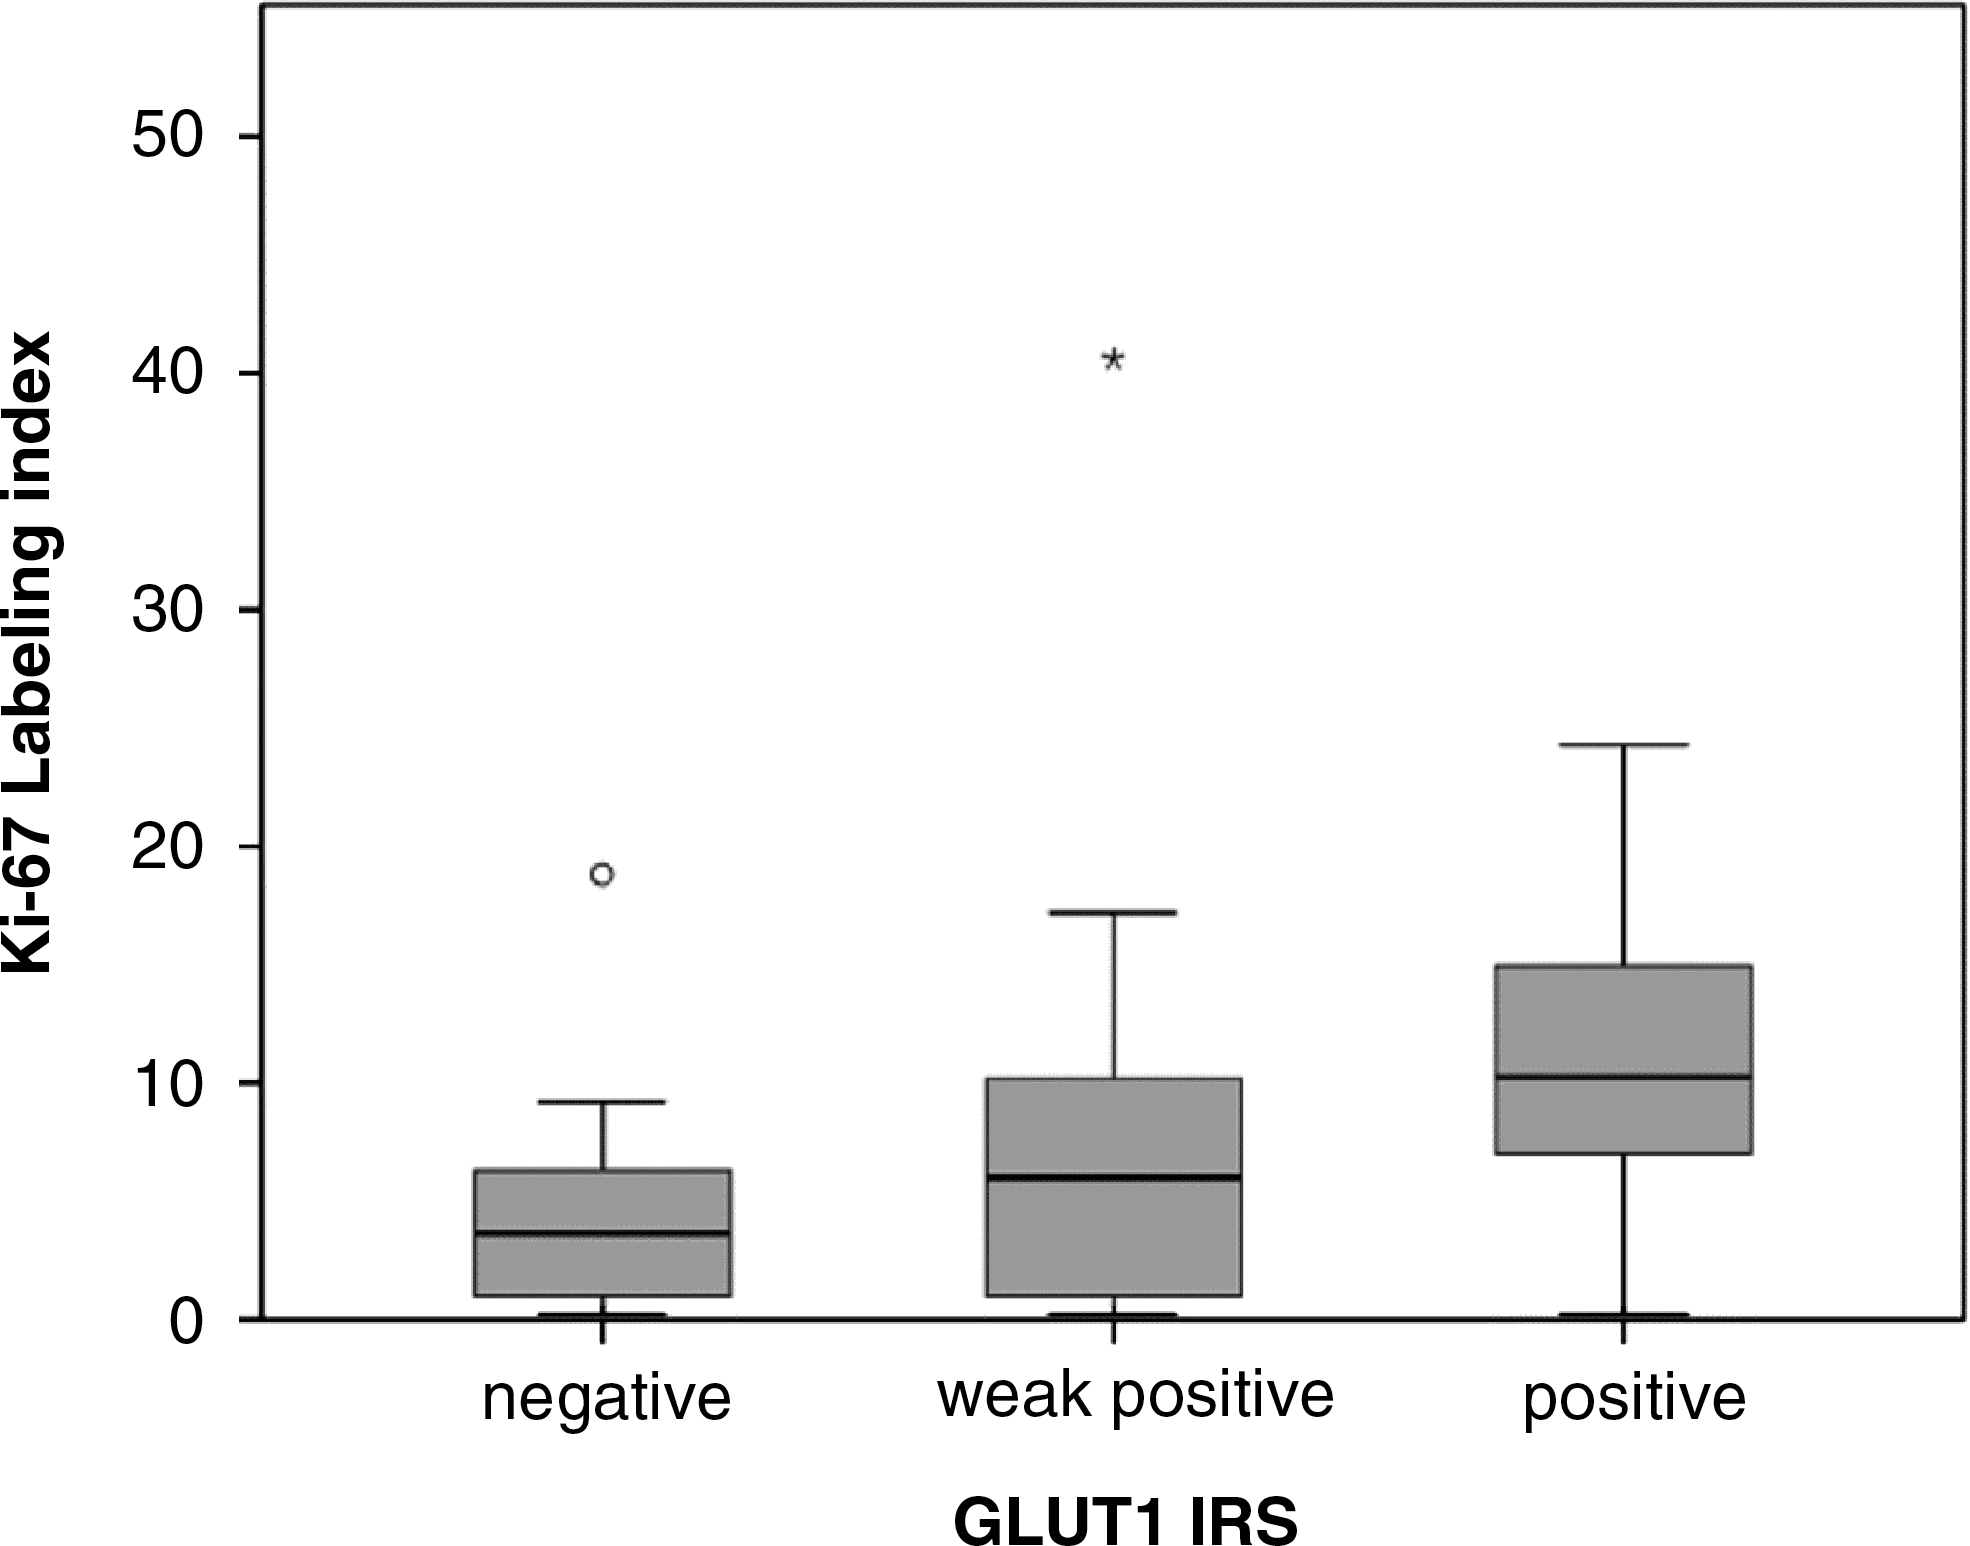
Correlation between proliferation (Ki-67 labeling index) and immunohistochemical GLUT1 expression groups (p=0.023, Kruskal–Wallis test; outliers: *, °).
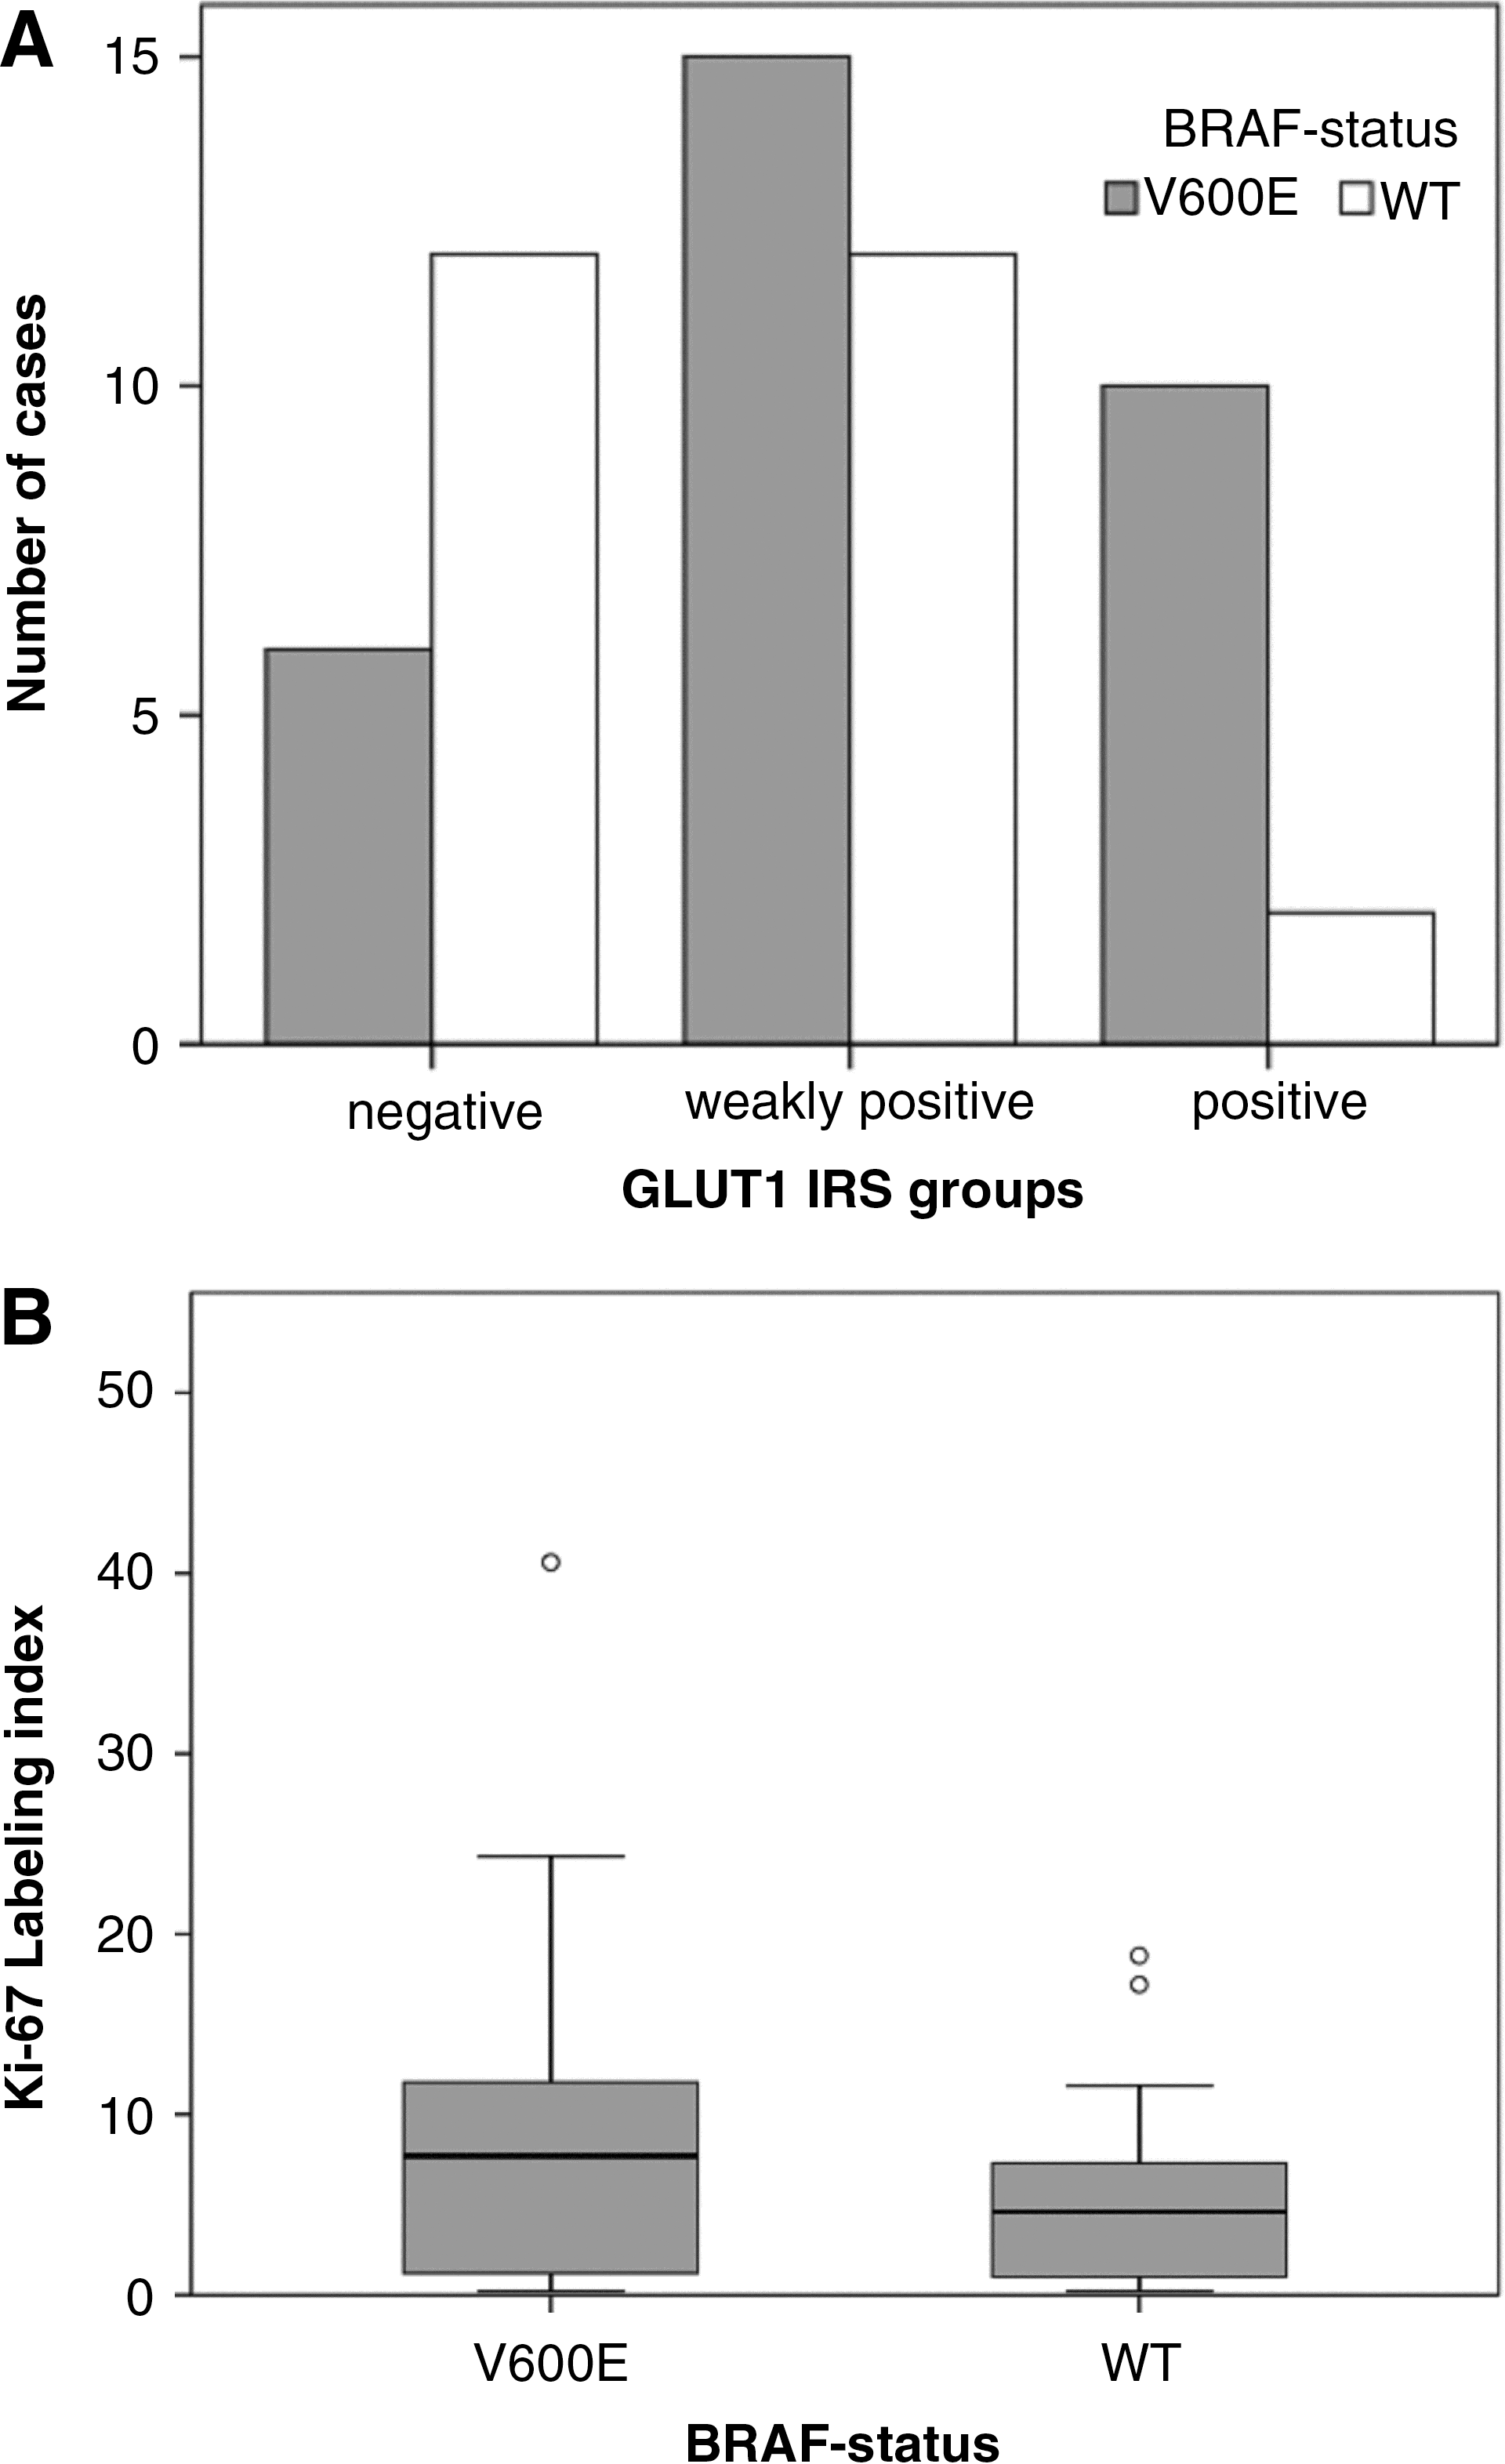
Overall, a significant association between GLUT1 protein overexpression in IHC and the occurrence of the BRAF V600E mutation was identified (p=0.007, Fig. 3A). BRAF V600E-mutated PTC showed a trend that was associated with higher tumor cell proliferation (Ki-67 LI; p=0.06, Mann–Whitney U-test, Fig. 3B).
Discussion
Cells of malignant human tumors use glucose to generate biomass and energy for proliferation. This large bioenergetic demand is satisfied by a conversion of the cellular energy metabolism from the effective but slow oxidative phosphorylation to the fast but ineffective aerobic glycolysis with lactate formation. The resulting extraordinary uptake of glucose is mediated by the upregulation of the GLUT1 in a variety of human malignancies. This process is summarized under the “Warburg effect” (1) and is the basic metabolic change that allows clinical targeting of tumors with glucose-based tracers in positron emission tomography (18F-FDG PET) (18).
In thyroid cancers (TC) of follicular epithelial origin, intense glucose uptake during 18F-FDG PET or PET/computed tomography (CT) has been noted in less-differentiated cancer types such as poorly differentiated or anaplastic TC (3). The correlation between dedifferentiation and increase in glucose consumption is well-known in nuclear medicine and a basic principle of the so-called “flip-flop phenomenon,” which describes the inverse relationship of iodine storage capability and glucose uptake during dedifferentiation of thyroid carcinomas (19).
PTCs show glucose uptake in ∼2/3 of cases in 18F-FDG PET or PET/CT studies (3,19). Accordingly, GLUT1 expression in PTC, which was determined by IHC, was 68% in this study, which is in agreement with previous GLUT1 IHC studies of TC that detected GLUT1 expression in 53% (20) and 71% (21) of thyroid tumors, respectively.
In our recent work, GLUT1 expression was correlated with cell proliferation in thyroid, breast, and bladder cancers and there was a significant association between GLUT1 overexpression (IHC) and proliferation (3,22,23).
Cell proliferation, which is measured by mitotic or Ki-67 labeling indices, is one of the most meaningful biological markers indicative of malignancy in human cancer (24,25) and has become an integral part of different tumor grading systems (26 –28). Using the IRS, the present study detected predominantly weak or intermediate GLUT1 staining intensities, which is in agreement with the previous results of our group. Our previous study showed that intense GLUT1 expression is a sign of progressive dedifferentiation and is detected in highly malignant TC types such as poorly differentiated or anaplastic TC (3).
Proliferation and GLUT1 expression is generally lower in PTC than in less-differentiated TC types. However, a subgroup of PTC is inherently more aggressive and predestined for tumor progression (11). The occurrence of BRAF mutations, particularly the BRAF V600E mutation, in PTC has been identified as a reliable molecular marker to predict less favorable prognosis (5). Furthermore, it was shown that GLUT1 can be targeted through both the RAF/MEK/ERK as well as the AKT signaling pathways. Regarding RAF/MEK/ERK signaling the association of BRAF status and GLUT1 overexpression, glucose uptake, and lactate production has been shown in cell culture experiments for colorectal and TC (12,13) and increased GLUT1 mRNA levels were observed for BRAF V600E-mutated PTC (14). Our results demonstrate that the BRAF V600E mutation is associated with overexpression of the GLUT1 transporter protein in tumor tissue resection specimens, actuating the cancer energy machinery of PTC. This finding is reflected by increased proliferation of tumors with (i) GLUT1 overexpression and (ii) carriers of the BRAF V600E mutation leading to a growth advantage of mutated PTC cells.
From the translational point of view, the inhibition of RAF kinase activity might lead to GLUT1 downregulation in BRAF-mutated PTC and tumor growth inhibition by starving tumor cells. Recently, multiple-receptor tyrosine kinase (TK) inhibitors, such as sorafenib, have been clinically tested for advanced radioiodine refractory PTC and have demonstrated a clear antitumoral activity based on growth inhibition and antiangiogenetic effects (29 –32).
Unfortunately, nearly all sorafenib trials measured tumor response with anatomic response criteria (Response Evaluation Criteria for Solid Tumors, RECIST) using CT or magnetic resonance imaging. Therefore, the data concerning the metabolic response, which was measured by glucose utilization in 18FDG-PET/CT, are yet not available for PTC. These data have been reported for nine patients suffering from medullary thyroid carcinoma (33). In this study, it was shown that glucose uptake of treated tumors decreased after therapy.
Targeted treatment using TK inhibitors (including the RAF/MEK/ERK pathway) can be accompanied by immediate metabolic response, which has been detected following imatinib treatment (another TK inhibitor, targeting BCR-ABL, KIT, and PDGFRA) of gastrointestinal stromal tumors and chronic myelogenous leukemia (34,35). Similar results have been reported for inhibitors of the Notch pathway in ERBB2-positive breast cancer cells (36). Remarkably, Lee et al. have not been able to demonstrate an inhibitory effect of sorafenib on the metabolic signature of BRAF V600E-mutated TC cells in cell culture experiments (12), indicating that the direct targeting of GLUT molecules may have a superior potential to suppress the accelerated glucose consumption of TC cells (4,37). In this regard, GLUT1 was reported to be a promising novel therapeutic target for hepatocellular carcinomas (38).
In conclusion, this study presents evidence of an association between the activation of the RAF/MEK/ERK pathway via BRAF mutations in PTC and the overexpression of the GLUT1 protein, a protagonist of the glycolytic phenotype of cancer. A better understanding of the molecular mechanisms of the “Warburg effect” may be a prerequisite for the development of targeted treatment modalities based on the modulation of cancer glucose metabolism.
Footnotes
Author Disclosure Statement
The authors declare that no competing financial interests exist.