
Abstract
Background:
When applying the recommended standard doses of recombinant human thyrotropin (rhTSH) in the diagnostic/therapeutic management of patients with differentiated thyroid cancer (DTC), the resulting peak TSH levels vary extensively. Previous studies applying multivariate statistics identified patient-inherent variables influencing the rhTSH/peak TSH relation. However, those results were inconclusive and partly conflicting. Notably, no independent role of renal function was substantiated, despite the fact that the kidneys are known to play a prominent role in TSH clearance from blood. Therefore, the study's aim was to investigate the impact of renal function on the peak TSH concentration after the standard administration of rhTSH used in the management of thyroid cancer. The second objective was to calculate a ranking regarding the effect sizes of the selected variables on the peak TSH.
Methods:
There were 286 patients with DTC included in the study. Univariate and multivariate analyses were performed, testing the correlation of serum creatinine and glomerular filtration rate (GFR) as surrogate parameters of renal function, age, sex, weight, height, and body surface area (BSA) with the peak TSH level. In six additional patients, the subsequent TSH pharmacokinetics after the TSH peak were measured and qualitatively compared.
Results:
By univariate analyses, TSH correlated negatively with BSA, GFR, weight, and height, and positively with age, female sex, and serum creatinine (p<0.001). On the multivariate analysis, the stepwise forward multiple linear regression revealed BSA and renal function as the two most influential independent variables, followed by age, sex, and height. The pharmacokinetic datasets indicated that these identified parameters also influence the TSH decline over time.
Conclusion:
Identifying those patients with a favorable combination of parameters predicting a high-peak TSH is the first step toward an individualization of rhTSH dosing. Additionally, the subsequent TSH decrease over time needs to be taken into account. A complete understanding of the interrelation of the identified key parameters and both the TSH peak and subsequent TSH pharmacokinetics might allow for a more personalized rhTSH dosage strategy to achieve sufficient TSH levels instead of the fixed dosing procedure used at present.
Introduction
Applying standard procedures in terms of dosing and administering rhTSH on two successive days results in a maximum TSH serum concentration within the next 24 hours on day 3, falling considerably until day 5 (4). In humans, the daily pituitary TSH turnover is between 40 and 150 mU/day and its half-life is about 1 hour, tending to be slower in elderly individuals (5,6). In contrast, studies on the pharmacokinetics of rhTSH indicate a longer elimination half-life of 25±10 hours (4) due to the higher sialylation of its oligosaccharide chains (7). Besides rapid metabolism, pituitary TSH is cleared by the kidneys in rats (8) and humans (5,6). In patients with chronic renal failure, pituitary TSH half-life was shown to be increased almost threefold as compared to healthy controls, indicating that the kidneys are most relevant for the clearance of pituitary TSH (5,6,9).
Daily clinical experience points to a considerable variability of peak TSH levels on day 3, while applying the standard rhTSH-stimulating procedures. According to previous uni- and multivariate studies, several demographic and anthropometric parameters, including body surface area (BSA), age, sex, and lean body mass (LBM), seem to influence this TSH response to rhTSH, but different, partly conflicting results have been published (10 –13). Especially regarding the glomerular filtration rate (GFR) and creatinine as surrogate markers of renal function, no correlation with TSH concentration was found (11,12). This is rather surprising, given that the kidneys are known to be a key organ for pituitary-derived TSH clearance (4,5,9).
Currently, the standard rhTSH protocol is employed without taking into account the above-mentioned patient characteristics. However, consideration of individual parameters that affect the TSH level after rhTSH stimulation is gaining relevance, as more individualized patient-centered care is on its way. In addition, the recent shortage in rhTSH supply demands the search for alternative rhTSH-saving protocols. To reach the goal of sufficiently high and individualized rhTSH stimulation, two points need to be taken into account: (i) the peak TSH after rhTSH application, and (ii) the subsequent pharmacokinetics until day 5 of the protocol to ensure an adequate TSH stimulation over time. The crucial parameters influencing the peak TSH need to be re-evaluated with special respect to renal function, which was not demonstrated as an independent factor of impact on peak TSH previously. In addition, the various influencing factors have to be compared in terms of their individual impact on the resulting peak TSH to establish a ranking of effect size among those parameters. This will help to provide an initial basis for future individualized rhTSH dose adjustments. However, the subsequent pharmacokinetics are of equal importance; thus, the variables identified as independently influencing the peak TSH have to be tested to determine if they also contribute to the TSH decline over time between day 3 and 5 of the protocol. The combined knowledge of these points might be the key to securely adjust the rhTSH dose to the patient's individual demands.
The present study focuses on peak TSH after rhTSH application, especially on the interaction of renal function and peak TSH and on the interfactor comparison of the parameters' influence on peak TSH. For this purpose, a group of 286 patients were studied retrospectively. Additionally, initial prospective pharmacokinetics data of six patients are provided.
Materials and Methods
Approval for reviewing the records of DTC patients undergoing exogenous rhTSH stimulation was obtained from the local ethics committees. A total of 287 datasets were identified by a search of all medical data available between July 2003 and May 2011. The selected patients had received previous surgery for DTC and underwent diagnostic 131I follow-up, 131I remnant ablation, or therapy while on TSH-suppressive thyroid hormone substitution. All patients were subjected to a standardized stimulation protocol of two intramuscular injections of 0.9 mg rhTSH on two successive days. According to the manufacturer's recommendations, on day 3, serum TSH was evaluated in all patients except one (who was subsequently excluded from further analysis). That same day, the serum creatinine level was investigated in the remaining 286 cases (Modular System D-Modul; Roche Diagnostics GmbH). In addition, the following data were collected from each patient: body weight and height (measured by standard techniques to the nearest 0.1 kg and 0.01 m, respectively), age, and sex. The BSA in square meters was calculated according to the DuBois formula (BSA = 0.20247 × height [m]0.725 × weight [kg]0.425). Laboratory testing of TSH was performed by an ultrasensitive electrochemiluminescence immunoassay (Roche Diagnostics GmbH). The GFR (in mL/1.73 m2 per minute) was estimated using the revised 4-variable Modification of Diet in Renal Disease (MDRD) study equation: GFR=175×[serum creatinine]−1.154 × [age]−0.203 × [sex] ×[race] (14). The factor [sex] was set to 0.742 for women and to 1 for men. As all patients were of Caucasian origin, the factor [race] was set to 1.
All statistics were calculated using Statistica (version 6.0; StatSoft, Inc.). The group data were given as mean±SD. According to the histograms and normality testings (Shapiro–Wilk), a normal distribution was given for age, weight, height, BSA, serum creatinine, GFR, and TSH. Univariate analyses to estimate separately the impact of weight, height, age, sex, BSA, and creatinine on the serum peak TSH on day 3 were carried out using a linear regression. In addition, the correlation coefficient r was calculated. For the multivariate statistics, a stepwise forward multiple linear regression was performed. The threshold regarded as significant was p<0.05. To illustrate the individual impact of the factors under investigation on the peak TSH, the R 2 changes of the significant factors were reported.
To preliminarily extend the findings drawn from our analyses, the pharmacokinetics of TSH over time were prospectively evaluated in six additional patients. This was also approved by the local ethics committee, and written informed consent was obtained from the participating patients. Four patients (two male, two female) received the standard full dose protocol. During a temporary shortage of rhTSH supply, two further patients with favorable parameters in terms of the expected peak TSH level were given two consecutive 60% doses (0.54 mg rhTSH) on days 1 and 2. In all six of these patients, the TSH levels were measured in 12-hour intervals between day 3, 8:00 a.m. and day 5, 8:00 a.m.
Taking into account the mono-exponential decline of TSH, the integral of TSH over time was calculated in these six data sets as follows:
where T is time and c 0 is the peak TSH on day 3, 8.00 a.m. Exponential regressions in Figure 3 are plotted applying the method of least squares. The goodness of this mono-exponential fit was determined by calculating and statistically exploring the residuals (p<0.05 was regarded as significant).
Results
Patient group characteristics
The characteristics of the patient group data are summarized in Table 1 and the clinicopathological DTC data in Table 2. The mean age was 56.4±15.3 years (range 14.7–88.3). Stratified by sex, 71% were women (mean 55.3 years, range 14.7–88.3) and 29% men (mean 58.9 years, range 30.5–84.3). Body weight ranged from 42 to 175 kg (mean 78.6±19.4 kg), height from 1.47 to 2.02 m (mean 1.70±0.09 m), serum creatinine levels from 0.3 to 7.4 mg/dL (mean 0.86±0.48 mg/dL), and GFR from 7.9 to 327.9 mL/1.73 m2 per minute (mean 84.5±30.0 mL/1.73 m2 per minute). Two patients, one of them requiring hemodialysis, suffered from severe renal disease and presented with very high serum creatinine values (4.1 and 7.4 mg/dL, respectively), exceeding the mean creatinine by more than three standard deviations. Therefore, to gain unbiased results in a sample of patients with normal or slightly impaired kidney function, we excluded these two outliers from the univariate analysis of serum creatinine and GFR, respectively, and from the multivariate analyses. Consequently, the serum creatinine ranged from 0.3 to 1.6 mg/dL (mean 0.83±0.21 mg/dL) and the estimated GFR ranged from 38.6 to 348.6 mL/1.73 m2 per minute (mean 85.1±29.5 mL/1.73 m2 per minute), respectively.
N=286.
BSA, body surface area; TSH, peak serum TSH measured on day 3 after intramuscular rhTSH administration on day 1 and 2;
GFR, glomerular filtration rate; TSH, thyrotropin.
T-, N-, and M-staging were determined using the TNM System, 7th edition (23).
On day 3 after rhTSH administration, the mean serum peak TSH was 132.57±60.34 mU/L, ranging from 24.62 to 455.70 mU/L. The peak TSH failed to achieve a blood concentration of >30 mU/L in two subjects (24.62 and 29.40 mU/L, respectively).
Univariate analyses
With respect to the peak TSH level, the univariate analyses demonstrated statistically significant negative correlations between serum peak TSH and weight, height, BSA, and estimated GFR (p<0.001; Fig. 1C–E), as well as significant positive correlations between serum peak TSH and female sex, age, and creatinine (p<0.001; Fig. 1A, B). Even after exclusion of the two patients with severely reduced renal function, creatinine was still positively correlated with peak serum TSH (p<0.001; Fig. 1F), while GFR was still negatively correlated (p<0.001; Fig. 1G). Regarding the effect of sex on the TSH level, significantly higher TSH values in females (mean 141.02±62.01 mU/L, range 29.40–455.70 mU/L) were revealed than in males (mean 111.53±50.47 mU/L, range 24.62–385.90 mU/L; Fig. 1A).
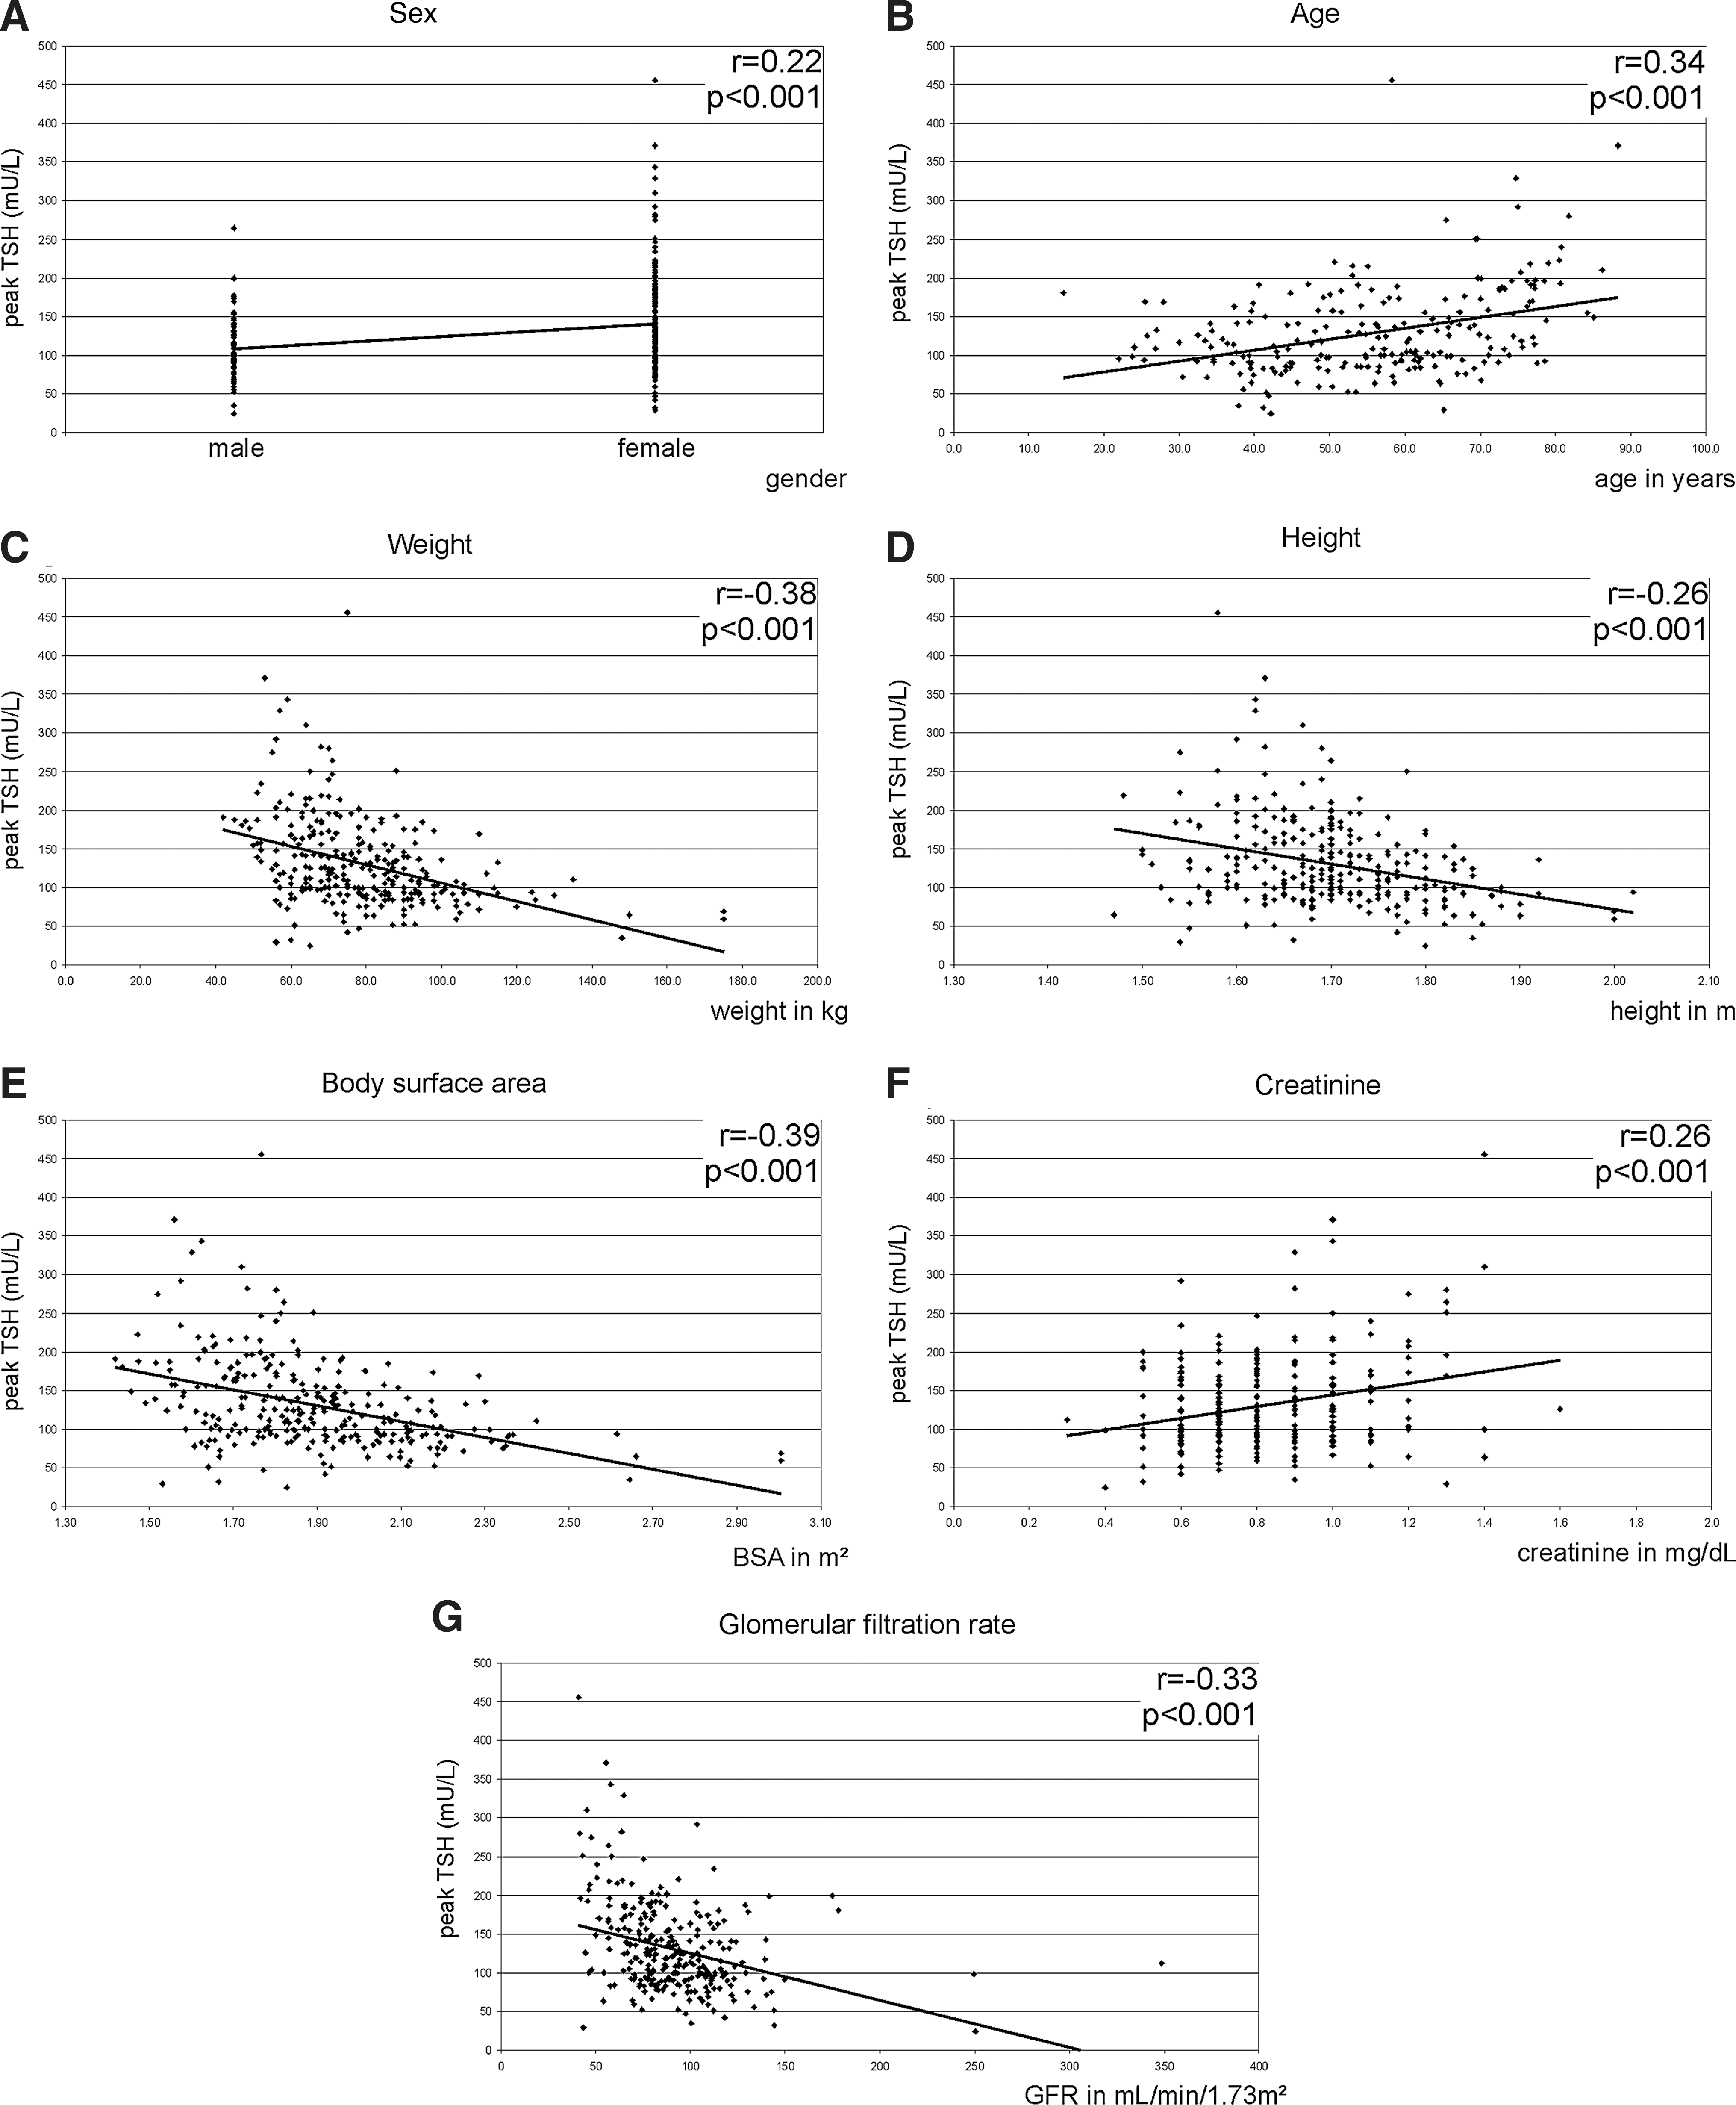
Linear regression analysis and Pearson's correlation coefficient r of serum peak thyrotropin (TSH) after recombinant human TSH (rhTSH) and
Multivariate analyses
The multivariate analysis including serum creatinine revealed significant independent influences of BSA (p<0.001), creatinine (p<0.001), sex (p<0.001), age (p<0.001), and height (p=0.03) on the peak TSH level, while patients' weight failed to influence the peak TSH level independently. The stepwise forward multiple linear regression approach indicated that the second highest influence on the peak TSH was creatinine, i.e. renal function. As demonstrated by the corresponding R 2 changes, the impact of BSA was stronger as compared to the renal function, while the other significant parameters age, sex, and height showed a weaker impact on peak TSH (Fig. 2A).

Stepwise forward multiple-regression analyses, including serum creatinine
In summary, the stepwise forward multiple linear regression analysis yielded the following equation:
TSH level=β1×[BSA]+β2×[creatinine]+β3×[age]+β4×[sex]+β5×[height]+intercept
where β1–β5 are the standardized regression coefficients (β1: −1.64; β2: 0.313; β3: 0.278; β4: 0.268; β5: 0.54), and the intercept is −112.8.
Using the estimated GFR as a parameter for renal function, the stepwise forward multiple linear regression analysis still identified BSA as the most important independent variable, now followed by age, GFR, and height, while sex was no longer significant (Fig. 2B). This multivariate analysis yielded an intercept of 56.9 and the following standardized regression coefficients: β1(BSA)=−1.5; β2(age)=0.276; β3(GFR)=−0.22; β4(height)=0.472. However, the cumulative R-square change of the identified independent parameters was smaller when applying the estimated GFR as compared to serum creatinine (Fig. 2). This indicates that the inclusion of serum creatinine into the model provides a more accurate prediction of the resulting peak TSH.
TSH pharmacokinetics over time as proof-of-principle
The calculation of the TSH over time integral revealed 1447 and 2070 mU TSH per 48 hours in the middle-aged male subjects after a full rhTSH dose administration. The integration of the TSH amount in the two elderly female subjects receiving a full dose of rhTSH yielded 3137 and 2938 mU TSH per 48 hours, while the 60% rhTSH doses in the further two middle-aged females resulted in 1801 and 2258 mU TSH per 48 hours, respectively (Fig. 3). The characteristics of these patients are presented in Table 3. The mono-exponential regression provided an adequate fit of the decreasing TSH levels over time with p<0.05 in all six cases.

Individual peak TSH at day 3 and subsequent TSH decline over time until day 5 in six patients:
AUC, area under the curve.
Discussion
For either 131I thyroid remnant ablation or treatment, diagnostic follow-up whole-body scanning and/or measurement of stimulated hTG in patients with DTC, national and international guidelines recommend a stimulated TSH of at least 30 mU/L after thyroid hormone withdrawal (15 –18). If using exogenous rhTSH, maximal thyrocyte stimulation due to a complete TSH receptor saturation is reported to occur at TSH levels between 51 and 82 mU/L (19). To ensure a sufficiently high TSH concentration, a standard dosage-and-application protocol of rhTSH is proposed (4). However, the resulting TSH levels demonstrate a wide range of variability with the majority of values far beyond the reported TSH range. A number of previous studies attempted to identify those parameters that predict the height of the peak TSH after rhTSH administration, but the multivariate analyses applied there yielded inconclusive results (10 –13). Therefore, to achieve the objective of an individualized rhTSH application scheme, the question of influencing parameters on peak TSH ought to be readdressed in a large patient sample with a special interest in the impact of renal function on peak TSH. Additionally, a ranking of the independently influencing factors is mandatory to provide a basic indicator which of the tested parameters is the most relevant predictor of the subsequent peak TSH.
As human pituitary TSH is not only metabolized, but also eliminated by the kidneys (5,9), renal function is hypothesized to be an independent factor influencing the course of TSH blood clearance over time. In fact, in the multivariate analysis, the serum creatinine concentration as a surrogate parameter of renal function was recognized as an independent factor influencing the peak TSH level (Fig. 1F). Both parameters were positively correlated. The same holds true when testing the independent impact of the estimated GFR on the peak TSH. However, these latter variables were negatively correlated (Fig. 1G). To the best of our knowledge, this is the first time that the renal function has been identified as a variable with an independent impact on peak TSH. In line with our observation, markedly increased TSH levels were achieved in dialyzed patients with renal failure even after administration of half of the recommended rhTSH dose (20). The results of the two patients from our study who also demonstrated a severely impaired renal function further support the proposition of a direct impact of kidney function on the blood TSH concentration after rhTSH as the one who is on hemodialysis presented with a creatinine of 7.4 mg/dL (GFR 7.9 mL/1.73 m2 per minute) and a concomitant peak TSH of 385.9 mU/L, while the other demonstrated a creatinine of 4.1 mg/dL (GFR 10.6 mL/1.73 m2 per minute) and a TSH of 196.0 mU/L. However, the other studies systematically investigating the influence of renal function on the resulting peak TSH failed to demonstrate any significant correlation by means of multivariate comparisons (11,12). Over et al. found a positive correlation in their univariate analysis that was no longer significant applying multivariate statistics (12). The missing correlation in the multivariate approach might be due to their comparably lower group size (n=112). Furthermore, their mean creatinine was 0.7±0.14 mg/dL, indicating that the majority of the patients included had no impairment of the kidneys' function as compared to our study group (mean creatinine 0.83±0.21 mg/dL). Montesano et al. showed no effect of renal function on peak TSH at all, but they included only 98 of their 311 patients in this subanalysis due to missing data in the remaining subjects and measured TSH at day 5 instead of day 3 (11). Therefore, at that later time point, the effect of kidney function on peak TSH might have ceased. By comparing the multivariate analyses of our study, the serum creatinine appeared to be a stronger predictor for the peak TSH as the estimated GFR (Fig. 2). This observation might be due to an intrinsic effect of the MDRD formula, which is reported to demonstrate some inaccuracies in GFR estimation of subjects without renal impairment (14,21).
With respect to the previous, partly conflicting results in terms of multivariate analyses, our study presented a comprehensive re-evaluation of the relevant variables in a large sample size. The multivariate analyses, including renal function, extended the previous work in that it revealed BSA, renal function, sex, age, and height as independent predicting factors (for a comparative overview of all available studies, see Table 4). Furthermore, by help of the stepwise forward multiple linear regression, these parameters were weighted according to their effect size on the prediction of the depending variable peak TSH with BSA and renal function as most relevant followed by age, sex, and height (Fig. 2A). While our results are the first demonstrating renal function as an independent factor influencing peak TSH, they are in line with those of Over et al. and Montesano et al. with respect to age and with the findings of Vitale et al. with respect to BSA (11 –13). Regarding the impact of sex, our findings corroborated the data of Montesano et al. and Castagna et al., even if the latter did not test sex by multivariate means (10,11). One potential explanation for higher peak TSH levels in females could be sex-dependent differences in the relation of fat tissue to muscle as it is known that males demonstrate a higher LBM than females (22). This may account for a higher metabolic rhTSH clearance in males and, consequently, lower peak TSH levels as compared to females. In support of this hypothesis, Castagna et al. identified the LBM as the only significant factor in their multivariate analysis, indicating that a higher LBM relates to lower peak TSH values (10).
BMI, body–mass index; LBM, lean body mass; FBM, fat body mass; n.s., not significant.
The fact that our study identified considerably more variables as independent predictors of the peak TSH on day 3 might be due to two factors: first, our studied patient group was almost threefold larger than those also investigating peak TSH on day 3 (10,12,13), which in turn resulted in a higher statistical power. Second, the only study with a comparatively high number of included patients (n=311) explored the TSH on day 5 (11), which does not represent the peak TSH. This peak has already been reached 3–24 hours after rhTSH injections (4,19). Thus, the effects of the factors that affect the TSH level at day 5 might have been diminished and were only significant for age and sex. Given this time difference in measuring the resulting TSH after two rhTSH injections, the findings of Montesano et al. are in general not exactly comparable to those of Castagna et al., Over et al., and Vitale et al. as well as to our findings.
Summing up our results, the peak TSH should be highest in elderly female patients with low BSA and impaired renal function. Moreover, with respect to the subsequent pharmacokinetics, one might propose that the TSH decline over time should be slower in these patients, resulting in a higher integrated TSH area under the curve (AUC). The revised ATA guidelines point out that this TSH AUC, but not the mere peak TSH, is the essential parameter for an optimal stimulation of DTC cells (18).
As the initial part of an ongoing prospective study, TSH levels were measured every 12 hours in six patients, four of them receiving the full rhTSH dose, while the remaining two were injected with only 60% due to a temporary shortage of rhTSH. The integrals appear to substantiate our prediction in that the AUCs of the younger male patients with higher BSA were ∼50%–66% of the AUCs of the elderly female subjects with low BSA when receiving the full rhTSH dose. The AUCs of the remaining two female patients receiving the 60% dose were about two-thirds of the AUCs of the elderly women treated with the full rhTSH dose, but were still equal or considerably higher than the AUCs of the male subjects. These data provide preliminary evidence for the influence of the parameters identified in our study not only on the peak TSH level, but also on the TSH integral over the following 2 days. This, in turn, supports the hypothesis that adequate hTG stimulation is feasible even with reduced rhTSH doses due to favorable patient parameters in terms of BSA, renal function, sex, age, and height. However, further studies in larger patient groups are necessary to gain a deeper understanding on how these factors actually influence the slope of TSH over time and the resulting TSH AUC. From such data, one might finally derive a personalized rhTSH dosage schedule, accounting for individual differences to avoid unnecessary cost-intensive rhTSH overstimulation, but—in parallel—to ensure a sufficient TSH concentration between day 3 and 5 of the proposed rhTSH stimulation course in patients with an unfavorable combination of the identified parameters.
In conclusion, the multivariate stepwise forward regression revealed BSA, renal function, sex, age, and height as independent predictors for the peak TSH level on day 3 after rhTSH stimulation on days 1 and 2, with BSA and renal function demonstrating the highest impact. These predicting factors and future understanding of the influence of these variables on the pharmacokinetic TSH decline over time might make a more personalized treatment regime possible by adapting the rhTSH dosage scheme to the individual demands of each patient.
Footnotes
Acknowledgment
The authors gratefully acknowledge the invaluable professional editing support of Ms. Sylvia H. Parker, Institute of Cybernetic and Future Research (IKZ), Düsseldorf.
Disclosure Statement
The authors have nothing to disclose.