
Abstract
Background:
Epithelial-to-mesenchymal transition (EMT) is thought to play a critical role in the invasion and metastasis of cancer and to be associated with cancer stem cell (CSC) properties. It is not clear if there is a link between EMT and CSCs in thyroid cancers. We therefore investigated the CSC properties of thyroid cancers that underwent EMT.
Method:
To induce EMT (spindle-like cell morphology, loss and acquisition of expression of an epithelial marker E-cadherin and a mesenchymal marker vimentin respectively) in an epithelial-type thyroid cancer cell line ACT-1, we used transforming growth factor-β (TGF-β), BRAFV600E, and/or Snail homolog 1 (SNAI1, also known as SNAIL). CSC properties were analyzed with assays for cell proliferation, chemosensitivity, in vitro and in vivo tumor formation ability, cell surface antigens, and intracellular aldehyde dehydrogenase (ALDH; a known CSC marker) activities.
Results:
EMT was induced most efficiently by SNAIL (ACT-SNAIL cells), whereas TGF-β and BRAFV600E were less efficient. ACT-SNAIL cells showed slightly but significantly enhanced tumor formation ability in an in vitro sphere assay (approximately 3-fold) but not an in vivo subcutaneous tumor growth assay, and showed comparable chemosensitivity compared with the parental ACT-1 cells. However, of interest, although the in vitro sphere-formation ability of ALDH+ cells was almost unchanged after SNAIL induction, SNAIL overexpression induced much higher (approximately 14-fold) spheres in ALDH− cells. Thus, ALDH was no longer a CSC marker in ACT-SNAIL cells.
Conclusions:
All these data indicate that EMT confers CSC properties in ALDH− cells and appears to influence the ability of ALDH to enrich CSCs.
Introduction
Invasion and metastasis have recently been reported to be associated with epithelial-to-mesenchymal transition (EMT) in many cancers including thyroid cancers (3,4). This process is characterized by loss of morphologic features of epithelium, loss of intercellular adhesion molecules (e.g., E-cadherin), gain of mesenchymal markers (vimentin), and high motility and invasive capacities (4,5). Many EMT inducers have been identified, such as various cytokines and transcription factors. A representative in the former group is transforming growth factor-β (TGF-β). TGF-β is a multifunctional cytokine that acts as a tumor suppressor in early tumor development and promotes tumor cell invasion in later stages (6). TGF-β exerts its effect on EMT induction alone or by cooperating with signaling pathways such as RAS and WNT (7,8).
The latter transcription factor group includes SNAIL (SNAI1), SLUG (SNAI2), TWIST, ZEB1, and ZEB2 (9). SNAIL has a key role in EMT both during development and in tumor progression. Previous studies have demonstrated that SNAIL accelerates radiation-induced thyroid carcinoma development (10), and its expression is restricted at the invasive tumor front, showing EMT characteristics in thyroids cancers (11).
In addition, it has recently been shown that certain epithelial cancer cells that pass through EMT acquire cancer stem cell (CSC) properties (12,13). CSCs, or tumor initiating cells, are a small fraction of cancer cells with self-renewal and multipotency, and are important for cancer initiation and maintenance (14). Several attempts have been performed to identify thyroid CSCs using side population, CD133, and aldehyde dehydrogenase (ALDH) activities (15 –17). The most reliable marker for thyroid CSCs so far identified appears to be ALDH (17). However, it is not known if there is a link between EMT and CSCs in thyroid cancers, with an exception that Liu et al. have shown, by immunohistochemistry of two thyroid cancer tissues with co-existing DTC and ATC lesions, intense expression of a neural stem cell marker nestin, and loss of E-cadherin expression in ATC areas (18), although there is no definitive evidence for nestin being a thyroid CSC marker.
We therefore investigated the CSC properties of thyroid cancers that underwent EMT. Our results show that EMT seems to be associated with CSC properties in ALDH− human thyroid cancer cells.
Materials and Methods
Cell cultures
ACT-1 (19), FRO, KTC-2, and KTC-3 cell lines were originally established from human anaplastic thyroid cancer, and TPC1 cell line from human papillary thyroid cancer. All the cell lines except KTC-3 are in the list of authenticated unique thyroid cancer cell lines (20).
ACT-1 cells were cultured in Dulbecco's modified Eagle's medium (DMEM) supplemented with 10% fetal bovine serum (FBS) and penicillin/streptomycin (P/S). FRO, KTC-2, KTC-3, and TPC1 cells were cultured in RPMI1640 with 10% FBS and P/S. For TGF-β treatment, 5 ng/mL recombinant human TGF-β1 (PeproTech, Rocky Hill, NJ) was added to the culture medium every two to three days.
Flow cytometry and fluorescence-activated cell sorting
2×10⁶ cells were plated in 10 cm plates, and 24 hours later, the cell suspension was prepared in FACS buffer (PBS/2% FBS/1 mM EDTA). The cells were stained for 30 minutes at room temperature with anti-CD24-FITC, anti-CD44-PE (both from BD, Heidelberg, Germany), anti-CD133/1-PE (Miltenyi Biotech, Bergisch Gladbach, Germany), anti-CD166-PE, anti-CD90-PE, anti-c-Kit-PE, anti-SSEA-1-PE, anti-CD13-FITC, and anti-EpCAM-PE (eBiosciences, San Diego, CA). To test for ALDH1 activity, cells were stained with Aldefluor reagent (Aldagen, Durham, NC) according to the manufacturer's instructions. A specific ALDH inhibitor, diethylamino-benzaldehyde (DEAB), was used as negative control. Samples were analyzed and/or sorted on a FACS Vantage SE System flow cytometer and Cell Quest software (BD Biosciences, San Jose, CA).
Immunofluorescence
Cells were fixed in 100% methanol and then permeabilized with acetone for E-cadherin staining, or fixed in 10% formalin followed by permeabilization with 0.5% Triton-X for vimentin, Smad2/3, and SNAIL staining. The primary antibodies used were mouse Alexa-488 conjugated anti-E-cadherin (1:500; BD Biosciences), mouse anti-vimentin (1:100; Dako, Tokyo, Japan), rabbit anti-Smad2/3 (1:125; Cell Signaling, Danvers, MA), and rabbit anti-SNAIL (1:200, Cell Signaling).
Secondary antibodies used were goat anti-mouse or anti-rabbit coupled to Alexa-488 (Invitrogen, Carlsbad, CA, and Cell Signaling). Cell nuclei were visualized with DAPI (Sigma Aldrich, St. Louis, MO). Slides were mounted with Fluoromount (Diagnostic BioSystems, Pleasanton, CA).
Construction and transductions of retrovirus and lentivirus
To construct the retroviral vector, human SNAIL cDNA in the pCMV-SPORT6 vector (Origene, Rockville, MD) was digested with XhoI and blunt-ended and then digested with SalI, Released SNAIL cDNA was ligated into the XhoI and HpaI-digested pDON-5Neo (Takara, Otsu, Japan). The resultant vector pDON-SNAIL was transfected into the 293GPG packaging cell line (21) and virus-containing supernatants were collected every other day for six days.
A lentivirus coding for mutant BRAFV600E was previously described (22). Virus infection was done in the presence of 8 μg/mL polybrene. Bulks of transduced cells were obtained after antibiotic selections (G418 for retrovirus and blasticidin for lentivirus) were used (ACT-SNAIL and ACT-BRAFV600E). The untransduced, parental ACT-1 cells were used as controls.
Cell viability assays
Cells were plated in 96-well plates, incubated for 24 hours at 37°C, and treated with 50 μg/mL 5-FU (Kyowa Hakko Kogyo, Tokyo, Japan), 3 μg/mL doxorubicin (Nippon Kayaku, Tokyo, Japan), or 5 ng/mL paclitaxel (Nippon Kayaku) for indicated time points. Proliferation of cells was measured using a Cell Counting Kit-8 (Dojindo, Kumamoto, Japan) according to the manufacturer's protocol.
Western blot analysis
Cells were washed twice with ice-cold 1× PBS and detached with a scraper. The harvested cells were centrifuged at 3300 g for 1 minute. The pellet was dissolved in lysis buffer (20 mM Tris pH 7.5, 150 mM NaCl, 1 mM EDTA, 0.5% Triton X-100), sonicated, and centrifuged at 13,000 rpm for 10 minutes at 4°C. Protein concentrations were determined according to the method of Bradford (Protein Assay Kit; Bio-Rad, Richmond, CA). Equal amounts (30 μg) of proteins per sample were applied to a 7.5–15% SDS-polyacrylamide separating gel and transferred to a PVDF membrane. The membrane was blocked with 5% skim milk in 1× TBS for 1 hour and then immunoblotted with a primary antibody at room temperature for 1 hour. After extensive washing with 1× TBS with 0.05% Triton X-100, the membranes were incubated with a biotinylated secondary antibody at room temperature for 30 minutes and washed extensively with 1× TBS/0.05% Triton X-100. Detection of protein-antibody complexes was performed with streptavidin-horseradish peroxidase (Vectastain ABC kit; Vector Laboratories, Burlingame, CA) and 3,3′-diaminobenzidine/H2O2.
The primary antibodies used were rabbit anti-SNAIL (C15D3; 1:1000, Cell Signaling), mouse anti-phospho-ERK1/2 Thr202/Thr204 (E10; 1:2000 Cell Signaling), and mouse β-actin (C4, 1:1000, Santa Cruz Biotechnology, Santa Cruz, CA).
Cell migration assay
The Chemotaxicell Invasion Chamber (Kurabo, Osaka, Japan) was used according to the manufacturer's instructions. 2.5×10³ cells in serum-free medium were seeded on the interior of the inserts, and the culture medium containing 10% FBS and P/S was added to the lower wells as a chemoattractant. After incubation for the indicated time periods, the cells on the interior of the inserts were removed by swabbing, and the exteriors of the inserts were stained with 1% crystal violet (Wako, Osaka, Japan) in 10% ethanol. The cells that had penetrated through the filter were counted under bright-field microscopy.
Sphere-formation assay
The cells were sorted by FACS and seeded at 1000/well in Ultra Low Attachment 96-well microwell plates (Corning) in DMEM/Ham's F12 (1:1) supplemented with 20 ng/mL EGF (Invitrogen), 20 ng/mL basic FGF (Invitrogen), and 5% B27 (Life Technologies Japan, Tokyo, Japan). The numbers of spheres, with a diameter of 100 μm or more, were counted every week from week 4 to week 8.
In vivo tumor growth assay
Between 1×10³ and 2.5×10⁵ cells/100 μL PBS were injected subcutaneously into six-week-old nude mice (Charles River Japan, Shizuoka, Japan). Caliper measurements of tumor volume (length×width) were conducted every week. Tumor weight was calculated according to the formula: tumor weight (mg)=length (mm)×width (mm)/2. Animal care and all experimental procedures were performed in accordance with the Guideline for Animal Experimentation of Nagasaki University with approval of the Institutional Animal Care and Use Committee.
Statistical analysis
All data are expressed as mean±standard deviation or standard error of the mean. Differences between groups were examined for statistical significance using Student's t-test. Statistical significance was set at p<0.05.
Results
EMT status of human thyroid cancer cell lines
The first series of experiments was performed to investigate the EMT status in five human thyroid cancer cell lines (Fig. 1). ACT-1 cells showed a cobblestone-like shape and expressed an epithelial marker E-cadherin at cell–cell junctions but not a mesenchymal marker vimentin. On the other hand, TPC1, KTC-2, and KTC-3 cells showed a spindle-like shape and expressed vimentin but not E-cadherin. FRO cells contain both cobblestone- and spindle-like cells and expressed E-cadherin (both at cell-cell junctions and in the cytoplasm) and vimentin. These findings demonstrate that ACT-1 cells retain epithelial cell characteristics, TPC1, KTC-2, and KTC-3 have undergone EMT, and FRO cells are intermediate.

Morphology and E-cadherin/vimentin expression in five human thyroid cancer cell lines. Phase contrast images (left) and immunofluorescence images for E-cadherin (middle) and vimentin (right) expression in human thyroid cancer cell lines. Five thyroid cancer cell lines were immunostained with antibodies against E-cadherin and vimentin as described in the Materials and Methods section. Magnification: 100×.
Induction of EMT by TGF-β, BRAFV600E, and SNAIL
To induce EMT in ACT-1 cells, three approaches were employed. The first was exposure to TGF-β. Even after long-term culture with 5 ng/mL TGF-β (>2 weeks), ACT-1 cells remained E-cadherin–positive, and only a small fraction of the cells became vimentin-positive (Supplementary Fig. S1A; Supplementary Data are available online at
Expression of mutant BRAF (BRAFV600E) was used as the second approach because a previous study has shown BRAFV600E-induced EMT in a normal rat thyroid cell line, PCCL3, via TGF-β (23). It has also been reported that in several epithelial cell models, including thyroid cells, the RAF/ERK/MAPK pathway cooperates with TGF-β in the induction of EMT (7). As shown in Supplementary Figure S1A, ACT-1 cells transduced with lentivirus expressing BRAFV600E (ACT-BRAFV600E) remained E-cadherin–positive and vimentin-negative. However, vimentin expression was clearly visible in ACT-BRAFV600E cells treated with TGF-β for two weeks, although E-cadherin expression remained positive at cell–cell junctions. Thus, the effect of TGF-β on EMT induction was incomplete in ACT-1 and ACT-BRAFV600E cells.
The integrity of TGF-β signaling in ACT-BRAFV600E cells was confirmed by nuclear translocation of Smad2/3 following TGF-β stimulation (Supplementary Fig. S1B), and increased pERK expression confirmed enhanced signal transduction by BRAFV600E expression in ACT-BRAFV600E cells (Supplementary Fig. S1C).
The third approach was overexpression of an EMT-inducing transcription factor. Our preliminary studies with four thyroid cancer cell lines with an EMT phenotype (FRO, TPC1, KTC-2, and KTC-3), in which Western blot and RT-PCR demonstrated extremely low expression levels of SNAIL in FRO and of ZEB1 in FRO and KTC-2 cells (data not shown), did not help us choosing the appropriate transcription factor for EMT induction in thyroid cancer cells. However, as mentioned earlier, SNAIL expression was demonstrated at invasive fronts of thyroid cancer tissues with an EMT phenotype in immunohistochemistry (10,11). Thus, SNAIL was chosen for our study. SNAIL induction of EMT and CSC properties has been described in some other cancers, including breast and squamous-cell carcinomas (12,24). Transduction of retrovirus coding for SNAIL at a multiplicity of infection (MOI) of 1:1 only slightly induced vimentin expression but did not affect cell morphology or E-cadherin expression at the cell–cell junctions (Fig. 2A). In contrast, transduction at MOIs of 1:3 and 1:10, which induced higher SNAIL expression than that of a MOI of 1:1 (Fig. 2B), completely suppressed E-cadherin expression and induced a fibroblast-like cell morphology and vimentin expression (Fig. 2A). It should be noted here that although the degrees of morphological change and vimentin expression induced by TGF-β in ACT-BRAFV600E cells and those in ACT-SNAIL cells (MOI of 1:3) were similar, complete loss of E-cadherin expression was observed only in ACT-SNAIL cells (MOI of 1:3).
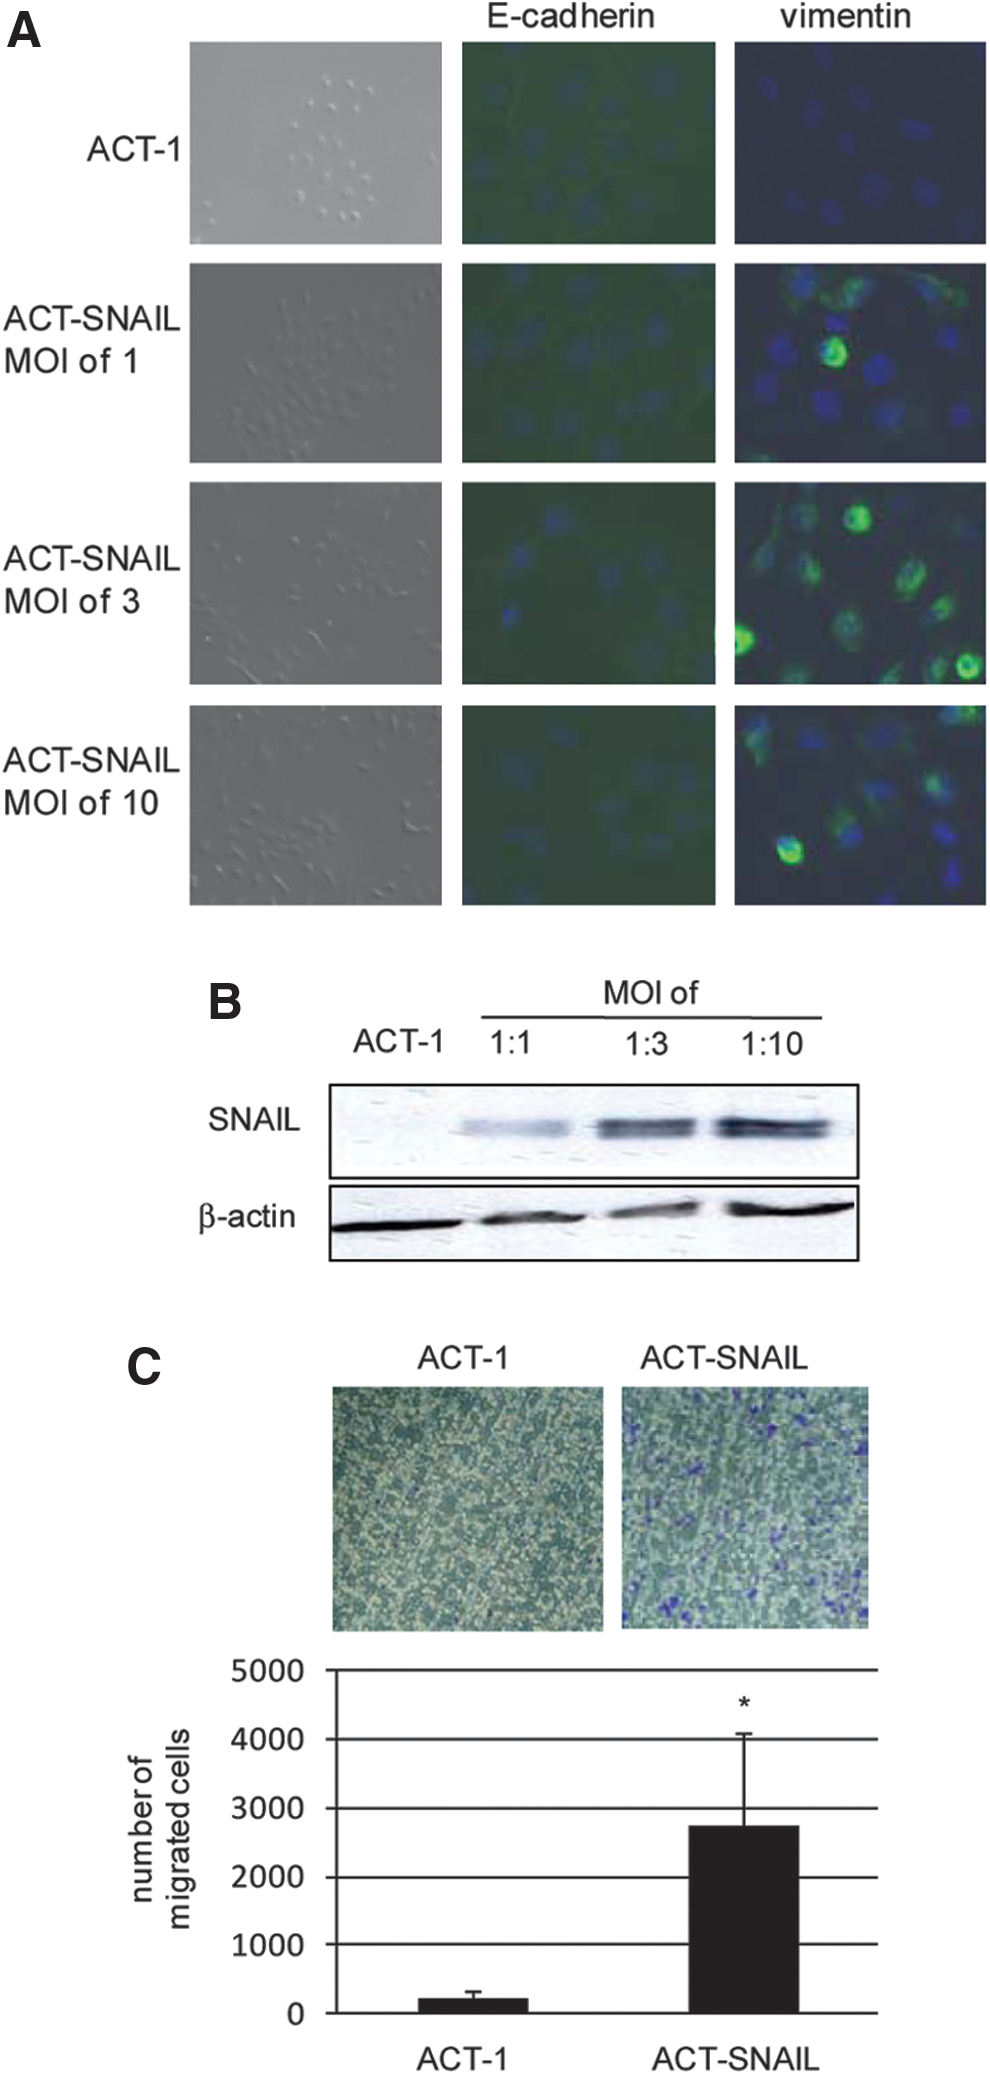
Induction of epithelial-to-mesenchymal transition (EMT) by SNAIL.
Altogether, overexpression of SNAIL obtained by retrovirus transduction at MOIs of 1:3 or more induced an EMT phenotype in ACT-1 cells most efficiently. We therefore used ACT-SNAIL cells (MOI of 1:3; hereafter called ACT-SNAIL cells) for further investigations. These cells showed a higher migration ability—an EMT characteristic—than ACT-1 cells (Fig. 2C).
Characterization of CSC phenotypes in ACT-SNAIL cells
ACT-SNAIL cells showed reduced (but not significantly different) in vitro proliferation (doubling time 24.2 hours in ACT-1 vs. 28.5 hours in ACT-SNAIL cells) in an in vitro proliferation assay (Fig. 3A). Subcutaneous injection of high numbers of ACT-SNAIL cells (1×10⁵) into nude mice readily induced tumors with a growth rate being similar to that in ACT-1 cells (Fig. 3B).
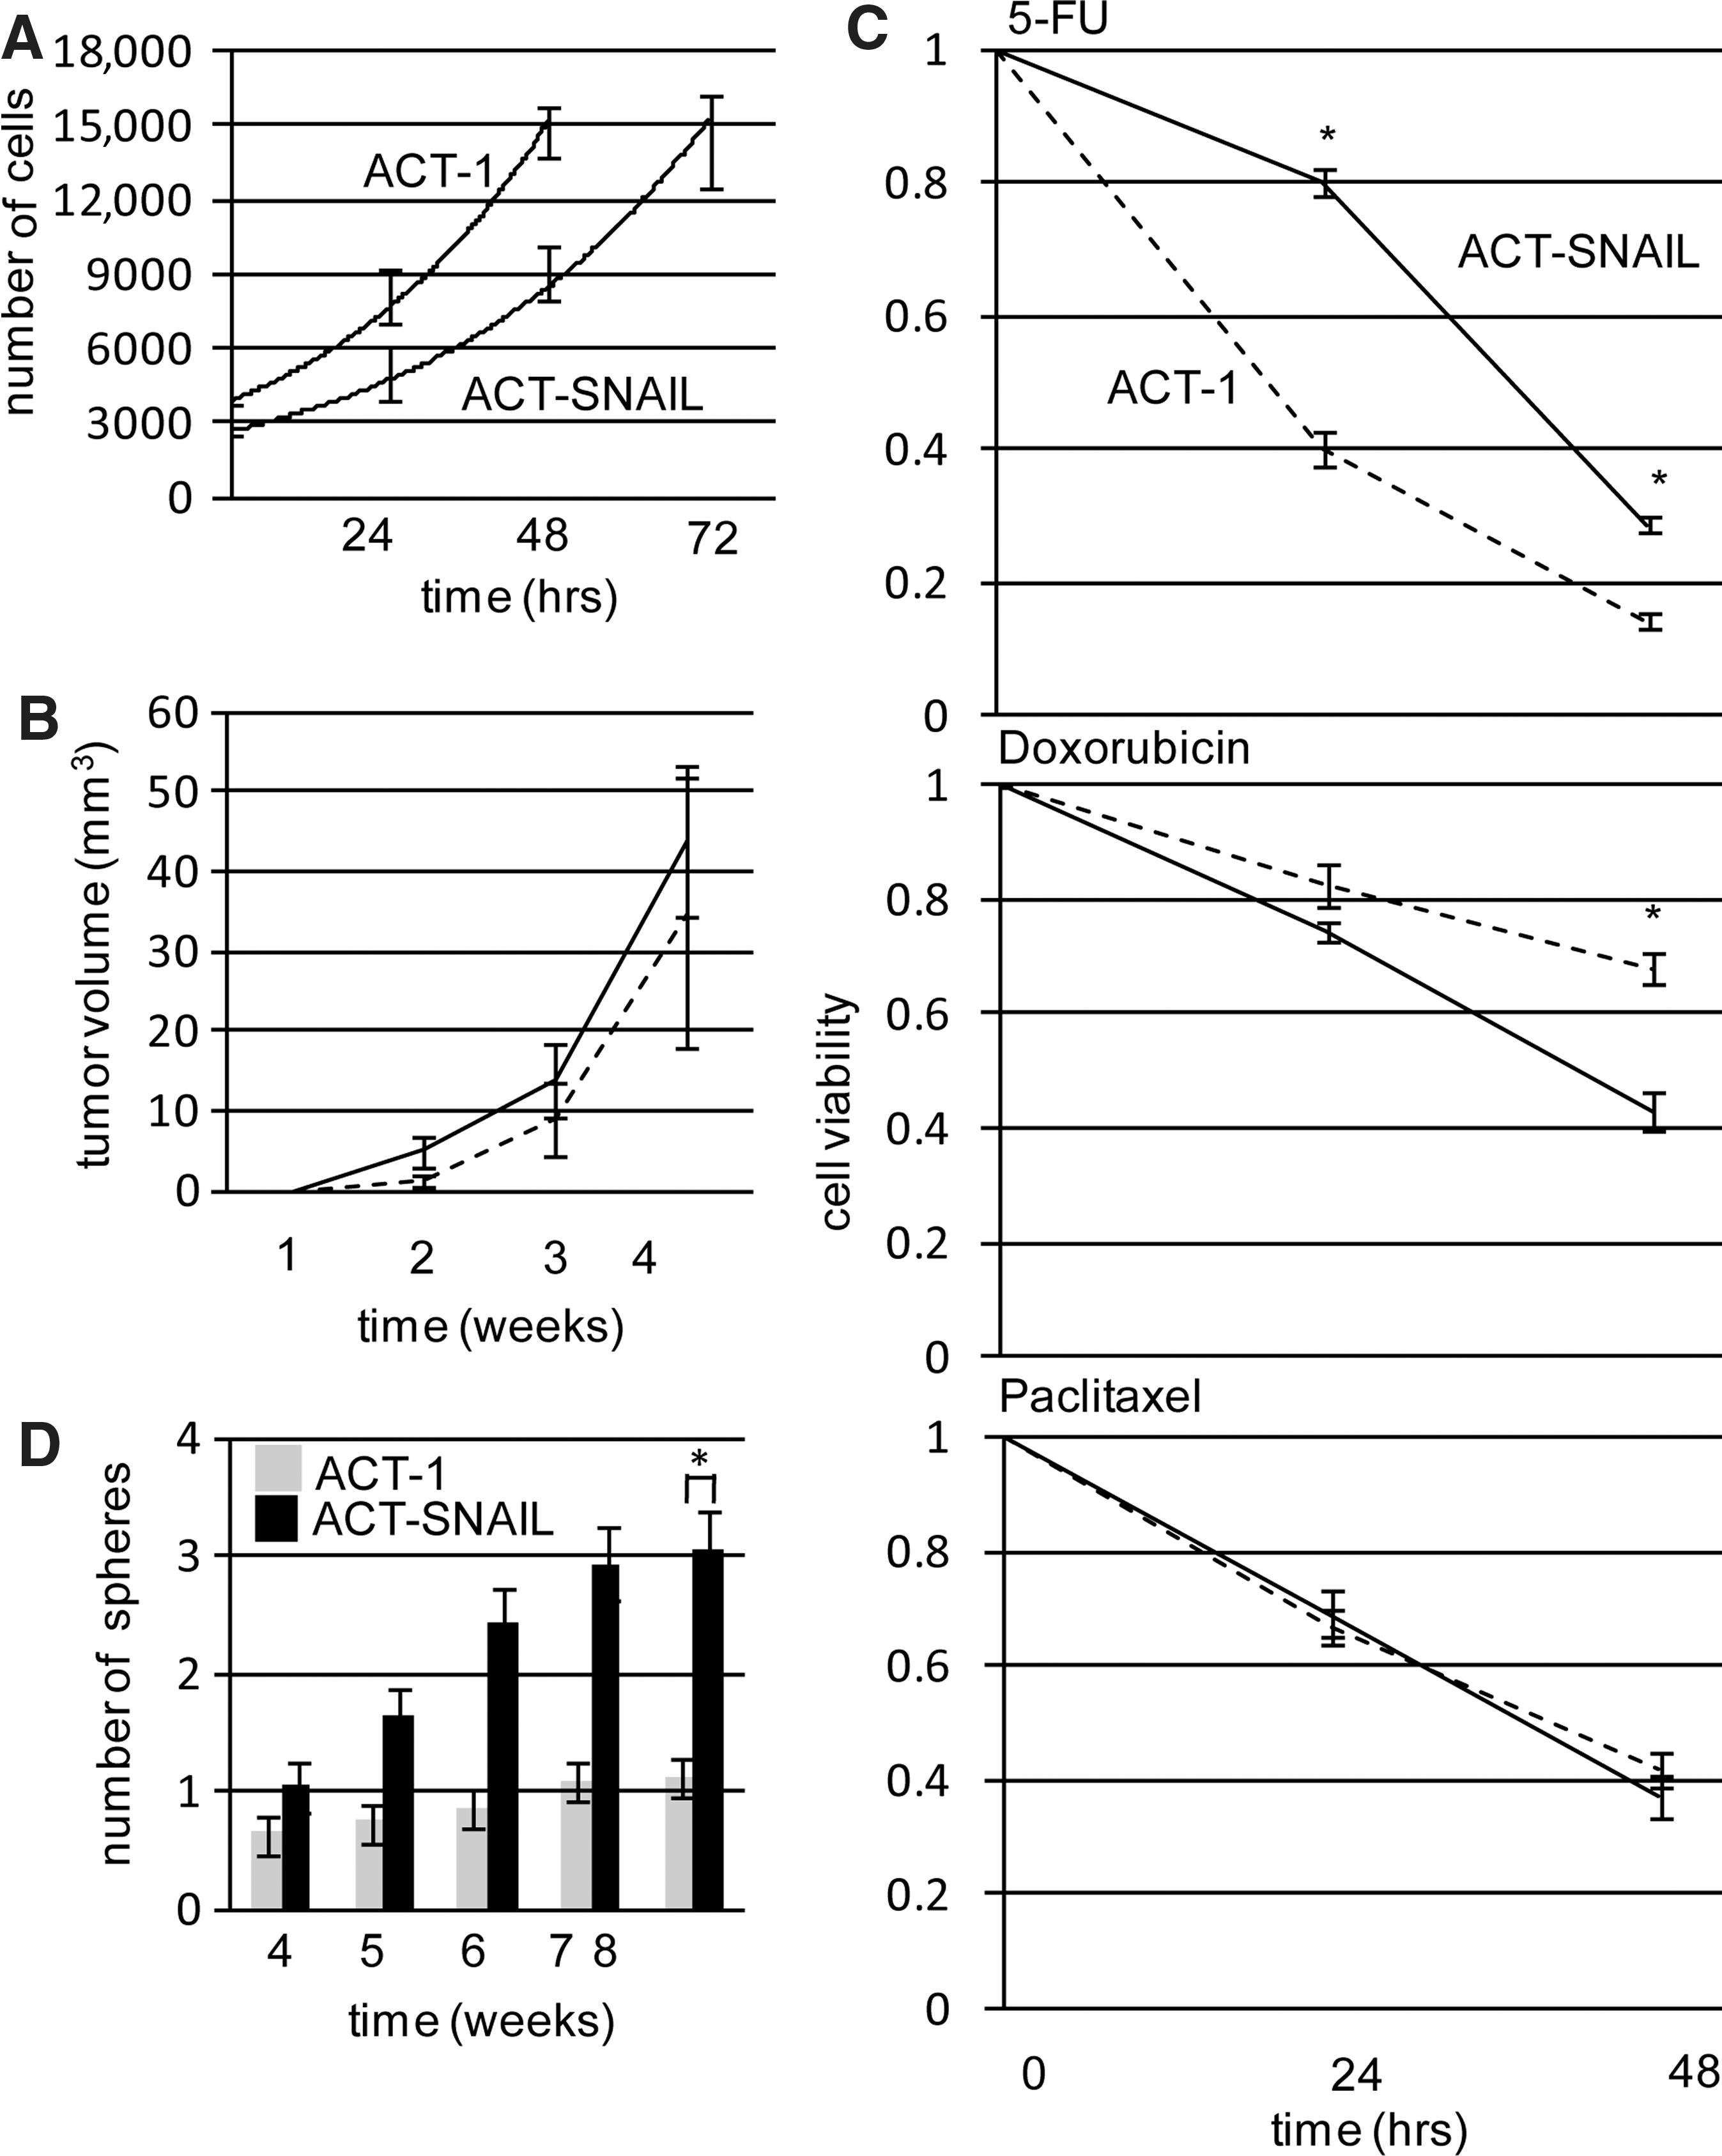
In vitro and in vivo cell growth, chemosensitivity, and sphere formation in ACT-1 and ACT-SNAIL cells. In vitro cell proliferation
Chemosensitivity of ACT-SNAIL cells was variable, that is, the cells were more resistant to 5-FU but more sensitive to doxorubicin, as compared to ACT-1 cells (Fig. 3C).
The tumor-initiating ability, estimated by an in vitro sphere-formation assay, showed that ACT-SNAIL cells formed approximately 3-fold more spheres relative to ACT-1 cells (p<0.05), although the data were variable (Fig. 3D). However, in in vivo tumor formation assay, the frequency of tumor formation was not significantly different between ACT-1 and ACT-SNAIL cells following subcutaneous injection of different numbers of ACT-1 and ACT-SNAIL cells into nude mice (Table 1). It should be noted here that, although there is an apparent discrepancy between in vitro sphere-formation and in vivo tumor-formation assays, it seems difficult to reproduce such a small (approximately 3-fold) difference detected in an in vitro sphere-formation assay with an in vivo tumor-formation assay.
Numbers of tumors developed per numbers of tumor cell–injected sites.
The cell surface antigens and intracellular ALDH activities, well-known candidate markers for CSCs, were then compared by flow cytometry between ACT-1 and ACT-SNAIL cells. In the cell surface antigen analysis, SNAIL expression decreased expression of EpCAM and to a lesser extent CD24 (Fig. 4A). However, sphere-forming abilities were very similar between EpCAMhigh and EpCAMlow ACT-1, and EpCAMhigh and EpCAMlow ACT- SNAIL cells (Fig. 4C). In the ALDH assay, 23.4% parental ACT-1 cells were ALDH+ (Fig. 4B, left), which possessed much higher ability to form spheres than ALDH− ACT-1 cells (Fig. 4D). On the other hand, in ACT-SNAIL cells, the percentage of ALDH+ cells decreased (5.2%), and ALDH- cells conversely showed the significantly higher sphere-forming ability than ALDH+ cells. In particular, in vitro sphere-forming ability of ALDH− ACT-SNAIL cells was ∼10 times (6–14 times) as high as that of ALDH− ACT-1 cells, while those of ALDH+ ACT-SNAIL and ACT-1 cells were not different. It should be noted here that the EMT status and SNAIL expression levels were not different between ALDH+ and ALDH- cells (Supplementary Fig. S2). Therefore, we would like to interpret these data as meaning that EMT induced by SNAIL confers CSC properties to ALDH− cells but not to ALDH+ cells, which already have CSC properties.
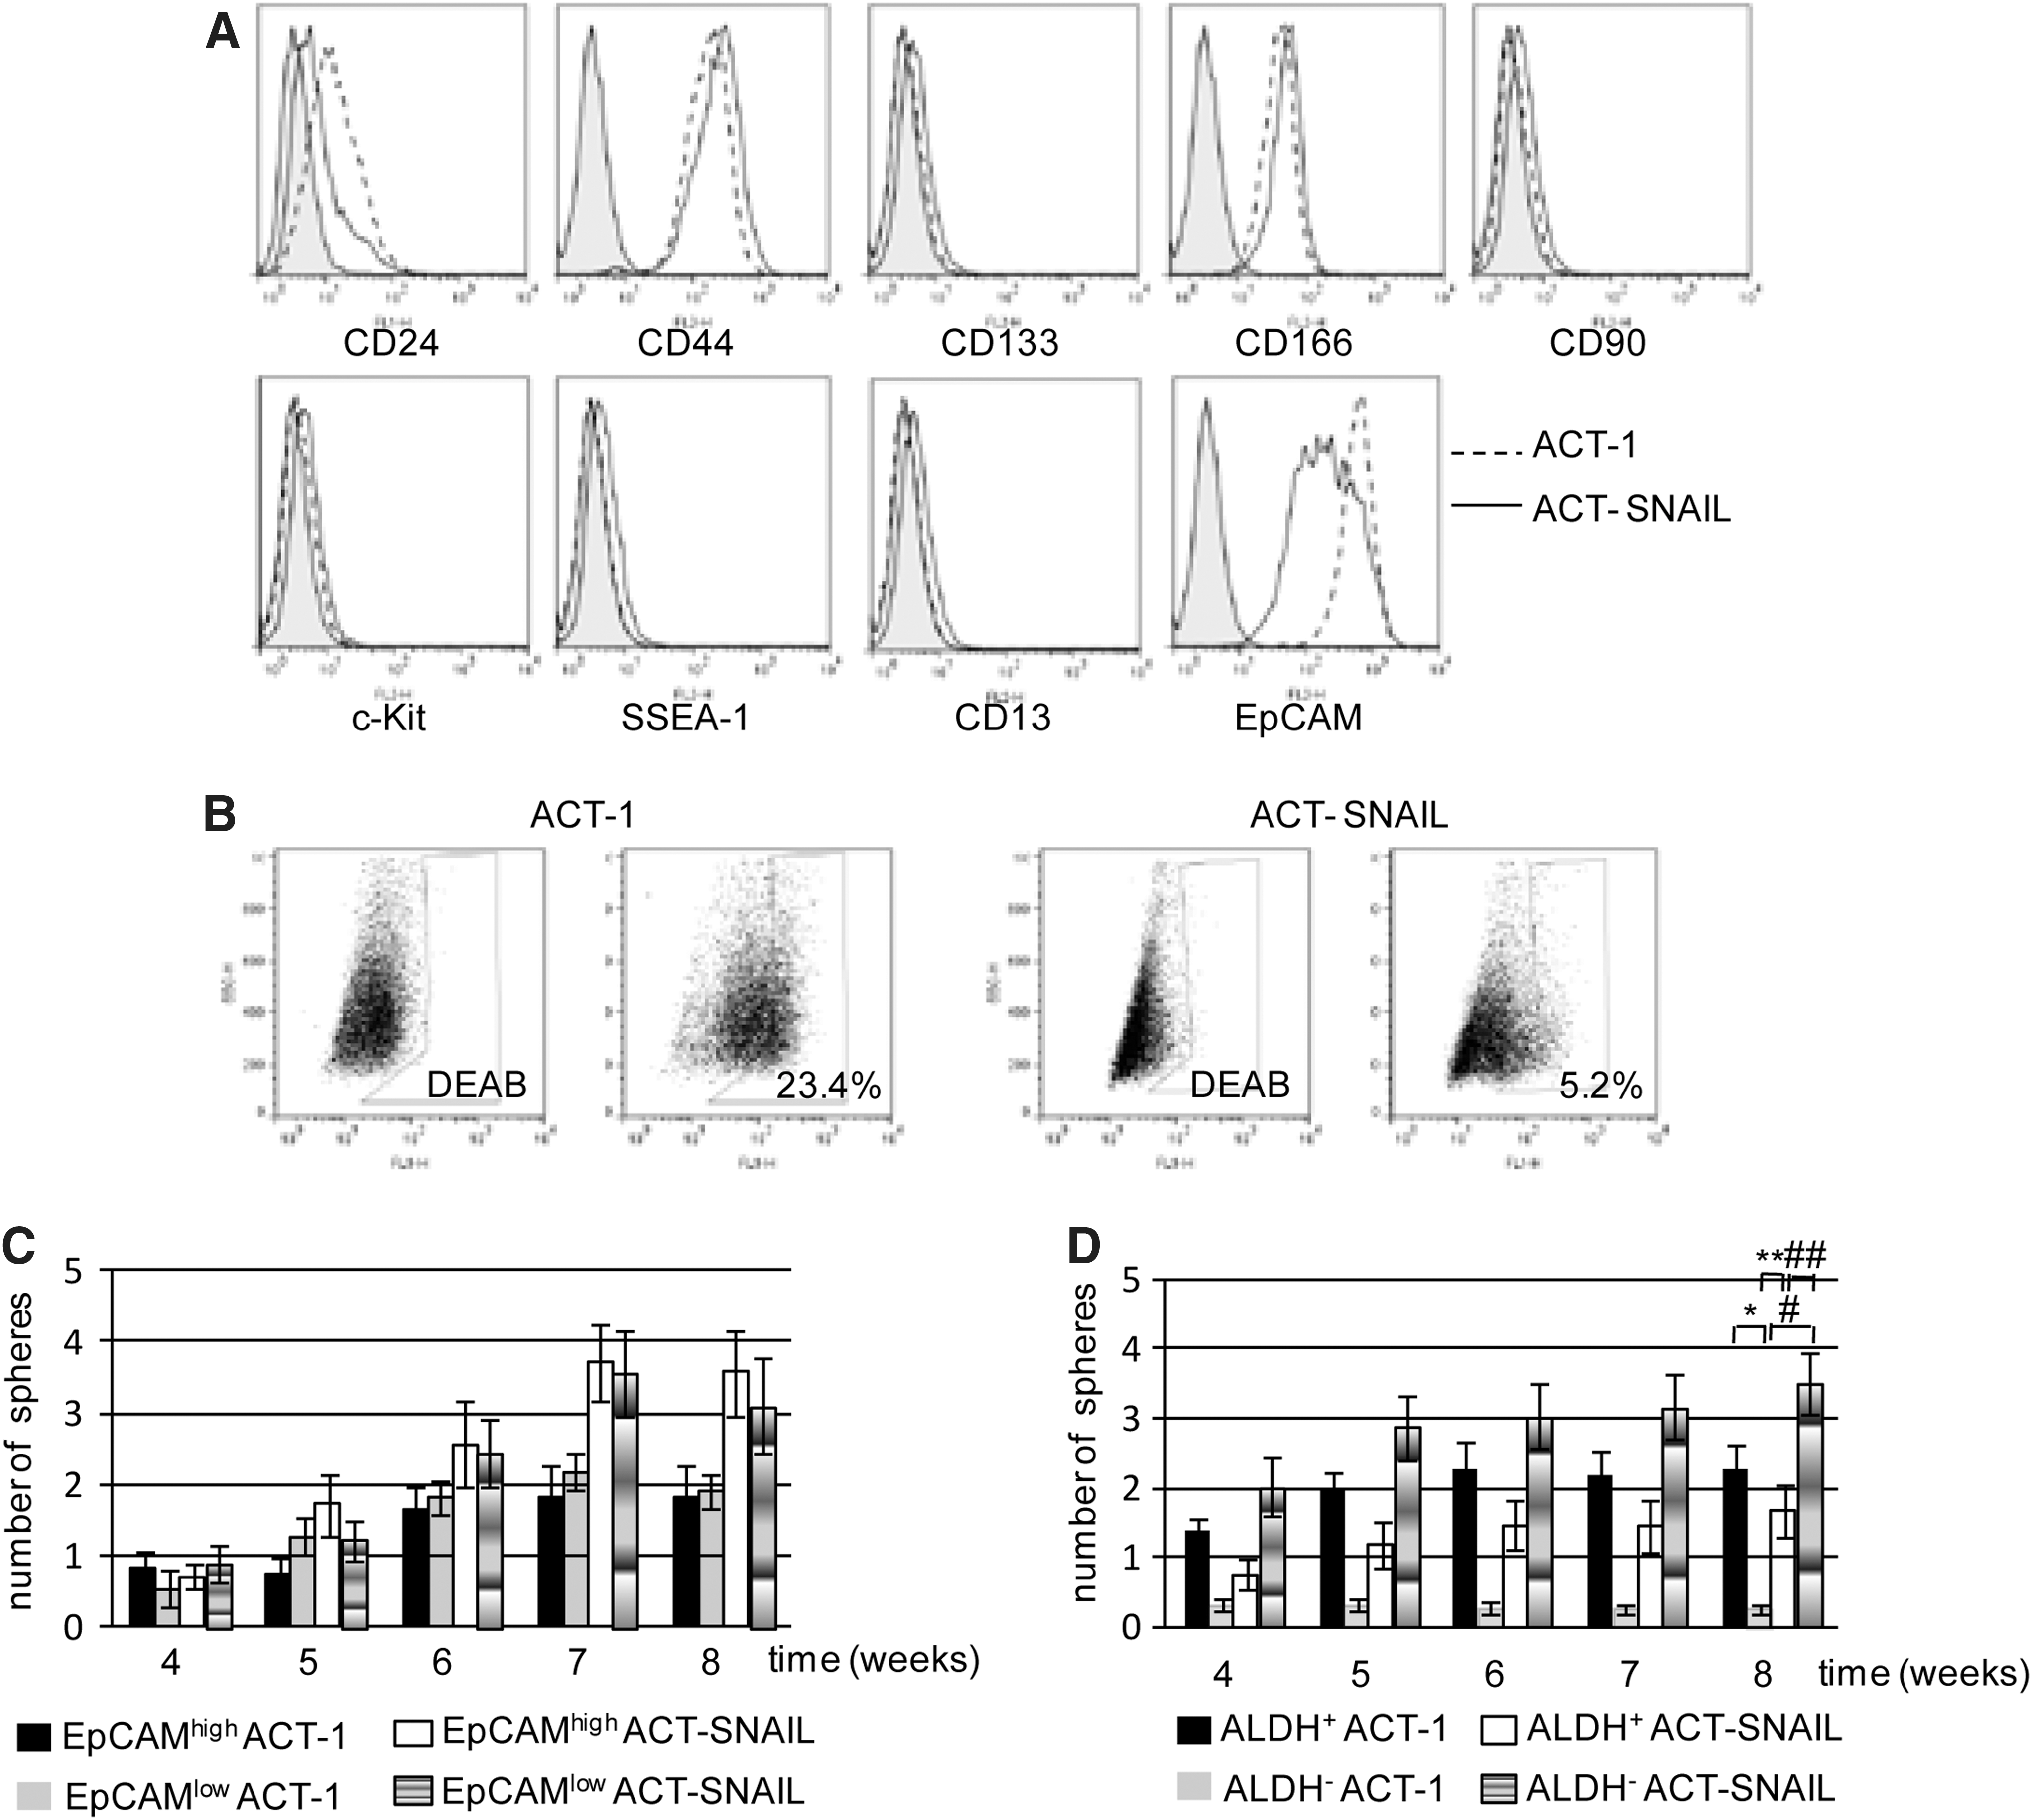
Comparisons of cell surface markers and aldehyde dehydrogenase (ALDH) activities between ACT-1 and ACT-SNAIL cells
Discussion
In the present studies, a link between EMT and CSC properties was evaluated in thyroid cancer cell lines. We first found that, among five thyroid cancer cell lines we examined, only ACT-1 cells showed an epithelial phenotype. However, three cell lines—ACT-1, FRO, and KTC-3 cells—were tumorigenic in nude mice and capable of forming nonadherent colonies in an in vitro sphere assay (Fig. 3; Shimamura et al., unpublished data), indicating that all three cell lines with different phenotypes (ACT-1 with an epithelial phenotype, FRO with a mixed phenotype, and KTC-3 with a mesenchymal phenotype) contain CSCs. Next, we demonstrated clear induction of the typical features of EMT, only a slight increase in in vitro sphere-forming (not in vivo tumor-forming) abilities, and no alteration in chemosensitivity by exogenous SNAIL expression in ACT-1 cells. Given that the sphere-forming ability was drastically changed in ALDH- cells but not in ALDH+ cells and that the EMT status was not different between ALDH+ cells and ALDH- cells, a connection between EMT and CSCs seemed to be restricted to ALDH− cells. Although (a) the outcome of suppression of endogenous SNAIL expression cannot be studied in FRO or KTC-3 cells because of their extremely low expression levels of SNAIL and (b) the consequence of SNAIL-induced EMT on CSC properties can only be examined in ACT-1 cells because this is the only cell line with an epithelial phenotype, all the above data suggest that EMT is linked to CSC properties in ALDH- ACT-1 thyroid cancer cells.
Expression of E-cadherin, a tumor suppressor (25), has originally been used as a differentiation and prognostic marker of thyroid cancer (26,27), and has later been studied in the context of EMT (28 –30). Thus, decreased expression of E-cadherin and/or elevated expression of vimentin in the tissues of ATC compared with DTC and normal tissues have been demonstrated. Therefore, EMT or loss of E-cadherin expression is likely to be related to progression of DTC to ATC (31) rather than a CSC phenotype in the thyroid cancers. Indeed, development of ATC is believed to result largely from the sequential and progressive accumulation of genetic abnormalities—that is, occurrence of p53 mutations mainly in BRAFV600E-harboring DTC—and p53 is reported to regulate EMT (32,33). The characteristics of ATC are also similar to CSCs: for example, high invasive and metastatic potentials and resistance to chemotherapy. Similar data have also been shown in thyroid-specific BRAFV600E transgenic mice, illustrating that EMT is involved in the progression of DTC to PDTC (34).
Little to no effect of TGF-β and/or BRAFV600E on EMT induction contrasts to the previous reports linking these molecules with EMT (23,34). Although nuclear translocation of SMAD 2/3 was clearly observed following TGF-β stimulation, TGF-β transduces the intracellular signal via canonical SMAD-dependent and alternative SMAD-independent pathways. Thus, it is possible that there might be an unknown abnormality in other molecules in the TGF-β signaling pathway in ACT-1 cells. Furthermore, since ACT-1 cells have an NRAS mutation (35), interaction of BRAF and mutant NRAS signaling, as previously reported (36), cannot be excluded.
Little expression of SNAIL in thyroid cancer cells with a mesenchymal phenotype (FRO, TPC1, KTC-2, and KTC-3) was somewhat unexpected because of previous reports showing SNAIL expression in thyroid cancer tissues, particularly at their invasive fronts with an EMT phenotype (10,11). However, in addition to SNAIL, other EMT-inducing transcription factors have also been reported to be expressed in thyroid cancers (37), and a recent study has also demonstrated involvement of microRNAs in EMT (28). These molecules may play a role in the EMT status of these cell lines.
Accordingly, expression levels of well-known CSC candidate markers were very similar between the parental ACT-1 and ACT-SNAIL cells, except EpCAM and ALDH. Altered EpCAM expression levels did not affect the efficiency of sphere formation. The decreased expression of EpCAM by SNAIL may be attributed to either suppression of EpCAM gene expression or cleavage (shedding) of EpCAM at the cell surface, as previously reported (38,39). In contrast, the positivity rate and functional property of ALDH was drastically changed by SNAIL expression. Thus, numbers of ALDH+ cells decreased while ALDH− cells gained greater sphere-forming ability than ALDH+ cells. Given that expression of SNAIL is restricted at the invasive fronts of thyroid cancers with an EMT phenotype (11), the role for ALDH in CSC properties may be dependent on the EMT status, that is, ALDH may be a good CSC candidate marker in the non-EMT area but not in the EMT area, although ALDH has recently been reported to be a CSC marker in thyroid cancers (or able to enrich CSCs) (17). Of interest, Biddle et al. have recently demonstrated unidirectional conversion of EMT+ ALDH+ squamous CSCs to EMT+ ALDH- squamous-cell CSCs, although its functional significance remained obscure (40).
In conclusion, in the present studies, we show an association between EMT and CSC properties in ALDH− thyroid cancer cells. Furthermore, our results showing the loss of the ability of ALDH to enrich CSCs in ACT-SNAIL cells suggest that EMT may influence the usefulness of ALDH as a CSC marker. Further studies are necessary to clarify the relationship between EMT, CSCs, and ALDH in thyroid cancer.
Footnotes
Acknowledgement
We thank Dr. Naoyoshi Onoda (Osaka City University Graduate School of Medicine, Osaka, Japan) for providing ACT-1 cells, which were originally established by Dr. Seiji Ohata (Tokushima University, Tokushima, Japan).
Author Disclosure Statement
The authors declare that no competing financial interests exist.