
Abstract
Background:
Anaplastic thyroid carcinoma (ATC) is a rare and aggressive endocrine tumor with highly undifferentiated morphology. It has been suggested that cancer stem cells (CSCs) might play a central role in ATC. The objectives of this study were (i) to characterize CSCs from ex vivo ATC specimens by investigating the expression of several pluripotent stem cell markers, and (ii) to evaluate in vitro drug resistance modifications after specific CSC transcription factor switch-off.
Methods:
In ex vivo experiments, eight formalin-fixed, paraffin-embedded ATC specimens were analyzed by reverse-transcription and real-time quantitative PCR and immunohistochemistry. In in vitro experiments using ATC SW1736 cells, the expression levels of OCT-4, NANOG, and ABCG2 and the sensitivity to either cisplatin or doxorubicin were evaluated after silencing.
Results:
OCT-4, KLF4, and SOX2 transcription factors and C-KIT and THY-1 stem surface antigens showed variable up-regulation in all ATC cases. The SW1736 cell line was characterized by a high percentage of stem population (10.4±2.1% of cells were aldehyde dehydrogenase positive) and high expression of several CSC markers (SOX2, OCT4, NANOG, C-MYC, and SSEA4). SOX2 silencing down-regulated OCT-4, NANOG, and ABCG2. SOX2 silencing sensitized SW1736 cells, causing a significant cell death increase (1.8-fold) in comparison to control cells with 10 μM cisplatin (93.9±3.4% vs. 52.6±9.4%, p<0.01) and 2.7 fold with 0.5 μM doxorubicin (45.8±9.9% vs. 17.1±3.4% p<0.01). ABCG2 silencing caused increased cell death with both cisplatin (74.9±1.4%) and doxorubicin treatment (74.1±0.1%) vs. no-target–treated cells (respectively, 45.8±1.0% and 48.6±1.0%, p<0.001).
Conclusions
Introduction
Adult stem cells have been identified in normal human thyroid glands (2). A link between stem and cancer cells has been claimed for tumors supposedly deriving from immature progenitors/stem cells or from formerly normal cells that have acquired stem-like properties (3). So far, cancer stem cells (CSCs) have been isolated based on the expression of specific surface molecules (4 –8), which have been associated with aggressive and metastatic behavior and not with “stemness” per se. Regarding ATC, it has been hypothesized that the tumor initiates from the remnants of fetal thyroid cells, rather than from adult thyrocytes undergoing a multistep carcinogenesis model (9). Unfortunately, the relative rarity and rapidly fatal nature of ATC has limited functional studies on ex vivo tissues. Here we describe the expression of a panel of CSC markers in ATC specimens and in ATC cell line SW1736, a well-validated ATC cell line (10), by analyzing surface and nuclear transcription factors, the latter implicated in self-renewal and maintenance of CSC pluripotency, as well as aldehyde dehydrogenase activity (ALDH) (11). Moreover, the role of these markers in drug sensitivity was assessed in the SW1736 cell line.
Methods
Specimens
This study was approved by the Institutional Review Board at the Faculty of Medicine of the University of Palermo. At the time of surgery, all patients signed an informed consent for the scientific use of their data (12).
Eight archival formalin-fixed, paraffin-embedded ATC tissue specimens were used for this study. Diagnosis of ATC was performed by two independent pathologists according to the current classification (13). Normal thyroid tissues from 12 cases contralateral to the lobe with papillary thyroid tumor (less than 1 cm) were used as control samples.
Immunohistochemistry
Five-micrometer sections were analyzed for the expression of SSEA4 and SOX2. Briefly, for SSEA4, tissue sections were deparaffinized, rehydrated, and microwave-heated in 10 mM sodium citrate buffer for antigen retrieval. Sections were then incubated with 3% hydrogen peroxide in phosphate-buffered saline (PBS) for 5 minutes, and blocked with 3% bovine serum albumin (BSA) in PBS. Incubation with mouse and mouse anti-human SSEA4 (IgG3, clone 813-70, Santa Cruz Biotechnology, Santa Cruz, CA) was performed at room temperature for 1 hour. Expression was detected with secondary biotinylated antibodies, streptavidin/horseradish peroxidase and chromogen 3-amino-9-ethylcarbazole substrate. For SOX2, the semi-automated Ventana system was used according to the manufacturer's instructions (BenchMark XT, Ventana Medical Systems, Inc., Tucson, AZ), antigens were unmasked in CC1 (Ventana Medical Systems, Inc.) for 90 minutes, and sections were incubated with rabbit antihuman SOX2 (Poly6308, BioLegend, San Diego, CA) at 37°C for 1 hour. Expression was detected with the DAB ultraView Universal detection kit (Ventana Medical Systems, Inc.). Slides were counterstained with hematoxylin and eosin and blueing reagent according to the manufacturer's instructions. The number of SSEA4+ and SOX2+ cells was assessed in light microscopy. For each case, a minimum of 103 cells was counted in three randomly collected sections, and the percentage of positive cells was regarded as the labeling index (LI).
Reverse-transcription PCR and real-time quantitative PCR
Total RNA was extracted from 10 μm sections using High Pure RNA Paraffin Kit (Roche Diagnostics GmbH, Mannheim, Germany) or from cultured SW1736 cells using the RNeasy Mini Kit (Qiagen, Milan, Italy), including a digestion step with DNase I. RNA quantity and quality were assessed by UV spectrophotometry. The RNA extracted was reverse-transcribed with Random Hexamers (Applied Biosystems, Darmstadt, Germany) and Improm II Reverse Transcriptase (Promega Italia, Milan, Italy), according to the manufacturer's protocol. Thyroglobulin (TG), thyroperoxidase (TPO), sodium/iodide symporter (NIS), and oncofetal fibronectin (onfFN) were analyzed with reverse-transcription (RT)-PCR as previously described (14). Briefly, primer pair sequences, cDNA fragment sizes and annealing temperatures were as follows: TG (762 bp), 5′-CTT CGA GTA CCA GGT TGA TGC C-3′ and 5′-GGT GGT TTC AGT GAA GGT GGA A-3′ (55°C); TPO (593 bp), 5′-TGT GTC CAA CGT GTT CTC CAC AG-3′ and 5′-AAG ACG TGG CTG TTC TCC CAC-3′ (55°C); NIS (179 bp), 5′-CTA TGG CCT CAA GTT CCT CT-3′ and 5′-TCG TGG CTA CAA TGT ACT GC-3′ (57°C); and onfFN (215 bp), 5′-TCT TCA TGG ACC AGA GAT CT-3′ and 5′-TAT GGT CTT GGC TAT GCC T-3′ (55°C). KLF4, SOX2, OCT-4, C-MYC, C-KIT, THY-1, PAX-8, ABCG2, and TTF-1 expression was analyzed by real-time quantitative PCR (qRT-PCR) using Quantitect SYBR Green PCR kit (Qiagen, Milan, Italy). PCR primers and probes were also purchased from Qiagen. All reactions were performed using a LightCycler 1.5 Instrument (Roche Diagnostics GmbH). Gene expression was normalized against the housekeeping gene β-actin, which was stable among all the samples (For: 5′-GGA CTT CGA GCA AGA GAT GG-3′, and Rev: 5′-AGC ACT GTG TTG GCG TAC AG-3′).
Cell cultures
The SW1736 cell line was cultured in Dulbecco's modified Eagle's medium high glucose medium supplemented with 10% fetal bovine serum and 5% glutamine. Cultures were maintained in 5% carbon dioxide at 37°C in a humidified incubator.
Immunocytochemistry
SW1736 cells were plated in chamber slides (Lab-Tek, Nunc, Inc., Naperville, IL), allowed to attach for 24 hours and then used for immunocytochemistry. Cells were fixed in 2% paraformaldehyde in PBS for 20 minutes at room temperature, then washed twice in PBS, blocked with 5% BSA and permeabilized for 10 minutes at room temperature with a blocking solution containing 0.1% saponin. Cells were incubated with rabbit anti-human SOX2 (Poly6308, BioLegend, San Diego, CA) and/or mouse anti-human SSEA4 (IgG3, clone 813-70, Santa Cruz Biotechnology) in blocking solution containing saponin overnight at 4°C and subsequently rinsed again with blocking solution plus saponin. The secondary antibodies used were AF594 goat anti-rabbit IgG, AF488 goat anti-mouse IgG3 (Invitrogen, Carlsbad, CA). Cells were counterstained with 4′,6-diamidino-2-phenylindole (DAPI) 0.5 μg/mL (Sigma-Aldrich, St. Louis, MO).
Flow cytometry
The identification of ALDH+ cells was performed using the ALDEFLUOR kit (StemCell Technologies, Voden Milan, Italy). In accordance with manufacturing procedures, as a negative control, an aliquot of cells from each sample was treated with 50 mmol/L of diethylaminobenzaldehyde, a specific ALDH inhibitor, and intracellular fluorescent product was measured by flow cytometry (FACSCalibur, BectonDickinson, San Jose, CA).
Confocal and two-photon microscopy
Fluorescence images were acquired in 1024×1024 format in three channels by means of a Leica TCS SP5 inverted Laser Scanning Confocal Microscope using an HCX PL APO CS 63.0×1 oil objective NA=1.4 (Leica Microsystems, Leica, Wetzlar, Germany); the pinhole size was 80 μm. Images were sequentially acquired using a scanning frequency of 400 Hz.
Alexa 488 dye was excited using the 488 nm line of an Argon laser and fluorescence signal was acquired in the range 500–550 nm (green channel). DAPI and Alexa 594 dye were excited using a pulsed infrared laser source: “Mai Tai” (Spectra-Physics Santa Clara, CA) tuned at 760 nm with two-photon excitation. The emission spectral ranges were set to 390–460 nm for DAPI (blue channel) and 600–670 nm for Alexa 594 (red channel).
siRNA transfection
siRNAs transfection in SW1736 cells was performed using INTERFERin™ transfection agent (Polyplus-Transfection, Illkirch, France), according to the manufacturer's instructions. Briefly, cells were seeded into six-well plates at a density of 250,000 cells/well or 96-well plates at a density of 3000 cells/well. The transfection agent and the siRNA complex were added to the cells and incubated for 72 hours for mRNA analysis and 96 hours for protein detection. The final concentration of SOX2 siRNA was 100 nM for mRNA analysis and 150 nM for protein detection and 40 nM for OCT-4 and ABCG2 siRNA. Each assay was performed in triplicate in at least three independent experiments. SOX2 was silenced using Stealth SiRNA SOX2 HSS144045 (Invitrogen, Milan, Italy). siCONTROL Stealth siRNA Negative Control was used as a control (Invitrogen, Milan). OCT-4 and ABCG2 were silenced by Oct-3/4 and ABCG2 siRNA (h) (Santa Cruz Biotechnology), and control siRNAs were used as a no-target control (Santa Cruz Biotechnology).
Cytotoxicity
SW1736 cells were plated in 96-well plates in a 100 μL medium/well containing 100 nM of SOX2 siRNA or ABCG2 siRNA (h) or siCONTROL or 0.5 μL of INTERFERinTM alone. After 24 hours the medium was refreshed and the cells were cultured with 0.5, 1.5, or 10 μM cisplatin (Pharma, Leobendorf Kundl, Austria) or 0.5, 1, or 1.5 μM doxorubicin (Ebewe Pharma, Leobendorf Kundl, Austria) up to 48 hours. Cell proliferation was assessed by a colorimetric assay using 3-(4,5-dimethylthiazol-2-yl)-2,5-diphenyltetrazolium bromide (MTT; Sigma-Aldrich). Absorbance was read at 550 nm in a MultiskanFC microplate reader (Thermo Fisher Scientific, Milan, Italy).
Protein extraction and Western blot analysis
Proteins were extracted from cultured cells using RadioImmunoPrecipitation Assay (RIPA) buffer (50 mM Tris-HCl, pH 7.4, 150 mM NaCl, 1% Nonidet P40), supplemented with a protease inhibitor cocktail (Complete mini, Roche Diagnostics GmbH) and phosphatase inhibitors. Protein content was determined according to Bradford's method. Proteins were separated by NuPAGE® 4-12% Bis-Tris Gel (Invitrogen, Milan), electrotransferred to nitrocellulose membrane, and blotted with the following primary antibodies: rabbit antihuman SOX2 (Poly6308, BioLegend, San Diego, CA), mouse antihuman Oct-4 (sc-5279, Santa Cruz Biotechnology), goat antihuman Nanog (sc-30331, Santa Cruz Biotechnology), mouse antihuman ABCG2 (sc-58222 Santa Cruz Biotechnology), rabbit antihuman Akt1/2/3 (sc-8312 Santa Cruz Biotechnology), rabbit antihuman p-Akt1/2/3 (sc-293095 Santa Cruz Biotechnology), and mouse anti β-actin IgG1 (A5441, Sigma-Aldrich). Secondary antibodies were goat anti-rabbit IgG-HRP (sc-2030, Santa Cruz Biotechnology), goat anti-mouse IgG-HRP (sc-2031, Santa Cruz Biotechnology), and donkey anti-goat IgG-HRP (sc-2033, Santa Cruz Biotechnology). Antigen–antibody complexes were visualized using the SuperSignal West Femto Maximum Sensitivity Substrate (Thermo Fisher Scientific) on a CCD camera (Chemidoc, Bio-Rad, Milan, Italy). Western blot bands were quantified with ImageJ software (National Institutes of Health, Bethesda, MD).
Statistical analysis
Statistical analysis (t-test, two-tailed, with confidence interval at 95%) was performed with GraphPad Prism 5 software for Windows (GraphPad Software, Inc., La Jolla, CA).
Results
ATC is a highly undifferentiated tumor
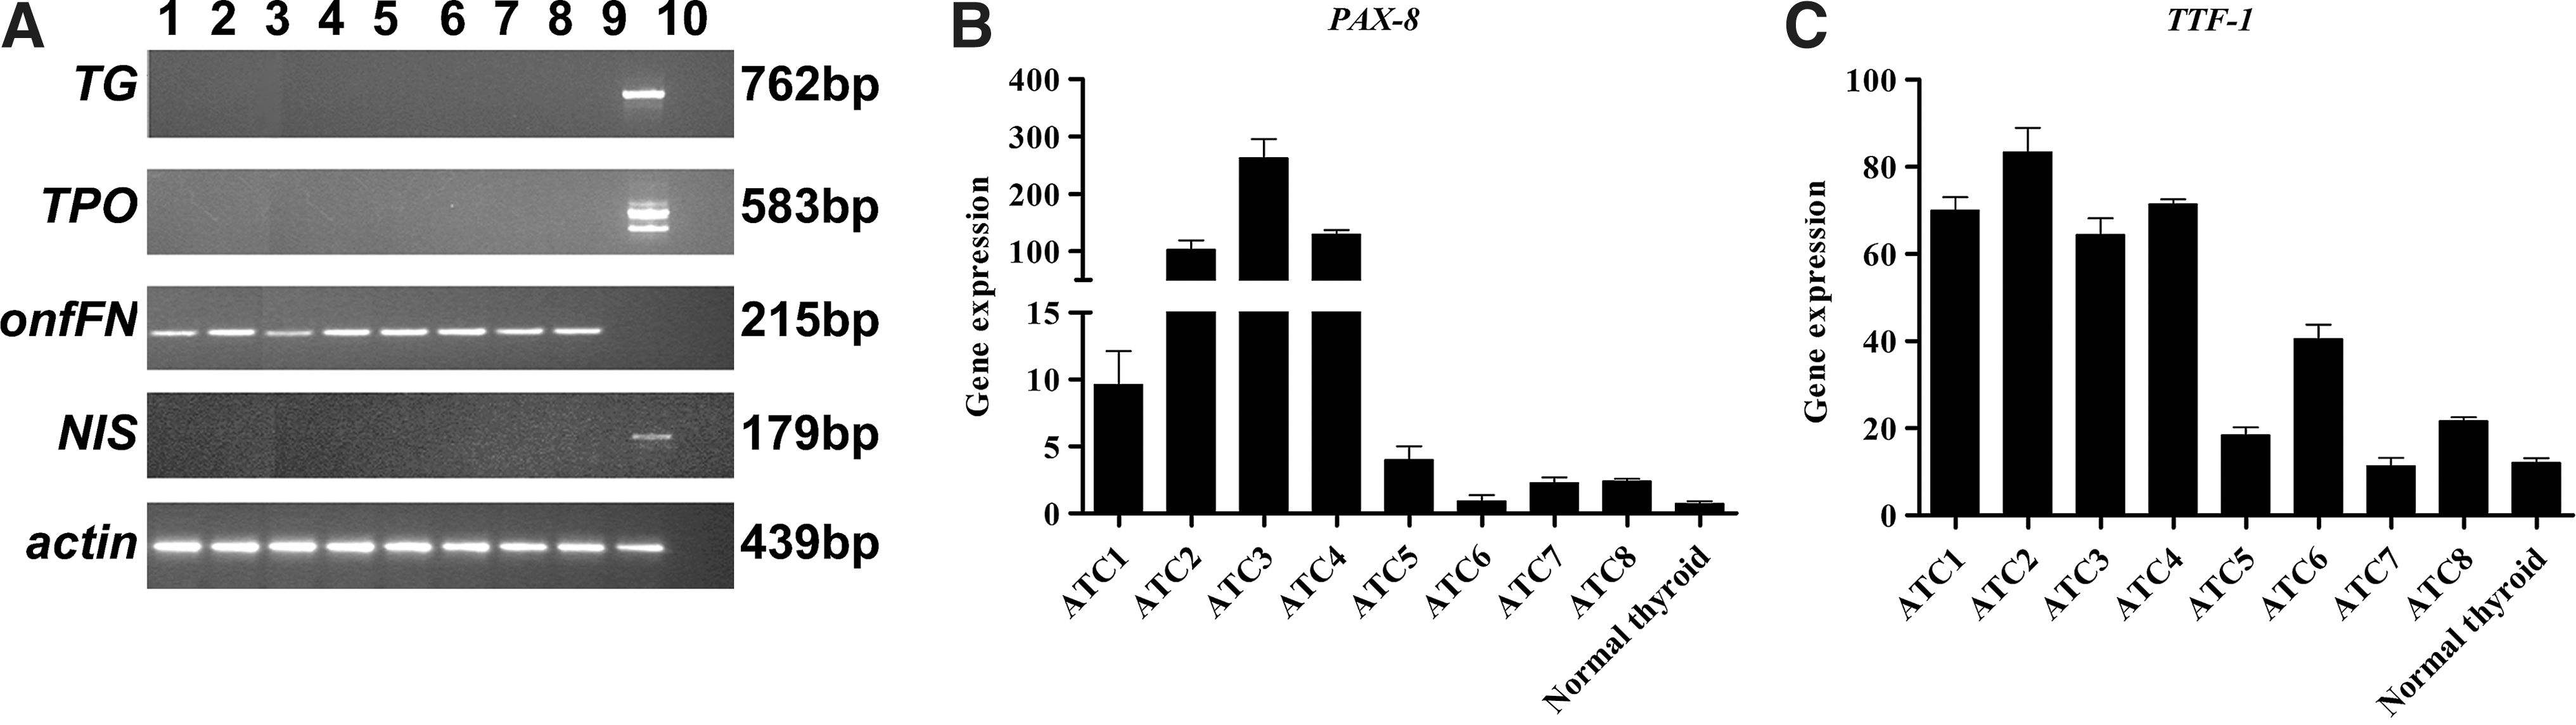
RT and qRT-PCR analysis were performed for mature and fetal thyrocyte markers. Expression of TG, TPO, and NIS was never detected, indicating the undifferentiated status of ATC specimens. By contrast, onfFN, PAX-8, and TTF-1 were positive in all eight cases, proving the thyroid origin of the tumors (Fig. 1A–C).
RT-PCR
Identification of cancer and pluripotent stem cell markers in ATCs
All cases showed very variable hyperexpression of various stem cell markers in comparison with normal thyroid cells (see Methods) used for normalization. Nuclear (SOX2, OCT4, KLF4, and C-MYC) and surface (THY-1 and C-KIT) stem markers were evaluated by qRT-PCR (Fig. 2A–F) and SSEA4 by immunohistochemistry (LI comprised between 35.8±3.3% and 5.5±1.1%; Fig. 3B).
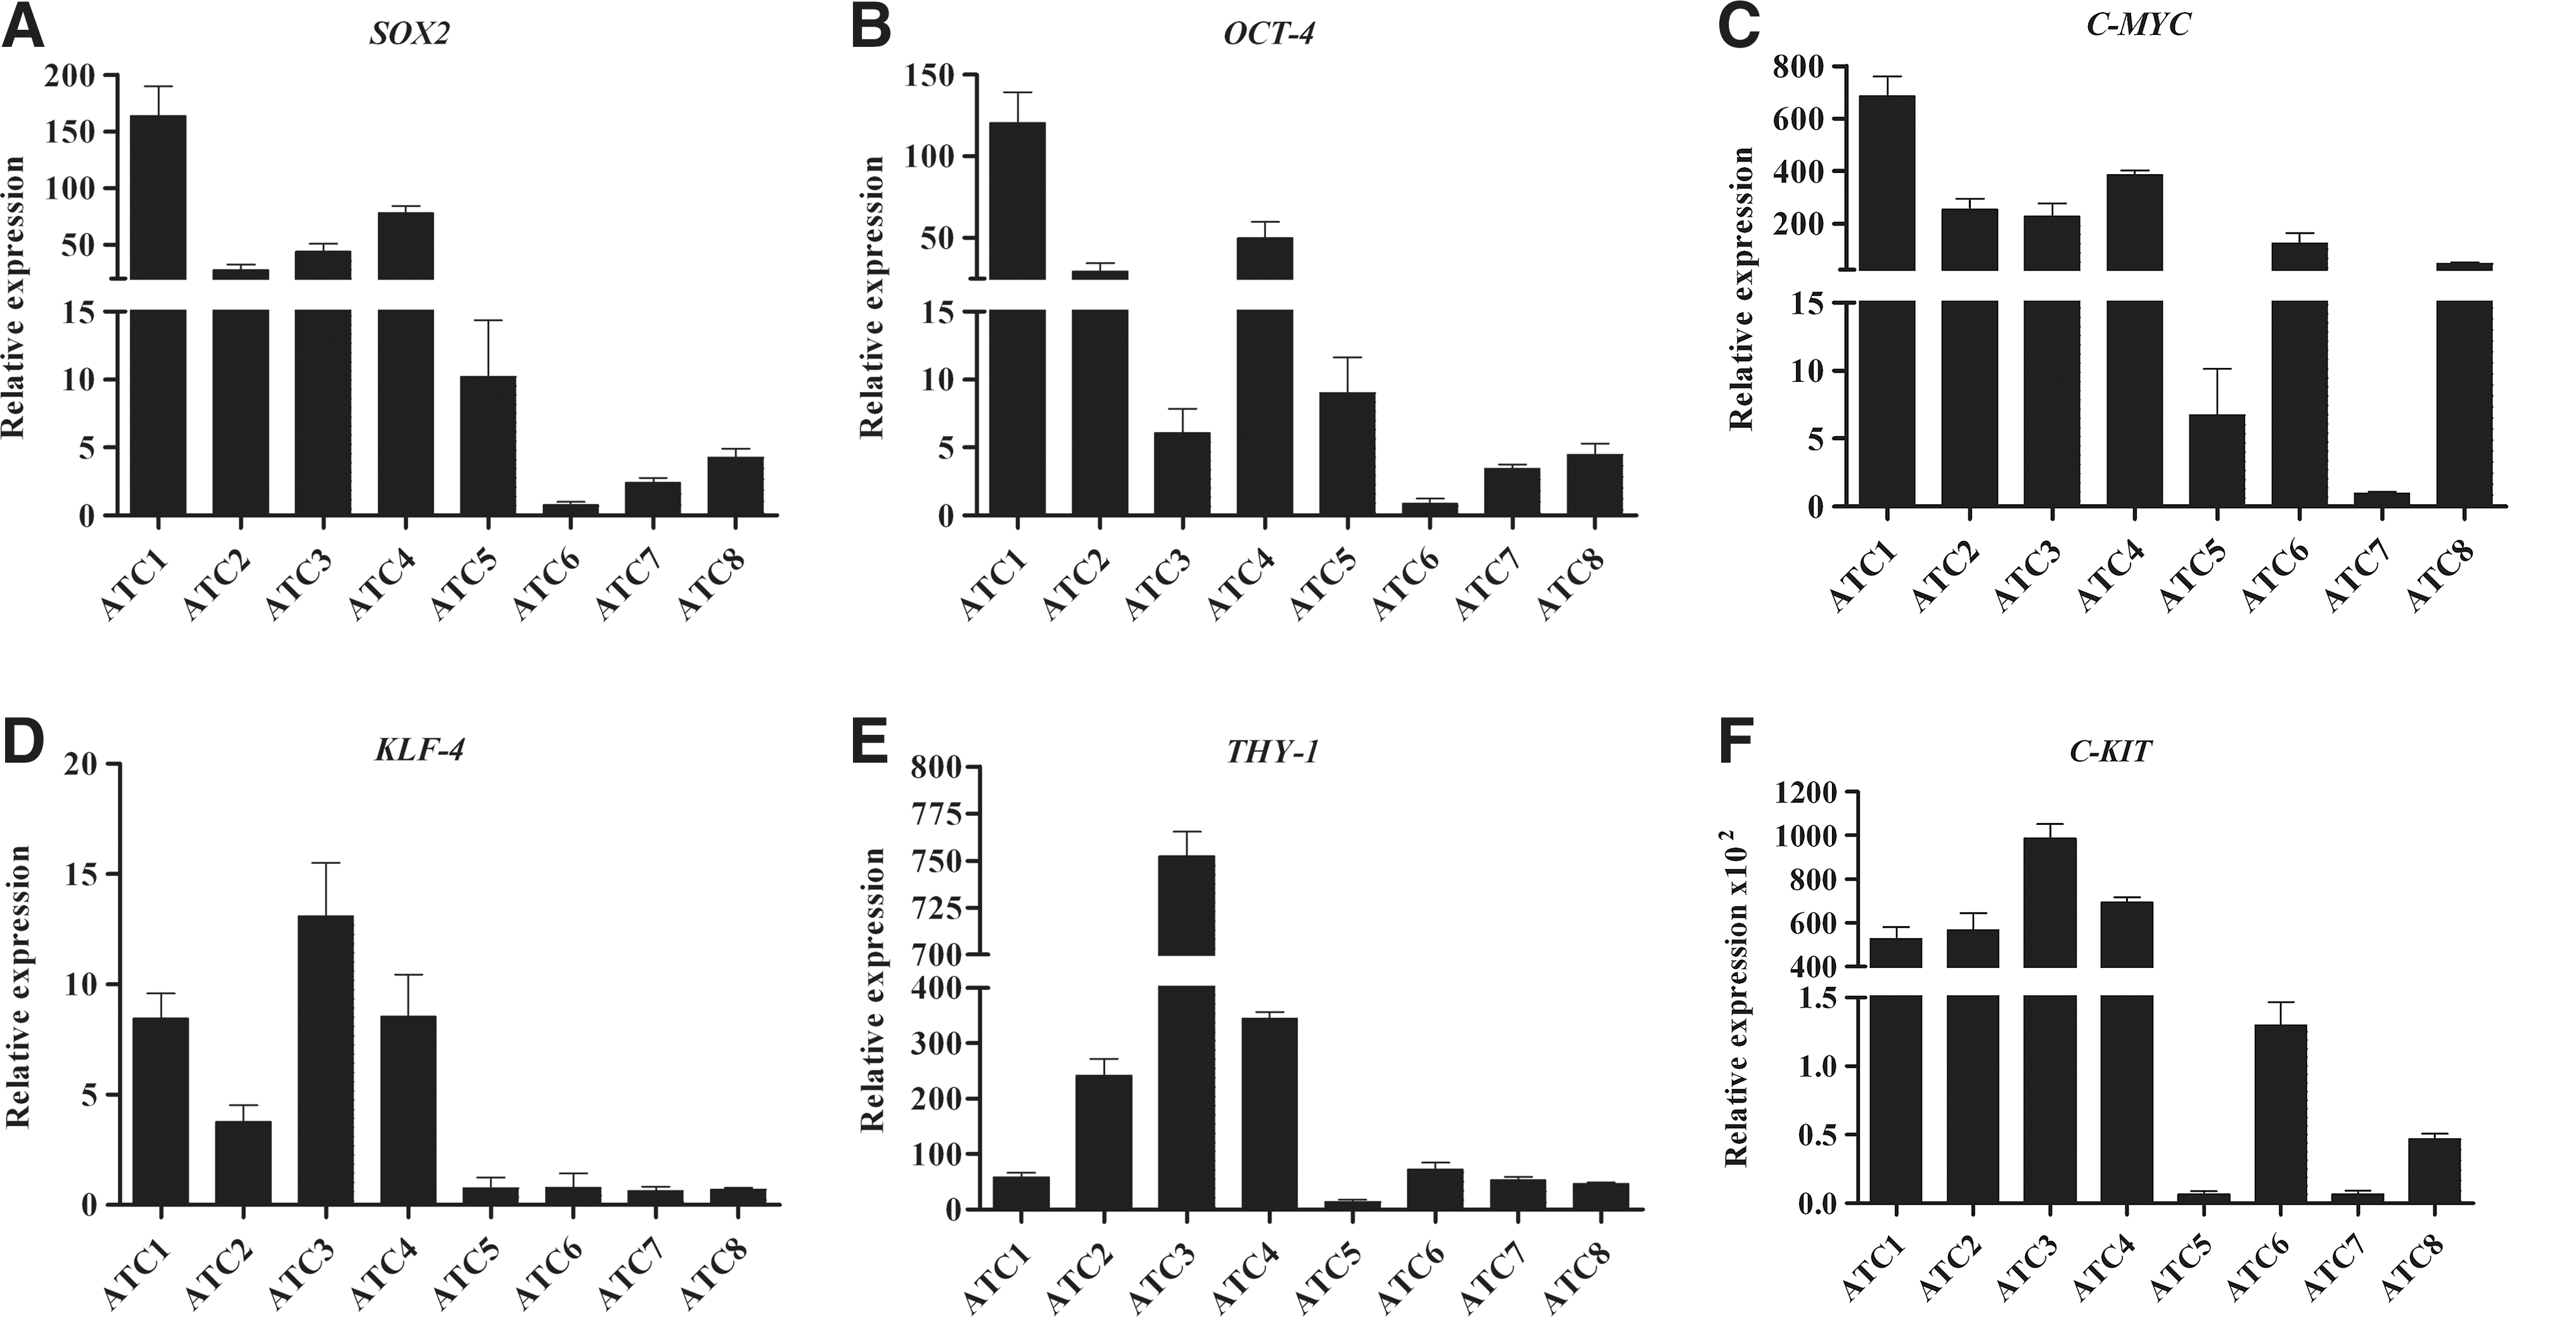
Expression of pluripotent stem cell nuclear transcription factors and surface stem cell markers in ATC. qRT-PCR analysis of nuclear stem cell transcription factors
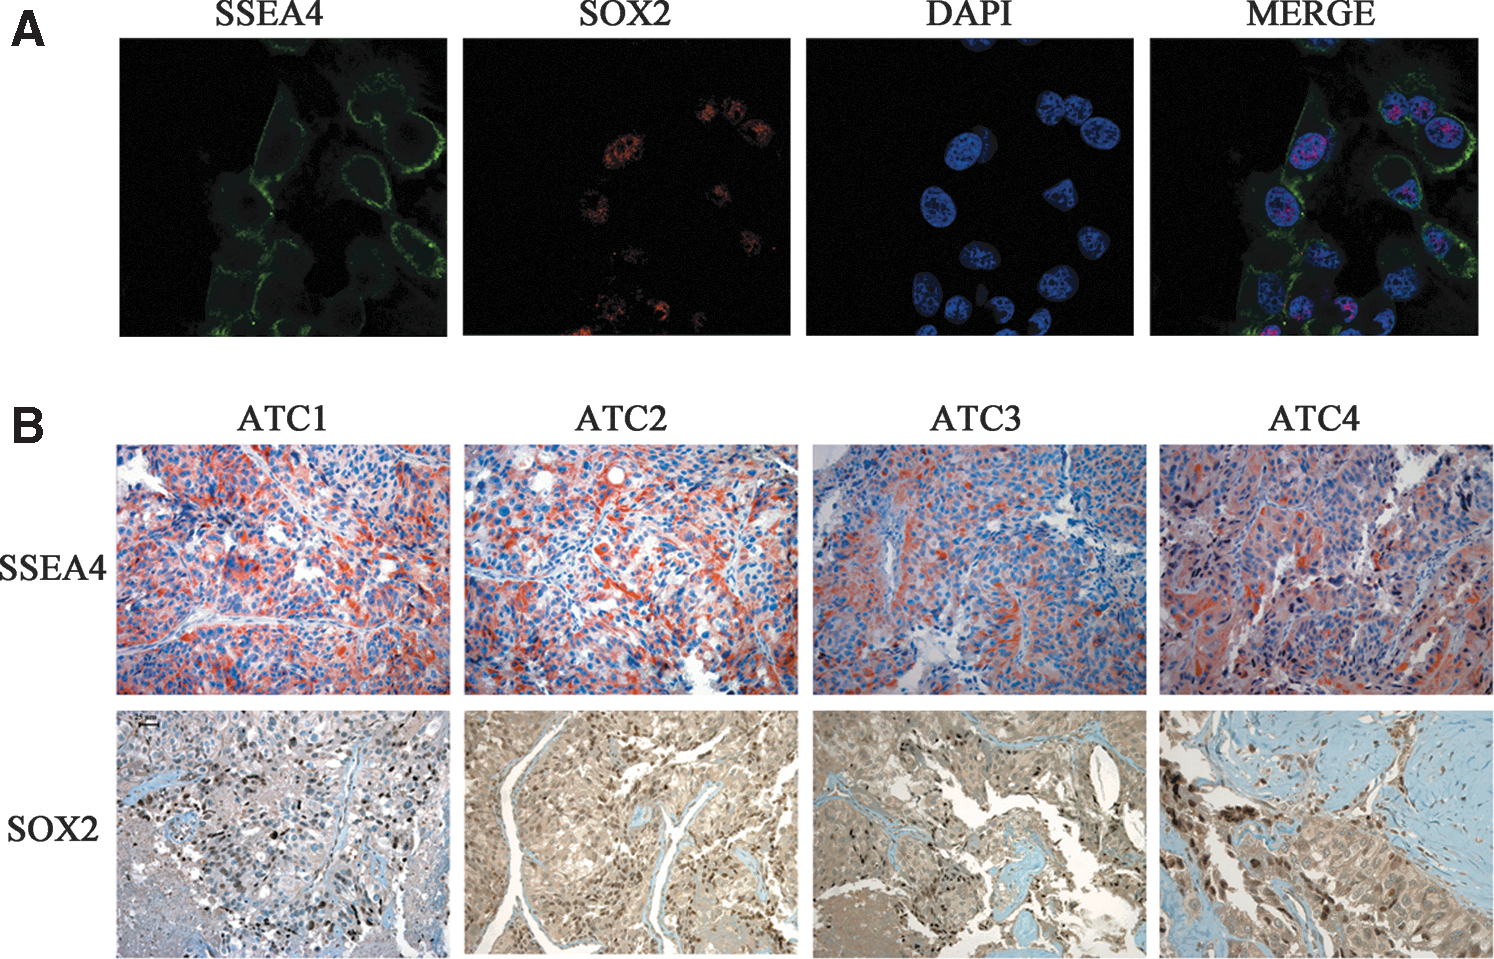
Co-localization of SOX2 and SSEA4.
SW1736 characterization and “stemness”
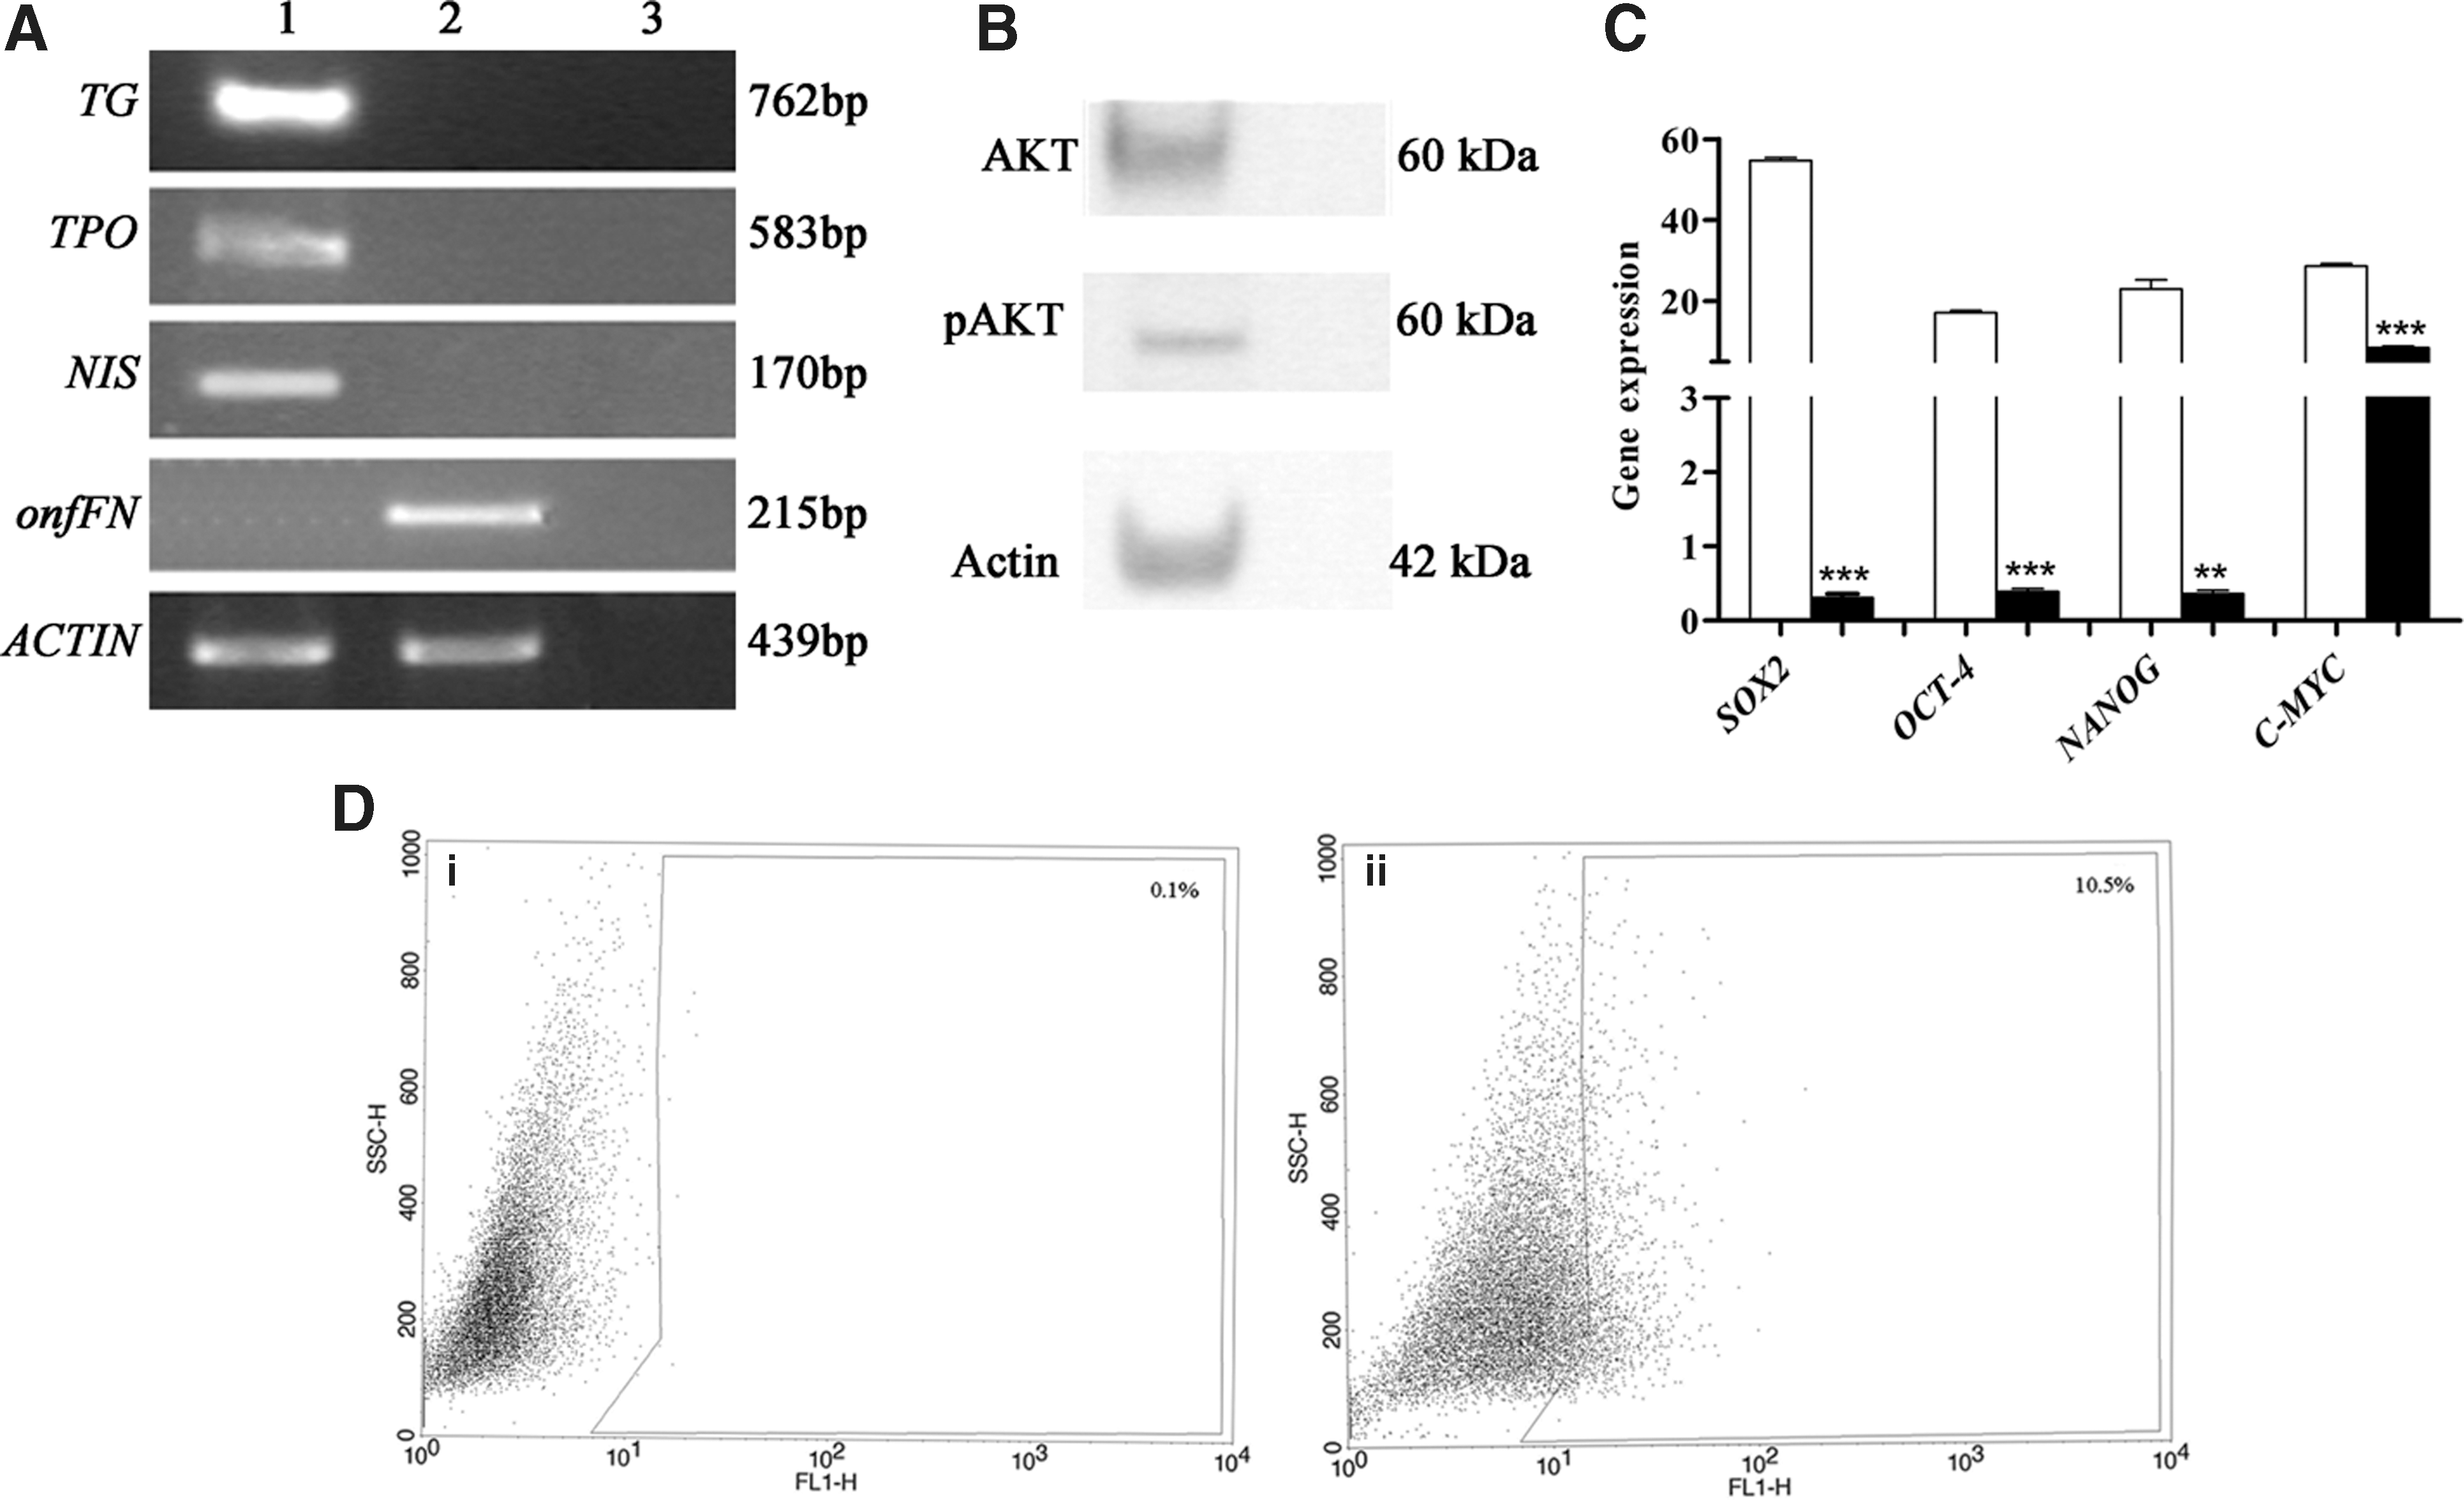
The undifferentiated status of ATC cell line SW1736 was confirmed by PCR by the presence of onfFN and the absence of the thyrocyte-specific differentiating markers TG, TPO, and NIS (Fig. 4A). The constitutive activation of p-AKT was shown by Western blot analysis (Fig. 4B). The existence of stem cell population in this cell line was demonstrated by the higher expression of nuclear stem markers SOX2, OCT-4, NANOG, and C-MYC in SW1736 in comparison with normal thyroid cells (Fig. 4C) and by the identification of a high percentage (10.4±2.1%) of ALDH+ cells (Fig. 4D). Interestingly, our confocal analysis showed co-localization of the stem cell markers SSEA4 and SOX2 (Fig. 3A). Our in vitro findings are in agreement with what we found in human tumor specimens, in which 50% of the tumors analyzed (ATC1, 2, 3, 4) overexpressed both SSEA4 and SOX2 (Fig. 3B).
SOX2 expression and silencing in SW1736 cell line
In SW1736 cell lines, SOX2 was more highly expressed compared with both OCT-4 and the downstream gene NANOG (Fig. 5A). Thus, to establish the relationship between SOX2, OCT-4, NANOG, and ABCG2, we evaluated their expression after SOX2 silencing. As expected, SOX2 silencing (1.76±0.03 vs. 0.60±0.01, p<0.0001, optical density [OD] 42.45 vs. 18.62) caused down-regulation of the downstream genes NANOG (0.55±0.07 vs. 0.07±0.02, p<0.01; OD 24.5 vs. 4.2) and ABCG2 (4.99±0.03 vs. 1.09±0.17 p<0.0001, OD 39.8 vs. 13.8), but also caused a decrease in OCT-4 expression (2.55±0.19 vs. 0.83±0.03 p<0.001, OD 26.2 vs. 1.3) (Fig. 5B–G). By contrast, OCT-4 silencing (0.87±0.02 vs. 0.38±0.05 p<0.0001) showed no effect on SOX2 expression (Fig. 5H, I).
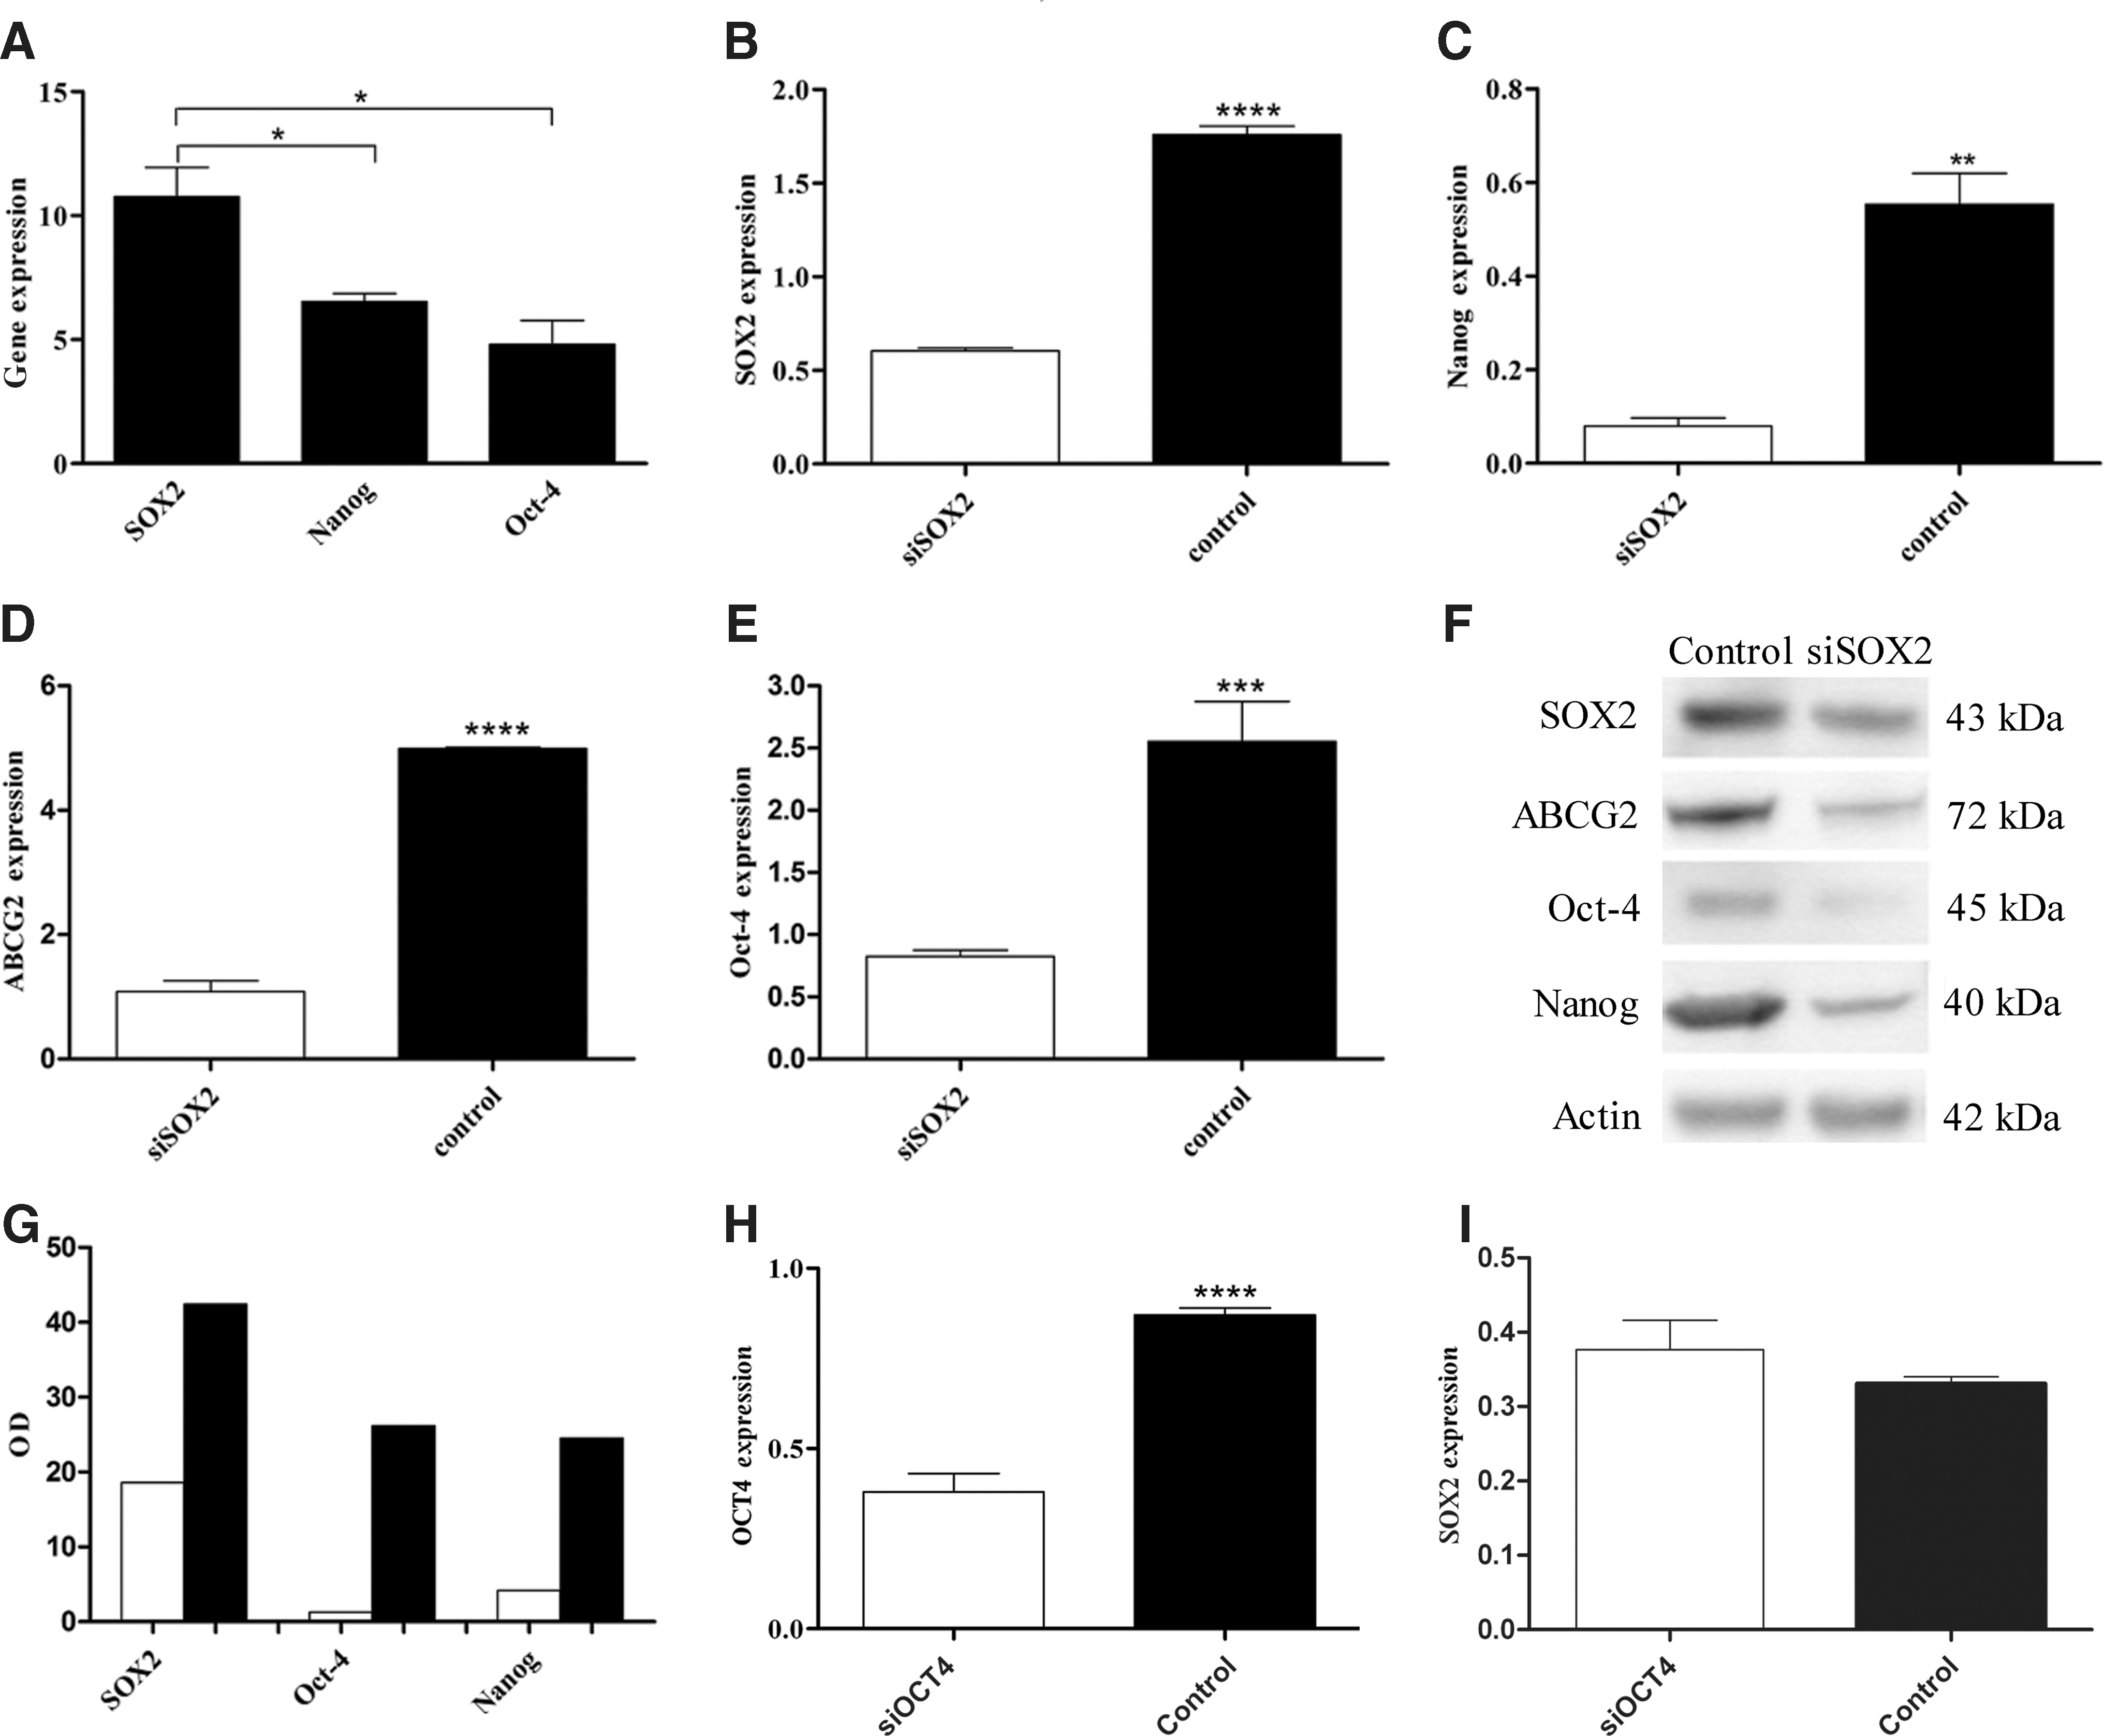
Analysis of SOX2 silencing. qRT-PCR analysis in the SW1736 cell line
SOX2 switch-off effect on cisplatin and doxorubicin treatment
SOX2 is involved in mediating regulation on SW1736 resistance to cisplatin (median inhibition concentration [IC50] 10.9±2.5 μM at 48 hours) and doxorubicin (IC50 4.9±2.0 μM at 48 hours) in SW1736 cells. The MTT assay showed that SOX2 silencing caused chemosensitization in siRNA-treated cells compared to no-target–treated cells. Treatment with 1.5 or 10 μM cisplatin caused 59.3±1.2% and 93.9±3.4% of cell death, respectively, in SOX2 siRNA-treated cells vs. 44.9±2.3% (p<0.001) and 52.6±9.4% (p<0.01) in no-target–treated cells. Doxorubicin treatment at 0.5 or 1 μM caused 45.8±9.9% and 51.2±2.5% of cell death in silenced cells vs. 17.1±3.4% (p<0.01) and 35.7±9.9% (p<0.05) in unsilenced cells (Fig. 6A).
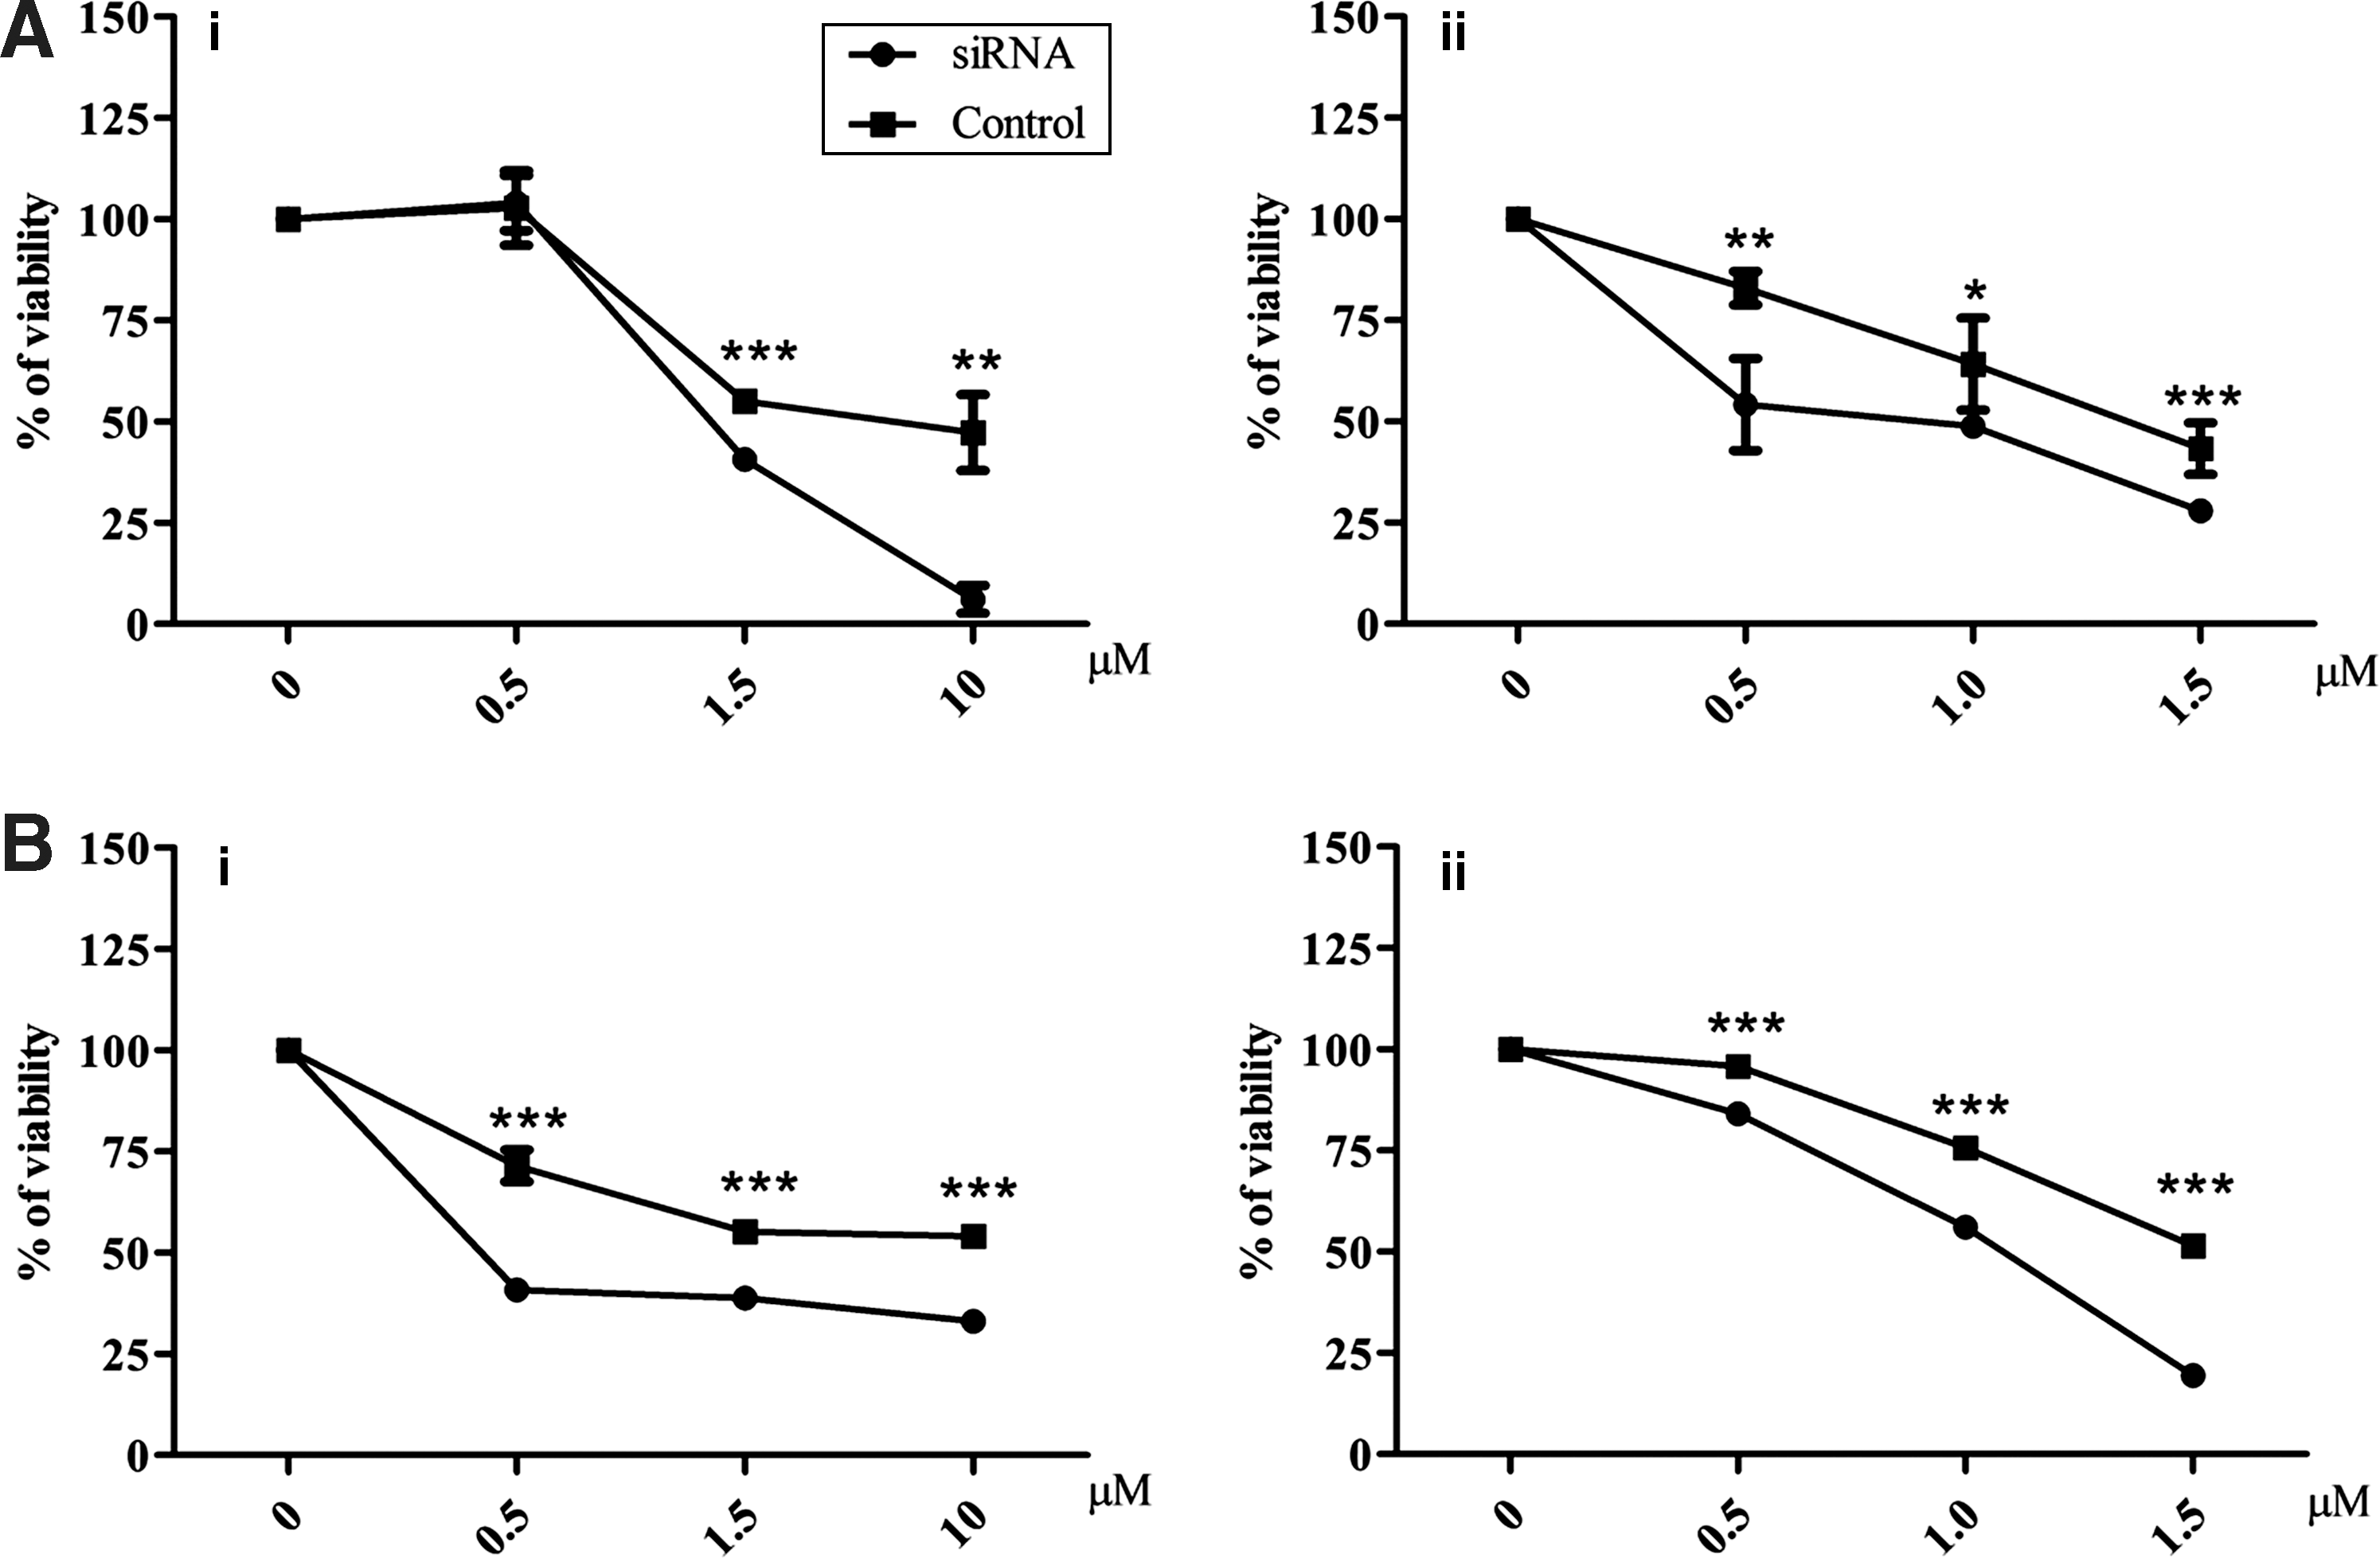
Effects of SOX2 and ABCG2 silencing on chemosensitivity. 3-(4,5-Dimethylthiazol-2-yl)-2,5-diphenyltetrazolium bromide (MTT) analysis after cisplatin
ABCG2 switch-off effect on cisplatin and doxorubicin treatment
To investigate the mechanism whereby SOX2 silencing causes cisplatin and doxorubicin chemosensitization, we analyzed the effect of the drug on ABCG2. The silencing of ABCG2 (66.2±3.1%, p<0.001, data not shown) was associated with a sensitization to cisplatin and doxorubicin. The MTT assay showed that treatment with 0.5, 1.5, or 10 μM cisplatin, respectively, caused 59.2±1.1%, 61.2±0.6%, and 74.9±1.4% of cell death in ABCG2 siRNA-treated cells vs. 28.5±4.0%, 44.8±1.6%, and 45.8±1.0% (p<0.001) in no-target–treated cells. Doxorubicin treatment at 0.5, 1.0, and 1.5 μM, respectively, caused 15.9±1.4%, 44.0±0.3%, and 74.1±0.1% of cell death in silenced cells vs. 4.2±0.1%, 24.4±2.6%, and 48.6±1.0% in unsilenced cells (p<0.001; Fig. 6B).
Discussion
The existence of CSCs may account for the high degree of dedifferentiation, sustained proliferation, and resistance to chemotherapy of ATC lesions (9,14). It has been demonstrated that murine and human somatic cells can be induced into pluripotent stem cells with a combination of four defined transcription factors (OCT-4/NANOG plus either C-MYC/KLF4 or SOX2/LIN28) (14,15). Indeed, these transcription factors play a pivotal role in the maintenance of pluripotency and self-renewal of embryonic stem cells and could therefore be responsible for sustained growth of ATC. Interestingly, in all eight specimens obtained from the archives of the Pathology Department at the University of Palermo, we found variable expression of stem nuclear transcription markers SOX2, OCT-4, C-MYC, and KLF4. In addition, all ATCs also showed up-regulation of the stem cell–related surface markers C-KIT and THY-1, which have also been described in several other tumors (16 –19) and SSEA4 expression, a human embryonic surface stem cell marker, which has been proposed for the identification of CSCs in undifferentiated tumors (20). Though the low number of ATC tissues used cannot provide a definitive result, the findings of this study may indicate that cells with a pluripotent phenotype exist within the tumor, consistent with the CSC hypothesis, but with very marked variability in stem marker expression, suggesting the need for a panel of markers and the invalidity of a single marker. In our ATC cases, indeed, CD133 was only overexpressed in four cases and LIN28 and NANOG were never detected, while in the SW1736 cell line, NANOG was strongly expressed and C-KIT, THY-1, CD133, LIN28, and KLF4 were not detected (data not shown). It is noteworthy that SOX2 and SSEA4 were simultaneously overexpressed in the same ex vivo ATC cases (ATC1, 2, 3, 4) and were found to be co-localized in the SW1736 cell line.
Recent studies have shown a central role of SOX2 in stem cell behavior (21,22). In particular, in malignant glioblastoma, SOX2 proved to be amplified or overexpressed, and ectopic SOX2 expression was not only sufficient to induce invasion and migration of glioma cells, but was also essential for maintaining these properties (21). This gene has been described as being involved in sustaining self-renewal of several stem cells, in particular neural stem cells (22). Moreover, silencing of SOX2 in freshly derived glioblastoma tumor-initiating cells stopped proliferation and caused lack of tumorigenicity in immunodeficient mice. Consequently, SOX2 or its immediate downstream effectors have been considered an ideal target for glioblastoma therapy (22). Recent studies have shown that SOX2 overexpression occurs in several other human malignant tumors; for example, in 43% of basal cell-like breast carcinomas and 41% of small cell lung cancers (23,24). The relationship between aberrant expression of SOX2, OCT-4, and NANOG in cancer has been studied in various cancers (25 –27). Moreover Masui et al. (25) showed that SOX2 is indispensable for maintaining embryonic stem cell pluripotency. Thus, in embryonic stem cells the expression of most pluripotency-associated genes, including NANOG, is regulated by an enhancer containing OCT-4 and SOX2 binding motifs (28). In this study we showed that SOX2 was overexpressed not only in ATC specimens in comparison with normal thyroid, but also in the SW1736 cell line, where it plays a pivotal role. Indeed, in this model SOX2 was expressed more abundantly than both stem nuclear transcription factors OCT-4 and NANOG. Moreover, SOX2 silencing by RNA interference (siRNA) caused down-regulation not only of the downstream NANOG gene but also of OCT-4, confirming that SOX2 is able to regulate OCT-4 (27,29). In addition, SOX2 down-regulation caused chemosensitization to cisplatin and doxorubicin. Our findings suggest that this chemosensitization could depend on down-regulation of ABCG2, which was strongly down-regulated after SOX2 silencing. Indeed, both chemotherapeutic agents are ABCG2 substrates (30,31), and Zheng and co-workers (32) showed that ABCG2 has a major responsibility for side population (stem cell–like subpopulation) resistance to doxorubicin in ATC treatment. Hence, our data strongly support a hierarchical model in which SOX2 plays a central role. In this connection, SOX2 is able to down-regulate OCT-4, but not vice versa. Moreover, several recent studies have shown that an important relationship exists between AKT pathway activation and SOX2, OCT-4, NANOG, and self-renewal capacity (33,34). In our study, SW1736 showed a constitutive expression of p-AKT, confirming the relationship between AKT and the self-renewal–related markers SOX2 and OCT4.
So far, we have confirmed the existence of CSCs in ATC tissues (9,14), showing that several stem cell markers are expressed in ATC specimens and in the SW1736 cell line, suggesting that a single marker cannot exclusively identify CSCs, and a pool of candidate antigens must be considered. Notably, both pluripotent nuclear transcription factors and surface antigens were mainly up-regulated in the same ATC cases and in SW1736 cell lines in which an ALDH+ population was also found. Analogous to other markers, ALDH activity is not a stem marker associated with a negative prognosis in all cancer types. Indeed, in malignant melanoma it seems not to correlate with “stemness” (35), and its role has also been challenged in ovarian cancer (36 –38). On the other hand, an ALDH1 activity increase has been associated with undifferentiated cells in numerous tissues, such as ovarian, breast, pancreatic, multiple myeloma, acute myeloid leukemia, and lung (37 –43), and particularly in the human ATC-8505C cell line (44).
Taken together, these data further support the necessity of a panel of markers for identifying CSCs. In particular, SOX2 appears to play a pivotal role in the resistance of ATC to chemotherapy by regulating ABCG2 transporter gene expression, which is responsible for the efflux of drugs. In conclusion, the present work supports a hierarchical model controlled by SOX2 in ATC and opens the way to finding new therapeutic strategies based on switching off SOX2 in order to further understand the potential involvement of CSCs in ATC.
Footnotes
Acknowledgments
We thank Valeria Militello and Valeria Vetri (Molecular Biophysics and Soft Matter Research Group, Department of Physics, University of Palermo, Palermo, Italy) for excellent technical assistance with fluorescence and confocal microscopy.
Disclosure Statement
The authors declare that no competing interests exist.