
Abstract
Background:
The BRAF V600E mutation is the most common genetic alteration in papillary thyroid carcinomas (PTCs). Transgenic mice overexpressing BRAF V600E in their thyroids under control of the thyroglobulin promoter (Tg-BRAF2 mice) developed invasive PTCs with high penetrance. However, these mice showed elevated thyrotropin (TSH) levels, which also stimulate the proliferation of thyrocytes and tumorigenesis. The purpose of the present study was to investigate how TSH signaling cooperates with BRAF V600E in the process of thyroid carcinogenesis.
Methods:
We crossed Tg-BRAF2 mice with TSH receptor knockout (TshR
Results:
Groups 3 and 4 developed distinct neoplasias comparable to human PTCs. Group 3 developed typically larger, more aggressive, invasive tumors compared to group 4. The frequency of 53BP1 and γH2AX foci—indicators of genomic instability—in group 3 was higher than that in group 4. TSH also enhanced invasiveness and genomic instability in PCCL3 cells with BRAFV600E expression.
Conclusions:
These data demonstrate that the TSH signaling confers more aggressive features in BRAFV600E-induced thyroid tumors in mice. This might be due, in part, to accelerated genomic instability.
Introduction
P
The BRAF activating mutation is the most common genetic aberration in PTCs (29–83%) (5). It is most commonly due to a thymine-to-adenine transversion at nucleotide1799 (c.1799T>A), resulting in a valine-to-glutamic acid substitution at amino acid 600 (p.V600E). It is believed that this mutation destabilizes the interactions that maintain the DFG motif in an inactive conformation, and that the mutation flips the activation segment into the active position (6). Therefore, BRAF V600E constitutively activates the MAPK pathway and is thought to play a major role in PTC tumorigenesis (7,8).
Although the majority of PTCs have an excellent outcome with treatment (9), several studies have shown that the BRAF V600E mutation in PTC is associated with aggressive clinicopathological features such as advanced clinical stage, extrathyroidal extension, and lymph-node metastasis (7). These tumors also have a high risk of recurrence (10). Transgenic mice overexpressing BRAF V600E in thyrocytes under control of the thyroglobulin (Tg) gene promoter developed PTC with distinct tall cells and poorly differentiated areas (11), which are aggressive features of human PTCs. However, these mice were severely hypothyroid with consequently high thyrotropin (TSH) levels because the function of all thyrocytes was impaired by the expression of the oncoprotein. In rodents, it is known that increasing serum TSH by prolonged administration of an antithyroid drug leads to development of thyroid cancer, albeit at low penetrance (12). Most thyroid cancer mouse models similarly show elevated TSH levels because of this hormonal feedback system. However, the role of the high TSH levels in these mouse models remains less clear.
So far, two mouse models have been developed to study the role of TSH in thyroid carcinogenesis. Lu et al. crossed TRβ PV/PV mice—a model of follicular thyroid cancer—with TSH receptor (TSHR) knockout mice (13). Surprisingly, the tumorigenic effect of TRβ PV/PV was totally abolished in the TRβ PV/PV/TshR −/− mice. Only a few, small-sized follicles (no tumors) were observed in their thyroids. Recently, Franco et al. established another mouse model (14). They crossed mice with a thyroid-specific knock-in of Braf V600E (LSL-Braf V600E/TPO-Cre) with TshR −/− mice. By three weeks (at this time point, thyroid cancer was seen in LSL-Braf V600E/TPO-Cre mice), they developed benign tumors without characteristic nuclear features of human PTCs. However, by nine weeks, they progressed to low-grade PTCs.
Genomic instability (GIN) is a hallmark of cancers and has been suggested to play a crucial role in the progression of thyroid tumors (15,16). p53-binding protein 1 (53BP1) is a DNA damage response protein that rapidly localizes at the site of DNA double-strand breaks (DSB) together with phosphorylated ATM and many other related proteins such as γH2AX (17 –20). One of the manifestations of GIN is the induction of DSB, and it has been demonstrated that 53BP1 focus formation can be used as a marker of GIN (16,21). Advanced and more malignant thyroid cancer tissues showed intense and abnormal nuclear 53BP1 staining patterns compared with low-grade cancers, suggesting increased GIN in advanced cancer cells.
To examine the role of TSH signaling in thyroid carcinogenesis in vivo, we developed mice with thyrocyte-targeted BRAF V600E expression crossed with the TshR gene knockout mice. We also evaluated cell proliferation and GIN status in their thyroids, and demonstrate that TSH signaling may be related to the induction of GIN and may then enhance the malignant phenotype.
Materials and Methods
Cell lines
The PC-BRAFV600E-6 line was derived from PCCL3 cells, a clonal rat thyroid cell line, to obtain doxycycline-inducible BRAF
V600E expression as previously described (22). The cells were maintained in H4 complete medium consisting of Coon's F-12 medium (Sigma) supplemented with 5% tetracycline screened fetal bovine serum (FBS; Hyclone), 0.3 mg/mL
Mice
FVB/N, bovine Tg promoter-driven BRAF V600E transgenic mice—Tg-BRAF2 mice (11)—were obtained from Dr. James Fagin (University of Cincinnati; currently Memorial Sloan-Kettering Cancer Center). C57/Bl6J-129 hybrids—thyrotropin receptor null mice (TshR −/−) (23)—were obtained from Jackson Laboratory Inc. Both strains were crossed, and offspring were genotyped using tail DNA as described previously (11,23). All the mice were bred in a specific pathogen-free facility. Mice with TshR −/− were fed with a desiccated thyroid powder (100 ppm)-supplemented diet (23). Animal care and all experimental procedures were performed in accordance with the Guidelines for Animal Experimentation of Nagasaki University with the approval of the Institutional Animal Care and Use Committee.
Thyroid weight and histology
Mice were sacrificed at 12 and 24 weeks of age. Thyroid glands were removed, weighed, and frozen in liquid nitrogen for real-time reverse-transcription PCR (RT-PCR) described below. Formalin-fixed and paraffin-embedded (FFPE) thyroid tissue sections were stained with hematoxylin and eosin (H&E) for histology and pathological scoring of lesions. Aggressiveness of the tumor tissues was scored based on the sum of the following parameters: invasion, yes=1 or no=0; solid pattern, ≥40%=1 or <40%=0.
Real-time quantitative RT-PCR
Total RNA was isolated from homogenized thyroid tissues using ISOGEN reagent (Nippon Gene). Two hundred nanograms of the total RNA was reverse transcribed with High Capacity RNA-to-cDNA Kit (Applied Biosystems) in the presence of random hexamers to generate cDNA. The following quantitative PCR was carried out in a Thermal Cycler Dice Real-time system (TaKaRa Bio) using QuantiTect SYBR Green PCR Kit (Qiagen). The sequences of used primer pairs were described previously (11). The cycle threshold value, which was determined using second derivative, was used to calculate the normalized expression of the indicated mRNAs with Q-Gene software (24) using β-actin for normalization.
Immunohistochemistry
For cleaved caspase-3 detection, FFPE sections were deparaffinized and subjected to antigen retrieval by microwave treatment in citrate buffer. After blocking, the sections were incubated with anticleaved caspase-3 antibody #9661 (1:250 dilution; Cell Signaling Technology) overnight at 4°C. Staining was performed using the Vectastain Elite ABC Kit (Vector Laboratories) and 3,3′-diaminobenzidine (DAB). For F4/80 staining, FFPE sections were deparaffinized and treated with proteinase K. After blocking, the sections were incubated with anti-mouse F4/80 antibody Cl:A3-1 (1:50 dilution; AbD Serotec) overnight at 4°C followed by incubation with HRP-conjugated anti-rat IgG secondary antibody (Dako). Visualization was done with DAB.
Immunofluorescence
FFPE sections were deparaffinized and subjected to antigen retrieval by microwave treatment in citrate buffer. For 53BP1/Ki67 co-staining, the tissues were then incubated with a mixture of rabbit anti-53BP1 antibody A300-272A (1:200 dilution; Bethyl Laboratories Inc.) and rat monoclonal anti-mouse Ki67 antibody Clone TEC 3 (1:50 dilution; Dako) in 5% milk in TBS-T buffer. After two hours of incubation at room temperature, the tissues were incubated with another mixture of Alexa Fluor 532-conjugated goat anti-rabbit and Alexa Fluor 647-conjugated goat anti-rat antibodies (Invitrogen). For γH2AX staining, anti-phosphorylated H2AX (Ser139) Clone 2F3 (1:500 dilution; BioLegend) and Alexa Fluor 488-conjugated anti-mouse antibody (Invitrogen) were used. After counterstaining with 4′,6-diamidino-2-phenylindole (DAPI), images were visualized and captured using a fluorescence microscope (Leica DM 6000B). Immunoreactivity signals were analyzed at 400× magnification in four to six fields of view per sample, and analyzed with the NIH Image J toolkit (
For detection of γH2AX in PC-BRAFV600E cells, the cells were grown on coverslips and pretreated with H3 medium for seven days. The medium was then replaced by H3 or H4 medium with or without doxycycline. After incubation for 24 hours, the cells were fixed with 10% formalin and permeabilized with 0.5% Triton-X in PBS. Anti-phosphorylated H2AX (Ser139) antibody Clone JBW301 (1:1000 dilution, Millipore) was used as a primary antibody. After labeling with a secondary antibody conjugated with Alexa Fluor 488, images were acquired using a fluorescence microscope.
Matrigel invasion assay
The Matrigel invasion assay was performed in triplicate using the PC-BRAFV600E-6 cells. Matrigel (BD Biosciences; 60 μg/transwell) diluted with serum-free medium was placed on 24-well format transwell cell culture inserts (Corning; 8-μm pore size). After seven days of TSH starvation in H3 medium, the cells were resuspended in 200 μL serum-free medium with and without doxycycline in the presence or absence of TSH and added to the upper chamber at 8×10⁴ cells per insert. Next, 750 μL complete medium with 10% FBS was added to the lower chamber of each transwell. After 24 hours' incubation, nonmigrated cells at the upper side of the membrane were mechanically removed with cotton swabs, and the transwells were washed with PBS, fixed with 100% methanol, and stained with Giemsa Stain solution (Sigma). Cells that invaded the Matrigel and migrated to the lower side of the membrane were quantified in 10 random images per transwell taken at 10× magnification in a bright field microscope. The number of migrated cells were counted using the NIH Image J toolkit.
Statistical analysis
Differences between groups were examined for statistical significance by unpaired t-test or analysis of variance (ANOVA) followed by Tukey's post-hoc test. A p-value <0.05 was considered statistically significant.
Results
BRAF V600E generates tumors in mice, and TSH increases tumor size
We first crossed Tg-BRAF2 mice with TshR −/− mice to obtain Tg-BRAF2/TshR +/− mice, and then the Tg-BRAF2/TshR +/− mice were further crossed with TshR −/− mice. Offspring were genotyped and divided into four groups: Braf wt/TshR +/− (group 1), Braf wt/TshR −/− (group 2), Tg-BRAF2/TshR +/− (group 3), and Tg-BRAF2/TshR −/− (group 4). Although previous reports demonstrated Tg expression in the thyroids of TshR −/− mice (23,25), we assessed BRAF V600E expression by real-time RT-PCR because the Tg promoter activity is dependent on TSH stimulation in vitro, and the bovine Tg promoter drove the expression of BRAF V600E in our model. In the thyroid lobes collected at 12 weeks, the BRAF V600E expression levels in the group 3 mice were comparable to those in group 4 (Fig. 1), indicating that BRAF V600E was properly transcribed regardless of TSH signaling. We also examined other thyroid-specific genes, the sodium-iodide symporter (Nis) and Tg. Nis expression was remarkably downregulated in TshR −/− mice (groups 2 and 4; Fig. 1). Regarding Tg, its expression in group 3 was also reduced, as well as in groups 2 and 4 (Fig. 1), suggesting that the dedifferentiating effect of BRAF V600E on the expression of Tg was strong.
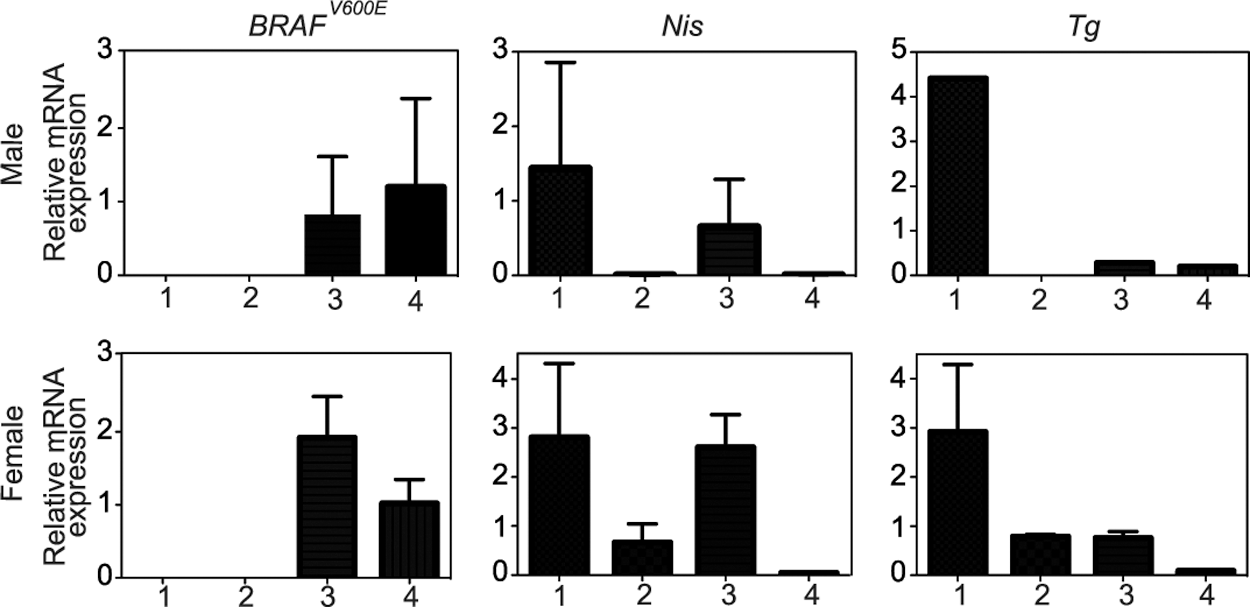
Effect of TshR knockout on mRNA levels of transgene and thyroid-specific genes. Total RNA was extracted from the thyroids at 12 weeks and subjected to quantitative reverse-transcription polymerase chain reastion (qRT-PCR) for the expression of the indicated genes after normalization to β-actin. Columns represent means and standard error of the mean (SEM) of values obtained from three independent biological replicates. 1, group 1 (Braf wt/TshR +/−); 2, group 2 (Braf wt/TshR −/−); 3, group 3 (Tg-BRAF2/TshR +/−); 4, group 4 (Tg-BRAF2/TshR −/−).
The ratio of thyroid weight to body weight was compared among the four groups at both 12 and 24 weeks. Note that body weights of group 2 and group 4 mice (TshR
−/−) at five weeks were smaller than those of group 1 and group 3 mice (TshR
+/−), presumably due to hypothyroidism. However, these differences were diminished until 12 weeks (following a thyroid powder-supplemented diet beginning at four weeks (Supplementary Fig. S1; Supplementary Data are available online at
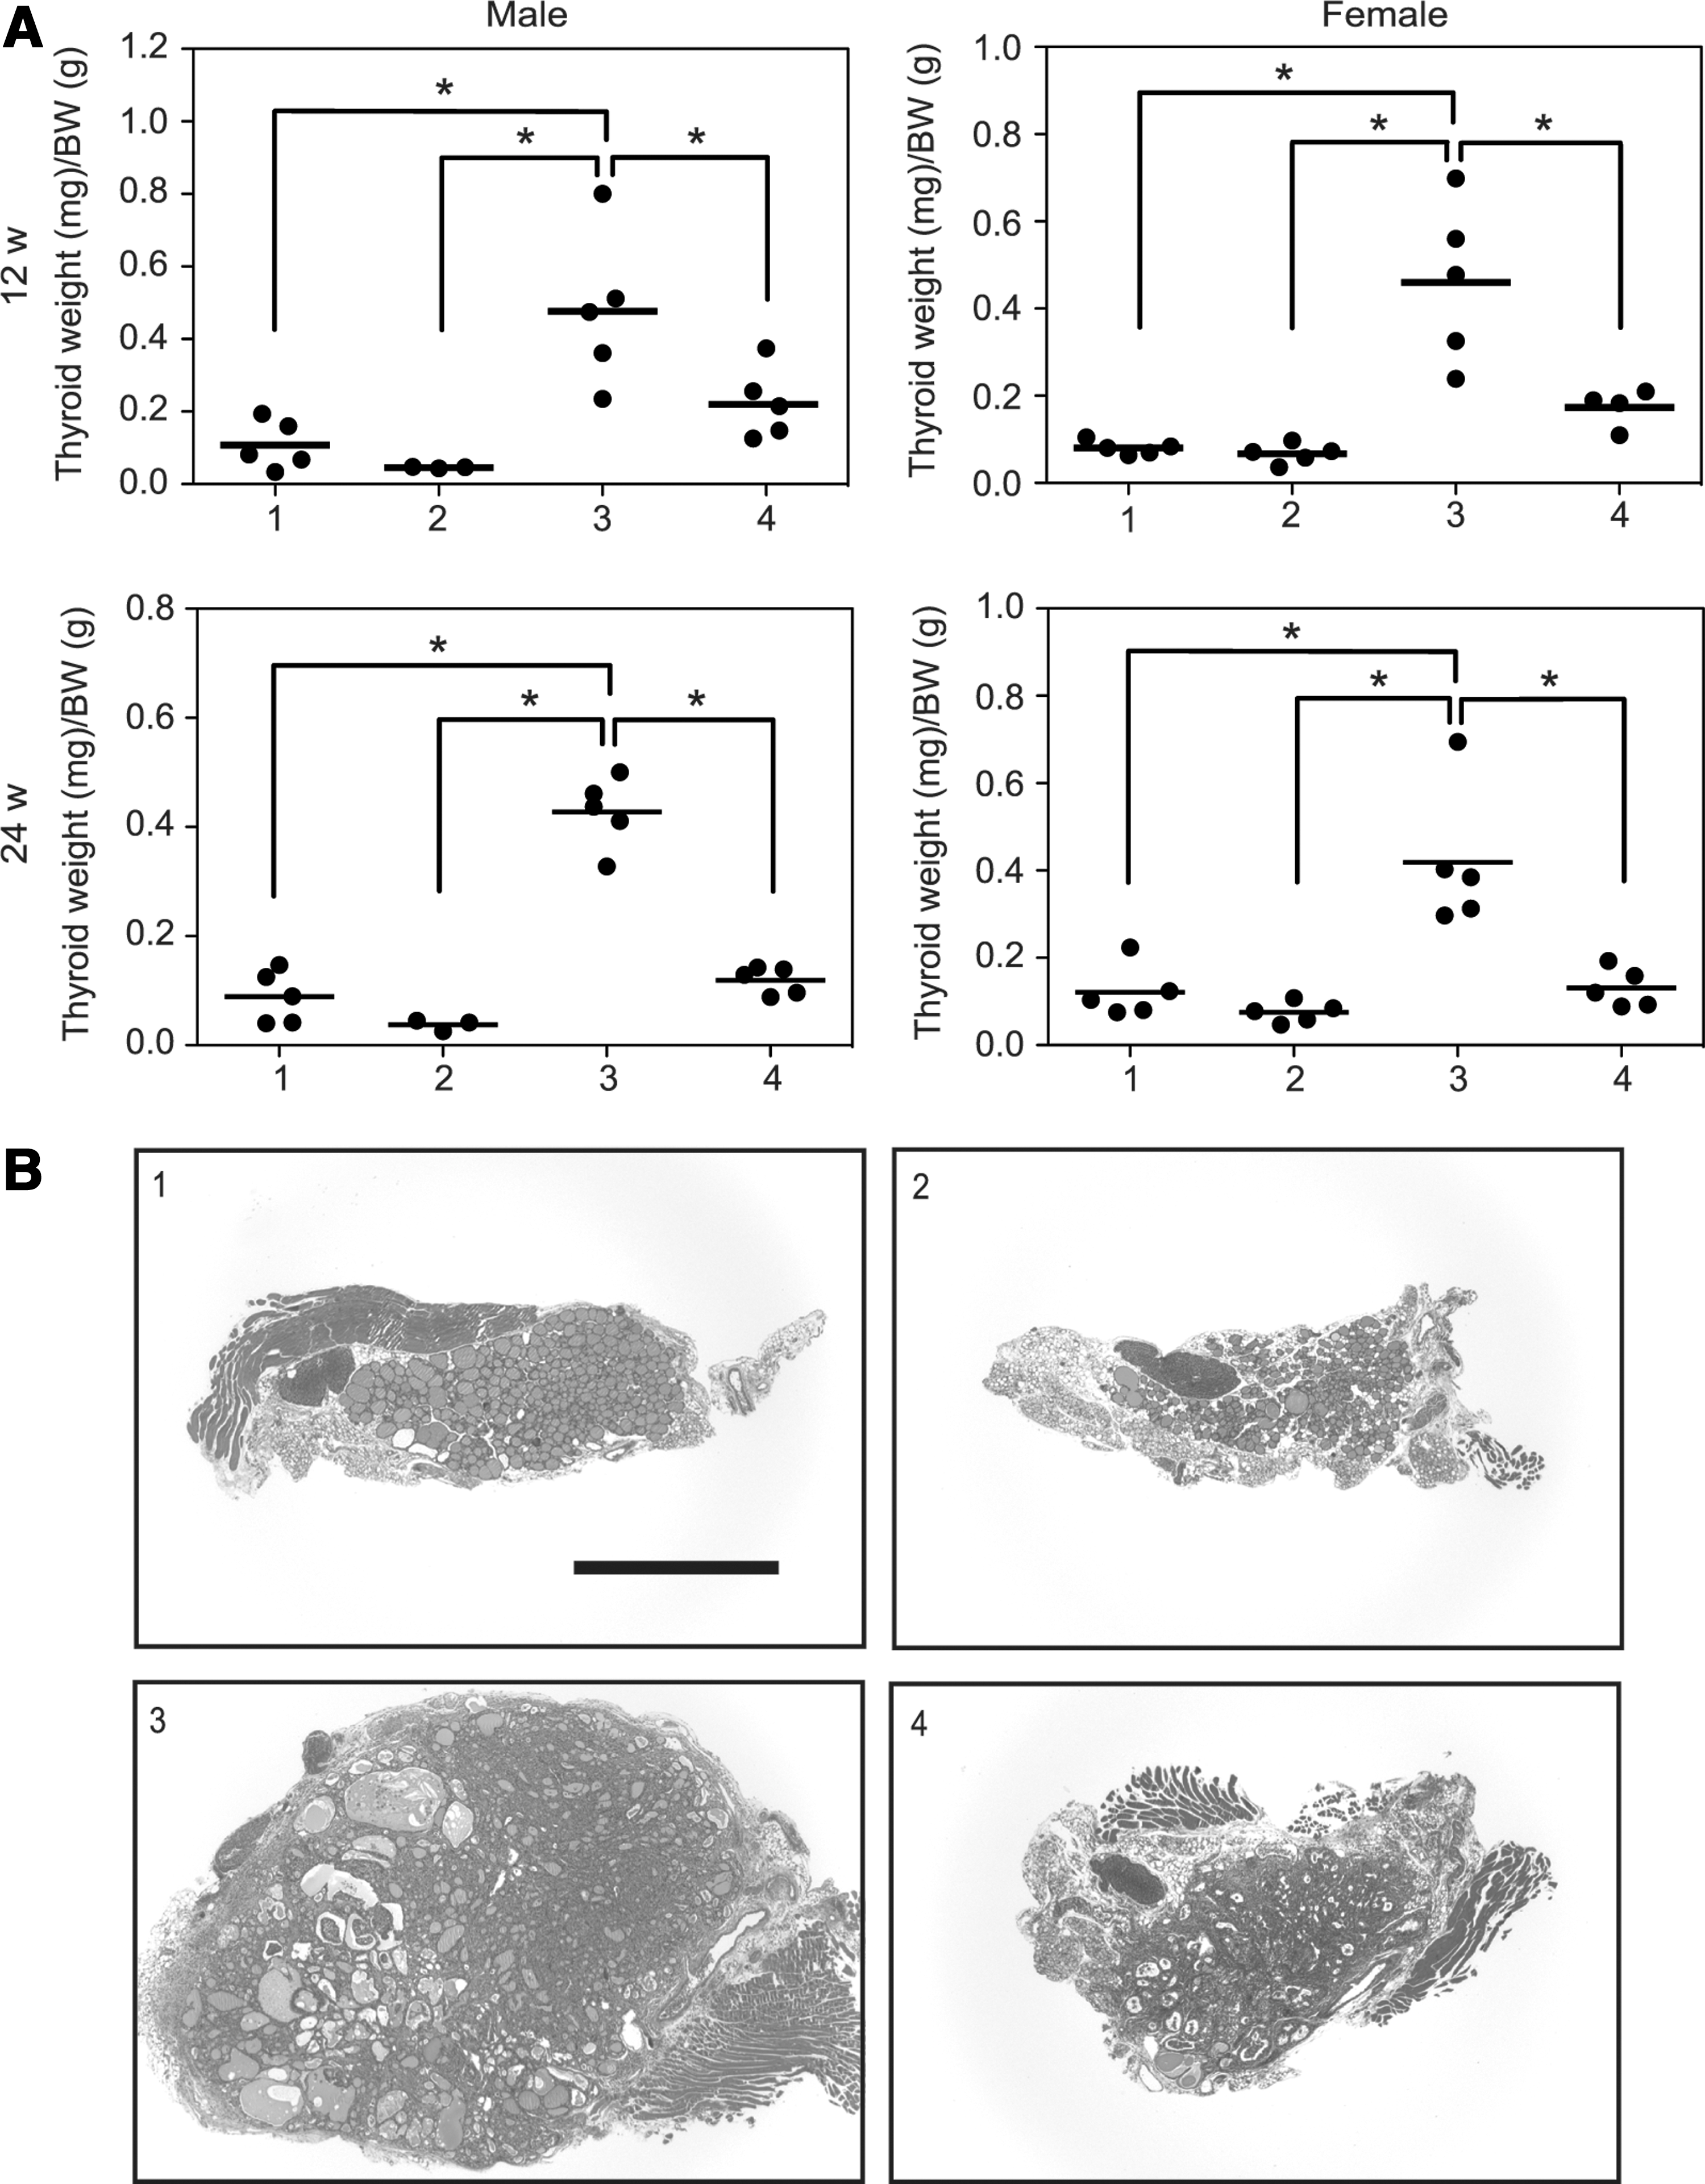
Effect of TSH signaling on BRAF
V600E-induced thyroid tumor formation.
TSH signaling confers more aggressive features in BRAF V600E-induced thyroid tumors
Next, we performed microscopic analyses of groups 3 and 4 using H&E stained sections. Figure 3 shows representative findings of BRAF V600E-induced tumors in the group 3 mice. The mice developed neoplastic lesions distorting the entire thyroid glands (Fig. 3A). Solid pattern (Fig. 3C), capsular invasion (Fig. 3D), and tall cells lining papillary structures (Fig. 3E) were observed, and these features were similar to human aggressive PTCs. Papillary projection (Fig. 3B) and nuclear clearing (Fig. 3F) were also observed.

Representative images of H&E stained sections from thyroid tissues of group 3 (Tg-BRAF2/TshR
+/−) mice:
Most of the mice in both groups developed neoplasias with features characteristic of human PTC, including nuclear changes such as nuclear clearing, grooves, and inclusions (Table 1). Tall cells, which are thought to be an aggressive subtype, were also seen in 7/20 and 8/19 mice in group 3 and group 4 respectively (Table 1). By contrast, a solid pattern, which is another aggressive feature in PTC, was observed more frequently in group 3 (6/20) than in group 4 (3/19; Table 1). Capsular invasion was only observed in group 3 (5/20), while group 4 showed no features suggestive of capsular invasion or extrathyroidal extension (Table 1). A papillary pattern was more common in group 4 (data not shown). A time-dependent trend was observed, particularly in group 4 where the papillary pattern at 12 weeks was replaced by solid features at 24 weeks (Table 1; data not shown). We carried out histopathological scoring of the neoplastic lesions in groups 3 and 4. The aggressiveness score for group 3 (0.550±0.170) was higher than that of group 4 (0.158±0.086), which was statistically significant (p=0.0498, unpaired t-test). These data suggest that TSH signaling results in a more aggressive phenotype in the BRAF V600E-induced thyroid tumors.
TSH prevents apoptosis but not macrophage infiltration
To examine the influence of apoptosis on the difference between groups 3 and 4, we performed immunohistochemistry for cleaved caspase-3. The percentage of positively stained cells was significantly higher in group 4 than in group 3 at 12 weeks (Fig. 4A). There was also a similar tendency at 24 weeks, but no statistical significance was observed (Fig. 4A). These results suggest that the TSH signal has a role in preventing apoptosis, and this may cause, at least in part, the difference in thyroid size between groups 3 and 4.
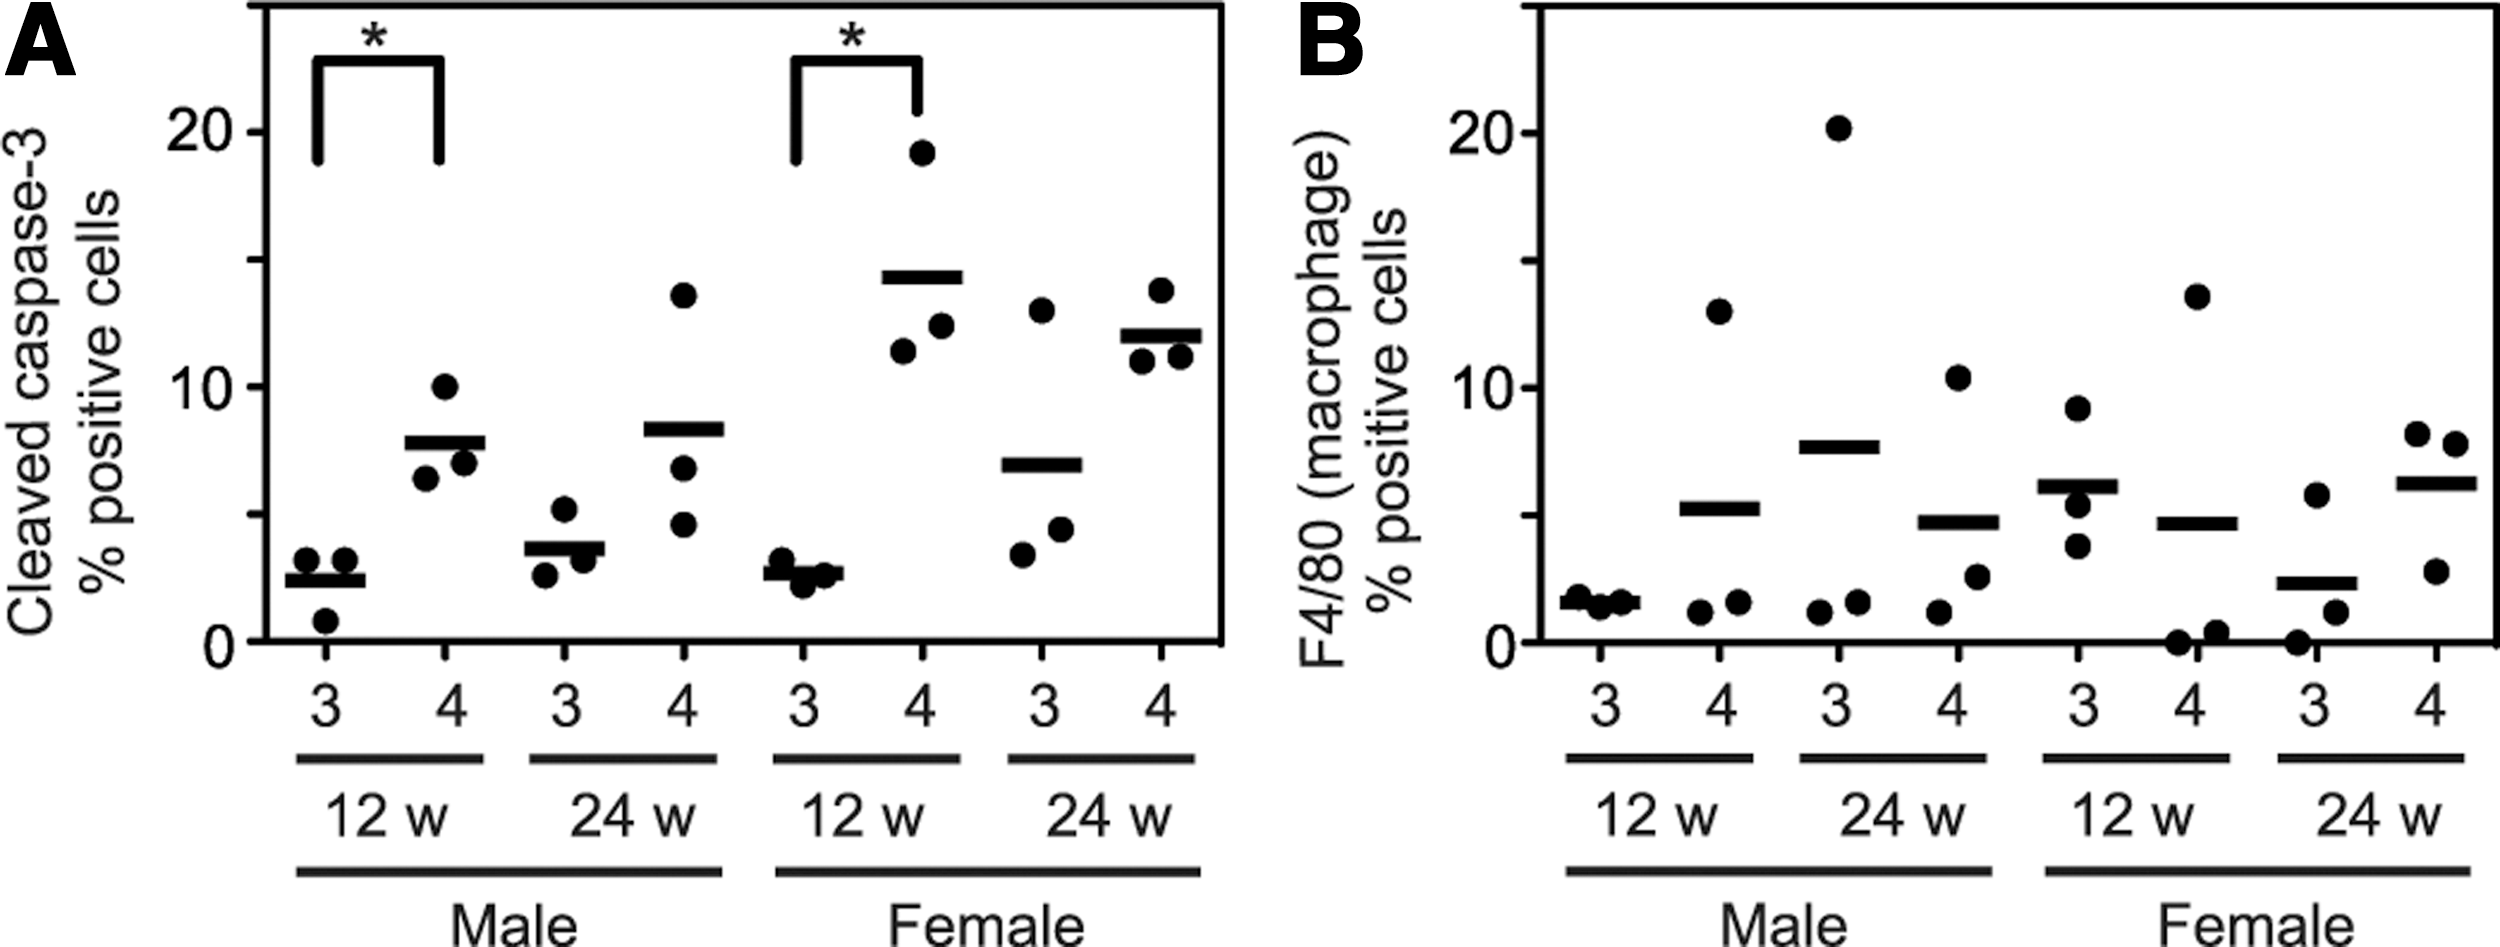
Evaluation of apoptosis and macrophage infiltration. Immunostaining was performed using cleaved caspase-3
Recently, it has been demonstrated that tumor-associated macrophages have a role in the progression of BRAF V600E-induced thyroid cancer, particularly PTC, to poorly differentiated thyroid carcinoma (26). To test this possibility, we also performed immunohistochemistry for F4/80. As shown in Fig. 4B, however, there was no difference between groups 3 and 4.
TSH enhances BRAF V600E-induced cell invasiveness in rat thyroid cells
To support the in vivo observation, we utilized a doxycycline-inducible BRAF V600E rat thyroid cell line—PC-BRAFV600E-6 cells (22)—and performed a cell invasion assay in vitro. As shown in Fig. 5, BRAF V600E expression (treatment with doxycycline) robustly enhanced cell invasiveness in the presence of TSH (4H). However, deprivation of TSH (3H) significantly suppressed the invasive ability. These data also demonstrate that BRAF V600E and TSH cooperatively induce invasiveness in thyroid cells.
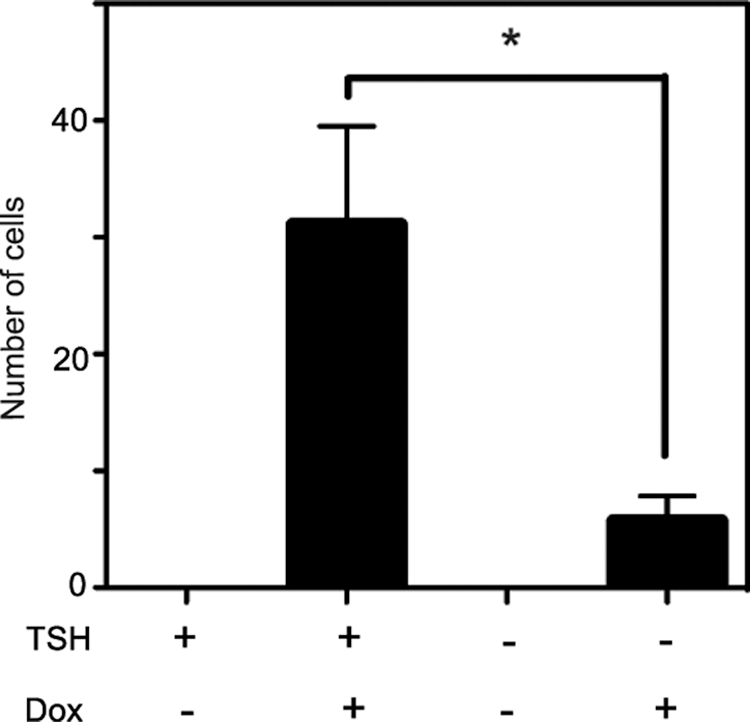
Effect of TSH and/or BRAFV600E on cell invasion. Invasion was examined using Matrigel and Transwell chambers. After TSH starvation for seven days, PC-BRAFV600E-6 cells were treated with or without doxycycline in the presence or absence of thyrotropin (TSH) for 24 hours, and subjected to Matrigel invasion assay. Each bar indicates mean and SEM of three wells. *p<0.05. Similar results were obtained in two independent experiments.
TSH signaling induces GIN
To explore the influence of TSH signaling and BRAF V600E on tumor growth and induction of aggressive features, we performed dual-label immunofluorescence for 53BP1 and Ki67. Representative merged images of each group are presented in Fig. 6A. The percentage of 53BP1 focus-positive and Ki67-positive cells was calculated. Regarding the comparison between group 3 and 4, the frequency of 53BP1 focus-positive cells in group 3 was significantly higher than that in group 4 in 24-week male and 12-week male mice (Fig. 6B). The frequency in 24-week female mice in group 3 also showed a higher trend compared to group 4. However, it did not reach statistical significance (Fig. 6B). Notably, the group 1 mice also exhibited higher percentages at 24 weeks, and the frequencies in female mice were generally higher than those in male mice (Fig. 6B). Regarding the proliferative index, Ki67 positivity in the group 1 and 2 mice was very low (Fig. 6B). By contrast, in groups 3 and 4, BRAFV600E robustly increased the Ki67-positive cells (Fig. 6B). However, there was no statistical difference between groups 3 and 4 (Fig. 6B). To confirm the above observations regarding GIN, we also used another DNA damage marker—γH2AX (phosphorylated H2AX at Ser-139). The frequency of γH2AX foci in group 3 was significantly higher than that in group 4 in all age/sex pairs (Fig. 6C). Similar findings were also obtained in vitro using the PC-BRAFV600E-6 cells (Fig. 6D).
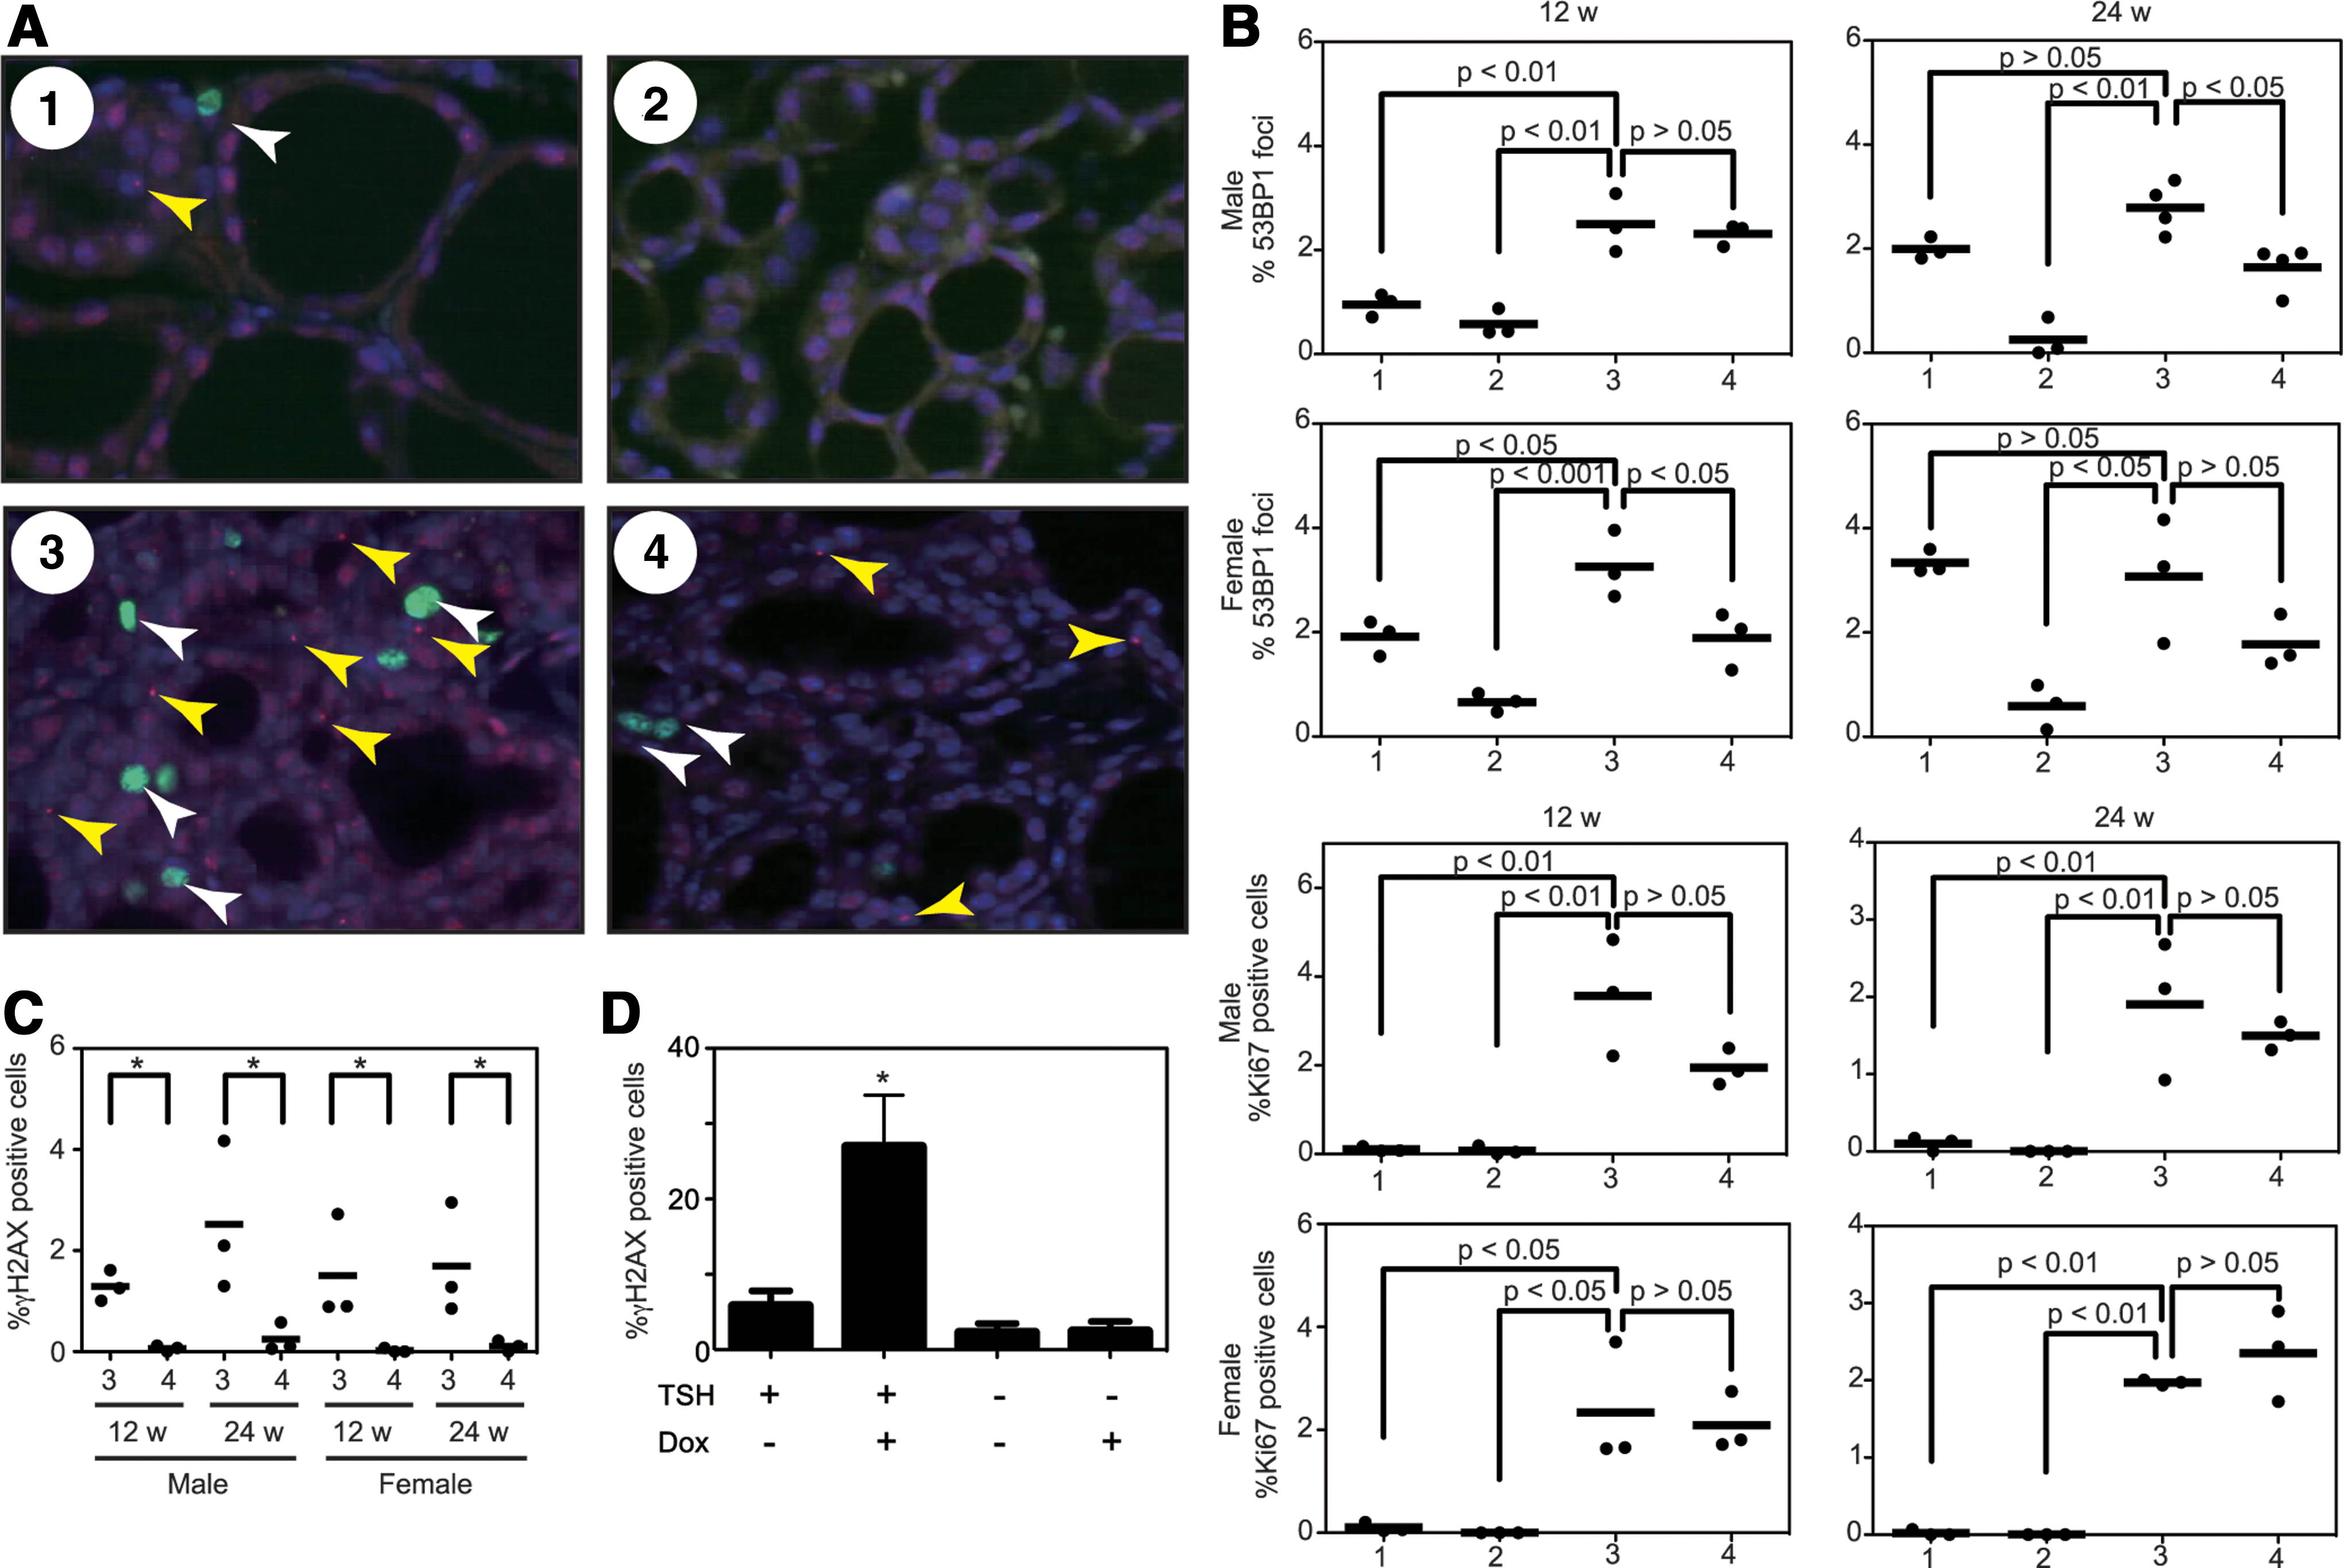
Evaluation of genomic instability and cell proliferative activity.
Discussion
In the present study, we show that TSH signaling confers more aggressive features in BRAF V600E-induced thyroid tumors in vivo. We utilized the Tg-BRAF2 mice in which the Tg gene promoter drives BRAFV600E expression in thyroid follicular cells (11). Even though Tg expression was highly suppressed in group 3 and group 4 mice thyroids, BRAF V600E expression was still maintained in both groups. This might be due to a lack of distant regulatory element(s) or particularities of the integration site of the transgene in this animal model. Compared with the first report of the Tg-BRAF2 mice (11), our group 3 mice (Tg-BRAF2/TshR +/−) showed weaker phenotypes: a lower percentage of tall cells (79–87% in (11) vs. 30–40% in group 3) and capsular invasion (73–93% in (11) vs. 20–30% in group 3). This is presumably due to hemizygosity of the TshR and consistent with the report by Franco et al. demonstrating that thyroid weights in LSL-Braf V600E/TPO-Cre/TshR +/− mice were approximately half of those in LSL-Braf V600E/TPO-Cre mice (14). Although growth, histology, and serum T3/T4/TSH levels were all normal in the TshR +/− mice (23), the influence of difference in TSH signal between wild type and TshR +/− on thyroid tumor formation is probably significant, especially with elevated serum TSH levels. These findings also suggest that TSH signaling plays an important role in BRAF V600E-induced thyroid tumorigenesis.
Although our current study and the report by Franco et al. (14) used similar mouse models (Tg-BRAF2 and LSL-Braf V600E/TPO-Cre respectively), there are some differences. First, Ii our model, BRAF V600E expression was supposedly induced from embryonic day 15, while in the model by Franco et al., the recombination of LSL-Braf V600E was gradually induced and completed until 7–10 days postnatally. Second, although our group 4 (Tg-BRAF2/TshR −/−) mice had some characteristics of human PTC such as tall cells and nuclear features at both 12 and 24 weeks, the LSL-Braf V600E/TPO-Cre/TshR −/− mice by Franco et al. did not show any nuclear features of human PTC at three weeks and no tall cells even at nine weeks. This difference might be due to the time of onset of the expression of the oncoprotein. Prolonged expression beginning at the embryonic stage may induce characteristic features of human PTC even in the absence of TSH signaling. Despite some differences, however, our overall results are quite consistent with the study by Franco et al. (14).
We analyzed GIN using immunofluorescence for 53BP1. Interestingly, 53BP1 foci formation in the group 1 mice was increased in a time-dependent manner (12 and 24 weeks) even though proliferation of thyrocytes (Ki67) was absent, suggesting that the foci were not caused by TSH-mediated DNA replication. Since Nis and thyroid peroxidase (Tpo) expression (but not Tg) was highly suppressed [(25) and our data] in mice with TshR −/−, oxidative stress by iodide and/or Tpo during thyroid hormonogenesis may be responsible for DSB formation. However, further research is needed to confirm this connection. On the other hand, in BRAF V600E-induced thyroid tumor cells, the frequency of 53BP1 foci in group 3 was also higher than that in group 4. Since the 53BP1 frequency in group 1 was lower than that in group 3 in 12-week-old mice, BRAF V600E (22) and TSH signaling may cooperatively induce GIN in thyrocytes. Our experiments showing an increased number of γH2AX foci strongly support this notion.
Our data in the present study suggest that the activity of the TSH signaling pathway confers more aggressive features in BRAF V600E-induced thyroid tumors in vivo. This might be due, in part, to accelerated genomic instability. Generally, these results suggest that TSH signaling plays an important role in tumor progression rather than tumor initiation in our model. Since several epidemiological studies have accumulated evidence of an association between serum TSH levels and risk of malignancy in patients with thyroid nodules (27 –30), the current study may provide additional insight in terms of prevention of this type of cancer.
Footnotes
Acknowledgments
We thank Dr. James Fagin (Memorial Sloan-Kettering Cancer Center) for kindly providing the Tg-BRAF2 mice and PC-BRAFV600E-6 cells. This work was supported in part by Grants-in-Aid for Scientific Research (NM #23591357, SY #22390189) from the Japan Society for the Promotion of Science.
Author Disclosure Statement
No competing financial interests exist.