
Abstract
Background:
FDG (2-[18F]Fluoro-2-D-deoxyglucose–positron emission tomography (PET)/computed tomography (CT), which can detect a change in glucose metabolism in cancer cells, has been introduced as a diagnostic and prognostic tool in papillary thyroid carcinoma (PTC). However, differences in the clinicopathological and biological characteristics between primary PTCs with FDG uptake and those without FDG uptake are not well established.
Methods:
A total of 188 patients with PTC who had preoperative PET/CT scans were enrolled to compare the differences of clinicopathological parameters between FDG-avid (F-PTC; n=150) and non–FDG-avid tumors (FN-PTC; n=38). Immunohistochemical staining for glucose transporter (GLUT)-1 and hypoxia-inducible factor-1 alpha (HIF-1α) was performed.
Results:
FN-PTCs were smaller; had a lower incidence of lymphatic invasion, vascular invasion, multifocality, and central lymph node metastasis; and had a lower maximum standardized uptake value than F-PTCs. After exclusion of high-risk patients for recurrence, FN-PTCs remained smaller (p<0.001) and had less lymphatic invasion (p=0.061). Among tumors larger than the spatial resolution of the PET/CT scan, macrocalcification was more frequent in FN-PTC than in F-PTC (p=0.043). While FN-PTC and F-PTC showed no difference in GLUT-1 expression (50% vs. 75%, p=0.363), FN-PTC showed lower HIF-1α immunoreactivity than F-PTC (25.0% vs. 75.0%, p=0.032).
Conclusion:
Tumor size and macrocalcification are clinicopathological differences between FN-PTC and F-PTC. Biologically, HIF-1α may be responsible for increased FDG uptake in PTC.
Introduction
To evaluate altered glucose metabolism associated with PET/CT scan in cancer, several biological markers related to glucose uptake and transport within the cell have been studied. Specifically, glucose transporters (GLUTs) are considered key components in inducing the high influx of glucose in many malignant cells (6). In particular, GLUT-1, which is responsible for basal glucose uptake, is closely associated with FDG uptake in several human cancers (7 –11). Hypoxia-inducible factor-1 alpha (HIF-1α), along with GLUT-1, also shows an association with FDG uptake in non–small-cell cancer (12) because increased glycolysis in cancer cells begins with increased production of HIF-1α, which regulates glucose transporter expression (2,13). Both GLUT-1 and HIF-1α are related to prognosis in various carcinomas, such as lung, oral, gastric, and colorectal cancers (12,14 –16).
Thyroid nodules that show focal uptake on PET/CT scan are likely to be thyroid tumors (17). Additionally, PET/CT scans are usually used to localize the disease in thyroglobulin (Tg)-positive, radioactive iodine (RAI) scan–negative patients during surveillance. The revised American Thyroid Association (ATA) guidelines (18) recommend PET/CT scan as an initial staging and follow-up tool for poorly differentiated or Hürthle cell carcinomas and as a prognostic marker for patients with known distant metastatic disease.
However, small parts of differentiated thyroid cancers (DTCs) that have been confirmed by postoperative pathology showed a negative preoperative PET/CT scan (19), raising the question of whether this finding was derived from false negativity of the PET/CT scan or from variation in glucose metabolism in the cancer cells. Previous reports have suggested that a preoperative PET/CT scan is useful for exclusion of malignancy in patients with indeterminate fine-needle aspiration results (20,21), and a FDG-avid lesion in PET/CT scan can be a poor prognostic factor in patients with thyroid papillary microcarcinomas (22). However, the mechanism of FDG avidity in primary DTC and its association with aggressive tumor behaviors has not been clearly explained. It is unknown whether area-occupying lesions within the tumors such as calcification, which is a frequent image finding in papillary thyroid carcinomas (PTC), might influence the FDG avidity of target lesions in a PET/CT scan. Otherwise, the biological activity of glucose uptake and transport in each tumor might cause differences in the FDG uptake on PET/CT scan. This hypothesis can be validated clinically by comparing clinical images and characteristics between PTCs with and without FDG uptake, and it can be validated experimentally by evaluating biological tumor markers related to glucose metabolism and tumor behaviors.
Therefore, the aim of this study was to explore the clinical and biological implications of non–FDG-avid PTC by comparing the clinicopathological parameters between FDG-avid and non–FDG-avid PTCs and by evaluating differences in representative biological markers, such as GLUT-1 expression.
Materials and Methods
Subjects and clinicopathological evaluation
From January 2007 to August 2010, patients with PTC who had undergone total thyroidectomy were screened for the study. Patients who had a preoperative PET/CT scan within 1 year before surgery were enrolled in the study (n=188). The reasons for the PET/CT scans were as follows: routine health check-up for cancer detection (group 1, n=22 [11.7%]), follow-up for cancers other than thyroid carcinoma (group 2, n=64 [34%]), or preoperative staging of thyroid carcinoma suspicious for metastasis (group 3, n=102 [54.3%]). We compared the differences in clinicopathological parameters between patients with FDG-avid PTC (F-PTC) and patients with non–FDG-avid PTC (FN-PTC). Clinical information included age at diagnosis, sex, reason for PET/CT scan, preoperative Tg level, implementation of RAI ablation therapy, and Tg level at the time of RAI ablation therapy. Imaging characteristics of the tumor identified by ultrasound (US) or CT scan, such as macrocalcification, were also evaluated. Macrocalcification included both coarse and peripheral calcifications identified by US, which were defined in a previous report (23), and also included calcification identified by CT scan. Basic pathological parameters, such as tumor size, degree of tumor extension, and lymph node involvement, along with the presence of combined thyroid disease, were also included in the study. Data regarding BRAF mutation within the tumor were also collected if available (n=86, 45.7%). The mutational status of BRAF, including the BRAF V600E mutation, was evaluated by direct sequencing.
PET/CT scan imaging
All patients fasted for at least 6 hours before the PET/CT study. 18F-FDG was injected intravenously (370–555 MBq), and scanning began 60 min later. None of the patients had a blood glucose >130 mg/dL before the injection. No intravenous contrast agent was administered. Data were acquired on three combined PET/CT inline systems (Biograph Duo or Biograph TruePoint, Siemens Medical Solutions, Knoxville, TN). The acquisition time was 2–3 min per bed position. All patients were in a supine position with their arms raised. CT began at the orbitomeatal line and progressed to the upper thigh (130 peak kilovoltage [kVp], 80 mA tube current, and 5 mm slice thickness; 120 kVp, 50 mA tube current, and 5 mm slice thickness; 120 kVp, 70–100 mA tube current, and 5 mm slice thickness). PET followed immediately over the same body region. The axial spatial resolution was 6.5 mm (n=78), 4.5 mm (n=87), and 4.2 mm (n=23) at the center of the field of view.
PET/CT scan analysis
PET/CT scans were reviewed by two experienced nuclear medicine physicians. They were informed of all clinical and pathological data for the detection of FDG-avid PTC. In the case of multiple tumors, the dominant lesion for tumor progression was selected for interpretation. All lesions identified by PET/CT scan were classified as focal discrete, diffuse, or no-FDG-uptake lesions. Discernible lesions with focal discrete FDG uptake were reviewed along with pathological reports and other anatomical images (such as CT scan or US images) and then confirmed as F-PTC. In the case of FDG activity with no clear-cut margin from background FDG activity or no perceptible FDG activity, a matched CT scan or US image with an identified lesion was reviewed to detect an FDG-avid tumor that was missed or masked by diffuse FDG uptake. Otherwise, PTCs with diffuse FDG uptake or no FDG uptake were defined as FN-PTC. The maximum standardized uptake value (SUVmax) was calculated in a region of interest, which was drawn based on the location of the tumor according to functional (PET scan) or anatomical images (CT scan or US images).
Immunohistochemical staining of proteins associated with glucose uptake in DTC
Patients with FN-PTC (n=8) in whom the tumor size was above the spatial resolution of the PET/CT scans and patients with F-PTC matched for age at diagnosis, sex, and size of tumor (n=16) were included in the immunohistochemical (IHC) examination. Samples from these cases were reviewed by one experienced pathologist to select appropriate tumor sections that contained enough viable malignant cells for IHC staining. Formalin-fixed and paraffin-embedded tissue blocks were processed into 4-μm-thick sections. The slides were deparaffinized and rehydrated with xylene and graded ethanol solutions, respectively. For proper antigen retrieval, tissue sections were heated at 95°C for 20 minutes in Target Retrieval Solution (Dako, Glostrup, Denmark) and citrate acid buffer (pH 6.0) using a PT Link (Dako). The slides were incubated in Dako REAL™ peroxidase-blocking solution (Code S2023) for 10 minutes to quench endogenous peroxidase activity. After incubation with the proper blocking antibody, the slides were incubated with a polyclonal antibody to GLUT-1 (1:200; Abcam, Cambridge, MA) and HIF-1α (1:100; Novus, Littleton, CO) overnight at 4°C. The immunoreactivity of each antibody was visualized using the Dako REAL DAB+ Chromogen (Dako, Code K5007) detection system. Counterstaining with hematoxylin was performed on all slides.
Immunoreactivity of GLUT-1 and HIF-1α was evaluated by two experienced pathologists who had no information regarding the PET/CT results. Any discrepancy was resolved by discussion between the two pathologists. An immunoreactive score (IRS) for GLUT-1 was calculated by multiplying the score of the percentage of stained cells (0=0%; 1=<10%; 2=10%–40%; 3=40%–70%; 4=>70%) by the score of intensity (0=absent; 1=weak; 2=intermediate; 3=strong). Based on the IRS, immunoreactivity of GLUT-1 was classified as negative (IRS=0), weakly positive (IRS ≤2), or highly positive (IRS >2). The staining pattern, cytoplasmic or membranous, of GLUT-1 expression was also interpreted.
Immunoreactivity of HIF-1α was evaluated separately according to intracellular location. For cells with cytoplasmic staining, the intensity (absent, weak, or strong) and the extent (the four IRS grades based on the percentage of stained cells) were assessed. In terms of nuclear staining, only the presence or absence of nuclear positivity for HIF-1α was recorded. Finally, immunoreactivity of HIF-1α was classified as low reactivity (no or weak cytoplasmic stain) or high reactivity (moderate or strong stain with more than 40% of cells) based on similar criteria as described in previous studies (24 –27). A breast carcinoma sample with known GLUT-1 and HIF-1α expression was used as a positive control, and the same sample was used as a negative control by replacing the primary antibody with PBS.
Statistical analyses
All data analyses were conducted with SPSS (version 12.0 software: SPSS Inc., Chicago, IL). According to the FDG avidity, categorical variables were compared by the chi-square or Fisher's exact test. Continuous variables were evaluated by the Mann-Whitney U test. For multivariate analysis, a binary logistic regression test was performed using variables that were statistically significant on univariate analysis, and odds ratios (ORs) and 95% confidence intervals (CIs) were calculated.
Results
Clinicopathological characteristics of study subjects and comparison between FN-PTC and F-PTC
Thirty-eight of 188 (20.2%) patients showed no FDG uptake in their tumors at diagnosis (Table 1). FN-PTC comprised 34.3% (35/102) of cases of papillary thyroid microcarcinomas (PTMC). F-PTC tumors were larger, had a higher SUVmax, and had a higher incidence of lymphatic invasion, vascular invasion, multiplicity, and central lymph node metastasis than FN-PTC (Table 2). The BRAF V600E mutation, which was evaluated in 86 patients (45.7%), was more frequent in patients with F-PTC, though this difference was not significant (82.3% vs. 62.5%, p=0.052).
Data are presented as number/total (percent) or as mean±standard deviation.
Evaluated only in available cases.
PTC, papillary thyroid carcinoma; PET/CT, positron emission tomography/computed tomography.
Data are presented as number/total (percent) or as mean±standard deviation.
SUVmax, maximum standardized uptake value; FDG, 2-[18F]fluoro-2-D-deoxyglucose.
PTCs with large size, lymphatic invasion, and lateral lymph node metastasis were more frequent in patients from group 3, who were preoperatively evaluated by PET/CT for detection of suspicious metastatic thyroid cancers, than in patients from groups 1 and 2. Even after excluding group 3 to minimize selection bias, FN-PTC tumors remained smaller (0.55±0.21 vs. 1.09±0.64 cm, p<0.001), had a lower SUVmax (1.70±0.44 vs. 4.92±4.60, p=0.000), and had a lesser tendency for lymphatic invasion (p=0.061) than F-PTC. In group 3, tumor size was also larger in patients with FDG-avid tumors than in patients with non–FDG-avid tumors (0.75±0.35 vs. 1.64±1.42 cm, p=0.019).
Since there was a concern of a partial volume effect on FDG avidity in addition to selection bias, a subgroup (n=67; from groups 1 and 2), in which the tumor size was greater than the spatial resolution of the PET/CT scan, was analyzed to minimize the effect of tumor size on FDG uptake. Tumor size was the only factor that was significantly associated with FDG avidity (Table 3). However, in a multivariate analysis, macrocalcification (p=0.030, OR=0.136 [CI 0.022–0.827]) and tumor size (p=0.034, OR=1.60 [CI 1.036–2.467]) were the independent factors associated with increased FDG avidity.
Data are presented as number/total (percent) or as mean±standard deviation.
Expression of GLUT-1 and HIF-1α by IHC staining
Immunoreactivity for GLUT-1 was found in 66.7% of cases. The pattern of staining was cytoplasmic (Fig. 1A) in all immunoreactive cases except two (cases 10 and 23), which showed focal membranous staining (Fig. 1B) along with cytoplasmic staining. F-PTC and FN-PTC showed positive GLUT-1 staining (weakly positive or positive) in 75% and 50% of cases, respectively, and no significant difference was found in GLUT-1 expression (p=0.363).
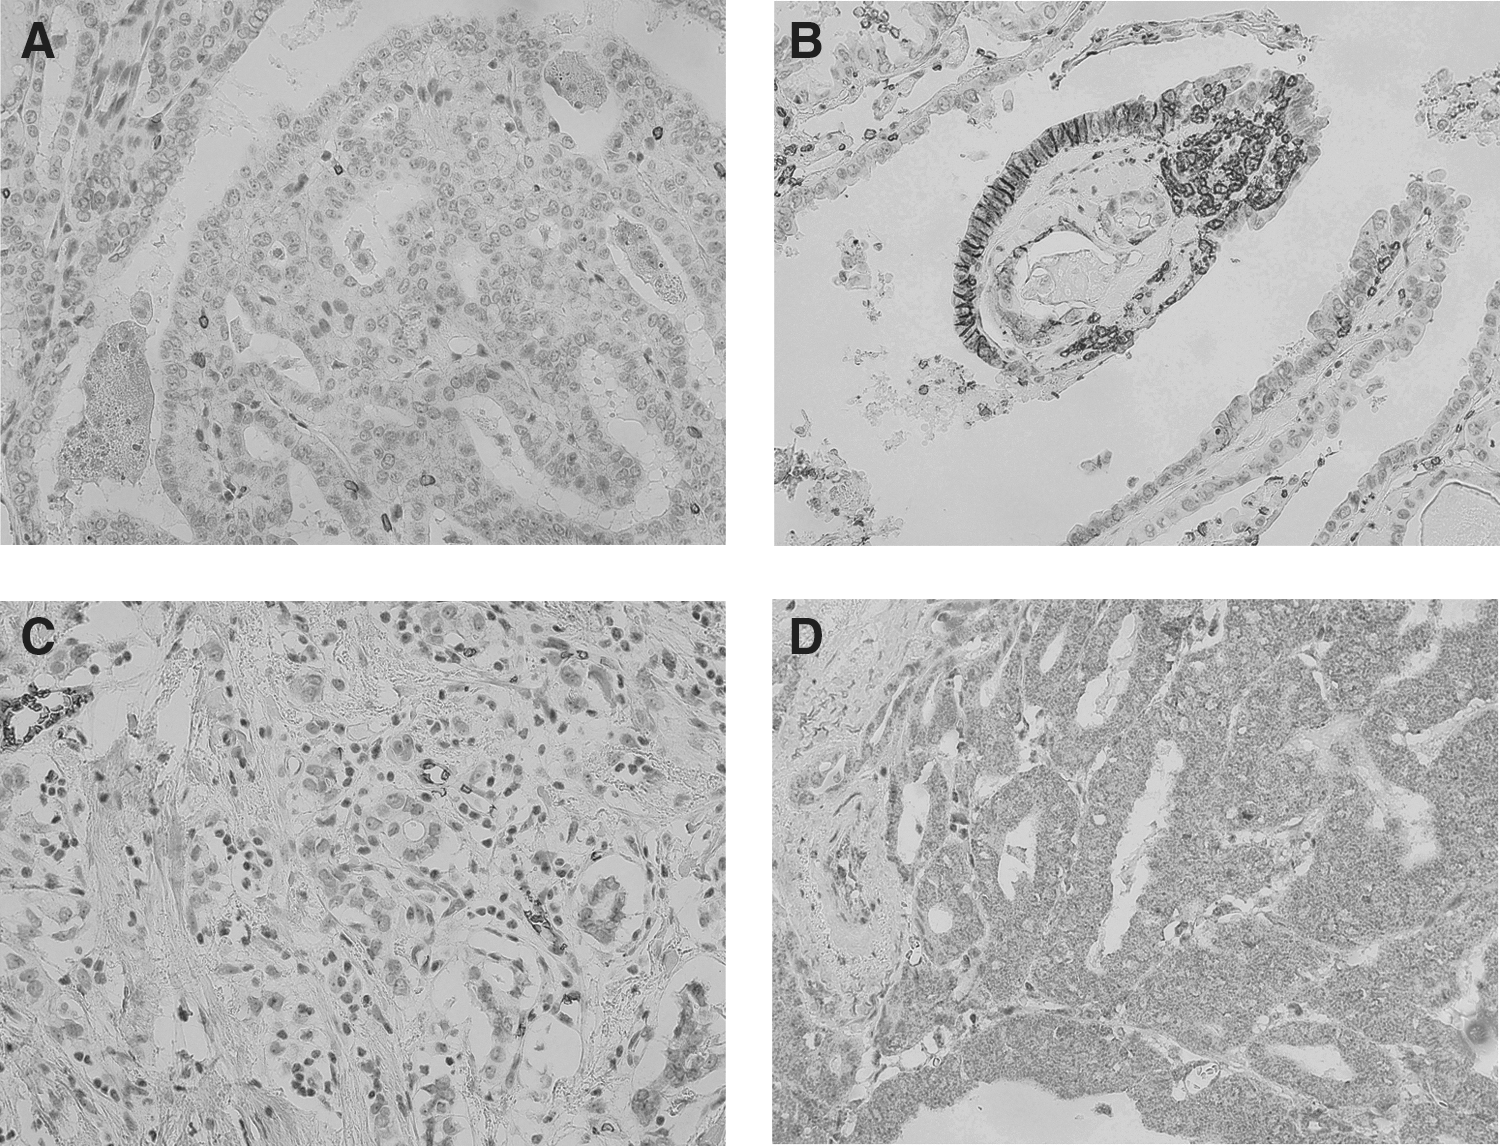
Cytoplasmic staining of HIF-1α (Fig. 1D) was observed in most tumors (22/24, 91.7%). There were more F-PTC cases with high HIF-1α immunoreactivity (moderate to strong staining in more than 40% of cells) than FN-PTC (75.0% vs. 25.0%, p=0.032). However, no nuclear staining of HIF-1α was found in the study.
No significant correlation between immunoreactivity of HIF-1α (low or high reactivity) and that of GLUT-1 (negative, weakly positive, or highly positive) was found (p=0.340). There were seven cases with low immunoreactivity for GLUT-1 and high immunoreactivity for HIF-1α, and there were two cases with high immunoreactivity for GLUT-1 and low immunoreactivity for HIF-1α. The IHC results are summarized in Tables 4 –6.
Intensity: A, absent; W, weak; I, intermediate; S, strong.
Immunoreactive score (IRS) was calculated by multiplying the score of the percentage of stained cells (0=0%; 1=<10%; 2=10%–40%; 3=40%–70%; 4=>70%) with the score of intensity (0=absent; 1=weak; 2=intermediate; 3=strong).
Pattern: C, cytoplasmic; M, membranous.
N/A, not applicable; N, no.
Immunoreactivity for GLUT-1 was estimated by 3 categories based on IRS: negative (−), weakly positive (+), or highly positive (++).
Immunoreactivity for HIF-1α was classified as low immunoreactivity (L) or high immunoreactivity (H) based on IRS.
F, female; M, male; Y, yes; ETE, extrathyroidal extension.
Discussion
The present study evaluated both clinicopathological and biological characteristics of primary thyroid carcinomas according to FDG avidity. Recently, characteristics, including expression of GLUT-1 and vascular endothelial growth factor, of primary thyroid cancer with FDG avidity were presented in patients with underlying malignancy other than thyroid (28). It showed no difference except for expression of GLUT-1 existed between patients with synchronous thyroid cancer and patients with primary thyroid cancer. However, there have been no studies characterizing non–FDG-avid primary PTC. The incidence of PTC showing false-negative results in PET/CT scans is reportedly 22.6% in cases of PTC (29) and 47% in cases of PTMC (22). Despite having different study populations, the proportions of non-avid tumors on PET/CT scan in our study (20.2%) were similar to previous studies. Non–FDG-avid tumors in PTMC were found in 34.3% of our study population, which is lower than a previous report, and this is possibly due to a different definition of non–FDG avidity (22).
Our study shows that tumor size is independently associated with FDG avidity on PET/CT scan regardless of subgroup or other clinicopathological parameters. Correlation between the tumor size and FDG uptake represented by SUVmax has been reported in various cancers (30 –32) and even in benign tumors (33). Thyroid cancer also frequently shows a relationship between FDG uptake and tumor size (34,35).
Tumors smaller than the spatial resolution may be underestimated by approximately 50% of real FDG accumulation, which is known as a partial volume effect (36). Therefore, tumors that are smaller than the spatial resolution of the PET/CT scan may be more likely to be masked in the background of a normal thyroid, which generally shows faint FDG uptake (37). However, our data demonstrate that tumor size was still associated with FDG avidity even after exclusion of tumors smaller than the spatial resolution of the PET/CT scan to minimize the partial volume effect.
When we adjusted for tumor size in the combined groups 1 and 2 (incidentaloma groups), macrocalcification within the tumor was related to a decrease in FDG uptake. Although only one report on esophageal carcinoma has suggested that cancer cell proportion does not influence FDG uptake (38), it could be assumed that no or less active transport of glucose might exist in such calcified areas that do not contain viable tissue. Accordingly, the more calcified portions a tumor has, the less FDG uptake the PET/CT scan may show in the tumor. A prior study evaluating metastatic papillary carcinoma also suggested that lesions with calcification exhibit low FDG accumulation (39).
Although previous studies of advanced or metastatic thyroid carcinomas revealed poor prognosis in patients with FDG-avid lesions (40,41), the data supporting the aggressiveness of primary thyroid carcinomas with FDG avidity before surgery are not sufficient. Our study shows no difference in the clinical and pathological parameters, except for tumor size, associated with poor prognosis between patients with F-PTC and those with FN-PTC, which is contrary to previous studies (22,29). In those studies, tumor size was also associated with FDG avidity, but no analyses were performed to exclude small tumors to minimize the partial volume effects. Additionally, calcification, which is often found in PTC, was not taken into account. Given the tumor size and heterogeneous calcification patterns, the designation of primary thyroid carcinomas with non–FDG-avidity as a less aggressive disease should be made with caution.
No differences in clinicopathological features were found between patients with FDG-avid and non–FDG-avid PTCs, with the exception of tumor size and calcification, which led us to evaluate the biological marker expression to validate FDG uptake in cancer cells.
GLUTs are the first rate-limiting proteins for glucose transport into cells. GLUT-1 is overexpressed and correlated with FDG uptake in several cancers (8,10,12,42). Increased GLUT-1 expression has been associated with dedifferentiated thyroid carcinomas or carcinomas with poor prognosis (43). In contrast, GLUT-1 is not expressed in DTC (44). A recent study of DTCs that were found incidentally in PET/CT scans showed that FDG uptake in the tumor was not associated with the expression of proteins involved in glucose metabolism, such as GLUT-1 and HIF-1α (45).
Our results show no significant difference in the expression of GLUT-1, a key glucose transporter, between patients with F-PTC and those with FN-PTC. This suggests that GLUT-1 might not be the main protein responsible for increased FDG uptake in PTC. Specifically, a considerable number of primary thyroid cancers (33.3%) showed no immunoreactivity of GLUT-1, and membranous staining of GLUT-1 was rarely found, in agreement with recent studies (44,45). Fewer than 50% of PTC tumors were highly positive for GLUT-1. The contradictory results of GLUT-1 compared with other studies might be derived from the differences in the study populations. Previous studies using IHC to detect the expression of GLUT-1 in thyroid carcinomas (43,46) included more aggressive and dedifferentiated thyroid carcinomas than our study did. In another study, there was no description of the pathological features of the thyroid carcinomas (47). Since increased GLUT expression and transport activity are closely related to tumor growth (6), one possible explanation for the lack of overexpression of GLUT-1 in thyroid carcinomas, unlike other cancers, might be the slow growth pattern of PTC in most clinical settings.
HIF-1α, which is induced by hypoxia and is a major regulator of proteins involved in glucose metabolism, is related to FDG uptake and poor prognosis in various cancers (12,24,25,48 –50). Expression of HIF-1α was not studied extensively in thyroid carcinomas, but recently, an association with mutations in the BRAF gene, which is the most frequently mutated gene in thyroid carcinoma, was suggested (51). Contrary to GLUT-1, a significant difference was found in the immunoreactivity of HIF-1α according to FDG avidity. As F-PTC showed higher immunoreactivity than FN-PTC, HIF-1α might have a crucial role in FDG uptake in DTC. Considering that HIF-1α is induced by a hypoxic microenvironment, which appears to be common within cancerous lesions, and that it regulates the expression of diverse proteins involved in glucose metabolism, increased FDG uptake might be mediated by a HIF-1α–induced protein other than GLUT-1. This possibility is supported by the fact that no correlation was found between the expression of GLUT-1 and HIF-1α in our study.
A major limitation of our study could be selection bias induced by including thyroid cancer patients who underwent PET/CT scan as an initial staging tool. Selection bias might also exist in the analyses of patients with other cancers who underwent PET/CT scan as a follow-up tool. Lack of long-term follow-up data and a sufficient number of samples for IHC to achieve a significant difference might be another limitation.
In conclusion, lack of FDG uptake in primary PTCs was caused by smaller tumor size and macrocalcifications, which might reduce the proportion of viable cells within them. Otherwise, no differences in clinicopathological parameters were found between patients with F-PTC and those with FN-PTC. In terms of the biological mechanism of FDG uptake, HIF-1α, not GLUT-1, is expected to play a major role in primary PTC.
Footnotes
Acknowledgments
A portion of these results was presented in abstract form at the 14th International Thyroid Congress, Paris, France, 2010. This work was funded by the Bumsuk Academic Scholarship Foundation.
Disclosure Statement
The authors declare that there is no conflict of interest that could be perceived as prejudicing the impartiality of the research reported.