
Abstract
Background:
An in-depth understanding of the fundamental principles that regulate thyroid hormone homeostasis is critical for the development of new diagnostic and treatment approaches for patients with thyroid disease.
Summary:
Important clinical practices in use today for the treatment of patients with hypothyroidism, hyperthyroidism, or thyroid cancer are the result of laboratory discoveries made by scientists investigating the most basic aspects of thyroid structure and molecular biology. In this document, a panel of experts commissioned by the American Thyroid Association makes a series of recommendations related to the study of thyroid hormone economy and action. These recommendations are intended to promote standardization of study design, which should in turn increase the comparability and reproducibility of experimental findings.
Conclusions:
It is expected that adherence to these recommendations by investigators in the field will facilitate progress towards a better understanding of the thyroid gland and thyroid hormone dependent processes.
INTRODUCTION
O
While certain experimental techniques have been widely accepted and adapted following their use in papers generated by influential labs, lack of standardization has undoubtedly promoted heterogeneity of results. Because certain experimental variables may have unknown biological threshold levels, lack of standardization may lead to have highly discordant results in different studies examining the same issue.
To address this lack of standardization, the American Thyroid Association (ATA) convened a panel of specialists in the field of basic thyroid research to define consensus strategies and approaches for thyroid studies in rodents and in cell models. This task force was charged with reviewing the literature first to determine which experimental practices could benefit from standardization and second to identify critical experimental variables that demand consideration when thyroid studies are being designed. The conclusions of the task force are presented in this document as “American Thyroid Association Guide to Investigating Thyroid Hormone Economy and Action in Rodent and Cell Models.” The 70 recommendations and their accompanying commentaries examine topics ranging from “making cells hypothyroid” to “how to study the thyrotoxic bone.” While far from exhaustive, these recommendations touch on certain fundamental aspects of thyroid research relevant for all investigators in the field.
Each recommendation in this guide promotes a particular experimental approach based on criteria including the prevalence of the approach, with widely used techniques being given precedence, and in particular whether the approach has been shown to lead to reproducible results in studies by independent investigators. Because head-to-head scientific comparisons of experimental methods in this field are virtually nonexistent, these recommendations cannot be graded on the basis of strength of evidence in the fashion of clinical guidelines; indeed, all would be graded as “expert opinion.” At the same time, unlike clinical guidelines, the main goal of these recommendations and their accompanying commentaries is not to identify the single best practice per se, but instead to encourage investigators to choose standard approaches; for example, avoiding random treatment doses or methods of thyroid hormone administration, which would only serve to limit comparison with previous studies.
The practical nature of recommendations should become readily apparent to the reader. This document is intended to serve as a reference for investigators, assisting them in making design choices that avoid well-known pitfalls while increasing standardization in the field. As part of this practical approach, reference credit is often given to manuscripts in which the technical details are most clearly or comprehensively explained, rather than the first publication to use a technique. In addition, emphasis was placed on contemporary approaches, rather than historical strategies, such that the document illustrates what is currently available for the contemporary study of thyroid hormone homeostasis, metabolism, and action. It is the position of the ATA that animal studies should be performed in accordance with all applicable ethical standards and research protocols approved by local institutional animal committees.
METHODS OF DEVELOPMENT OF RECOMMENDATIONS
Administration
The ATA Executive Council selected a chairperson to lead the task force, and this individual (A.C.B.) identified the other 14 members of the panel in consultation with the ATA board of directors. Membership on the panel was based on expertise and previous contributions to the thyroid field. Panel members declared whether they had any potential conflict of interest during the course of deliberations. Funding for the guide was derived from the ATA and thus the task force functioned without commercial support.
To develop a useful document, the task force first developed a list of the topics that would be most helpful and the most important questions that scientists working in the thyroid field might pose when planning an experiment or interpreting experimental data. Each of the 10 topics was distributed to a primary writer who used his or her knowledge of the subject as well as a systematic PubMed and Google Scholar search for primary references, reviews, and other materials publicly available before December 2012, to develop a set of recommendations. All drafts were reviewed and edited by the chair for consistency and sent back to the primary writers for review; in some cases multiple iterations took place until the recommendation was finalized. A preliminary draft of each recommendation was then reviewed by secondary and tertiary reviewers within the group who then prepared additional critiques. These were addressed by the primary writer and sent back to the chair. All drafts were merged and posted at a protected web address available only to the task force members and ATA office. This document remained available for periodic review by the task force at large, with critiques and suggestions sent back to the chair that updated the document. In a few cases the chair asked for outside experts to critically review specific recommendations given their expertise in a focused area. Their comments and suggestions were then worked into the master document, and the contributions are acknowledged at the end of this article.
The panel agreed that recommendations would be based on consensus of the panel. Task force deliberations took place largely through electronic communication. There were also a few meetings of the authors and telephone conference calls.
Presentation, Approval, and Endorsement of Recommendations
The structure of our recommendations is presented in Table 1. Specific recommendations are presented within the main body of the text and in many cases broken down in subitems identified by letters. The page numbers and the location key can be used to quickly navigate to specific topics and recommendations.
T3, 3,3′,5-triiodothyronine; TR, thyroid hormone receptor; PCR, polymerase chain reaction.
Prior to the initial submission of these guidelines, they were approved by the board and executive committee of the ATA and afterwards submitted to the membership of the ATA in early 2013 for comments and suggestions. This feedback was considered in the further preparation of the document that was submitted for publication. Subsequent to the document being accepted for publication in Thyroid, it was approved by the board and executive committee of the ATA.
The final document was officially endorsed by the American Academy of Otolaryngology–Head and Neck Surgery (AAO-HNS), American Association of Endocrine Surgeons (AAES), American College of Nuclear Medicine (ACNM), Asia and Oceania Thyroid Association (AOTA), British Nuclear Medicine Society (BNMS), British Thyroid Association (BTA), European Thyroid Association (ETA), International Association of Endocrine Surgeons (IAES), Italian Endocrine Society (SIE), Japan Thyroid Association (JTA), Korean Society of Head and Neck Surgery (KSHNS), Latin American Thyroid Society (LATS), Korean Society of Nuclear Medicine (KSNM) and The Endocrine Society (TES).
RESULTS
[A] Assessing the Thyroid Gland
Overview
Studies of function–structure relationship of the thyroid gland, as well as studies of thyroid iodide kinetics and imaging are traditionally employed to assess the thyroid gland. Structural characterization is important to assess functional changes such as hypo- and hyperthyroidism and for evaluating transformation of thyroid cells into a malignant phenotype (1 –3). At the same time, the study of thyroidal iodide economy and thyroid imaging are relevant not only to studies of thyroid hormone synthesis but also to understanding the effects of environmental toxins such as perchlorate or thiocyanate on thyroid economy (4 –7).
[A.1] Structure–function relationships
Background
While the human thyroid consists of a left and a right lobe that are connected by an isthmus, rodents have two independent thyroid lobes. The thyroid gland is divided by connective tissue septa into lobules, each one of these containing from 20 to 40 follicles, the basic functional unit of the thyroid gland. The follicle is a round or elongated hollow structure lined by a single layer of polarized cuboidal or flattened follicular cells that is filled with thyroglobulin-containing colloid. It is surrounded by a basal membrane and a rich capillary network with high blood flow (8). The follicles normally vary considerable in size, and the follicular cell morphology is usually monotonous. The height of the cells varies according to the functional status of the gland.
Morphometry of thyroid follicles can be used as an index of thyroidal activity.
Commentary
The entire gland should always be dissected while attached to the trachea and immediately fixed with 10% neutral buffered formalin for histological and immunohistochemical analysis. Hematoxylin and eosin (H&E) staining is widely used to assess the thyrocytes, whereas periodic-acid Schiff staining stains thyroglobulin avidly and is well suited to highlight follicular protein content and follicular structure (Fig. 1) (8). Structural modifications reflect changes in secretory activity resulting from iodine deficiency (9), chronic cold exposure (10), or treatment with antithyroid drugs (11). Some follicular cell parameters such as height can be measured under light microscopy using an ocular micrometer grid (e.g., in a 1-month-old rat, the epithelial cell height is about 10 μm) (12). A flat epithelium is hypoactive, while a heightened epithelium is observed in glands in which the thyrotropin (TSH) pathway is stimulated (10). The use of computerized semiautomatic image analysis is more objective and used widely (13). Such morphometric analysis should be focused on one of the central sections of the thyroid (13) that is representative of the whole lobe (14). The data obtained are reduced by predefined mathematical models that assume thyroid follicles have a spherical shape and follicular cells are octagons with a square base. This data reduction yields the following parameters: mean follicle circumference; surface area and volume; total volume of epithelium and colloid; number of epithelial cell nuclei visible in each follicle; and the height, surface area, and volume of thyroid epithelial cell, which can be used to estimate the functional state of the thyroid gland. Thus, the activation index, expressed by the epithelial volume/colloid volume ratio, increases as the thyroid becomes more active, reflecting an increase in the epithelial volume and a decrease in the colloid volume (13). Measurement of total cell volume in cultures of primary thyrocytes or cell lines cultured in vitro can be performed using confocal laser-scanning microscopy after cells are loaded with octadecylrhodamine B (15,16).
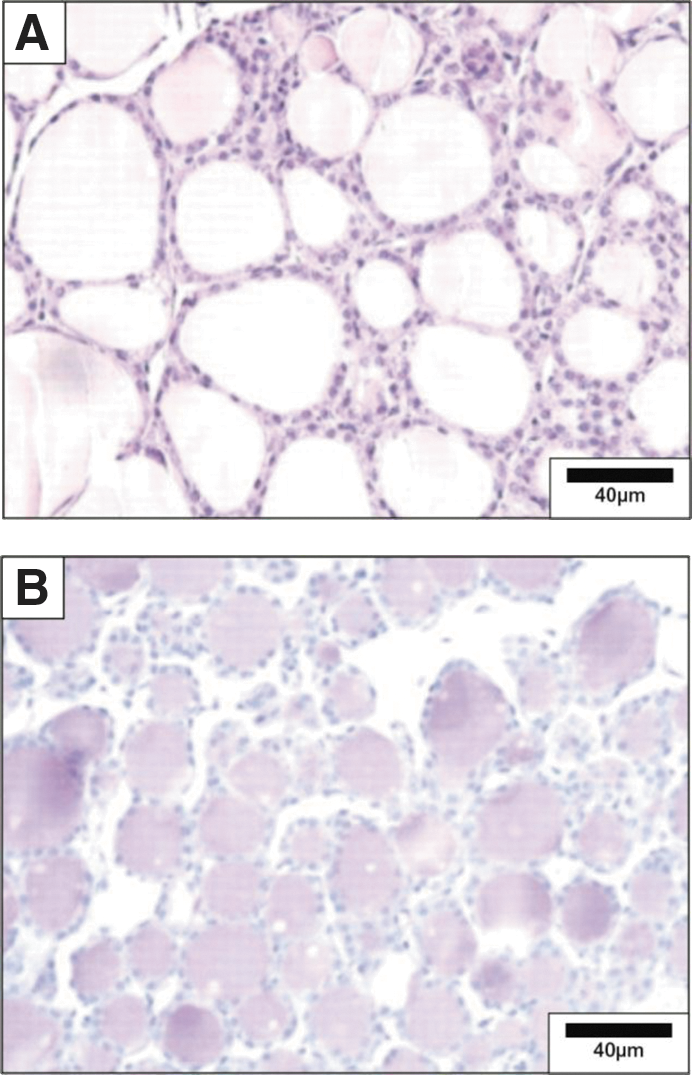
Microscopic structure of the mouse thyroid.
Autoradiography can be used to quantify the overall activity of thyroid follicles and to determine the location of iodide within follicles.
Commentary
Thyroid follicular cells concentrate iodide according to their activity. Although the activity of the thousands of follicular cells should be similar within a given thyroid gland, there is a great deal of variation among cells within the same follicle and between follicles. Thus autoradiography provides unique insights into the activity of individual thyroid follicular cells.
125I is injected intravenously, typically 48 to 72 hours prior to killing the animal. Thyroid glands are dissected and processed for autoradiography using standard techniques (17,18). Organification of iodide can be blocked by treatment of the animals with methimazole (MMI). Autoradiography experiments with human, rodent, and feline goiter tissue have also been performed after xenotransplantation of thyroid tissue into nude mice. Subcutaneously implanted fragments are maintained in recipient mice for several weeks before further analysis (19).
The ultrastructural distribution of iodide within thyroid follicles can be defined with secondary ion mass spectrometry (SIMS).
Commentary
SIMS is a technique used to analyze the composition of thin films by sputtering the surface of the specimen with a focused primary ion beam and collecting and analyzing ejected secondary ions (Fig. 2). The mass/charge ratios of these secondary ions are measured with a mass spectrometer to determine the elemental, isotopic, or molecular composition of the surface to a depth of 1–2 nm. SIMS is the most sensitive surface analysis technique, with elemental detection limits ranging from parts per million to parts per billion. It is uniquely suited for the study of trace ions distribution at the ultrastructural level (20).

Mouse thyroid transmission electron microscopy. Thyroid lobes were fixed in 2.5% glutaraldehyde in 0.1 M cacodylate buffer for 1.5 hours, post-fixed in 1% osmium tetroxide for 1 hour, and embedded in LX112 resin (Ladd Research Industries, Burlington, VT).
Ionic images show that the early distribution of iodine is heterogeneous from one follicle to another, from one thyrocyte to another inside the same follicle, and that this distribution varies as a function of time (21). In normal thyroids the natural 127I isotope is found predominantly in the follicular lumina. The identification of lumina devoid of 127I and/or the demonstration of significant amounts of 127I in the cytoplasm of the epithelial cells or on the apical membrane indicates impairment of the iodination pathway. To define the ultrastructural distribution of iodide using SIMS, thyroid lobes are processed in a similar way as for electron microscopy, including fixation with glutaraldehyde and preparation of semithin sections (20).
Confocal microscopy in conjunction with immunohistochemistry (IHC) can be used for two- or three-dimensional (2D or 3D) image reconstruction to study protein expression in thyroid follicles, the surrounding capillary network, and the stroma.
Commentary
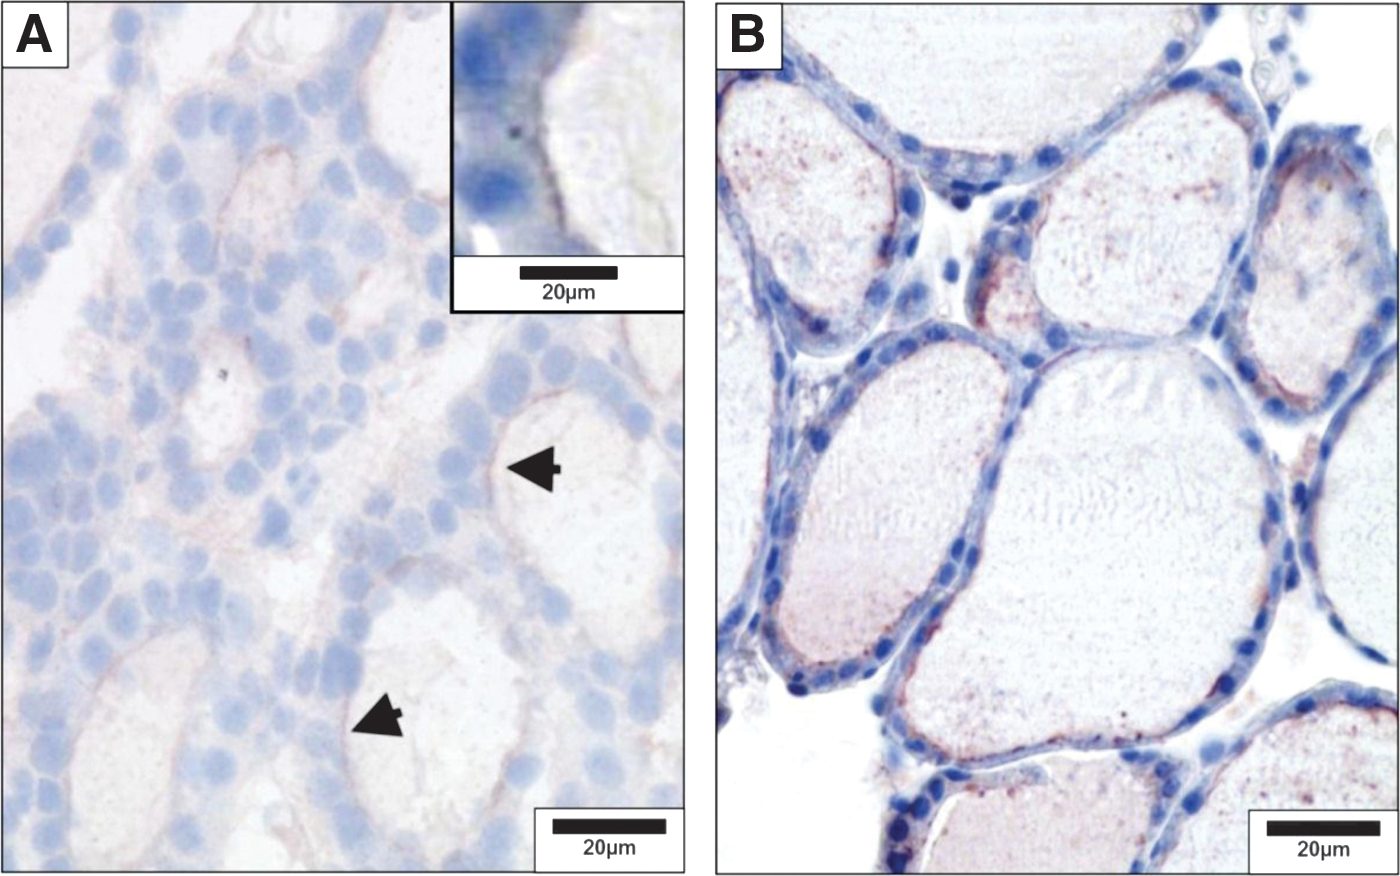
Antibodies are available against most key proteins in thyrocyte biology (22,23). Thus, standard IHC techniques are commonly used in thyroid studies (Figs. 3 and 4) (24,25). Visualization can be performed with conventional light microscopy, immunofluorescence microscopy, or confocal microscopy for higher resolution and 2D or 3D image reconstruction (26). Cell surface proteins and processes are best investigated using scanning electron microscopy (10).

Detection of thyroglobulin and iodinated thyroglobulin in the mouse thyroid by immunohistochemistry.
Detection of dual oxidase (DUOX) and thyroperoxidase in the mouse thyroid by immunohistochemistry.
Endogenous peroxidase activity is very high in thyroid cells and is detected by reacting fixed tissue sections with 3,3′-diaminobenzidine substrate; pretreatment with hydrogen peroxide prior to incubation with primary antibody eliminates endogenous peroxidase activity that will interfere in IHC studies. The use of fluorescent-tagged proteins should be avoided if autofluorescence is a problem (as assessed by viewing tissue sections with a fluorescence microscope before any antibody incubation). Fine subcellular distribution studies can be done with IHC and confocal microscopy; immunogold staining electron microscopy allows detection of antigens at very high resolution in studies of subcellular distribution (Fig. 5) (20,27).
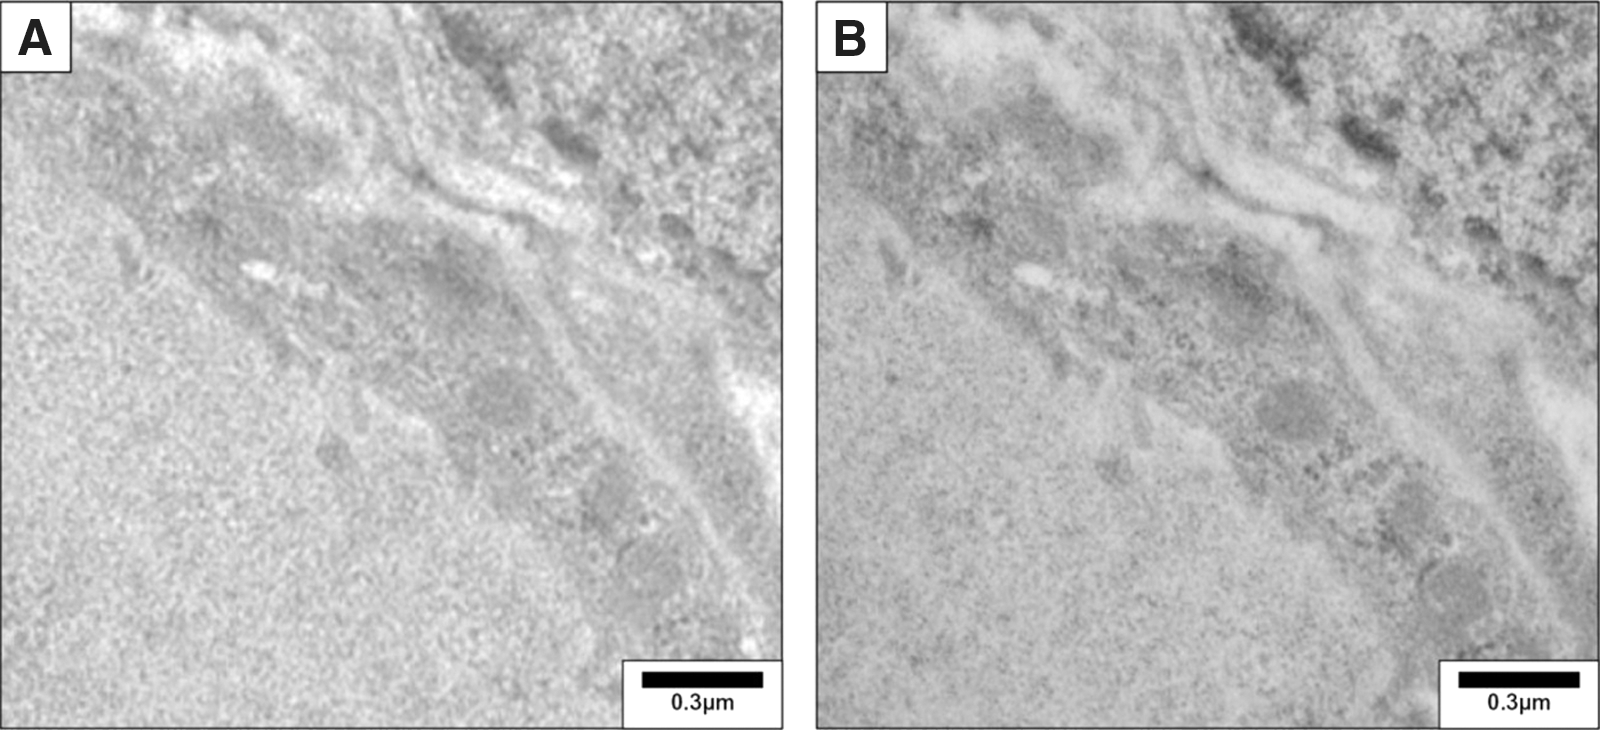
Detection of thyroglobulin in the mouse thyroid by immunogold electron microscopy. After wash with phosphate-buffered saline–bovine serum albumin (PBS-BSA 1%), ultrathin sections (0.1 μm) were incubated overnight with a rabbit polyclonal anti-thyroglobulin antibody (1/300, DAKO). Sections were then rinsed and incubated for 30 minutes with a 12-nm colloidal gold affinity pure goat anti-rabbit IgG (Jackson, 111-205-144, lot no. 71647). Sections were postfixed with 2.5% glutaraldehyde for 5 minutes and counterstained. They were examined with a Zeiss 109 transmission electron microscope.
[A.2] Thyroid iodide kinetics
Background
The synthesis of thyroid hormone, its tetra-iodinated form thyroxine (T4), and 3,3′,5-triiodothyronine (T3) requires a normally developed thyroid gland, an adequate iodide intake, and a series of regulated biochemical steps in thyroid follicular cells, which form the spherical thyroid follicles, the functional unit of the thyroid gland (28). In thyroid epithelial cells, the sodium iodide symporter (NIS) mediates the iodide uptake into thyroid follicular cells (29), and its expression is polarized (i.e., it is expressed only in the basolateral membrane). At the basolateral membrane of thyrocytes, Na+/K+-ATPase generates a sodium gradient that permits NIS to mediate perchlorate inhibitable, Na+-dependent iodide uptake (30). Iodide then translocates to the apical membrane and reaches the follicular lumen through the apical membrane. While it has been assumed that iodide moves across the apical membrane primarily because of the electrochemical gradient, studies in frozen section demonstrated that it is first accumulated in the cytoplasm and only later in the lumen, and apical iodide efflux is rapidly accelerated in polarized cells after exposure to TSH (31). Electrophysiological studies using inverted plasma membrane vesicles suggested the existence of two apical iodide channels, but their molecular identity has not been determined (32). The multifunctional anion exchanger pendrin (SLC26A4/PDS), which has affinity for anions such as iodide, chloride, and bicarbonate is thought to represent one of these entities (33,34). Both NIS and SLC26A4 expression and activity are increased by TSH (30, 33). While the term iodide uptake can be used broadly for in vitro and in vivo approaches, data interpretation should take into account the critical differences between the two settings, with the former reflecting cellular iodide uptake and the latter mainly the concentration of organified iodine in the colloid.
Basolateral cellular iodide uptake and apical efflux of iodide can be studied in monolayers of polarized cells cultured on semi permeable membranes forming a two-chamber system, or in nonpolarized cell models such as the FRTL-5 or PCCL3 rat thyroid cell lines.
Commentary
Measurement of iodide uptake and efflux in nonpolarized cells is relatively straightforward. The establishment of polarized cell systems requires isolation of primary cells or transfection or transduction of polarized heterologous cells and the documentation of intact monolayer formation, which are tedious and time-consuming (31). For the iodide uptake assays, cells are incubated in an uptake solution typically containing 10−5 M Na125I for a desired time period. Organification can be blocked by treating the cells with MMI. The intracellular iodide content is determined by measuring radiolabeled iodide in the cell lysates using a gamma counter after cell lysis. Results are expressed as counts per minute per well or, ideally, per microgram of DNA. The gravimetric amount of intracellularly accumulated iodide (pmol/μg DNA) can also be calculated based on the specific activity of the tracer. Alternative methods that have been used include the use of halide quenchers. A problem with this approach is that these quenchers are not specific for iodide, but also react to other halides. The availability of a modified enhanced yellow fluorescent protein (EYFP) H148Q/I152L with high affinity for iodide has allowed tracking iodide influx and efflux with relatively good accuracy and a high degree of correlation with direct measurements of radiolabeled iodide (35 –37). Alternatively, mass spectrometry has been used to study the uptake of perchlorate into FRTL-5 cells, which is also mediated by NIS (38).
A number of cell models and setups are available to study NIS-mediated iodide transport (4 –6,31,33,39 –41), including multiple heterologous cell lines transiently expressing NIS (29,42). Such studies are useful for the characterization of NIS function and the activities of naturally occurring or artificial mutant proteins (29,42). For example, they are useful to measure steady-state and initial rate iodide uptake as well as kinetic parameters of NIS-mediated iodide transport. Uptake of iodide has also been studied in cancer cell lines transfected or transduced with constructs in which the NIS cDNA is under the control of tissue-specific promoters with the aim to promote uptake of 131I and to induce cell death through its beta-emission (43,44). For studies assessing the effect of TSH, the medium used to culture thyroid cells is changed to TSH-deprived media for several days and then submitted to the different experimental conditions.
Iodide efflux from thyrocytes can be assessed in perchlorate-treated thyroid cell lines.
Commentary
To study iodide efflux in vitro, cells are loaded with 125I for 1–2 hours and subsequently treated with perchlorate in order to block iodide uptake by NIS. The efflux can then be studied by collecting supernatants at one or multiple time points (5). The intracellular content of iodide should also be determined at one or multiple time points. Another strategy is to use a two-chamber system, in which the efflux of iodide at the apical membrane can be measured by collecting the supernatant at one or multiple time points (31,40). Measuring iodide directly with ion-selective electrodes in supernatants or cell lysates is problematic because these probes are not specific for iodide and also recognize other halides such as chloride.
Efflux of radioactive iodide by the anion channel SLC26A4 (pendrin) or any other anion channels can also be studied in multiple heterologous cell lines transiently expressing NIS that allows for initial iodide uptake (3,40). This can be documented by measuring intracellular iodide content in cells co-expressing NIS and the channel of interest with direct comparison to cells that only express NIS. A model system that is suited for such experiments is the polarized Madin Darby canine kidney cell line (40). Transfection of these cells is very inefficient and this may require establishing stably expressing cell lines or viral transduction with appropriate vectors. Moreover, efflux can be followed using EYFP H148Q/I152L as an indicator of the intracellular iodide concentration (35 –37).
Kinetics of thyroid gland iodide uptake can be studied via administration of radioactive iodide. Data points can be obtained in vivo or following en bloc resection of the trachea and thyroid.
Commentary
Thyroid radioactive iodide uptake (RAIU) and other aspects of iodine kinetics can be studied in rodents using different iodine isotopes, most commonly 125I, which are injected intraperitoneally (2–10 μCi 125I). The thyroid gland is subsequently studied at different time points either with a gamma probe (used, for example, for the identification of parathyroid tissue in minimally invasive surgery) under anesthesia (45,46) or dissected postmortem with the trachea en bloc under a microscope and processed for radiometry for 1 minute in a gamma counter. The results may be expressed as a function of 125I in the serum (47) or as percentage of the total injected dose (46). Thyroid RAIU reaches a maximum at approximately 4 hours after administration of 125I and plateaus at about 12 hours (48). These are approximate time points that may vary according to the species and strain of the rodent under investigation. Timing of the 125I injection can be coordinated with the injection of bovine TSH (bTSH; 10 mU) to evaluate the TSH-induced thyroidal RAIU. In some settings it is useful to suppress endogenous TSH by pretreating the animals with T3 for 4 days prior to radioisotope administration (48). This will minimize the possibility that endogenous TSH, which could be different between two groups of animals, is interfering with the response to bTSH. Notably, a comparative study in rats and mice using recombinant human thyrotropin (rhTSH) indicates that it is far more important to pretreat with T3 and suppress endogenous TSH in rats than in mice (49).
Thyroid iodide organification can be quantified via the perchlorate discharge test.
Commentary
The perchlorate test permits quantification of the amount of iodide that is normally bound to thyroglobulin (50). The test is based on the fact that iodide is transported into thyroid cells by NIS, then released into the follicular lumen where it is rapidly covalently bound to tyrosyl residues of thyroglobulin (organification). Anions such as perchlorate inhibit NIS, and any intrathyroidal iodide that has not been incorporated into thyroglobulin is released rapidly into the bloodstream at the basolateral membrane and cannot be transported back into thyrocytes. In the standard perchlorate test, the thyroidal counts are measured at frequent intervals after the administration of radioiodine in order to determine the uptake into the thyroid gland. After documenting the uptake, perchlorate is administered intravenously or intraperitoneally, and the amount of intrathyroidal radioiodine is measured at frequent intervals. Under conditions of normal iodide organification, there is no significant decrease in intrathyroidal counts. In contrast, a loss of ≥10% indicates an organification defect, which can be partial (10%–90%) or complete (>90%).
In mice, sodium perchlorate (NaClO4) is injected intraperitoneally 1 hour after injection of 125I intraperitoneally, and animals are killed 1 hour later (47). Radioactivity remaining in the thyroid gland of perchlorate-treated animals is then compared with the 125I uptake measured in glands from control mice that were not exposed to the perchlorate-induced iodide chase. Protein-bound 125I (i.e., the total radioactive thyroid hormones bound to serum transport proteins) is determined in all blood samples after trichloroacetic acid (TCA) precipitation (47). Others have been able to trace iodide uptake and discharge in mice directly using gamma probes (45). Potassium perchlorate (KClO4) has been used in rats 6–18 hours following injection of 125I and shown to reduce the 125I thyroid/blood ratio when thyroid peroxidase is inhibited (51,52). 124I positron emission tomography/computerized tomography (PET/CT) has been used rarely to evaluate uptake and discharge of iodide in rodent thyroids in vivo (53).
Kinetics of thyroidal secretion can be studied in vitro using en bloc resection of the trachea and thyroid.
Commentary
This strategy is used to evaluate in vitro TSH-induced thyroidal secretion, minimizing the interference of other in vivo factors (20). Mice are given an intraperitoneal injection of about 30 μCi of 125I and 24 hours later the trachea and thyroid are removed en bloc and incubated for 3 hours in Krebs-Ringer bicarbonate medium containing 0.5 g/L bovine serum albumin (BSA), 8 mM glucose, and 10−4 M NaClO4 to avoid iodide recirculation. Radiolabeled thyroid hormone secreted in vitro is extracted with butanol (54). The secretion is expressed as a percentage of the total radioactivity in the tissue at the beginning of the incubation. There is an approximately 10-fold induction in thyroidal secretion with the addition of 5 mU/mL TSH (20).
[A.3] Thyroid imaging
Background
Thyroid imaging in small rodents has followed the techniques developed for humans such as scanning with iodide isotopes, microPET, CT, and high-frequency ultrasound (HFUS). However, the minute size of the gland still poses a significant challenge to obtaining high-quality high-resolution images, which has been partially overcome by recent new technology.
Thyroid gland functional imaging can be performed using radioactive iodide isotopes and image acquisition in a gamma camera or via microPET-CT.
Commentary
123I and 131I can be used together with a gamma camera for planar imaging as well as single photon emission computed tomography (SPECT) studies. 131I has a long half-life (8 days), but its high energy produces poor quality images. In contrast, the low energy emitter 123I is ideal, producing useful scintigrams with a low absorbed dose; the main limitations result from its short half-life (13 hours). Thyroid scintigraphy in anesthetized rats can also be performed 1–24 hours after an intraperitoneal injection of 10 μCi 125I using SPECT (46). Imaging is substantially improved by placing the animals on a low-iodine diet (LID) for about 3 weeks prior to the studies (46). This enhances the 4 hour thyroid RAIU from about 3.5% to 27% and makes thyroid scintigraphy, at all acquisition times, brighter and more detailed (46). SPECT studies in mice using 99mTc or 123I have also been reported (55,56).
PET studies of the thyroid using 124I produce good image quality with a reasonable half-life (4 days). The sensitivity of PET is higher than that of a scintillation camera, as well as the contrast and spatial resolution (53). For accurate thyroid imaging in rats, the combination of microPET and micro computed axial tomography with 124I is necessary (Fig. 6) (57). Anesthetized adult rats or mice are injected via tail vein with 20–540 μCi of Na124I and scanned in the microPET for 40 minutes at 24, 48, and 72 hours post injection under anesthesia. The resulting image data are then normalized to the administered activity in terms of the percentage of the injected dose per gram of tissues (Fig. 6B). Manually drawn 2D regions of interest or 3D volumes of interest can be used to determine the thyroidal area and volume. For example, the thyroid volume of an adult 400–500 g rat varies between 35 and 70 μL (57). In addition to the thyroid gland itself, this approach has also been used to image metastases of thyroid cancer in mice (58).
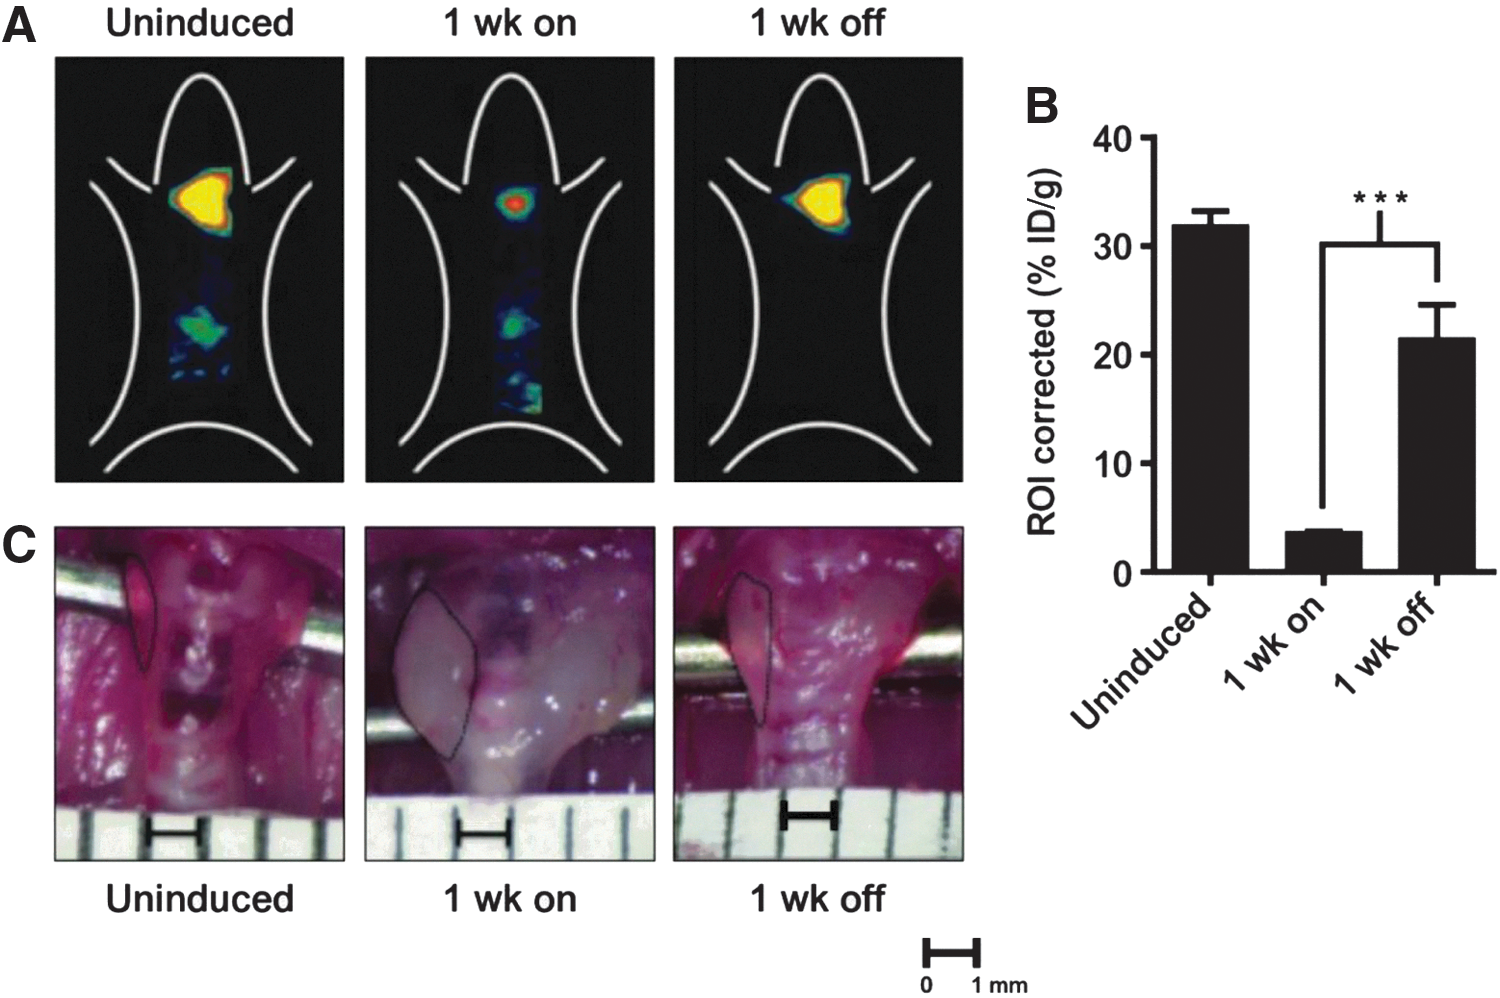
Thyroid imaging using 124I-iodide in vivo.
Morphological microimaging of the thyroid gland can be performed by HFUS.
Commentary
HFUS (20–100 MHz) is an imaging methodology that extends the in vivo visualization to microscopic resolution (of the order of 100 μm; Fig. 7) (59,60). The thyroid gland of a mouse can be examined using a microimaging system that has a single element probe of center frequency and a dynamic range of 52 dB. HFUS is performed under general anesthesia (e.g., 1.5%–2% isoflurane vaporized in oxygen) on a heated stage. Fur is removed from the area of interest (neck and the high thorax) to obtain a direct contact of the ultrasound gel to the skin of the animal, minimizing ultrasound attenuation. Real-time imaging can be performed with a frame rate of 20 Hz (corresponding to a temporal resolution of 50 milliseconds); the center of the mouse thyroid is placed about 6 mm from the transducer's focal zone. The study, including measurements and acquisition of accurate, repeatable, and high-quality images, can be completed in about 30 minutes in the hands of a well-trained and skilled operator (61).
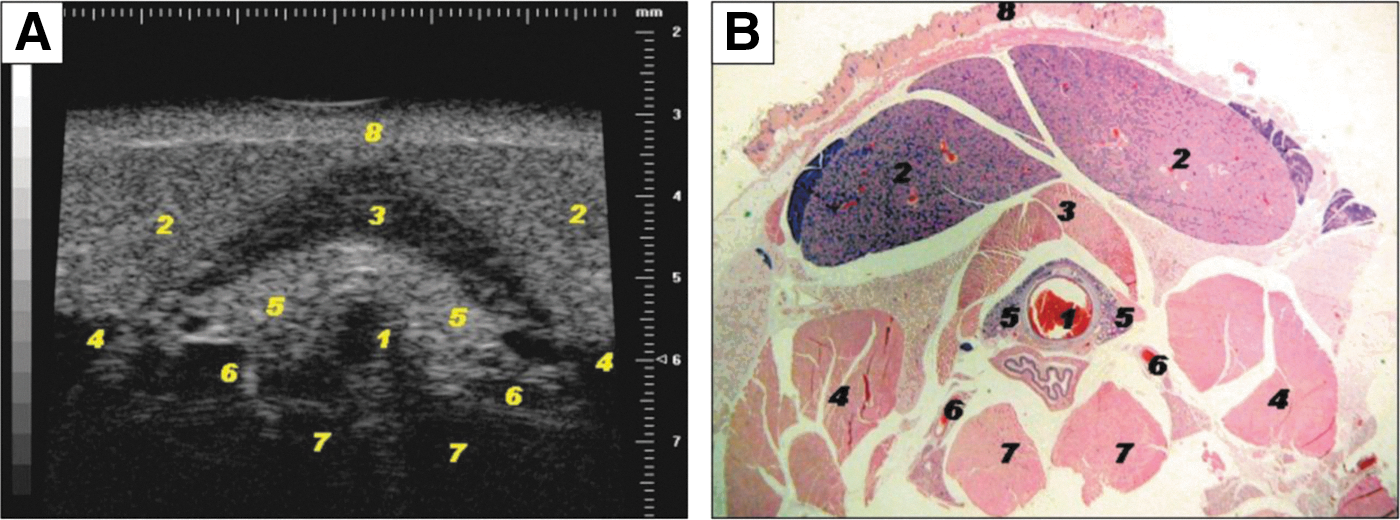
High-frequency ultrasonography (HFUS) of the mouse thyroid.
The volume of each lobe can be calculated using the ovoid formula (width×depth×length×π/6) (61). The thyroid volume of an adult C57BL/6 mouse ranges between 2.1 and 4.9 μL. In 6-n-propyl-2-thiouracil (PTU)-treated mice there is diffuse goiter with volumes that range between 4.1 and 8.8 μL. Thyroid nodules can be detected via this methodology as well, with the smallest detectable nodule exhibiting a diameter of 0.46 mm. Features suggestive of malignancy can also be identified such as hypoechogenicity relative to adjacent normal tissue, poorly defined margins, internal microcalcification, irregular shapes, and extraglandular extension (61). This should be useful in the phenotypic characterization of mouse models of thyroid cancer.
[B] Assessing Circulating and Tissue Thyroid Hormone Levels
Overview
“Thyroid status” of an organism is the sum of all thyroid hormone signaling events and depends on both circulating thyroid hormone levels and on local factors influencing the nuclear concentration of thyroid hormone in specific tissues. Thyrotoxicosis is the clinical syndrome associated with thyroid hormone excess, whereas hypothyroidism results from thyroid hormone deficiency. At the same time, individual tissues could be said to have specific thyroid status, i.e. hypothyroid or thyrotoxic, relatively independent of serum thyroid hormone levels; this is because of tissue-specific deiodinase activities and/or transport mechanisms (Fig. 8). For example, ischemia and hypoxia cause the brain and the heart to become acutely hypothyroid in an otherwise euthyroid animal due to induction of type III deiodinase (D3) expression (62 –65). At the same time, the brown adipose tissue (BAT) exhibits localized increase in thyroid hormone signaling shortly after rodents are moved to the cold due to acute induction of type II deiodinase (D2) expression (66).

Supply and metabolism of thyroid hormones affect negatively and positively T3-regulated genes in the brain. To construct this figure, the authors used individual reverse transcriptase quantitative polymerase chain reaction (RT-qPCR) data from T3-regulated genes to calculate the fold change relative to the wild-type (WT) values, and plotted the Log2FC (fold change) to make the results quantitatively comparable. The data were represented in a box-and-whiskers (5%–95%) plot. Statistical significance between each group and the WT was calculated by one-way ANOVA. For the positive genes, F 5,537=272, p<0.0001. For the negative genes, F 5,400=145, p<0.0001. *p<0.05; **p<0.01; ***p<0.001. Reproduced with permission from Hernandez et al. (492).
A common way of assessing thyroid status of an organism, a.k.a. systemic thyroid status, is by measuring serum levels of thyroid hormone (T4 and T3) and TSH as well; reverse T3 can also be measured, but it is usually reserved for special situations to confirm abnormalities in thyroid hormone metabolism. Tissue-specific thyroid status can be characterized via direct measurement of tissue thyroid hormone levels. Typically, measuring the expression of T3-responsive genes (see Section I) and/or T3-responsive biological parameters (see Section J) is also part of the work up to define thyroid status.
As with the clinical assays developed for patients, a number of immunoassays for T4, T3 and TSH have been developed specifically for rodents, which take into consideration differences in types and capacity of serum iodothyronine binding proteins and species-specificity of the TSH molecule. In general, these assays function well and exhibit sufficient precision to evaluate thyroid function and systemic thyroid status in rodents. Under experimental circumstances or specific genetic defects, serum iodothyronine levels may not reflect thyroid hormone signaling at the tissue or cellular level. In these cases, thyroid status can be ascertained by measuring T3 concentrations in specific tissue or cells by adapting the immunoassays developed for serum measurements.
[B.1] Serum
Background
Serum thyroid hormone levels may vary substantially according to sex, age, and strain of the rodent and should be accounted for in study design. Elevated levels (as defined between adjusted normal ranges) usually indicate thyrotoxicosis, while decreased serum levels are indicative of hypothyroidism. Iodine deficiency, alterations in thyroid hormone metabolism, as well as hypothalamic and pituitary sensitivity to thyroid hormone can alter the quantitative reciprocal relation between serum T4, T3, and TSH as is often the case in models of resistance to TSH or thyroid hormone.
Immunoassays were developed decades ago and have served as the cornerstone to measure serum iodothyronines and TSH. However, these original assays have been largely replaced by newer immunoassays (e.g., enzyme-linked immunosorbent assay [ELISA], immune radiometric assay [IRMA]), all of which are commercially available. Using commercially available kits to measure serum iodothyronines in rodents is not straightforward because many of these kits are developed for human serum and make use of an artificial matrix to mimic human binding proteins with higher affinity and capacity than those of mice or rats. These kits utilize “displacement agents” to displace the iodothyronines from human thyroxine binding globulin (TBG; e.g., 8 anilino naphthalen sulfonic acid, diphenylhydantoin, salicylic acid) that are frequently used in excess (for mouse). In this respect, they interfere more with T3 than T4, and particularly when serum T3 values are low. This can only be appropriately corrected for by using iodothyronine-deficient mouse serum as blank and constructing a standard curve that will calibrate the assay; for example, serum from paired box gene 8 (Pax8) knock-out (KO) mice not treated with T4 or T3 for at least 2 months (67). Technical limitations also require the utilization of TSH-deficient mouse serum for blank and the preparation of a standard curve with mouse serum TSH, not pituitary TSH, as standard (68). Liquid chromatography/tandem mass spectrometry is also becoming available, although its applicability for rodents is limited because the required serum volumes are still too large.
Serum total T4 and T3 concentrations can be measured by radioimmunoassay (RIA), or a host of other immunoassays such as ELISA or IRMA, provided that the standard curves are prepared with rodent serum stripped of thyroid hormone.
Commentary
Typical standard curves are prepared over the range 2.5–240 ng/mL for T4 and 0.1–6 ng/mL for T3. These assays can be developed in house by modification of kits for human use obtained from multiple commercial sources. Homemade RIAs have a greater sensitivity with measurements over the range of 0.05–3 ng/mL (67). Clinical assays developed for patients can be used as long as the rodent standard curve is parallel to the standard curve provided in the kit and an appropriate correction factor applied; the rodent standard curve should be used to calculate the results (67). Commercially available kits designed for measurement of mouse serum T3 and T4 in 10 μL samples have been developed and used with acceptable results (69).
Assays for measuring circulating T4 and T3 are best performed using serum rather than plasma, since fibrin formation affects pipetting, and additives such as heparin may directly interfere with free hormone determination.
Commentary
Frequent blood samples can be obtained during the course of an experiment if limited to approximately 10% of the total volume every 2–4 weeks and 1% every 24 hours. Serum can be stored at −20°C for long time periods. The use of anesthesia may have variable effects on thyroid hormone levels, and each investigator should evaluate potential effects in their system with the anesthetic they are using. Serum T3 and T4 exhibit minimal circadian variations along day–night cycles; these could be taken into account depending on the timing of sample collection. Serum samples with milky aspect from lactating dams or from their pups can give erroneous results due to their high lipid content. In these cases extraction of the serum and removal of the lipids using chloroform is advisable (67).
Determinations of free iodothyronine indexes (FT4I and FT3I) in the serum can be achieved by measurement of the total serum hormone concentration and the serum iodothyronine binding capacity using one of the resin or charcoal methods.
Commentary
The existence of proteins in the serum that reversibly bind thyroid hormone establishes two pools of circulating T4 and T3 (i.e., protein-bound and free). The major circulating high affinity thyroid hormone binding proteins differ in rodents and humans, with transthyretin being the major protein in the rat and TBG in humans. It is the free thyroid hormone in the plasma that is in equilibrium with tissues and affects thyroid hormone signaling. Measurement of free hormone by methods other than equilibrium dialysis can give erroneous results, though microfiltration of the samples has been used with reliable results (70,71). Equilibrium dialysis of serum with labeled iodothyronine tracer in dialysis bags has been used to measure free T4 and T3 in the rat. The method is not used for mice, owing to the requirement of more than 1 mL of serum for measurement in triplicate because leaks often occur. Using diluted serum and applying correction is not advisable. Only 100 μL of serum is required when using microfiltration of the samples (70).
Alternatively, an estimate of the FT4I or FT3I can be obtained using a relatively small volume of serum by using the resin or charcoal methods (72). Serum is diluted into phosphate-buffered saline (PBS; pH 7.4) containing [125I]T3 or [125I]T4. Samples are allowed to equilibrate and subsequently mixed with 0.0125% activated charcoal solution. Charcoal pellets are obtained and then counted in a γ-counter. Conditions should be optimized such that approximately 20%–30% of the tracer is bound to charcoal in sera from euthyroid control animals. An estimate of the free T4 or T3 (FT4I or FT3I) can be calculated by multiplying the total T4 or T3 serum concentration by the T4 or T3 charcoal uptake.
Isotope dilution tandem mass spectrometric can be used to measure T4 and T3 in biological samples.
Commentary
Immunoassays for thyroid hormone measurement can suffer from poor specificity. As an alternative, simultaneous measurement of T4 and T3 can be achieved by using isotope dilution tandem mass spectrometry within a single run (67,73). The method requires 100 μL of serum and involves addition of internal standard, precipitation of proteins with methanol and injection onto a C-18 column. T4 and T3 are subsequently eluted using a methanol gradient. This method is accurate, specific, and precise (coefficient of variation of 3.5%–9.0%). A concern is the sample volume needed for free hormone determination, which is still relatively large for applications involving mice, except in terminal bleeding. Similar methodology applying liquid chromatography-tandem mass spectrometry has been developed for measurement of iodothyronamines, a decarboxylated iodothyronine present in a number of biological fluids (74).
Rat and mouse serum TSH can be measured using commercially available rat TSH assay kits. Alternatively, species-specific RIAs can be performed using reagents from the National Hormone and Peptide Program, National Institute of Diabetes and Digestive and Kidney Diseases (Bethesda, MD).
Commentary
In general, RIAs for TSH are more sensitive than IRMAs. Commercial assays do not provide species specific cross reference and, therefore standard curves are rarely parallel to values obtained with actual sample dilution. However, commercial reagents can be adapted for specific and accurate measurements of TSH as outlined below.
TSH standard curves should be constructed using species-specific circulating (serum, not pituitary) TSH standard, diluted in TSH-deficient serum obtained from the same species. Serum TSH standard is obtained from animals rendered hypothyroid (see Section E.1). The content of TSH is calibrated against a bTSH standard in a bioassay. TSH-deficient serum is prepared by making rodents thyrotoxic (treatment with 20 μg levothyroxine [L-T4]/100 g body weight [BW]/day for 1 week). Sample nonparallelism with standard curves is due to species differences and to cross-reactivity with free TSH subunits and other pituitary glycoproteins in pituitary extracts. The use of lactoperoxidase to label TSH with 125I improves the stability of the labeled TSH and the sensitivity of the TSH assay up to thyrotoxic ranges (68). Measurement of TSH concentration in pituitary gland extracts can be done, however, using the same assay at a dilution of 1:500 to 1:2000 in assay buffer. The standard curve can also be built using buffer, instead of TSH-deficient rodent serum, as the diluent. Running the RIAs in disequilibrium (addition of the isotope tracer for a shorter time after incubation of the TSH antibody with the samples) improves the sensitivity of the assay. If no reliable rat/mouse serum TSH measurement is available, the levels of TSHβ mRNA in the pituitary gland can be used as an indication of TSH production (75).
TSH biological activity can be studied by standardized in vitro assays as well as in vivo assays.
Commentary
TSH biological activity is modulated by a number of factors including its structure, glycosylation or carbohydrate branching, as well as by the TSH receptor. The biological activity of the TSH molecule can be determined by an in vitro bioassay using Chinese hamster ovary cells stably expressing the TSH receptor (68,76). The subclone cl 213 of JP2626 is particularly sensitive to low levels of TSH. About 50,000 cells are seeded in individual test tubes and incubated with 20 μL of serum, followed by cAMP extraction with 0.1 M HCl and measurement by RIA (77). Blanks are processed as already described with TSH-depleted serum obtained from T4-treated mice. cAMP production is a function of how much endogenous TSH was contained in the plasma sample (68). Dividing the cAMP generated in vitro by the TSH values in the plasma sample provides an index of TSH biological activity. Of course, this can vary according to mutations in the TSH molecule or degree and type of glycosylation or carbohydrate branching. However, such changes may not always show biologic differences using in vitro tests. Alteration in the protein glycosylation or the tertiary structure (carbohydrate branching) of the sugar residue, alters the half-life of TSH in vivo and affects its bioactivity. However, this cannot be always demonstrated by in vitro bioassay. In some instances it can be shown by isoelectric focusing, if a sufficient amount of TSH can be concentrated and developed by Western blotting or by Concanavalin-A chromatography (78). Another method is to affinity purify the TSH being tested, inject it intravenously in TSH-suppressed mice or rats (treated with high dose of T3), and follow its half-life by RIA, or follow the biological activity of TSH by measuring T4 secretion in serum. Decreased TSH bioactivity can also be caused by defects in the TSH receptor or reduced number of TSH receptors expressed in the follicular cell surface (e.g., heterozygous TTF1 KO mice). This can be confirmed by showing intact response in an in vitro bioassay along with alteration in the response of the animal to injected authentic TSH (79).
Thyrotropin releasing hormone (TRH)-induced TSH secretion testing can be used to assess the capacity of the pituitary gland to secrete TSH. TSH-induced thyroidal secretion testing can be used to assess the capacity of the thyroid gland to produce and secrete thyroid hormone.
Commentary
The TRH-TSH axis can be interrogated at either the pituitary or thyroid glandular level via specific dynamic tests. The TRH stimulation test is performed with an intravenous or intraperitoneal injection of TRH (5.0 μg/kg BW). Blood is collected 30 minutes later for measurement of serum TSH and 2 hours later for measurement of serum T3, which indicates the thyroidal responsiveness to TRH-induced TSH. The expected increase in serum TSH is about threefold, whereas an elevation of approximately 50% in serum T3 is expected (80).
The TSH stimulation test is performed with an intravenous or intraperitoneal injection of bTSH (2–250 mU/100 g BW). Two hours later, blood is collected for measurement of serum T3, with an expected elevation of approximately 40% compared to baseline levels (79 –81). An alternative approach is to pretreat mice for 4 days with T3 (1 μg/d) in order to suppress endogenous TSH and then administer bTSH (2, 10, or 30 mU) on the morning of the fifth day. In this case, the thyroidal response is evaluated based on the TSH-induced elevation in serum T4 3 hours later, which is about 1 μg/dL (81) or threefold over baseline (82). A similar approach can be used in rats, and the TSH-induced T4 response varies quite substantially according to the rat strain. Still in rats, the TSH-induced T4 response plateaus at a bTSH dose of about 100 mU, with an increase of about 2 μg/dL above baseline (79). Of note, a comparative assessment of the thyroid responsiveness to rhTSH in rats and mice indicates poor or no response in rats that were not pretreated with T3 (49).
[B.2] Tissue
Background
While the plasma constitutes the largest extrathyroidal pool of T4, approximately two thirds of all T3 is found in the intracellular space and initiates thyroid hormone action by binding to nuclear thyroid hormone receptors (TRs). The intensity of the signaling depends on the number of occupied TRs in any given T3-responsive tissue. Because the extracellular and intracellular compartments are in communication and thyroid hormone molecules transit in and out of the cells via the different membrane transporters, in most tissues measuring the serum concentration of thyroid hormone provides an estimate of the intracellular T3 concentration. However, a disruption of the transport system might prevent free access of T3 to the intracellular compartment. In addition, intracellular metabolism of thyroid hormone, both activation and inactivation, might affect thyroid hormone signaling in a way that cannot be predicted from sampling the plasma compartment. Thus, serum levels of T3 do not necessarily reflect the amount of T3 in all tissues or the intensity of thyroid hormone signaling. Direct measurement of tissue T3 content provides this additional information.
Tissue content of T3 and T4 can be measured by immunoassays after tissue extraction.
Commentary
Removing blood from tissues by perfusion is important particularly for highly vascular tissues. After collecting a blood sample, mice are perfused with heparin containing PBS through a needle placed in the left ventricle (LV) of heart followed by cutting open the vena cava. Tissues are then collected, immediately frozen on dry ice, and stored at −80°C. Iodothyronines are extracted from tissues using methanol–chloroform (1:2). The amount of tissue to be extracted depends on thyroid hormone status of the animal and the hormone abundance in a specific tissue. As an example, 50 mg of brain and 15 mg of liver of an euthyroid mouse will generally yield satisfactory results, but the amount should be increased in samples from hypothyroid mice or rats. Radioactive T3 or T4 should be added to each sample to determine efficiency of extraction; a mix of [125I]T3 and [131I]T4 can be used when both hormones are to be studied. Depending on the extraction procedure, chloroform should be removed because it contains lipids and other substances that interfere in the RIAs. This involves back-extraction in calcium chloride, concentration of the extracts, and evaporation (83). Once extraction is completed, the dried extract is dissolved, preferably in buffer or charcoal-stripped rodent serum, and T3 content measured by the specific immunoassay, following the given recommendations. A highly sensitive RIA is decisive to obtain reliable results in small samples or in samples from hypothyroid animals. For determination of tissue T4 content, commercial assays are not sensitive enough and a highly sensitive T4 RIA in buffer should be used (83). All assays must include appropriate blank/control tubes, containing all reagents except for the tissue sample, to be used to check the assay background. Validation of the assay also includes demonstrating parallelism between a tissue curve (multiple points with progressively greater amounts of tissue extract) and the standard curve over the range of interest.
[B.3] Sources of tissue T3 and TR saturation
Background
T3 present in extrathyroidal tissues may be derived from two distinct sources: plasma T3 and T3 locally generated from T4 (84,85). The latter mechanism is typically found in tissues that express D2 such as brain, pituitary, and BAT. Estimates suggest that at least half of the T3 present in D2-expressing tissues is produced locally from deiodination of T4 (86 –89). More recently D2 expression has been found in a large number of tissues and cells (90 –98), illustrating the importance of defining its contribution to tissue-specific thyroid hormone signaling. The determination of the sources of intracellular T3 is feasible because plasma T3 equilibrates rapidly with most tissues (but not all). At the equilibrium time point (Tm) one can use the plasma T3 concentration and the nuclear/plasma ratio of tracer T3 to estimate the amount of nuclear T3 that is derived from plasma. A similar strategy can then be applied for T4, returning the nuclear T3 that is derived from local conversion of T4 to T3.
The contribution of plasma T3 to tissue T3 can be quantified by tissue-labeling techniques involving either single intravenous injections or pump-driven chronic infusion of radiolabeled tracer T3.
Commentary
Studies have been standardized in rats but could in theory be applied in mice as well, provided that limitations due to body size and anesthesia are overcome. Tissues can be studied as a whole or fractionated to isolate the TR-containing nuclear fraction (66,86 –89). After the administration of [125I]T3, Tm is defined as the time at which the amount of tracer [125I]T3 entering the tissue or nuclear compartment equals the amount of [125I]T3 exiting the same compartment. Tm is reached within hours of the intravenous injection or within days of the pump start. At the Tm, the [125I]T3 plasma/tissue ratio and the plasma concentration of T3 are used to calculate the tissue T3 concentration. Similar calculations are used in case radiolabeled tracers are infused via pumps (99,100). These methods have been standardized with 125I-T3 separation by descending paper chromatography. There is good agreement that high performance liquid chromatography (HPLC) and ultra performance liquid chromatography (UPLC) are excellent methods for separating labeled iodothyronines and in theory could be used as well.
TR maximum binding capacity in a tissue can be estimated via saturation analysis with T3 and data reduction using the Scatchard method.
Commentary
The combined administration of tracer [125I]T3 with increasing amounts of cold T3 progressively saturates the high affinity T3 binding sites (TR) (86 –89,101). In this case, nuclei are isolated and processed for [125I]T3 content. The plasma T3 concentration and the plasma/nuclear ratio at the Tm are then obtained for each dose of cold T3 that was injected. Results are expressed per milligram of DNA, and the Scatchard analysis of the data allows for the calculation of the TR maximum binding capacity and relative affinity in any given tissue. The plasma T3 versus nuclear T3 curve makes it possible to calculate the TR saturation at any given level of T3, including physiological plasma levels.
Dual-labeling techniques using [131I]T3 and [125I]T4 can be used to determine the relative contributions of plasma T3 versus locally produced T3 via T4 deiodination to tissue T3 concentration.
Commentary
The administration of [125I]T4 and subsequent measurement of plasma and tissue [125I]T3 allows for the quantification of locally produced T3 in tissues as a whole or TR-containing nuclear fraction (86 –89). Even if relatively large activities of [125I]T4 are used, the amounts of [125I]T3 produced at the Tm are minimal in euthyroid animals. Thus, both plasma and tissue (nuclear) [125I]T3 should be concentrated using an anti-T3 affinity column before separation by chromatography. At the Tm, the plasma/tissue ratio of [125I]T3/[125I]T4 and the serum T4 concentration are used to calculate the locally produced T3. Values of [125I]T3 are multiplied by 2 given that there is only one 125I in the phenolic (outer) ring of [125I]T4 and deiodination occurs randomly between the 3′ and 5′ positions. Appropriate corrections should be used when the tracer contains radioactive iodine in both phenolic (outer) and tyrosil (inner) rings. To account (and discount) for the contribution of plasma [125I]T3 (exiting from tissues) to tissue [125I]T3, administration of [125I]T4 is coordinated with the administration of [131I]T3. Because the Tm(T4) and Tm(T3) are different, the administration of the two tracers should be timed so that both Tms coincide at the time animals are killed.
[C] Assessing Thyroid Hormone Transport into Cells
Overview
Based on the lipophilic structure of thyroid hormones, it was long thought that thyroid hormone enters the cell through passive diffusion. However, it has become clear that thyroid hormones are transported across the plasma membrane via carrier-mediated transport, providing the cell with an important tool to regulate intracellular thyroid hormone availability. Carrier-mediated transport of thyroid hormones is facilitated by specific substrate–transporter interactions and predominantly driven down concentration gradients and, for some transporters, through the co-transport of other molecules. Solute carriers known to transport thyroid hormones include monocarboxylate transporters (MCTs), Na+/taurocholate co-transporting polypeptide, organic anion transporters (OATs), amino acid transporters (e.g., L-type amino acid transporters), and organic anion transporting polypeptides (OATPs) (102 –106). The importance of thyroid hormone transporters is illustrated by the fact that mutations in human MCT8 cause psychomotor retardation and altered iodothyronine levels (107,108). With the exception of OATP1C1 (T4 and 3,3′,5′-triiodothyronine [rT3] transport only), most thyroid hormone transporters transport both T4 and T3. It is important to realize that members of the MCT family, such as MCT8 and MCT10, facilitate not only the cellular uptake, but also the efflux of iodothyronines (109). The physiological role of the transporters is not only dependent on their relative affinities for the thyroid hormones but also depend upon tissue- and cell-specific expression patterns. A confounding factor in teasing out the functional role of specific transporters is the possible expression of different transporters on the surface of an individual cell type (e.g., hepatocytes and neurons). In these instances the relative abundance of a specific family member will likely determine the hierarchy of transport functions for a specific cell type. Finally, several thyroid hormone transporters do not transport thyroid hormones exclusively. For example, the OATPs transport a wide variety of both endobiotics and xenobiotics and possess multiple substrate binding sites (110,111). This complexity in expression and function reveals some of the challenges associated with studying thyroid hormone transport both in vivo and in vitro that must be considered by the experimentalist.
[C.1] Thyroid hormone transport in vitro
Background
In vitro studies are generally considered for the biochemical characterization of individual transporters, study of the effects of specific mutations on transporter function, and elucidation of the role of specific transporters expressed in individual cell types. A primary consideration is assurance that the experiment is properly designed and controlled to test the function of specific transporters versus the collective action of multiple transporters expressed in the same cell. Kinetic studies require consideration of possible confounding factors such as assurance of plasma membrane localization of the expressed transporter, bidirectional substrate transport, choice of experimental cell type, and typical versus atypical kinetics.
Iodothyronine transport into cells can be studied in cells transiently expressing wild-type or mutant thyroid hormone transporters.
Commentary
Assessing functionality of cloned wild-type or mutant thyroid hormone transporters is readily achieved by conducting uptake experiments (110,112). Proper controls include comparison to cells transfected with empty vector and inhibition of labeled thyroid hormone uptake by co-incubating with excess cold hormone. The latter control is critical to ensure that the observed cell associated thyroid hormone uptake is a saturable process and is not simply associated with nonspecific binding of labeled hormone to the cell. For general transport assays, uptake commences with the addition of labeled substrate to the cells and terminates at specific time points with rapid washes with cold transport buffer. These wash steps are essential, since iodothyronines tend to adhere to the cell walls. Attention should be given to the selection of transport buffer (e.g., Krebs-Henseleit buffer, Dulbecco's modified Eagle's medium/F12, or regular PBS with/or without BSA). It is important to realize that different transport buffers can contain large amounts of amino acids, which may also be transported by certain transporters and thereby influence the results of uptake experiments. BSA can be added to the medium to keep iodothyronines in solution and prevent the adsorption to plastics. However, by decreasing the free iodothyronine concentration it may also limit substrate availability.
Transport buffers preferably contain no serum at all, since even ion-exchange resin-stripped serum may still contain low levels of thyroid hormones interfering with the uptake assay. As a consequence, kinetic measurements (e.g., transport constants, maximal velocities) cannot be determined. Uptake is calculated from the proportion of radioactivity associated with the cell lysate compared with the total radioactivity associated with the isotopic transport buffer. Background radioactivity in cells transfected with empty vector is subtracted from all samples. Uptake is calculated from the proportion of radioactivity associated with the cell lysate compared with total radioactivity associated with the isotopic transport buffer and expressed in units of picomoles per minute (113,114).
Different results may be obtained in different cell types, depending on the endogenous expression levels of thyroid hormone transporters and/or other factors necessary for thyroid hormone transport. When studying the function of mutant transporters, it may be useful to compare results in cells with high versus low endogenous expression levels.
Thyroid hormone transporters exhibit bidirectional transport. For some transporters such as the OATPs, an anti-ported substrate is thought to be required for thyroid hormone transport across the plasma membrane and should be considered when choosing a transport buffer. Accumulation of transported thyroid hormones in the cell is necessary for assessing transport activity and can present a problem for some bidirectional transporters because the substrate may rapidly efflux thyroid hormones from the cell. Co-transfection with intracellular thyroid hormone binding proteins such as mu-crystallin provides a method for ensuring accumulation of transported hormone (109,115,116). One caveat, however, is that use of such methods precludes subsequent kinetic studies because hormone transport will likely not ever reach steady-state.
To study the consequences of overexpression of a specific thyroid hormone transporter on intracellular availability of thyroid hormone, cells can be co-transfected with an iodothyronine deiodinase and subsequently analyzed for metabolism (114). Alternatively, Xenopus oocytes can be used for transport studies (118).
Determining the substrate specificity and kinetic characteristics for thyroid hormone transporters requires commitment to testing various substrates at a wide range of concentrations.
Commentary
The substrate specificity of (putative) thyroid hormone transporters can be investigated by incubation of cells with different putative radioactive ligands, including the different iodothyronines T4, T3, rT3, and 3,3′-diiodothyronine (T2), as well as thyroid hormone analogues such as 3,5,3′-triiodothyroacetic acid (tiratricol, also known as TRIAC) and/or various amino acids such as Leu, Phe, Tyr, and Trp. Specificity of TH transport can be measured by determining the uptake of radiolabeled iodothyronines in the presence of putative competitors, including unlabeled iodothyronine derivatives such as D- and L-iodothyronines, tiratricol, tetraiodothyroacetic acid (Tetrac), and amino acids.
Characterization of kinetic parameters of cloned wild-type and mutant thyroid hormone transporters requires first determining the time course of substrate influx into the transfected cells. From these data a time point is identified when substrate uptake is close to maximal but transport has not yet reached steady-state. All further kinetic studies are then conducted by measuring substrate accumulation in transfected and control cells at this identified time point.
For analysis of transporter mutants it would be expected that mutants may possess altered kinetic activities. Therefore, for the time course study the investigator should assess uptake at multiple time points over the course of 120 minutes. Mutants can be subjected to Michaelis–Menten kinetic analysis to quantify potential changes in thyroid hormone transport kinetics.
For the subsequent kinetic studies, a time point should be chosen prior to steady-state when maximal differences between expressed transporter versus empty vector uptake are observed. At this time point, one can measure the uptake using multiple different substrate concentrations spanning the dynamic range of detection for each substrate. Since these large experiments are difficult to perform, many investigators choose to limit the number of data points collected, accepting a less accurate estimation of transport kinetics. Notably, saturability and apparent Km values may be influenced by binding of iodothyronines to proteins such as BSA in the medium.
Assessment of OATP function is even more difficult as these transporters possess multiple substrate binding sites and thus exhibit atypical transport kinetics (110,119). To properly assess OATP transport kinetics gather kinetic data as described above and use additional methods to analyze the data (110,120 –122). These transport kinetics cannot be determined for transporters with high efflux capacity, such as MCT8 and MCT10, which may require co-transfection with intracellular binding proteins (see previous discussion).
Assessing thyroid hormone transport in dissociated primary cell cultures in vitro is only of limited value if mixed cell cultures are used.
Commentary
A caution when working with primary cells is potential rapid down-regulation of transporter expression (123). Tracking transporter expression by Western blot or immunocytochemistry over time in culture is therefore critical. In addition, the presence of a mixed cell population mandates identification of cell types expressing specific transporters (124). However, lack of antibody specificity may pose significant problems for tracking the expression of specific members of large transporter families with multiple closely related members.
Confirmation of proper plasma membrane localization is necessary for studies utilizing cells transiently expressing thyroid hormone transporters.
Commentary
Ensuring that the assessed transporters are localized to the plasma membrane is of key importance for in vitro studies. When appropriate antibodies are available Western analysis should first be performed to ensure protein expression followed by fluorescent immunocytochemistry to assess subcellular protein localization. When studying transfected cells, it is important to study cells with low levels of endogenous expression of the transporter of interest. For example, JEG3 cells are an excellent model to study plasma membrane localization of mutated MCT8 or MCT10 because of their low levels of endogenous expression of MCT8 and/or MCT10. For biochemical analysis, epitope-tagged cloned transporters provide a ready antigenic target for both Western blot and immunocytochemical analysis. Subcellular localization is preferably determined by confocal microscopy because typical wide-field fluorescent microscopy will not readily distinguish between cell surface and intracellular labeling. Appropriately expressed protein is primarily localized in the plasma membrane with limited intracellular staining. This analysis is crucial for proper evaluation of genetic mutants as a lack of transport observed in in vitro assays could be either due to a lack of transport function or an inability to properly traffic the protein to the plasma membrane. In both scenarios the transport assay would demonstrate a loss of transporter function, although the biochemical explanation for this result would be markedly different. Note that these studies may be difficult to perform in transiently transfected cells, due to a relatively low transfection efficacy. For such studies the use of stably transfected cells may be more useful.
[C.2] Thyroid hormone transport in vivo
Background
In vivo study of thyroid hormone transport is considered for elucidating the physiological and pathophysiological roles of specific transporters and for determining the kinetics of tissue influx and efflux of thyroid hormones. Kinetic studies require consideration of possible confounding factors such as first pass metabolism of injected tracer hormone, the presence of multiple thyroid hormone transporter family members in a single tissue or even cell type, and developmental changes in transporter expression patterns. Consequences of defective thyroid hormone transport on thyroid hormone signaling can be analyzed using genome wide analysis (Section I.3) on patient material such as fibroblasts (125), whereas consequences for different systemic biological parameters can be analyzed using different knock-out mouse models [see Sections I.5 and J; see Heuer and Visser (126) for a review].
For in vivo studies, net thyroid hormone transport typically represents the summation of a number of different transporter activities. Assessing the contribution of a given transporter to net transport requires examination of all transporters expressed in the tissue.
Commentary
In vivo measures of thyroid hormone transport are confounded by the expression of multiple thyroid hormone transporters in most tissues. A key consideration is to determine the transporter expression profiles and levels in specific cell types in targeted tissues. Since the affinity for T4 and T3 is similar across most transporters, the contribution of an individual transporter generally follows its expression levels. Experimental design should take the possibility of both hormone influx and efflux into consideration [see Heuer and Visser (126) for a review]. Consequences of defective thyroid hormone transport for thyroid hormone signaling can be analyzed using genome wide analysis (see Section I.3) of patients' material such as fibroblasts (125) or different tissues of knock-out mice (127).
Metabolism of assessed thyroid hormones must be considered when measuring transport in vivo.
Commentary
Thyroid hormones are subjected to metabolism in vivo including deiodination and conjugative metabolism. Importantly, such metabolism impacts the transport fate of the hormones and when the thyroid hormones metabolized are radiolabeled tracer substrates, interpreting obtained results is difficult. Control over metabolism can be exerted if single pass strategies are used such as direct cannulation of vessels leading to target tissues followed by continuous infusion of defined transport buffer and substrate. Such strategies limit metabolism of the substrate and loss to peripheral tissues and allow direct measurement of thyroid hormone transport in the tissue assessed. As an example, measurement of thyroid hormone transport across the blood–brain barrier would be best achieved using the in situ brain perfusion method (128). This methodology allows accurate kinetic measurements such as transport rates and transport affinities and can be conducted in neonatal to adult animals. Comparison of transport kinetics in wild-type and specific transporter null animals would allow determination of the specific contributions of individual transporters in vivo.
[D] Assessing Thyroid Hormone Deiodination
Overview
The major circulating iodothyronine is T4. However, T4 can be converted in the tissues to T3, the principal thyroid hormone that binds to the nuclear receptors and initiates thyroid hormone action (129). In extrathyroidal tissues, the concentration of T3 in the intracellular and nuclear compartments is determined in part by the rates of T4 to T3 conversion and T3 and T4 degradation in the cell (84,130 –132).
The formation and degradation of T3 in tissues are dependent primarily on the activities of three integral-membrane thioredoxin-fold–containing selenoenzymes of approximately 60 kDa (dimer) that catalyze the selective removal of iodine from iodothyronines (132 –135). The type I deiodinase (D1) and D2 enzymes are activating enzymes that catalyze the outer-ring or 5′-deiodination (5′D) of T4 to T3. D3 is an inactivating enzyme that catalyzes the inner-ring or 5-deiodination (5D) of both T4 and T3 to their relatively inactive derivatives, rT3 and T2, respectively. The D1 can also inactivate the thyroid hormones by catalyzing the inner ring deiodination of sulfated iodothyronine conjugates (130 –132). Levels of activity of D1, D2, and D3 can be studied in cultured cell preparations (136,137), tissue slices (138,139), and tissue homogenates (140,141).
[D.1] Identification, expression, and quantification of deiodinases
Background
The presence of the deiodinases can be identified in a given tissue and their levels of activity quantified using well-established assays for enzyme activity and kinetic properties. In the cases of D1 and D3, tissue content of deiodinase protein can be assessed by immunohistochemical techniques using available antisera/antibodies (142). Levels of expression of all three deiodinase genes can be determined using samples of RNA prepared from the tissue of interest by standard reverse transcriptase quantitative polymerase chain reaction (RT-qPCR) techniques (127).
Assay of levels of deiodinase activity and/or the enzyme reaction kinetics in broken cell/tissue preparations requires the presence of compounds containing free sulfhydryl groups such as dithiothreitol (DTT). Assay of D1, D2, and D3 activity levels are generally carried out using radioactive iodothyronines as substrates followed by quantitation of the radioactive products generated per unit time. Alternatively, in the case of the D1 and the D2, activity levels can be determined using nonradioactive T4 and quantifying the T3 generated by RIA.
Deiodinase activities and their kinetic profiles and intrinsic properties (e.g., Vmax, Km, activity half-life, sensitivity to cofactors and/or inhibitors) can be determined in cell or tissue preparations.
Commentary
There are multiple protocols for deiodinase assays, and they are all acceptable provided that some requirements are followed. In general, release of tracer radioactive iodide or generation of a specific deiodinase product are the experimental endpoints measured. It is always best to use radiolabeled iodothyronines with the highest available specific activity. Even when they are stored in the dark at 4°C, there is spontaneous iodothyronine deiodination. Thus, in order to minimize background levels, tracers should be purified in Sephadex LH50 at least 24 hours before the assay. All assays should contain background controls in which there is no deiodinase-mediated substrate deiodination. Ideally, duplicate samples are run in parallel in tubes containing a large excess of substrate that outcompetes the radiolabeled iodothyronine.
Assay for D1 activity.
The preferred substrate for D1 is rT3; taking the Vmax/Km ratio as a measure of efficiency, rT3 performs as much as 700 times better than T4 as a substrate for D1. In addition, unlike T4, rT3 it is a relatively poor substrate for D3 and thus is the better substrate with which to assay D1 in tissues that also contain D3 activity. At the same time, D1 activity can also be determined using T4 as substrate. The reaction buffer varies somewhat among laboratories but most are carried out in a PBS or 2-amino-2-hydroxymethyl-1,3-propanediol hydrochloride (Tris-HCl) buffer containing ethylenediaminetetraacetic acid (EDTA; 1–2 mM), sucrose (0.25–0.3 M), and DTT (10–50 mM). The substrate concentration is 0.1–2 μM. The amount of tissue present must be adjusted to ensure a relatively low percent deiodination (<30%) in order to avoid a significant alteration of the enzyme kinetics. With broken cell preparations, the incubation time should be 1 hour or less. When deiodinase activity is studied in tissue slices or whole cells, the tissue or cells should be homogenized on ice in their incubation media prior to analysis of the products, since iodothyronines tend to adhere to cell walls.
The iodinated products can be quantified in various ways. Arguably the simplest method is to pass the reaction mixture through a column of Biorad AG 50W-X8(H+) resin soaked in 10% acetic acid. The iodothyronines are adsorbed on the resin, and the inorganic iodide passes through and can be quantified directly. Others have used precipitation of horse serum (carrier) with TCA to separate the free iodide (143). Either method requires determination that equimolar amounts of 125I and [125I]T3 (or [125I]T2 if [125I]rT3 is used as a substrate) are produced, particularly if the level of enzyme activity is low or if non-deiodinative pathways are present. This is achieved by separating the [125I]-iodothyronines and 125I by paper descending chromatography, HPLC, or UPLC. For calculating the 5′D activity, the percentage of product generated is multiplied by 2 because the specific activities of the labeled products are only half that of the substrate. D1 activity is generally expressed as picomoles or femtomoles of product per unit of time per milligram of protein (144 –147).
Assay for D2 activity.
This assay is carried out as described for the D1 assay with the following modifications: the preferred substrate is T4 (0.5–2 nM) and if tissues that also contain D1 activity are being used, 1 mM PTU is included in the incubation medium. If D3 is present, it should be saturated by adding an appropriate excess of T3 (146 –149).
Assay for D3 activity.
The preferred substrate for D3 is T3 (0.5–2 nM), and since T3 is a very poor substrate for D1 and D2, it can be successfully used to assay D3 activity in tissues that also contain D1 and/or D2 activity. Addition of EDTA to the assay buffer is not necessary. In this assay, since the radioactive substrates are labeled in the outer-ring only, the iodide generated cannot be detected, and thus quantitation of the reaction necessitates the separation of the T2 product from the substrate T3 by HPLC or descending paper chromatography. Since the T2 generated is also a good substrate for D3, it is important to dilute the enzyme preparation such that the percent deiodination is relatively low (<20%) and T2 is the only detectable compound produced (147,150 –152).
Studies of deiodinase activity in cell or tissue preparations containing more than one deiodinase are feasible but special provisions must be considered so that each deiodinase activity is measured independently.
Commentary
Often times not only the substrate of a given deiodinase but also the deiodination product can serve as a substrate for another deiodinase co-expressed in the same cell or tissue. Thus, to observe the activity of a specific deiodinase requires the use of enzyme-specific inhibitors and different substrate types and/or concentrations (Fig. 9) (153 –156). For example, measuring outer-ring D1 activity in the presence of D2 is possible if T4 or rT3 are used at their D1 Km (i.e., approximately 1 μM and 0.5 μM, respectively), which saturates D2. Measuring inner-ring D1 activity in the presence of D3 is possible if T3 or T3 sulfate (T3S) is used at its D1 Km (i.e., approximately 5 μM), which saturates D3. D1 is efficiently inhibited in the presence of 1 mM PTU, which has only minimal effect on D2 activity. This eliminates D1 activity from any D2 or D3 activities, which are not affected by PTU.
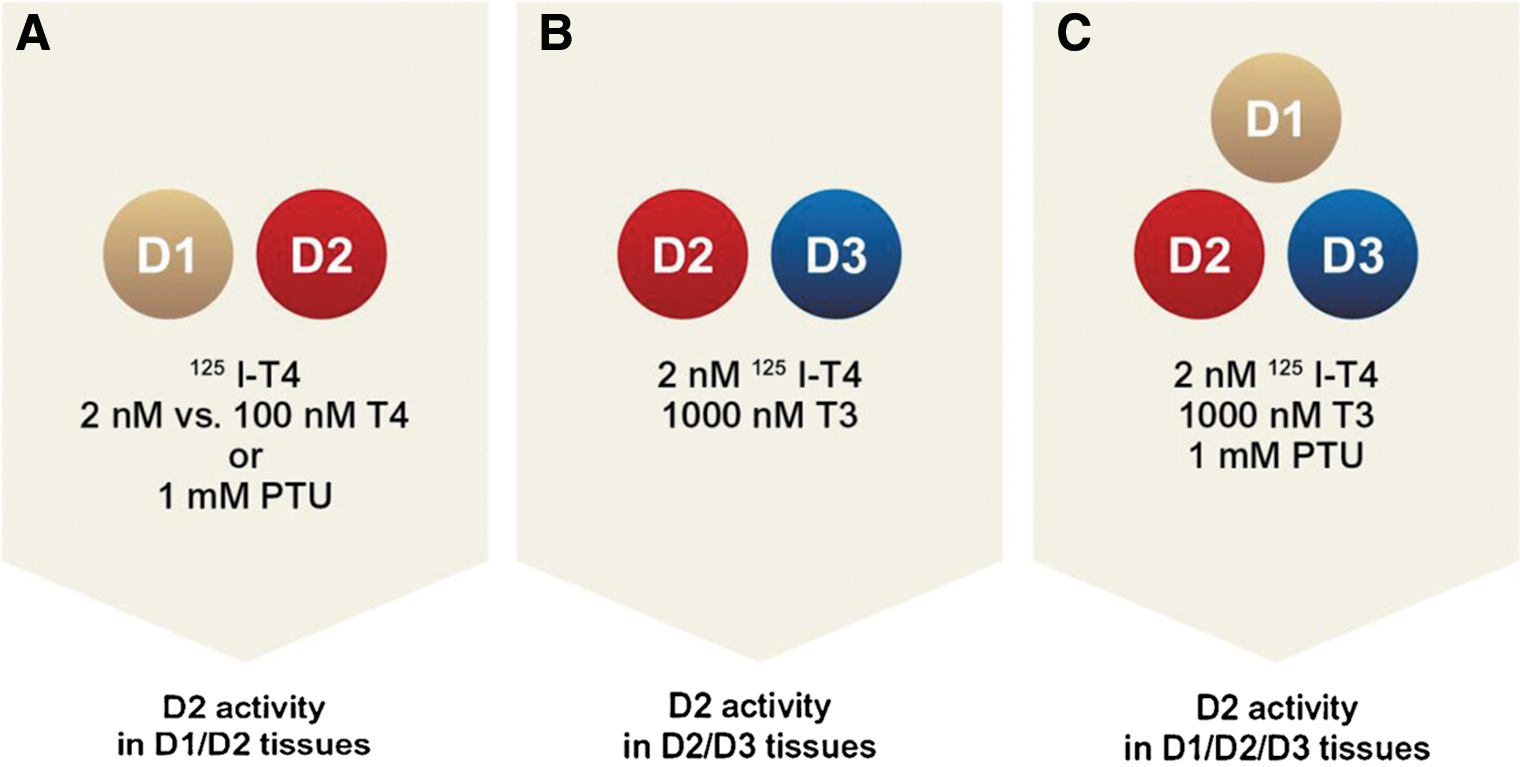
Strategies to measure individualized deiodinase activity in the presence of other deiodinases.
No specific inhibitors are known for D2 or D3. However, both D2 and D3 activities can be eliminated by adding a relative excess of their preferred substrate (i.e., T4 or T3, respectively), saturating the enzyme and outcompeting the radioactive tracer. For example, measuring D2 activity in the presence of D3 is possible by using rT3 or T4 as substrate and adding 100–1000 nM T3 in the reaction mixture. Adding the T3 excess saturates D3 binding sites but does not interfere with the D2 activity. However, a high purity reagent is preferred because, at high concentrations, even small amounts of a contaminant iodothyronine will interfere with the assay.
The Vmax of any of the deiodinases measured under optimum conditions of substrate and cofactor availability can be used as a surrogate for the amount of functional enzyme present in a cell or tissue at any given moment.
Commentary
While D1 and D3 are expressed at levels that can be measured by Western blotting or immunocyto/histochemistry using commercially available antisera (65,157,158), the combined low expression of D2 with the unavailability of sufficiently high affinity D2 antisera has impaired quantification of D2 protein (159). In fact, no consensus exists as to the validity of anti-D2 antiserum/antibodies for measurement of endogenous protein; results need to be evaluated on a case-by-case basis. However, an estimation of D2 protein levels can be obtained reliably by measuring D2 Vmax, which reflects the maximal amount of active enzyme in a cell or tissue. D1 and D3 can be assessed either via Vmax or Western blot. The protein levels of all three deiodinases can be quantified after labeling of deiodinase-expressing cells with 75Se, immunoprecipitation, and resolution by sodium dodecyl sulfate polyacrylamide gel electrophoresis, but this takes several weeks per assay for D2 (93). Note that biological alteration of Km (e.g., amino acid mutations) could alter the relationship between Vmax and protein levels.
The expression of the deiodinase genes can be determined in cells or tissues by measuring the respective mRNA levels.
Commentary
Measuring D1 mRNA levels is straightforward, and given its exquisite responsiveness to T3, it constitutes a sensitive marker of peripheral thyroid status in rodents (72). D2 is a cAMP-dependent gene and its mRNA levels can be up-regulated several-fold during sympathetic stimulation of BAT (161). At the same time, D2 exhibits strong posttranslational regulation via ubiquitination and proteasomal degradation by different components of the endoplasmic reticulum (162 –165). Thus, mRNA levels do not necessarily reflect protein expression or enzyme activity (162,166,167). The Dio3 gene is intronless, and thus appropriate controls are required given that even minimal DNA contamination could affect the RT-qPCR results. D3 has a relatively long half-life, and thus a high level of D3 activity can persist even after an elevation in D3 mRNA has dissipated (168,169). In situ hybridization is particularly useful in the brain given the complexity in the expression patterns of D2 and D3 (170 –172) (see Sections I.2 and J.1 for technical considerations).
[D.2] Deiodination in intact cells
Background
Deiodination can be studied in intact live cells. Essentially, established cell lines or primary cultures expressing 5′D and/or 5D activity are exposed to the appropriate [125I]-substrate (as previously discussed) and the radiolabeled products determined in the media and/or in cell sonicates as already described.
T4 and T3 metabolism via deiodination can be measured in live cells with the advantage that studies are performed with physiological cofactor.
Commentary
Cells are incubated with [125I]T4 or [125I]T3 in the presence of media containing 0.1%–1.0% BSA with added T4 and/or T3 to yield a physiological concentration of free hormone in the low picomolar range (Table 2). Metabolites in the media or in the cells are separated by liquid or paper chromatography (as already described). The reaction time is typically 24 hours or less. Color-free culture media must be used due to interference with the assay. The desired concentration of the substrate is achieved by incubating cells in serum-free media containing 0.1% BSA and including the appropriate concentration of nonradioactive T4 and/or T3. Time courses can be established by sampling the media followed by quantification of the products as described above. Results are expressed as picomoles or femtomoles of product per unit of time; correction for the number of cells can be achieved by cell counting or by determining the DNA or protein content. Studies in cells containing more than one deiodinase are feasible and should include appropriate controls in which one of the deiodinative pathways is saturated with an excess of nonlabeled substrate (136,137,152).
Direct measurements by equilibrium dialysis.
Direct measurement by ultrafiltration.
Calculated based on total and free hormone concentrations (equilibrium dialysis).
T4, thyroxine; BSA, bovine serum albumin; Tx, thyroidectomized.
Coculture systems with more than one cell type have been developed in which thyroid hormone transport, metabolism, and action can be studied simultaneously (i.e., D2-expressing H4 human glioma cells and D3-expressing SK-N-AS human neuroblastoma cells; Fig. 10) (173). Such a system has been used to demonstrate that paracrine signaling by glial cell-derived T3 activates neuronal gene expression.
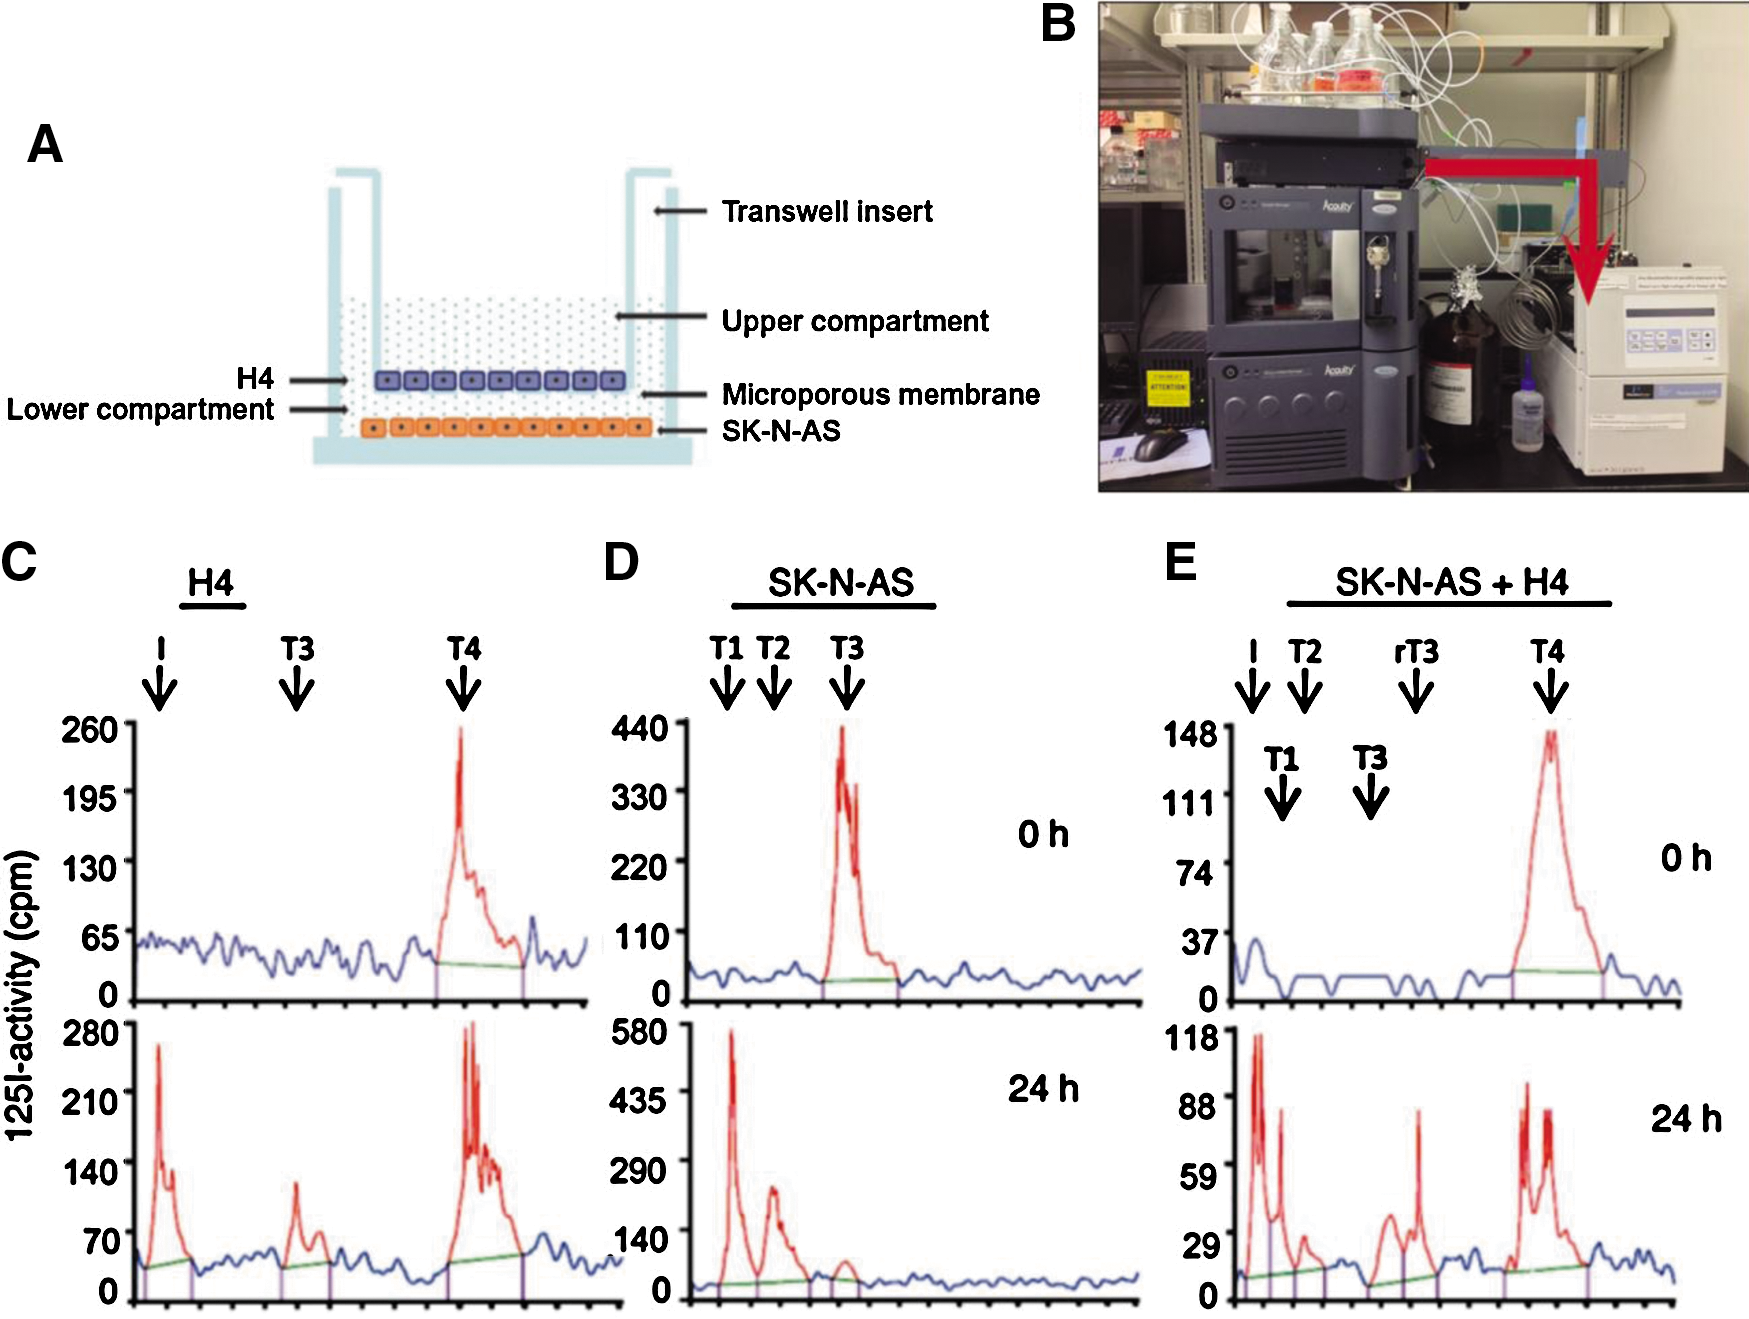
In vitro modeling of thyroid hormone deiodination and transport in the brain.
[D.3] Deiodination in perfused organs
Background
Outer-ring and inner-ring deiodination can be studied in perfused organs such as kidney and liver. Essentially, freshly harvested organs expressing 5′D and/or 5D activities are perfused with buffered solutions containing BSA and radiolabeled or cold iodothyronine substrates. The perfusate is collected over time and analyzed for deiodination products using immunoassays or HPLC. This approach is advantageous because it allows for the study of tissue-specific deiodinative pathways under physiological or defined pathophysiological conditions.
T4 to T3 conversion and the urinary iodothyronine excretion can be studied in preparations of perfused rat kidney or liver.
Commentary
In preparations of kidney perfused with T4 in BSA-containing buffer there is a liner increase in T3 production with the increase in the perfusate FT4 concentration that determines tissue T4 uptake. FT4 levels can be adjusted by increasing or decreasing the concentration of total T4 or the BSA concentration. Addition of PTU decreases renal T3 production by about 60% without affecting tissue T4 uptake, illustrating the presence of D1. In this setting there is no net renal rT3 production from T4, and degradation and urinary excretion of T3 are negligible (174 –176).
Similar to the kidney, the perfused rat liver readily extracts T4 from perfusion medium and converts it to T3. Production of T3 is a function of the size of the liver, the uptake of T4, and level of D1 expression. Production of T3, but not T4 uptake, is decreased by PTU (177,178).
Placental inner-ring deiodination can be studied in situ using a guinea pig perfusion system.
Commentary
Whereas placental D2 and D3 activities can be measured in cell dispersions or tissue sonicates (179 –182), in situ preparations can be used to study the placental D3 pathway (183,184). In an anesthetized pregnant guinea pig, the placenta is surgically exposed and a single umbilical artery and the umbilical vein cannulated, while the fetus is removed. The fetal side of the placenta is perfused through the umbilical artery with buffered solution containing BSA and [125I]T3. Placenta effluent fractions are collected at timed intervals (up to 2 hours) from the umbilical vein cannula. The contents of the perfusion buffer and the various effluent fractions are then separated and analyzed by HPLC for their iodothyronine content (183). In this setting outer-ring deiodination of T4 or rT3 is minimal (184) possibly because placental outer-ring deiodination is greatest in the zone immediately adjacent to the uterine wall (185), distant from the fetal side of the organ.
[D.4] Deiodination in whole animals
Background
The study of the deiodination pathways in the whole animal is challenging since one is dealing with three deiodinases, each of which can deiodinate not only T4 and/or T3, but also the products of these reactions. In addition there are no known agents that will selectively and completely inhibit individual deiodinases. Thus, until mice deficient in one or more of the deiodinases became available, it was very difficult to investigate the role of the individual deiodinases in vivo.
Total body deiodination can be studied in live animals following administration of radiolabeled iodothyronines (e.g., [125I]T4 or [125I]T3). Iodothyronines can be injected acutely or long-term via a mini-pump. This approach allows for studies to be conducted under controlled physiologic conditions. Additional information may be obtained by administering more than one iodothyronine labeled with different isotopes of iodine.
Commentary
Total body phenolic-ring deiodination can be readily assessed in rodents following the administration of a single dose of [125I]T4 or [125I]T3. The rodents are then placed in individual cages that permit the separate collection of urine and feces. After an appropriate period of time (42–72 hours) the fraction of the injected radioactivity excreted in the urine can be determined, and the vast majority of this will be inorganic iodide (186). This protocol can be used to assess the effects of different conditions such as fasting, cold exposure, hyper- or hypothyroidism, and the absence of one or more of the deiodinases on total deiodination. This type of study can be carried out using a relatively low level of radioactivity. However, obtaining any reliable information regarding the extent of T4 conversion to T3 or rT3 by this method is complicated by the fact that both compounds are cleared from serum at a faster rate than T4 itself.
Some information concerning the labeled products formed from [125I]T4 or [125I]T3 can be obtained using animals implanted with osmotic mini-pumps containing the labeled hormones. Once the daily excretion of radioactivity in the urine and feces becomes constant, indicating that the animals have reached isotopic equilibrium, the animals can be sacrificed. The serum, tissues, urine, and feces can be obtained and the identity of their labeled compounds determined, following their extraction and separation by HPLC or chromatography. Parallel studies using mice deficient in one or more of the deiodinases will shed light on the relative importance of the different metabolic pathways. Several extraction procedures have been published and care must be taken to determine and correct for extraction efficiency (83,187).
Results of these studies must be interpreted carefully and alternative possibilities considered. For example, it is well-established that both T4 and T3 can be conjugated with sulfate in vivo, and these conjugates are excellent substrates for the inner-ring deiodinating activity of the D1. The thyroid hormones are also conjugated with glucuronic acid and most of the T4 in the kidney is present as T4 glucuronide, which is not detected in an RIA (137). In addition, a significant fraction of the metabolites generated from T4 and T3, including the glucuronide conjugates, are to be found in the bile, the intestinal contents, and feces.
[D.5] Non-deiodination pathways of thyroid hormone metabolism
Background
Nonnutrient substances that reach the gastrointestinal system are also known as xenobiotic compounds and are identified in the liver through specific receptors; for example, pregnane X receptor (PXR) and constitutive androstane receptor (CAR). Binding to these xenobiotic sensing receptors, PXR and/or CAR, induces the expression of metabolic enzymes including Phase I (the cytochrome P450 family of enzymes) and Phase II (e.g., sulfotransferases, glucuronosyltransferases, and glutathione-S transferases). These pathways modify xenobiotic molecules by introducing reactive or polar groups into their molecules to increase their water solubility, thereby facilitating their elimination. The Phase II pathways include glucuronidation, methylation, sulfation, acetylation, glutathione conjugation, and amino acid conjugation.
Perhaps because of the high iodine content, the iodothyronines are also metabolized by some of the Phase II pathways; that is, conjugation of the phenolic hydroxyl group with sulfate or glucuronic acid (188). In fact, a relatively small portion of the daily thyroid hormone production is processed through these pathways, but it can be much more if these metabolic pathways are induced by xenobiotic compounds such as central nervous system (CNS)-acting drugs (e.g., phenobarbital, benzodiazepines), calcium channel blockers (e.g., nicardipine, bepridil), steroids (e.g., spironolactone), retinoids, chlorinated hydrocarbons (e.g., chlordane, dicholorodiphenyltrichloro-ethane, tetrachlorodibenzo-p-dioxin, and polyhalogenated biphenyls such as polychlorinated biphenyl and polybrominated biphenyl, among others) (189).
Sulfated iodothyronines do not bind to the TRs, and sulfation mediates the rapid and irreversible deiodination of iodothyronines by D1. Therefore, the concentrations of sulfated iodothyronines in serum are normally low. Inner-ring deiodination (inactivation) of T4 and T3 by D1 is markedly facilitated after sulfation, whereas outer ring deiodination of T4 is blocked after sulfation. As expected, the D1 KO mouse exhibits marked increase in fecal excretion of [125I]-iodothyronines during the 48 h after injection of [125I]T4 or [125I]T3, whereas urinary excretion of [125I]iodide was markedly diminished (186). Notably, D2 and D3 are not capable of deiodinating sulfated iodothyronines. Plasma levels and biliary excretion of iodothyronine sulfates are increased in fetal and cord blood, nonthyroidal illness (NTI), fasting, and by inhibition of D1 activity with PTU or iopanoic acid (190). Under these conditions, T3S may function as a reservoir of inactive hormone from which active T3 may be recovered by action of tissue sulfatases and bacterial sulfatases in the intestine (188).
Iodothyronine glucuronides are rapidly excreted in the bile. However, this is not an irreversible pathway of hormone disposal. After hydrolysis of the glucuronides by bacterial β-glucuronidases in the intestine, part of the liberated iodothyronines are reabsorbed, resulting in an enterohepatic cycle of iodothyronines (188). Nevertheless, about 20% of daily T4 production appears in the feces, probably through biliary excretion of glucuronide conjugates. Glucuronidation is catalyzed by UDP-glucuronyltransferases (UGTs) that utilize UDP-glucuronic acid (UDPGA) as the cofactor. UGTs are localized in the endoplasmic reticulum predominantly of liver, kidney, and intestine. Most UGTs are members of the UGT1A and UGT2B families (191).
In general, the relation between tissue enzyme activities for the different iodothyronines and the expression of individual isoenzymes is hardly known, especially for the sulfotransfereases (SULTs). Many SULTs exhibit overlapping substrate specificities. In addition, multiple SULTs in the same tissue can be involved in the sulfoconjugation of the same iodothyronines, resulting in clear redundancy [see Wu et al. (192) for an overview]. As a consequence, the biochemical properties of tissue SULT activity reflect the composite effect of different isoenzymes. Expression or protein levels of the different isoenzymes can be studied using RT-qPCR and/or Western blotting, but do not necessarily reflect the overall tissue sulfoconjugation activities (192,193).
Sulfotransferase activities and their intrinsic properties can be determined in cell or tissue preparations using 3′-phosphoadenosine-5′-phosphosulfate (PAPS) as the sulfate donor.
Commentary
Iodothyronine sulfation is catalyzed by SULTs using PAPS as the sulfate donor. In humans, SULTs show overlapping substrate specificity. In humans, they can be subdivided into different families, SULT1, SULT2, SULT4, and SULT6. All members of the human SULT1 family (i.e., hSULT1A1, -1A2, -1A3, -1B1, -1C2, -1C4, and -1E1) catalyze the sulfation of iodothyronines (194). hSULT1A1-3, −1B1, and -1C4 and also native enzymes in liver have a substrate preference for 3,3′-diiodothyronine (T2), which is catalyzed much faster than T3 and rT3, whereas T4 sulfation is negligible. hSULT1E1 equally prefers T2 and rT3 over T3 and T4 but is the only known SULT so far having significant T4-sulfotransferase activity (194). As a consequence, T2 is generally used to study sulfotransferase activities in tissues homogenates under different conditions. Different human SULTs have also been shown to catalyze the sulfation of iodothyronamines (195).
Sulfotransferase activity assay.
There are multiple acceptable protocols for sulfotransferase assays. It is best to use radiolabeled iodothyronines with the highest available specific activity and assays should contain background controls and samples running in parallel in tubes without PAPS. Due to relatively high Km values, it may be difficult to out-compete the radiolabeled iodothyronine by a large excess of substrate. SULT activity can be analyzed by incubation of 0.1 μM [125I]-iodothyronine of interest for 30 minutes with tissue homogenate, cytosol, or recombinant SULT in the presence or absence (blank) of 50 μM PAPS in PBS-EDTA buffer (194). The reaction is stopped by the addition of 0.1 M HCl and the products separated by filtration in Sephadex LH-20 minicolumns into iodide, sulfated iodothyronines, and nonsulfated iodothyronines (196).
Iodothyronine glucuronidation activities are determined in microsomal cell or tissue preparations using UDPGA as a cofactor.
Commentary
Glucuronidation of T4 and T3 is catalyzed by different members of the UGT1A family (197). Usually, this involves the glucuronidation of the hydroxyl group, but human UGT1A3 also catalyzes the glucuronidation of the side-chain carboxyl group, with formation of so-called acyl glucuronides. Interestingly, Tetrac and TRIAC are much more rapidly glucuronidated in human liver than T4 and T3, and this occurs predominantly by acyl glucuronidation (198). Acyl glucuronides are reactive compounds that may form covalent complexes with proteins. It is unknown if this is a significant route for the formation of covalent iodothyronine–protein complexes.
Glucuronidation activity assay.
There are multiple acceptable protocols for glucuronyl-transferase assays. Radiolabeled iodothyronines with the highest available specific activity should be used and assays should contain background controls. Iodothyronine glucuronidation activity can be analyzed by incubation of 1 μM of the [125I]-iodothyronine of interest for 60 minutes with microsomes in magnesium chloride–containing Tris-HCl (pH 7.8) buffer, in the presence or absence (blank) of 5 mM UDPGA (197,199). When tissue microsomes are analyzed, 1 mM PTU may be added to the reaction mixture to prevent iodothyronine deiodination without affecting their glucuronidation. Reaction is stopped by the addition of ice-cold ethanol and glucuronide formation is analyzed in supernatant by chromatography on Sephadex LH-20 minicolumns as already described.
[E] Inducing Hypothyroidism and Thyroid Hormone Replacement
Overview
Hypothyroidism is a pathological state in which thyroid hormone signaling is decreased systemically or locally in one or more tissues. As a result of the depletion of nuclear T3, there is modification in the expression of T3-responsive genes, decreasing the biological effects of thyroid hormone. Induction of hypothyroidism has been used traditionally to define and characterize T3-responsive processes, an approach that can be used in animals or in cultured cells. In rodents this is accomplished by decreasing serum levels of T3 and in cultured cells by reducing the free T3 concentration in the medium, below physiological levels. Alternatively, TR antagonists have been developed and used in cells.
[E.1] Hypothyroidism in animals
Background
Serum T3 concentrations in rodents can be reduced surgically by total thyroidectomy, or medically by treatment with antithyroid drugs or 131I. In addition, there are a number of rodent strains in which key genes in the hypothalamic-pituitary-thyroid (HPT) axis exhibit spontaneous mutations or have been genetically modified, ultimately disrupting thyroid hormone synthesis and/or secretion. The experimental approach for achieving hypothyroidism should take into consideration the age of the animals (i.e., prenatal, early postnatal, after weaning). Lastly, disruption and/induction of deiodinases or thyroid hormone transporters may result in tissue-specific hypothyroidism.
Body weight gain should be monitored during induction of hypothyroidism. For cross-reference between experiments, an observed plateau in body weight gain should be taken to define a state of systemic hypothyroidism. T3-responsive gene expression and enzyme activities, particularly liver D1 expression or activity, can be used as additional measures of thyroid status.
Commentary
A drop in serum T4 and an elevation in serum TSH are the first indications of a disruption in the function of the HPT axis. More time is usually needed to reduce serum T3. Given that T3 is the biologically active thyroid hormone, in theory, a state of systemic hypothyroidism could be considered to exist after serum concentrations of T3 have dropped below the normal range. However, given that the drop in serum T3 might not reflect tissue T3 concentration at early time points, most studies define systemic hypothyroidism to exist when a major thyroid hormone–dependent biological effect is observed; that is, body weight gain plateaus, or the expression level of a T3-responsive gene or the activity of a T3-responsive enzyme is reduced. While in human studies, TSH would be an ideal parameter to define thyroid status, in rodents normative data are lacking to allow for cross-study comparison using TSH as a primary marker of thyroid status.
Because rodents continue to grow throughout life and because growth hormone secretion is exquisitely sensitive to T3 in rats, growth, as assessed by body weight gain, is a very sensitive marker of thyroid hormone action in rats (200,201). An approximately 100 g rat stops putting on weight about 3 weeks after total thyroidectomy; at this time point, thyroid hormone levels have dropped by 75% and pituitary growth hormone content is almost undetectable (201). An absence of growth for 2 weeks has been proposed as the gold-standard for defining a state of severe systemic hypothyroidism (202); shorter periods of time (e.g., 5 days of documented growth plateau) should be acceptable as well. Notably, arrest of linear growth (as determined by tail length), which is very sensitive to thyroid hormone, would be an excellent and more generally applicable indicator of hypothyroidism, although published data specifically documenting this are lacking. Less data are available for mice, in which growth hormone is less T3-sensitive, so a plateau in body weight gain is not a reliable indicator of hypothyroidism.
A molecular approach to define intermediate states of systemic hypothyroidism would involve assessment of the expression of T3-responsive genes or the activity of T3-responsive enzymes such as cardiac mRNA levels of myosin heavy chain (MHC) isoforms or hepatic α-glycerophosphate dehydrogenase (α-GPD) activity or D1 activity. While any T3-responsive tissue could be examined, traditionally the liver has been the organ of choice to assess systemic hypothyroidism given its high number of TRs and well-defined T3-responsive pathways. Liver D1 activity is considered the most sensitive genetic index of systemic thyroid status and thus can assist in the characterization of very subtle states of disruption in thyroid hormone signaling (72) (see Sections D.1 and I.2).
Systemic hypothyroidism can be induced by surgical total thyroidectomy in adult rats or mice. Systemic hypothyroidism is achieved usually between 5 and 8 weeks after surgery. Hemi-thyroidectomized rats develop a mild form of systemic hypothyroidism.
Commentary
Surgical total- or hemi-thyroidectomy in rodents is a widely used procedure given the ready access to the thyroid gland (Fig. 11) (203). In general, when performing total thyroidectomy on a 100 g rat or a 20 g mouse, the parathyroid glands are preserved. Because surgical skills and parathyroid anatomy may vary, some investigators assume that the procedure will result in postsurgical hypoparathyroidism, and thus provide animals with a solution of 2%–4% calcium lactate in 5% dextrose ad libitum as the only fluid source for at least 10 days postsurgery.

Dissection of the rodent thyroid gland.
Thyroparathyroidectomized rats and mice can also be purchased from commercial vendors.
Systemic hypothyroidism can be induced by chemical thyroidectomy caused by the administration of antithyroid drugs. The time frame of hypothyroidism onset is variable and depends on the type of drug and regimen used.
Commentary
Chemical inhibition of the thyroid gland can be induced via administration of MMI, PTU, KClO4, or NaClO4. These drugs can be given through daily intraperitoneal injections (e.g., PTU 1–2 mg/100 g BW, MMI 1–5 mg/100 g BW (204)), added to the chow (e.g., 0.02%–0.15% PTU or 0.01% MMI or KClO4 1.25% (205)) or the drinking water (0.01%–0.1% MMI, 0.01%–0.1% PTU, or 0.1%–1% KClO4 or NaClO4). A major pitfall of this strategy is that all of these antithyroid drugs have a bitter taste and, when added to the drinking water, consumption should be monitored. In fact, PTU is a commonly used bitter stimulus in studies of taste physiology (206). Empirically, it has been found that KClO4 is less palatable than NaClO4. Because taste sensitivity varies among inbred mice, water consumption will be variably affected, and in some strains significant dehydration may occur. At the same time, drug consumption may also vary because rats and mice may stop drinking bitter fluids and can withstand total water deprivation for several days before hyperosmolality develops (207). Sucrose can be added to the water to prevent this, but responses are variable (208). Thus, if drinking water is the delivery method chosen, body weight and drinking consumption should be monitored carefully and drug concentrations adjusted appropriately. A minor consideration in rodents is that treatment with PTU or MMI elevates serum calcitonin concentration and, with prolonged use, C-cells will exhibit physiologic or reactive hyperplasia. This is not related to the state of systemic hypothyroidism; the cause is not known.
Serum T3 levels will fall below normal within 10–15 days depending on the drug concentration and route used. As an example, there was a 20-fold increase in serum TSH in rats treated for up to 3 weeks with 0.05% MMI in drinking water (209). Treatment with 0.1% PTU in drinking water, which also inhibits peripheral conversion of T4 to T3, resulted in a faster reduction in serum T3 and increase in serum TSH than in rats treated with 0.1% MMI. However, these differences were no longer observed after 3 weeks of treatment (209). A state of hypothyroidism can be achieved faster if PTU or MMI are combined with 1% KClO4 in the drinking water, a potent NIS inhibitor (210,211). However, their combination will also magnify the effect that these drugs have on water consumption.
A reasonable alternative is to use 0.15% PTU-containing low-iodine food pellets, which is commercially available and has been used successfully (212). It has been reported that a systemic state of hypothyroidism can be achieved after 4 weeks on this diet; a faster approach includes combining water 0.01% MMI, which is a concentration that does not seem to interfere with water consumption. In long-term experiments (months), compensatory TSH-driven thyroid growth can raise serum T4 back to nearly normal levels, even while animals are on the PTU–low-iodine diet. Thus, it is important to document a state of systemic hypothyroidism throughout the experiment.
Systemic hypothyroidism can be induced by radioactive iodide ablation of the gland. In adult animals thyroid hormone release is markedly reduced after 1 week of 131I administration. Growth in newborn animals plateaus after 3–4 weeks of 131I administration.
Commentary
Intraperitoneal administration of 131I in solution results in transient or permanent hypothyroidism in adult rats (250 g BW) depending on the dose used (213). A progressive thyroidal degenerative process is observed after administration of 300 or 525 μCi 131I but regeneration occurs after several months; regeneration is not seen when 875 μCi is used (213). Other tissues may be damaged by the radiation: fibrosis of the parathyroid glands has been observed when 525 or 875 μCi of 131I is used. There can be tracheal damage and transient renal effects (213). No damage to the liver has been observed (213). The earliest metabolic indicator of decreased glandular function is a drop in the protein bound 131I, which is observed as early as 24 hours after the injection of 875 μCi of 131I (214). This approach is also effective in newborn rats after intraperitoneal administration of 80 μCi of 131I (215). In a 20–25 g mouse, direct ablation can be achieved with 200 μCi of 131I (216).
A state of systemic hypothyroidism can be achieved quickly and effectively by the use of combined approaches.
Commentary
Any combination of low-iodine diet, antithyroid drugs, surgery, and radioactive iodide could be used quickly and effectively to achieve a state of severe systemic hypothyroidism. Typically, 131I is preceded by a low-iodine diet. Alternatively, surgical thyroidectomy can also be followed by a low-iodine diet for 2 weeks, followed then by remnant ablation with 131I; the postsurgical ablation dose for a 200–250 g rat can be ∼80 μCi (217); for mice, 25–50 μCi has been used successfully.
Secondary hypothyroidism can be induced in rats by surgical hypophysectomy.
Commentary
Surgical hypophysectomy in rodents requires skill and experience. The parapharyngeal approach to remove the pituitary gland in rodents has been used traditionally (218,219). This approach has been largely supplanted by the transauricular approach (220,221). This procedure leaves the animal deaf in one or both ears, which would affect their performance in certain behavioral tests. Typically, an anesthetized 50–300 g rat is immobilized in a Hoffman–Reiter hypophysectomy instrument, which allows for the stereotactic placement of the tip of a suction needle proximate to the pituitary gland, which is then aspirated. The animal is then removed from the instrument and provided postoperative care. The completeness of hypophysectomy is confirmed by the absence of weight gain over a 4 week period after surgery. Perioperative care of these animals is critical: hypophysectomized animals have difficulty regulating body temperature and thus require constant environmental conditions; a warmer room (temperature between 72°F and 76°F) is ideal. This procedure increases diuresis and thus cages containing contact bedding must be changed frequently. Given their metabolic fragility, experiments are typical conducted after the first 6 to 10 postoperative days. All hypophysectomized animals are maintained on drinking water containing appropriate electrolites and 5% glucose, ad libitum. Water supplements commence on the day of surgery and should continue for 14 days. To produce animals that exhibit selective secondary hypothyroidism, hypophysectomized animals are treated with daily replacement doses of growth hormone, luteinizing hormone, follicle stimulating hormone, prolactin, testosterone propionate, 17β-estradiol benzoate, cortisone, or vehicle by subcutaneous injections (222).
The Nkx2 homeobox 1 (Nkx2.1; T/ebp, TTF-1) KO mouse is a model of thyroid dysgenesis.
Commentary
The Nkx2.1 KO mouse lends itself for studies of fetal thyroid gland development as well as for studies in which fetal thyroidal secretion does not exist. Thyroid-specific enhancer-binding protein (T/ebp)/Nkx2.1-null mouse thyroids degenerate by embryonic day (E) 12–13 through apoptosis, whereas T/ebp/Nkx2.1-heterogyzgous mice exhibit hypothyroidism with elevated TSH levels. The Nkx2.1 (T/ebp, TTF-1) transcription factor regulates thyroid-specific gene transcription but is also important for development of pituitary, lung, and ventral brain regions (223). The homozygous Nkx2.1 KO mouse is not suitable for postnatal studies since these animals die at birth due to profoundly hypoplastic lungs, a severely defective hypothalamus, and absence of thyroid and pituitary glands. On the other hand, Nkx2.1-heterozygous mice were shown to exhibit hypothyroidism with elevated TSH levels and have a neurological defect, although they appear to be healthy and are fertile. This thyroid phenotype is caused by reduced expression of the TSH receptor due to T/ebp haplo-insufficiency.
The Pax8 KO mouse, the TSH receptor KO mouse, and the mouse homozygous for the autosomal recessive gene hypothyroid (hyt) exhibit severe congenital hypothyroidism of fetal onset.
Commentary
Given that the Pax8 gene governs thyroid-specific transcription, its inactivation results in a small thyroid gland that lacks follicle formation (224). Pax8 KO mice have undetectable serum T4 and T3 levels, increased postnatal mortality, and growth retardation. In contrast to the Nkx2.1 KO, the Pax8 KO mouse survives birth but dies after weaning. Postnatal treatment with T4 or T3, will rescue these animals. Withdrawal of treatment during adult life produces a severely hypothyroid animal that can survive for 6 months or longer.
The molecular defect in the hyt mouse is an inactivating point mutation in the gene encoding the TSH receptor (TSHR). Neonatal hyt/hyt mice have reduced serum T4 ranging from 1/5 to 1/6 of normal as well as significantly delayed somatic and behavioral development. The hyt/hyt mouse provides an ideal model for exploring the effect of severe primary inherited hypothyroidism in utero and in the early neonatal period (225,226). The TSHR KO mouse is profoundly hypothyroid with no detectable thyroid hormone in serum and elevated serum TSH, exhibiting developmental and growth delay as well as infertility if not supplemented with T4 (227).
The mouse with a missense mutation in the dual oxidase 2 (DUOX2) gene and the Cog mouse (congenital goiter) are less severe models of congenital hypothyroidism.
Commentary
Mice with a missense mutation in the DUOX2 gene exhibit a milder form of congenital hypothyroidism. The DUOX2 gene is involved in the generation of H2O2 for thyroid peroxidase, the enzyme that catalyzes iodine organification into thyroglobulin for thyroid hormone synthesis. A valine to glycine replacement (V674G) in DUOX2 explains the thyroid dyshormonogenesis (228). The homozygous DUOX2 mutant develops to adulthood but exhibits dwarfism and suffers from hearing impairment. Serum T4 levels are 10% of wild-type levels and are associated with an approximately 100-fold elevation in serum TSH and a dysplastic anterior pituitary. This mouse model of congenital hypothyroidism can be made more severe by simultaneous targeting of DUOXA1 and DUOXA2, which are specific maturation factors required for targeting of functional DUOX enzymes to the cell surface. Homozygous males and females exhibit goiter and congenital hypothyroidism with undetectable serum T4 and 500- to 2500-fold elevated TSH levels, respectively (45).
The cog mouse exhibits an autosomal recessive mutation that has been mapped to the thyroglobulin gene (230,231). Young adult cog mice exhibit reduced rate of growth, mild anemia, lower serum T4 and T3, and elevated serum TSH. Thyroids from mutant mice are hypertrophied, deficient in colloid, accumulate less iodine (partially susceptible to perchlorate discharge), and have a marked deficiency in thyroglobulin content (230).
The TRH KO mouse is a model of tertiary hypothyroidism, in which the disruption in thyroid function is only mild.
Commentary
The TRH KO mice are viable and fertile and exhibit normal development (80). However, they have a marked decrease in serum T4 (about 60% of control values), elevation of serum TSH level, and diminished TSH biological activity. The anterior pituitary has decreased TSH immune-positive cells, which is corrected by TRH but not thyroid hormone replacement. The TRH KO mouse exhibits a slight growth delay by 4 weeks of age that is normalized by 8 weeks of age or by treatment with T4 (80). Because of the role played by TRH in the pancreatic islets, the TRH KO mice also exhibit hyperglycemia, which is accompanied by impaired insulin secretion in response to glucose.
Cell- and tissue-specific forms of hypothyroidism related to deiodinase activities can be studied in vivo via disruption of the D2 pathway or induction of the D3 pathway.
Commentary
The activity of the deiodinases can modify T3 levels in a cell-specific fashion without affecting circulating thyroid hormone levels (84). A disruption in the D2 pathway has been shown to decrease T3 production locally and disrupt thyroid hormone signaling in D2-expressing cells (92,173,232 –234). This is illustrated by the approximately 50% reduction in T3 content in the D2 KO brain (187). D2 inhibitors can be used but with caution due to off-target effects. For example, inhibition of D2 has been identified as the underlying cause in the elevated serum TSH associated with amiodarone treatment (235), but amiodarone also inhibits D1 and can have its own TR effects as well. Similar concerns exist with iopanoic acid, used to inhibit D2 and disrupt thyroid hormone signaling in BAT (236,237). The use of the D2 KO animals constitutes the best model to study the localized hypothyroidism due to disruption of the D2 pathway.
Tissues expressing D3 have decreased thyroid hormone signaling as a result of rapid T3 inactivation to T2 and thus constitute a model of localized hypothyroidism (62,63,238,239). This can be exaggerated during D3 reactivation during illness, ischemia, or hypoxia that leads to localized disruption in thyroid hormone signaling in different tissues such as myocardium and brain (62 –65,238,241).
Cell- and tissue-specific hypothyroidism related to iodothyronine transport can be studied in vivo via disruption of various transporter systems.
Commentary
Inactivating mutations in the gene encoding MCT8 disrupt T3 transport across plasma membrane and decrease thyroid hormone signaling (107,108). Given that D2 is expressed in glial cells and TR mostly in neurons, the MCT8 inactivating mutation is thought to promote neuronal hypothyroidism by disrupting the paracrine effects of glia-made T3 at a critical time for CNS development. In fact, the existence of this paracrine mechanism was verified in cocultures of glia and neuronal cell lines (173). Clinical evidence supporting this mechanism was first obtained in patients with severe neurological phenotype exhibiting the Allan-Herndon-Dudley syndrome (107,108).
[E.2] Thyroid hormone replacement in animals
Background
The molar ratio of T4 to T3 in rat thyroids is 8:1 (242) and the estimated T4/T3 ratio in the thyroidal secretion is 5:1 (1000 pmol/d of T4 to 190 pmol/d of T3), indicating a small contribution of thyroidal T4-to-T3 conversion to the daily T3 production in the rat (132). Thus, the prohormone T4 is the major secreted iodothyronine in iodine-sufficient rats. While all T4 is secreted by the thyroid, about 60% of daily T3 production is via peripheral deiodination of T4, and the remaining 40% secreted directly from the thyroid gland. Notably, the human thyroid gland contributes with only about 20% of the daily T3 production (132).
In theory, thyroid hormone replacement in rodents could be modeled on the protocols applied in humans; that is, starting thyroid hormone replacement based on weight and monitoring serum TSH and T4. However, in rats L-T4 monotherapy cannot simultaneously normalize serum T3, T4, and TSH, presumably because of the higher thyroidal T3 production in rodents (243,244). Thus to normalize T3 and TSH, the serum T4 must be higher than normal in rats, and the same applies to tissue T3 and T4 content. Historically, investigators have used the daily T4 production rate, about 10 ng/g BW, as a replacement dose in L-T4 monotherapy in rats because this dose is sufficient to normalize the growth rate (200). However, if normalization of serum TSH is desired, a higher dose (approximately 20 ng/g BW) is required. While a similar approach for L-T4 treatment has been used in hypothyroid mice (i.e., treatment dose being equivalent to the daily production rate) normative data are lacking to determine whether serum thyroid function tests and tissue T3 and T4 levels respond similarly as in rats.
The daily T4 replacement dose in adult rats previously rendered hypothyroid should approximate the daily production rate if growth rate is held as the primary endpoint defining the euthyroid state. Higher doses of L-T4 must be used if serum TSH is to be normalized. If other thyroid hormone–sensitive endpoints are to be considered, the appropriate T4 dosing must be determined empirically on a case-by-case basis.
Commentary
In general, normalization of serum T3 or biological parameters such as growth, the expression of a T3-responsive gene, or the activity of a T3-responsive enzyme in the liver are acceptable parameters when considering thyroid hormone replacement in rats previously rendered hypothyroid. Daily delivery of ∼8 ng/g BW to adult rats previously rendered hypothyroid has been shown to normalize serum T3 levels, growth rate, and the activity of liver α-GPD, a very sensitive index of systemic thyroid status in rats (202).
For practical reasons, administration of T4 is the method used most frequently to restore euthyroidism (200,202,245, 246). However, because of the substantial direct thyroidal secretion of T3 in rodents, the ideal thyroid hormone replacement regimen would feature a mixture of T4 and T3. Some studies have established the optimal dosing for combination therapy in rodents (244). When T4 is used alone for replacement, tissue T3 content can vary across a large number of tissues because of the role played by the deiodinases as a local source of tissue T3 (via conversion from T4) (243,244).
The calculated daily T3 production is approximately 2.7 ng/g BW (132). Notably, a slightly lower dose of T3, 2.0 ng/g BW, has been shown to restore growth and the activity of liver α-GPD in previously rendered hypothyroid rats (202). However, administration of T3 alone is not sufficient to restore euthyroidism in all tissues, particularly in those with a significant contribution of the D2 pathway (243,244).
The parenteral route is preferred to deliver thyroid hormone to rodents; for example, intraperitoneal, subcutaneous, or osmotic pumps or subcutaneously implanted pellets.
Commentary
T4 and T3 solutions are prepared in 40 mM sodium hydroxide and diluted in saline for injections. When protected from light, stock solutions can be stored at −20°C for a few weeks. Daily injections bypass concerns about variable intake if the hormone is administered in food or water (see following text). However, it should be borne in mind that injections produce a rapid, supraphysiological peak in systemic T4 or T3 levels. Alternative delivery methods for T4 or T3 administration such as subcutaneous pumps or pellets may be preferred if relatively constant rates of delivery are desired. T4 and T3 can be mixed with water or food, but these methods carry the intrinsic variability of food or water consumption that might preclude their use in some experiments. Treatment duration can span days, weeks, or months. Preferably, doses should be divided daily (every 12 hours) given the relatively short half-lives of T3 and T4 in rodents (2 and 8 hours, respectively). Blood sampling for measurement of thyroid hormone levels must take into account the timing of the last injection.
Age-appropriate regimens for T4 replacement should be used for hypothyroid neonatal mice.
Commentary
In models of congenital or neonatal hypothyroidism, T4 replacement should be started at birth (day 0) and continued on a daily basis through at least postnatal day 10, a critical thyroid hormone–dependent developmental period in mice (247). Serum T4 levels in severely hypothyroid mice can be restored to age-matched control levels via subcutaneous injections of T4 on days 0–5 (4 ng/g), 6–8 (5.8 ng/g), and 9–10 (9.1 ng/g) for the mouse (248 –251). Injections can be performed using a 0.5 mL syringe with a 30-gauge saline-treated needle.
Mouse embryonic stem cells can be driven to differentiate into functional thyroid follicular cells in vitro, restoring systemic euthyroidism when transplanted into hypothyroid mice.
Commentary
Transient overexpression of the transcription factors NKx2-1 (formerly called TTF-1) and Pax8 directs mouse embryonic stem cells to differentiate into thyroid follicular cells. When treated with TSH these cells organize into 3D follicular structures and activate thyroid functional genes including NIS, TSH, thyroglobulin, and thyroperoxidase genes (252,253). These in vitro derived follicles show iodide organification activity and when grafted in vivo into athyroid mice are able to restore serum thyroid hormone levels and promoted subsequent symptomatic recovery (252).
[E.3] Hypothyroidism in cultured cells
Background
Culture medium generally contains animal serum, and so cultured cells are exposed to iodothyronine concentrations that depend on the source of the serum. For example, if fetal bovine serum (FBS) is used to support cell growth, the ambient T3 and T4 concentrations in the medium will reflect the thyroid hormone levels of the calves used to produce the serum. Historically, serum taken from thyroidectomized animals or animals treated with antithyroid drugs have been used to generate hypothyroid media (254). Because of a lack of commercial availability of such serum, chemical stripping has become more common, either with charcoal, anion exchange AG1-X8 resins, or both (255,256). Depending on the cell type being studied, using serum-free media may also be an option, though most cells propagate better in media containing serum.
Cells in culture can be made hypothyroid using media supplemented with either (i) charcoal-stripped serum, (ii) resin-stripped serum, (iii) serum obtained from hypothyroid animals, or (iv) medium not supplemented with serum.
Commentary
Using “defined” media to induce hypothyroidism has a number of caveats. While many reports indicate “>99%” of T3 and T4 are removed via standard stripping protocols, some variability exists in the degree of T3 and T4 removal achieved by the various procedures. This variability may arise both from factors related to the type of serum and from the method of stripping (257,258). Furthermore, current chemical stripping methods do not allow for the depletion of thyroid hormone without also depleting other circulating factors. Many small molecules such as growth factors or hormones (including sex steroids, adrenal steroids, and vitamin D) may also be removed during stripping, and thus the biologic changes seen over time cannot be described as representing isolated hypothyroidism (257). Experimental design should compare groups with thyroid hormone replaced (versus vehicle replaced) to enable specific attribution of the results to thyroid hormone deficiency. If a more isolated depletion of T3 and T4 is necessary, preparation of hypothyroid animal serum has been shown to be potentially cost-effective, despite an initial appearance of impracticality (254).
Using depleted serum has been shown to induce cellular hypothyroidism, as assessed by the expression level of T3-responsive genes, in as little as 24 hours (259). In theory, the time needed to achieve hypothyroidism could be shortened by frequently changing the media (e.g., every few hours instead of daily); this would accelerate the depletion of intracellular T3 stores. Similarly, prolonged culture time in T3- and T4-depleted media would be expected to induce a more profound state of cellular hypothyroidism. Regardless of the approach, the extent of hypothyroidism for each experimental condition should be determined via measurement of T3-responsive endpoints (e.g., expression of T3-responsive genes or T3-responsive enzymes) to facilitate interassay comparison.
Cells in culture can be made hypothyroid using a TR antagonist.
Commentary
NH-3 is a TR antagonist that strongly inhibits transcriptional activation by T3 (260 –265). Treatment with this compound has been shown to block thyroid hormone dependent processes such as spontaneous Xenopus laevis tadpole metamorphosis. In theory, this drug could be used to induce hypothyroidism in other vertebrates, but this remains to be established experimentally.
[F] Increasing Thyroid Hormone Signaling
Overview
Classically, thyrotoxicosis is thought of as a pathophysiological state in which thyroid hormone signaling is increased systemically (i.e., throughout all tissues of the organism) as a result of increased T3 binding with its nuclear receptors. Experimentally, systemic thyrotoxicosis can be modeled in vivo via treatment of animals with thyroid hormone. In vitro, cells can be treated with media supplemented with thyroid hormone above the concentrations seen in blood. However, in the latter case, the effects of cross-talk between thyrotoxic tissues (i.e., the indirect, interactive effects mediated via second messengers, are absent); the state of “direct thyrotoxicosis” created is thus distinct from systemic thyrotoxicosis. “Tissue-specific increase in thyroid hormone signaling” is a more recent concept, arising as the result of local deiodinase activity that increase nuclear T3 concentration of certain tissues without necessarily altering plasma thyroid hormone concentration (66).
[F.1] Thyrotoxicosis in animals
Background
Administration of thyroid hormone to an otherwise euthyroid rodent leads to systemic thyrotoxicosis, the intensity of which is directly related to the magnitude of the elevation in serum T3 concentration. A number of approaches have been used to achieve systemic thyrotoxicosis, including intraperitoneal injection of thyroid hormone, addition to chow or drinking water, and subcutaneous pellet or mini-pump insertion.
Acute systemic thyrotoxicosis can be induced by parenteral administration (intraperitoneal or intravenous) of 1.0 μg T3/g BW, a TR-saturating dose of T3. Genomic effects can be seen as early as 60 minutes and physiologic effects starting at about 6 hours.
Long-term systemic thyrotoxicosis can be induced by chronic treatment with T3 or T4 over days, weeks, or months. Routes of administration include parenteral or supplementation of food or water. For chronic studies, TR-saturating doses should be avoided due to cachexia and death. To allow comparisons between studies, T3 doses should be given as multiples of the daily T3 or T4 replacement dose.
Commentary
The half-life of T3 in rodents following injection has been measured to be approximately 4 hours, and for T4 about 11 hours (132). Given these short half-lives, in either acute or chronic experiments, sampling for measurement of T3 or T4 serum levels must take into account the timing of the last injection, in particular for T3. Furthermore multiple injections should be considered if biological effects are to be measured after several half-lives have passed. After multiple injections with classical doses of T3 (100 μg/100 g BW), the intense state of thyrotoxicosis triggers loss of body weight and increases mortality, such that experimental treatment duration should not extend beyond 4–5 days. Typical doses of T4 or T3 well tolerated in long-term experiments (2–3 months) are 10- to 25-fold the daily production rate. While food- and water-based drug delivery methods are subject to feeding variability, this may not be critical for studies of chronic thyrotoxicosis; for example, powdered rodent diet containing 3 mg of T4 and 1 mg of T3 per kilogram has been used successfully to induce chronic thyrotoxicosis (205). Consideration should be given to more consistent methods such as subcutaneous pumps or pellets (243,244).
Depending on the endpoint to be studied, the choice of iodothyronine is important, since T4 is converted to T3 via D1 and D2. Graves' patients can sometimes exhibit a T3-predominant form of thyrotoxicosis, whereas thyroid cancer patients are generally treated with pharmacologic doses of T4 to achieve TSH suppression. That being said, in studies not focusing on the roles of the deiodinases, T3 is preferred because it does not require further activation and thus eliminates the activating deiodinases as a variable.
Classically, large doses of T3 have been used in rodent experiments, designed to saturate the nuclear T3 receptors rapidly and thus maximize the phenotypic events studied as endpoints, while minimizing experimental time and thus cost. For example, a typical dose for rats or mice would be 100 μg/100 g BW, producing measurable genomic and physiologic changes within a few hours (266). It should be noted that the doses of T3 classically used for rodent experiments are clearly in the pharmacologic range and are much higher than the pathophysiologic range seen in nature. Some authors question whether such high doses may produce off-target artifacts or overly enhance nongenomic effects of T3.
In vivo activation of the D2 pathway or inactivation of the D3 pathway can be used to study cell- and tissue-specific increase in thyroid hormone signaling.
Commentary
cAMP-induced D2 activation in BAT leads to rapid saturation of TR with locally generated T3 and induction of T3-responsive genes and the activity of T3-responsive enzymes, without affecting circulating thyroid hormone levels (66,86,233,237,267 –269,271). This is also observed in animal models of transgenic Dio2 expression in the heart (273,274). In contrast, D3 inactivation results in localized increase in thyroid hormone signaling as evidenced in the D3 KO mouse (64,239,275 –279).
[F.2] Thyrotoxicosis in cultured cells
Background
For cell culture–based experiments, tissue-specific or more properly cell type–specific thyrotoxicosis can be modeled via addition of T3 to the medium. Medium thyroid hormone concentrations can be determined directly, but in most cases they are estimated based on published values for the free fractions in a given serum.
Acute thyrotoxicosis can be achieved in cell culture via addition of T3 in the media. The free fraction of T3 multiplied by the total concentration of T3 gives an estimate of the free hormone concentration. If free fractions are not determined directly, estimates of free hormone concentration can be made based on published values of the free fractions.
Commentary
If exact thyroid hormone concentrations within cell culture media must be known, then direct measurements would be required. In most cases, however, rough estimates are thought to suffice (Table 2). Notably, thyroid hormones adhere to plasticware, so it is important to add a suitable carrier protein in order to model the bound and free thyroid hormone fractions in cell culture. Stripped serum or fatty acid–free BSA are typically used, with T3 (and/or T4) replaced; the same caveats about loss of other hormones still apply when this experimental approach is used.
Few studies have reported equilibrium dialysis-based measurement of free fractions in stripped serum, but one study found that for FBS it is similar to the estimated range of unstripped FBS (0.4%–4% for T3) (281). BSA with fatty acids may have T3, thus fatty acid–free BSA should be used (282). It should also be noted that most commercially available forms of T4 have at least trace T3 contamination that must be considered. Importantly, recall that the free fraction of T3 (or T4) increases as the percentage of serum in the media decreases. Thus, the free hormone concentration stays relatively constant as the percentage of serum decreases.
As in the case with rodents, pharmacologic dosing of T3 has been used historically, with high concentrations designed to achieve saturation of nuclear receptors rapidly. For example, 100 nM total T3 in 0.5% BSA would give an estimated free T3 concentration of around 3500 pM; for comparison, the free T3 concentration of euthyroid human serum would be closer to 3–8 pM (about 1000 times lower). Even severely thyrotoxic patients would not be expected to achieve such high free T3 concentrations, only reaching values of about 20 pM (283), or as high as 35 pM in the case of an accidental ingestion of a massive dose of L-T4 (284). Some investigators have suggested that pharmacologic dosing can artificially enhance nongenomic and hypothetical off-target effects of T3; if these are not a concern, the dose can be maximized for effect. Ideally, T3 doses that are within or near the physiological range should be used.
While inducing thyrotoxicosis in cell cultures, the possible presence of deiodinases should be considered for each cell type being studied.
Commentary
Knowing the deiodinase activities of a particular cell line may be important experimentally. Unless the effects of deiodination are of particular interest, thyrotoxicosis should be induced via addition of T3 only, not T4. This is because D1 activates T4 (converting it to T3), such that cells treated with T4 will have variable media T3 concentrations depending on the level of D1 activity and the volume of media and frequency of media changes. This effect is expected to be more intense in D2-expressing cells, given its much higher catalytic efficiency. In contrast, D3 activity would lower the media concentration of T3 (converting it to T2), increasing the dosing requirement to sustain thyrotoxicosis.
[F.3] Use of thyroid hormone analogues
Background
The existence of two TR isoforms (i.e., TRα and TRβ) indicates that different signaling pathways (and perhaps sets of biological effects) are downstream of each one of these molecules. This is further strengthened by the observation that the distribution of TR isoforms is heterogeneous among different tissues/cells (285,286). For example, bone is a predominantly TRα tissue while liver is a predominantly TRβ tissue; thus the rationale for developing molecules that exhibit TR-isoform specificity.
Two caveats should be considered while selecting the concentration and dose of these molecules:
(i) Pharmacokinetic data: TR selectivity depends on ligand concentration and selective tissue uptake. For example, eprotirome appears to have only modest selectivity for TRβ in vitro, yet its profound effects to lower lipids and cholesterol result from selective availability to the liver, possibly due to selective uptake. There is no information on transporter selectivity for different ligands or whether these ligands use the same or different transporters compared to T3 and T4. The use of relatively high doses or high media concentrations minimizes or eliminates TR selectivity. There is currently no or only limited comprehensive pharmacokinetic studies for most analogues, making it difficult to define concentration and doses in comparative experiments with T3 or other analogues.
(ii) Ligand transport into the cell and cell nucleus: the mechanisms leading to cellular uptake and nuclear concentration of the analogues have not been defined. Thus, even when using equimolar media concentrations of two such molecules their concentration in the nucleus, around the TR, could be different. This could enhance or eliminate any biological advantage of TR selectivity exhibited in vitro.
Thyroid hormone signaling can be triggered in vivo and in vitro by thyroid hormone analogues, some of which have tissue selectivity or selectivity for TR isoforms (i.e., TRα1, TRβ1, TRβ2). A number of highly selective TRβ analogues target tissues exhibiting predominance of TRβ (e.g., liver and pituitary gland). The utilization of equimolar doses and concentrations of different analogues and T3 is recommended as a starting point in comparative studies.
Commentary
3,5-Diiodothyropropionic acid (DITPA) is a carboxylic acid thyroid hormone analogue that binds TRα and TRβ with nearly identical affinities (287). Studies in rats and rabbits indicate that DITPA has positive inotropic effects but minimal chronotropic and metabolic effects outside the cardiovascular system (287,288). Its combined use with captopril improved ventricular performance and reduced end-diastolic pressure in the rat postinfarction model of heart failure (289). Additional effects included attenuation of the acute inflammatory response and reduction of myocardial infarct size (290), and improvement of maximal perfusion potential of the hypertrophied myocardium surviving a myocardial infarction (291). However, other studies reported side effects (292,293) or failed to obtain positive results with DITPA in similar settings (294,295).
Tiratricol is an acetic acid thyroid hormone analogue that exhibits about 3.5-fold greater in vitro affinity for TRβ and 1.5-fold greater affinity for TRα compared to T3, with an approximately threefold selectivity for TRβ (296,297). However, there is only moderate TRβ selectivity in cell culture studies (298). In rats, tiratricol has been shown to have antidepressant effects (299), thermogenic effects in the BAT (300,301), and some degree of organ specificity due to its enhanced liver and skeleton effects and reduced cardiac effects (302). The use of tiratricol in a number of settings, including patients with TSH hypersecretion and athyrotic patients, reduced serum TSH (303 –305) and lowered serum cholesterol levels without affecting heart rate but elevated biochemical markers of bone turnover (306,307).
A new generation of highly selective TRβ agonists has much less affinity for TRα while preserving affinity for TRβ (308). The molecules in the GC family (i.e., GC-1 and GC-24) are noniodinated compounds that were designed based on experimental data obtained for the TR structure (309). The use of these molecules has suggested the possible existence of a “therapeutic window” through which predominantly TRβ-mediated biological effects (e.g., lowering serum cholesterol and acceleration of energy expenditure) can be triggered with relatively little activation TRα-dependent pathways (310 –316). However, it is uncertain whether tissue specificity in vivo is due to selectivity for TR binding or tissue concentration of these molecules or both. For example, the TRβ selective agonist GC-1 concentrates preferentially in the liver as opposed to heart, skeletal muscle, or brain (310). The KB family of molecules (i.e., KB-141 and KB-2115) has been used successfully in animals (317 –320) and in hypercholesterolemic patients kept on statins to lower serum cholesterol even further while sparing the heart and bone (321,322). In these patients there were only minimal alterations in thyroid function tests. However, clinical studies with these molecules were suspended due to undesirable cartilage side effects observed in dogs (323).
The KB general structure was subsequently used as a scaffold to design a family of indane (hydrocarbon compounds) derivatives that exhibit potent and selective thyromimetic activity (324). KTA-439, a representative indane derivative, displays the same high human TRβ selectivity in a binding assay as KB2115 and higher liver selectivity in a cholesterol-fed rat model (324).
An alternative strategy to obtain tissue selectivity is to use molecules that concentrate in specific tissues by virtue of undergoing local activation such as the cytochrome P450 activation of a prodrug that is a phosphonate-containing TR agonist. This molecule exhibits increased TR activation in the liver relative to extrahepatic tissues and an improved therapeutic index (319). MB07811 undergoes first-pass hepatic extraction and cleavage, generating the TR agonist MB07344 that distributes poorly into most tissues and is rapidly eliminated in the bile (319). MB07811 lowers serum cholesterol in hypercholesterolemic rats, rabbits, monkeys, and humans beyond what was achieved with statins alone (325), is superior to a TRβ-selective agonist in the diet-induced obese mouse model (319), and reduces hepatic steatosis in rats and mice models (326).
Selective analogues for TRα have also been developed (327) and shown to be effective in promoting TRα-dependent neurogenesis in X. laevis (328). However, TRα selectivity was lost when the same compound was tested in rats, with CO23 activating thyroid hormone–responsive genes in liver and heart (329).
[G] Iodine Deficiency and Maternal–Fetal Transfer of Thyroid Hormone
Overview
Iodine is the major constituent of thyroid hormone. Simply put, the most active form of thyroid hormone, T3, can be viewed as three atoms of iodine attached to a phenoxyphenyl scaffold. The unique spatial positioning of the iodine atoms confers high affinity for the TR, a ligand-dependent transcriptional regulator. It is remarkable that vertebrates evolved to have a scarce environmental element, iodine, play such an important role in embryogenesis, growth, metabolism, cognition, and adaptation to disease states. The sea is the main source of iodine and perhaps the major biological role played by iodine reflects the idea that life began to exist and evolved in the ocean. Iodine-containing clouds are formed over the oceans and blown inland, with rain depositing iodine over the land. Depending on the type of soil, iodine is retained for some time or quickly washed to the rivers and back to the oceans. Consequently, the iodine content of plants, crops, and animals in any specific geographical region depends on the iodine content of the soil. About 1.5 billion people live in geographic areas of iodine insufficiency, requiring some form of iodine supplementation to prevent the consequences of perinatal hypothyroidism.
Iodide is absorbed in the small intestine and avidly taken up by the thyroid via NIS located in the basal-lateral membrane of all thyrocytes. Once inside the cells, iodide diffuses towards the relatively positively charged lumen of the thyroid follicle, exiting the thyrocyte via pendrin channels located in the apical membrane. Adjacent to microvilli of the apical membrane, iodide is oxidized and conjugated to specific tyrosine residues in the thyroglobulin molecule, a process catalyzed by thyroid peroxidase. Subsequently, iodinated thyroglobulin molecules are reabsorbed via pinocytosis and digested in lysosomes, releasing T4, T3, and small amounts of thyroglobulin as well as other iodinated molecules into the circulation.
Iodine deficiency can pose a serious threat to the thyroidal capacity to synthesize thyroid hormones. It is generally accepted that limited iodine availability acts as an evolutionary pressure that favors the development of compensatory mechanisms, which minimize the impact of iodine deficiency on thyroid economy. Deciphering these mechanisms is critical not only for our understanding of thyroid gland function and thyroid hormone economy but also to formulate strategies that can be used to treat and prevent the irreversible consequences of fetal and neonatal hypothyroidism resulting from iodine deficiency. The most severe condition is neurological cretinism due to severe iodine deficiency and hypothyroxinemia during the first half of pregnancy resulting in irreversible brain damage (330). Thus, experimental models of iodine deficiency have been widely used to analyze the adaptive mechanisms developed in animal models and the impact of different degrees of iodine deficiency on thyroid economy.
[G.1] Iodine deficiency in rodents
Background
The main consequences of iodine deficiency are goiter, hypothyroxinemia (242), increased NIS expression (331), increased monoiodotyrosine (MIT)/diiodotyrosine (DIT) and T3/T4 ratios within the thyroglobulin (332,333), preferential T3 synthesis and secretion by the thyroid (242,332), increased D1 and D2 activities in the thyroid and D2 activity in BAT (334,335), low T4 in plasma and tissues (71,336,337), and a TSH concentration that is slightly elevated, together with a normal or slightly decreased T3 level in serum and several tissues (71). Tissue uptake of T4 and T3 increases. Only some of the endpoints of thyroid hormone action are affected but to a lesser degree than in overt hypothyroidism (71,338). The chow diet fed to rodents in accredited animal facilities contains enough iodine (0.4–1 μg/g) to allow for a normal daily iodine intake (∼5–10 μg/d) and thyroid function. Two strategies can be used, independently or in combination, to promote iodine deficiency: (i) feeding with a low iodine diet (<0.02 μg/g) that reduces iodine intake (to 0.2–0.4 μg/d) or (ii) treatment with drugs that inhibit NIS and thus thyroidal iodine uptake.
A state of iodine deficiency can be achieved by feeding rodents with an LID (containing <0.02 μg iodine/g). Milder degrees of iodine deficiency can be achieved with less stringent diets. Effects on thyroid economy can be seen as early as 10 days, but for most parameters clear effects require at least 1 month of LID.
Iodine deficiency in animals can be documented by monitoring urinary iodine excretion, which should be about 5- to 10-fold lower in the LID animals.
Intrathyroidal iodine deficiency can be achieved via inhibition of NIS following administration of 1% KClO4 in the drinking water. Thyroidal iodine stores can be depleted in 1 week using this approach. Longer treatments will lead to systemic hypothyroidism, which must be taken into account. Because KClO4 is bitter, caveats apply for this strategy as discussed previously (see
The impact of iodine-deficiency on the thyroid gland itself can be assessed by measuring gland size (at least a twofold increase should be seen) and histologically, with LID leading to varying degrees of hyperplasia and hypertrophy. The amount of colloid in the follicles is reduced, and the epithelial cells lining the narrowed follicular spaces consist of columnar cells instead of normal cuboidal cells.
The impact of iodine deficiency on thyroid economy can be monitored by measuring serum T4, and the T3/T4 ratio in thyroglobulin. TSH elevation is not an early finding. Similarly, serum T3 is preserved until iodine deficiency is severe.
Commentary
LID is commercially available from different vendors, but checking the iodine content of the diet is strongly recommended given that it is not unusual to find higher than reported iodine content. Remington-type diet has been used successfully; synthetic diets containing casein or other proteins that are a source of iodine should be avoided. In accredited animal facilities, rodents drink deionized distilled water, which does not containing significant amounts of iodine.
In all settings, control animals should also be fed LID but drink water containing KI ad libitum to provide about 5–10 μg iodine/day. The combination of LID and KClO4 results in severe iodine deficiency, a reduction in serum T3, and overt hypothyroidism. When KClO4 is employed it should be used in low percentages (≤0.005%) to avoid undesirable environmental pollution (71,339).
Gestational or neonatal iodine deficiency can be achieved by feeding dams with the LID. Given the short duration of gestation in rodents, dams should be pretreated with LID so that hypothyroxinemia is achieved before the onset of pregnancy.
Commentary
This strategy leads to profound fetal hypothyroidism because maternal transfer of T4 is markedly diminished, and T4 is the only source of T3 for the fetal brain (340,341). After birth, maternal T4 is concentrated in the milk and given to the pups prior to weaning, thus resulting in amelioration of their hypothyroidism (341).
Severe iodine deficiency before and throughout gestation results in a rat model of neurological cretinism (330) with brain alterations similar to those described in human affected populations (342 –344). Given that feeding on LID can potentially decrease fertility, particularly if the state of iodine deficiency is severe enough to reduce serum T3, LID alone might not act quickly enough to create a state of iodine deficiency in the fetus. In this case, KClO4 or its combination with LID can be used successfully to promote fetal iodine deficiency.
[G.2] Placental transfer of thyroid hormone
Background
The placenta functions as an interface between the maternal and fetal circulations, allowing for the exchange of nutrients, gases, and many other types of molecules. Thyroid hormones are not only metabolized by placental cells via D2 and D3, but there is also a net flux of thyroid hormones transport to the fetus, which ensures the presence of T4 and T3 in the fetal circulation before the fetal thyroid is fully developed. Thyroid hormones transport can be studied in the rat by inhibiting the fetal thyroid with MMI given to the mother. In this setting, different levels of both T4 and T3 are found in fetal tissues.
Placental transfer of thyroid hormones from mother to fetus can be studied in MMI-treated and thyroid hormone–replaced pregnant dams by measuring T4 and T3 content in fetal tissues.
Commentary
Pregnant dams are given 0.02% MMI in the drinking water, starting on the 14th day of gestation. MMI crosses the placenta and has been shown to inhibit fetal thyroidal function and promote severe fetal hypothyroidism with elevated serum TSH and low thyroid hormone levels in blood and tissues. Mothers are treated with thyroid hormone (T4, T3, or both) and, at any time during pregnancy or immediately after delivery, fetuses are dissected and blood/tissues obtained for extraction and determination of T4 and T3 contents (345,346). Administration of tracer [125I]T4 to pregnant dams and its detection in fetal tissues has also been used to study placental transfer of thyroid hormone (347).
[H] Models of Nonthyroidal Illness
Overview
Thyroid economy is markedly affected by illness, fasting, or other major life-threatening conditions. This is known as NTI syndrome, euthyroid sick syndrome, or low T3 syndrome (348). NTI may be viewed as part of the acute phase response to illness or injury, a defense mechanism predominantly mediated by cytokines (349). A number of animal and cell models have been developed to study the pathogenesis and pathophysiologic consequences of NTI, including fasting, injury or illness, and lipopolysaccharide (LPS) administration.
In general, during NTI there is a multilevel suppression of the HPT axis and decreased thyroidal secretion (350). A drop in serum leptin levels plays a central role in the fasting-induced changes in thyroid economy via neuropeptide Y-mediated TRH suppression (351), with leptin administration restoring the fasting induced state of central hypothyroidism (352). There are also major modifications in the metabolic pathways of thyroid hormone, such as accelerated extrathyroidal inactivation of thyroid hormone via deiodination (353), glucuronidation, and sulfation (351); it is not yet clear whether extrathyroidal T3 production is decreased (354). However, it is well accepted that central hypothyroidism is the main driving force behind the changes in circulating thyroid hormone levels and thyroid economy associated with fasting or starvation. Also important is understanding that changes in thyroid economy during NTI may be very different in the acute versus a more chronic phase (355). Defining these mechanisms and the pathophysiological implications of these changes is central to our understanding of NTI, which affects the majority of patients admitted to any general hospital.
Fasting is widely used as a model of NTI to study its impact on thyroid hormone production, metabolism, and action.
Commentary
Fasting promotes central hypothyroidism, reducing serum levels of thyroid hormone without a corresponding elevation in serum TSH. Mice and rats can be fasted for periods of hours or days depending on standards and protocols set by the local institutional animal committee. Usually adult rats are fasted no longer than 2–3 days and adult mice 1 day. In rats, fasting is associated with an approximately 50%–75% drop in serum T4 and T3 that takes place in the first 48 hours (356). In mice, the drop in serum T3 is about 50% and takes place by 36 hours of fasting (357). Fasting also leads to a reduction in liver D1 and increase in D3 activities (358,359). However, the reduction in serum T3 observed in the fasted rat is mostly secondary to a reduction in thyroidal secretion (360).
Major bodily insults or severe illness in rodents such as extensive surgery, burns, inflammatory pain, bacterial infection, or prolonged immobilization can be used as animal models of NTI.
Commentary
A large number of animal models have been developed to study NTI (361 –370). Essentially, the type and extent of the bodily insult that triggers NTI in rats, mice, and rabbits determines the magnitude of the alterations in thyroid economy. These different animal models display unique characteristics as to the timeline of the fall in serum T4 and/or T3 concentrations.
Different cell models have been developed to study the modifications in deiodinase expression and thyroid hormone action during NTI. Basically, different deiodinase-expressing cell types are exposed to pro-inflammatory cytokines (e.g., interleukin-1β) and then evaluated for the expression of different components of thyroid hormone signaling such as TRβ, TRα, and deiodinase activity (361).
The administration of bacterial LPS can be used to promote central hypothyroidism, similar to that observed during NTI, with reduction in hypothalamic TRH and a fall in serum thyroid hormone levels.
Commentary
Intraperitoneal administration of LPS to rats (371 –373) or mice (173) has been used extensively to promote central hypothyroidism and NTI (374). Despite the drop in serum thyroid hormone levels, both TRH expression in the paraventricular nucleus and serum TSH are decreased in LPS-treated rats, resembling the euthyroid sick syndrome (371,373). These LPS-induced changes are associated with an elevation in tanycytes that may be key for the reduction in TRH expression through feedback inhibition (373,374); this effect is lost in the D2 KO mice (173). LPS batches vary in efficiency; it is recommended to use a strain previously shown to be effective; for example, O127:B8 Escherichia coli strain in vivo in rats and mice (372 –374). In vitro, treatment with LPS increases D2 activity in human mesothelioma (MSTO-211H) cells (375) and in cultured rat astrocytes (376).
[I] Assessing Thyroid Hormone Signaling at Tissue and Cellular Levels
Overview
TRs mediate biological responses to thyroid hormone by control of gene expression (377,378). TRs are nuclear receptors and bind specific DNA response elements in genomic regulatory regions (enhancer elements) of target genes (379 –381). The DNA-bound TR can modify the activity of chromatin remodeling complexes, RNA polymerase II, and the basal transcriptional machinery to activate or suppress expression of a target gene. The transcriptional response is sensitive to the concentration of ligand (T3) and to the duration of exposure to T3. This can be studied in animals or in cell models usually by contrasting expression of a T3-responsive gene between hypothyroid and thyrotoxic conditions (see Sections E and F).
The three canonical TR isoforms TRα1, TRβ1, and TRβ2 in mammals possess broadly similar transactivation properties on many but not all response elements in vitro. These isoforms mediate both overlapping and distinct biological functions in mice in vivo (286,382,383); reflecting cell-specific expression patterns, differences in isoform expression levels, and possible isoform-specific structural constraints in target gene recognition or cofactor interaction (Table 3) (385 –389).
The analysis of T3 response genes is useful to address different types of research questions. T3 response genes are useful markers, or transcriptional endpoints, of the thyroid hormone status of a tissue in animal models or in cell culture lines in vitro. Analyses may be relatively simple, with a focus on a few known target genes that reliably represent the tissue status in response to T3. Exploratory large-scale (“genome-wide”) screens of mRNA populations may be used to search for new T3-response genes. At the molecular level, a specific target gene can be investigated in depth to elucidate the transcriptional mechanisms underlying T3 action, entailing the analysis of the DNA element that binds the TR and functional analysis of these elements using transcriptional assays, usually in heterologous cell culture systems. Ultimately, the physiological relevance of such an element would require in vivo evidence based, for example, on analysis of transgenic reporter genes carrying the promoter and/or enhancer elements of the target gene.
[I.1] Gene expression as a marker of thyroid hormone status
Background
T3 target genes can be either positively or negatively regulated. Exploratory screens of cell lines or tissues indicate that on average, approximately 50% of the T3-responsive genes display increased mRNA levels and 50% display decreased levels in response to T3 (127,390 –394). For the majority of these genes, it remains unknown which respond directly and which indirectly to T3, since in many tissues relatively few genes have been defined as direct targets by rigorous criteria that include the identification of the functional TR binding sites in the gene. The mRNA levels measured also represent the net outcome of other variables such as the developmental stage of the tissue and the mixture of cell types in the sample (395 –397). Nonetheless, even when these limitations are taken into account, the mRNA level of selected genes provides a useful indicator of the response status of the tissue. Independent methods such as Western blot analysis are used to corroborate the data at the protein level, and in situ hybridization analysis can define more precisely the cell types in which gene expression changes occur. Any method used to confirm gene expression data requires appropriately controlled analyses. For example, in Western blot analysis, evidence for the specificity and sensitivity of the antibody used is essential. Also, as a qualitative control for the amount and integrity of protein sample loaded, the specific protein band detected may be compared to an internal control (reference) protein such as actin or RNA polymerase II, if these proteins themselves do not vary substantially in response to altered T3 or TR status in the tissue being studied (82,398). If necessary, the specific protein band detected may also be quantified relative to the internal control protein band.
For general assessment of the tissue status in response to T3, the analysis of representative known response genes provides informative data.
Commentary
The following genes are examples of T3 response genes and serve as useful markers of tissue T3 status: (i) liver: Me1, Thrsp, Dio1, Gpd2, Cyp27a, and Fasn (390); (ii) brain: Nrgn, Mbp, Hr, and Trh (paraventricular nucleus only) (400,401); (iii) heart: Myh6, Myh7, and Atp2α2 (402); and (iv) BAT: UCP1 (403). Determination of mRNA levels of selected genes is accomplished by direct methods such as Northern blot analysis (Fig. 12) or by indirect analyses based on amplification of cDNA using RT-qPCR if precautions are taken to ascertain the specificity and quantitative validity of the PCR assay (404). However, it should be noted that although these genes can be useful, representative indicators of T3 status of a tissue, different genes in the same tissue may reflect a range of direct or indirect mechanisms of response. Other factors influence the response of a given mRNA to T3 in a specific tissue. For example, Me1 is responsive to thyroidal status in liver, but not the brain. Additionally, Me1 in liver is only regulated by thyroid hormone after postnatal day 15 (405). Such temporal and tissue specific considerations should be taken in to account when designing experiments that quantify mRNA.
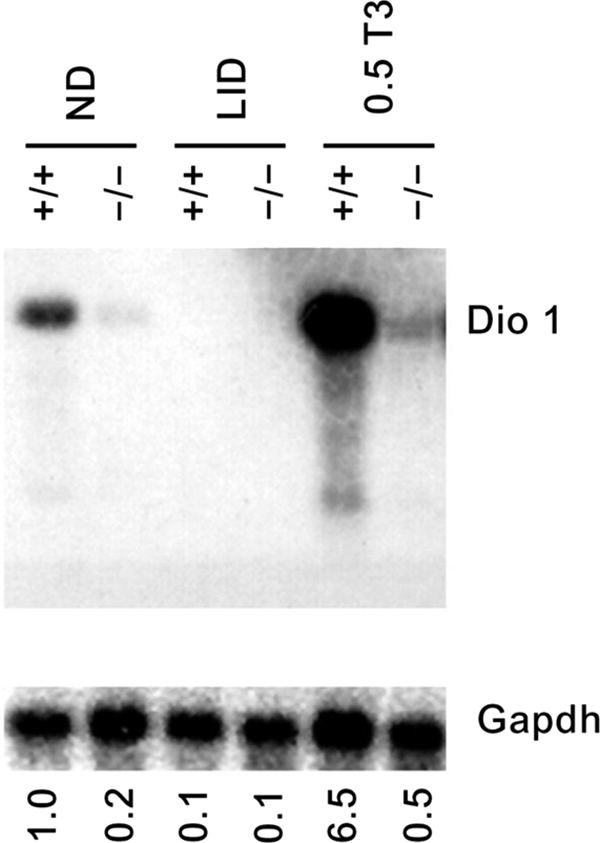
Dio1 (type 1 deiodinase) is a representative T3-responsive gene in the liver. Northern blot analysis showing Dio1 mRNA levels in response to normal diet (ND), hypothyroid (LID, low-iodine diet and antithyroid agents), and hyperthyroid (0.5 T3) conditions. Dio1, upper panel, and control glyceraldehyde-3-phosphate dehyrogenase (G3pdh), lower panel. In WT mice (+/+), Dio1 mRNA is suppressed by hypothyroid conditions and induced by hyperthyroid conditions. Induction is defective in Thrb-deleted mice (−/−). Treatments: ND, normal diet; LID, hypothyroid groups (0.05% methimazole [MMI] and 1% potassium perchlorate in drinking water and low iodine chow, for 4 weeks); 0.5 T3, hyperthyroid groups (same as LID but with T3 added to drinking water at concentration of 0.5 mg/mL for an additional 8 days or more). Quantitation: Dio1 mRNA level in each condition is noted numerically below each lane relative to the level in +/+ mice on normal diet (assigned a value=1.0). Dio1 value is normalized to control G3pdh signal; UD, undetectable Dio1. Signals were quantified by phophorimager analysis of major bands.
[I.2] PCR analysis of mRNA expression levels
Background
PCR analysis of mRNA levels for T3-responsive genes follows standard methods. PCR is extremely sensitive and has the potential to generate ostensibly positive signals from very few molecules of mRNA. Thus, it is important to perform negative control reactions lacking cDNA templates. For the valid detection of mRNA transcribed from intron-less genes, reverse transcription should be also performed in the absence of the reverse transcriptase enzyme (minus RT control) to exclude false-positive amplicons generated from a contaminating genomic DNA template. Given these limitations, results should be supported independently with more direct assays such as Northern blot, Western blot, or in situ hybridization analyses.
A current method of choice to study the expression of T3-responsive genes is RT-qPCR, which provides precise quantification of mRNA levels, if appropriately validated. Care should be taken to ensure that internal control genes (i.e., reference genes) are not themselves T3 responsive in the system being studied.
Commentary
Care should be taken to ascertain that the quality of the input RNA is adequate. Poor quality RNA can limit reverse transcriptase efficiency and cDNA yields (406).
In general, standard primer design rules apply to RT-qPCR except that amplicon size should be restricted to 50–200 bp with a preferred amplicon size around 100 bp to maximize efficiency (407). When possible, primer pairs should span exon–exon junctions in cDNA to avoid amplification of potentially contaminating genomic DNA. Primer design websites (e.g., Primer3,
Two common detection methods in RT-qPCR use the SYBR Green DNA binding dye or 5′-nuclease (i.e., TaqMan probe) assays (Fig. 13). In the unbound state, SYBR fluorescence is negligible, but upon binding to double-stranded DNA its fluorescence increases. The 5′-nuclease assay takes advantage of the intrinsic 5′-exonuclease activity of many Taq polymerases to degrade a fluorescence resonance energy transfer–linked oligonucleotide probe designed to anneal within the amplicon. Probe cleavage separates the 3′-quencher fluorophore from the 5′-reporter fluorophore. A real-time PCR machine measures the accumulation of released fluorescent reporter product. The 5′-nuclease assay offers possibly increased specificity over SYBR Green detection as it avoids potential complications with primer dimer formation (408). To validate the assay it is also necessary to confirm the size of PCR band and/or the presence of a single peak in the dissociation curve (Fig. 13C).
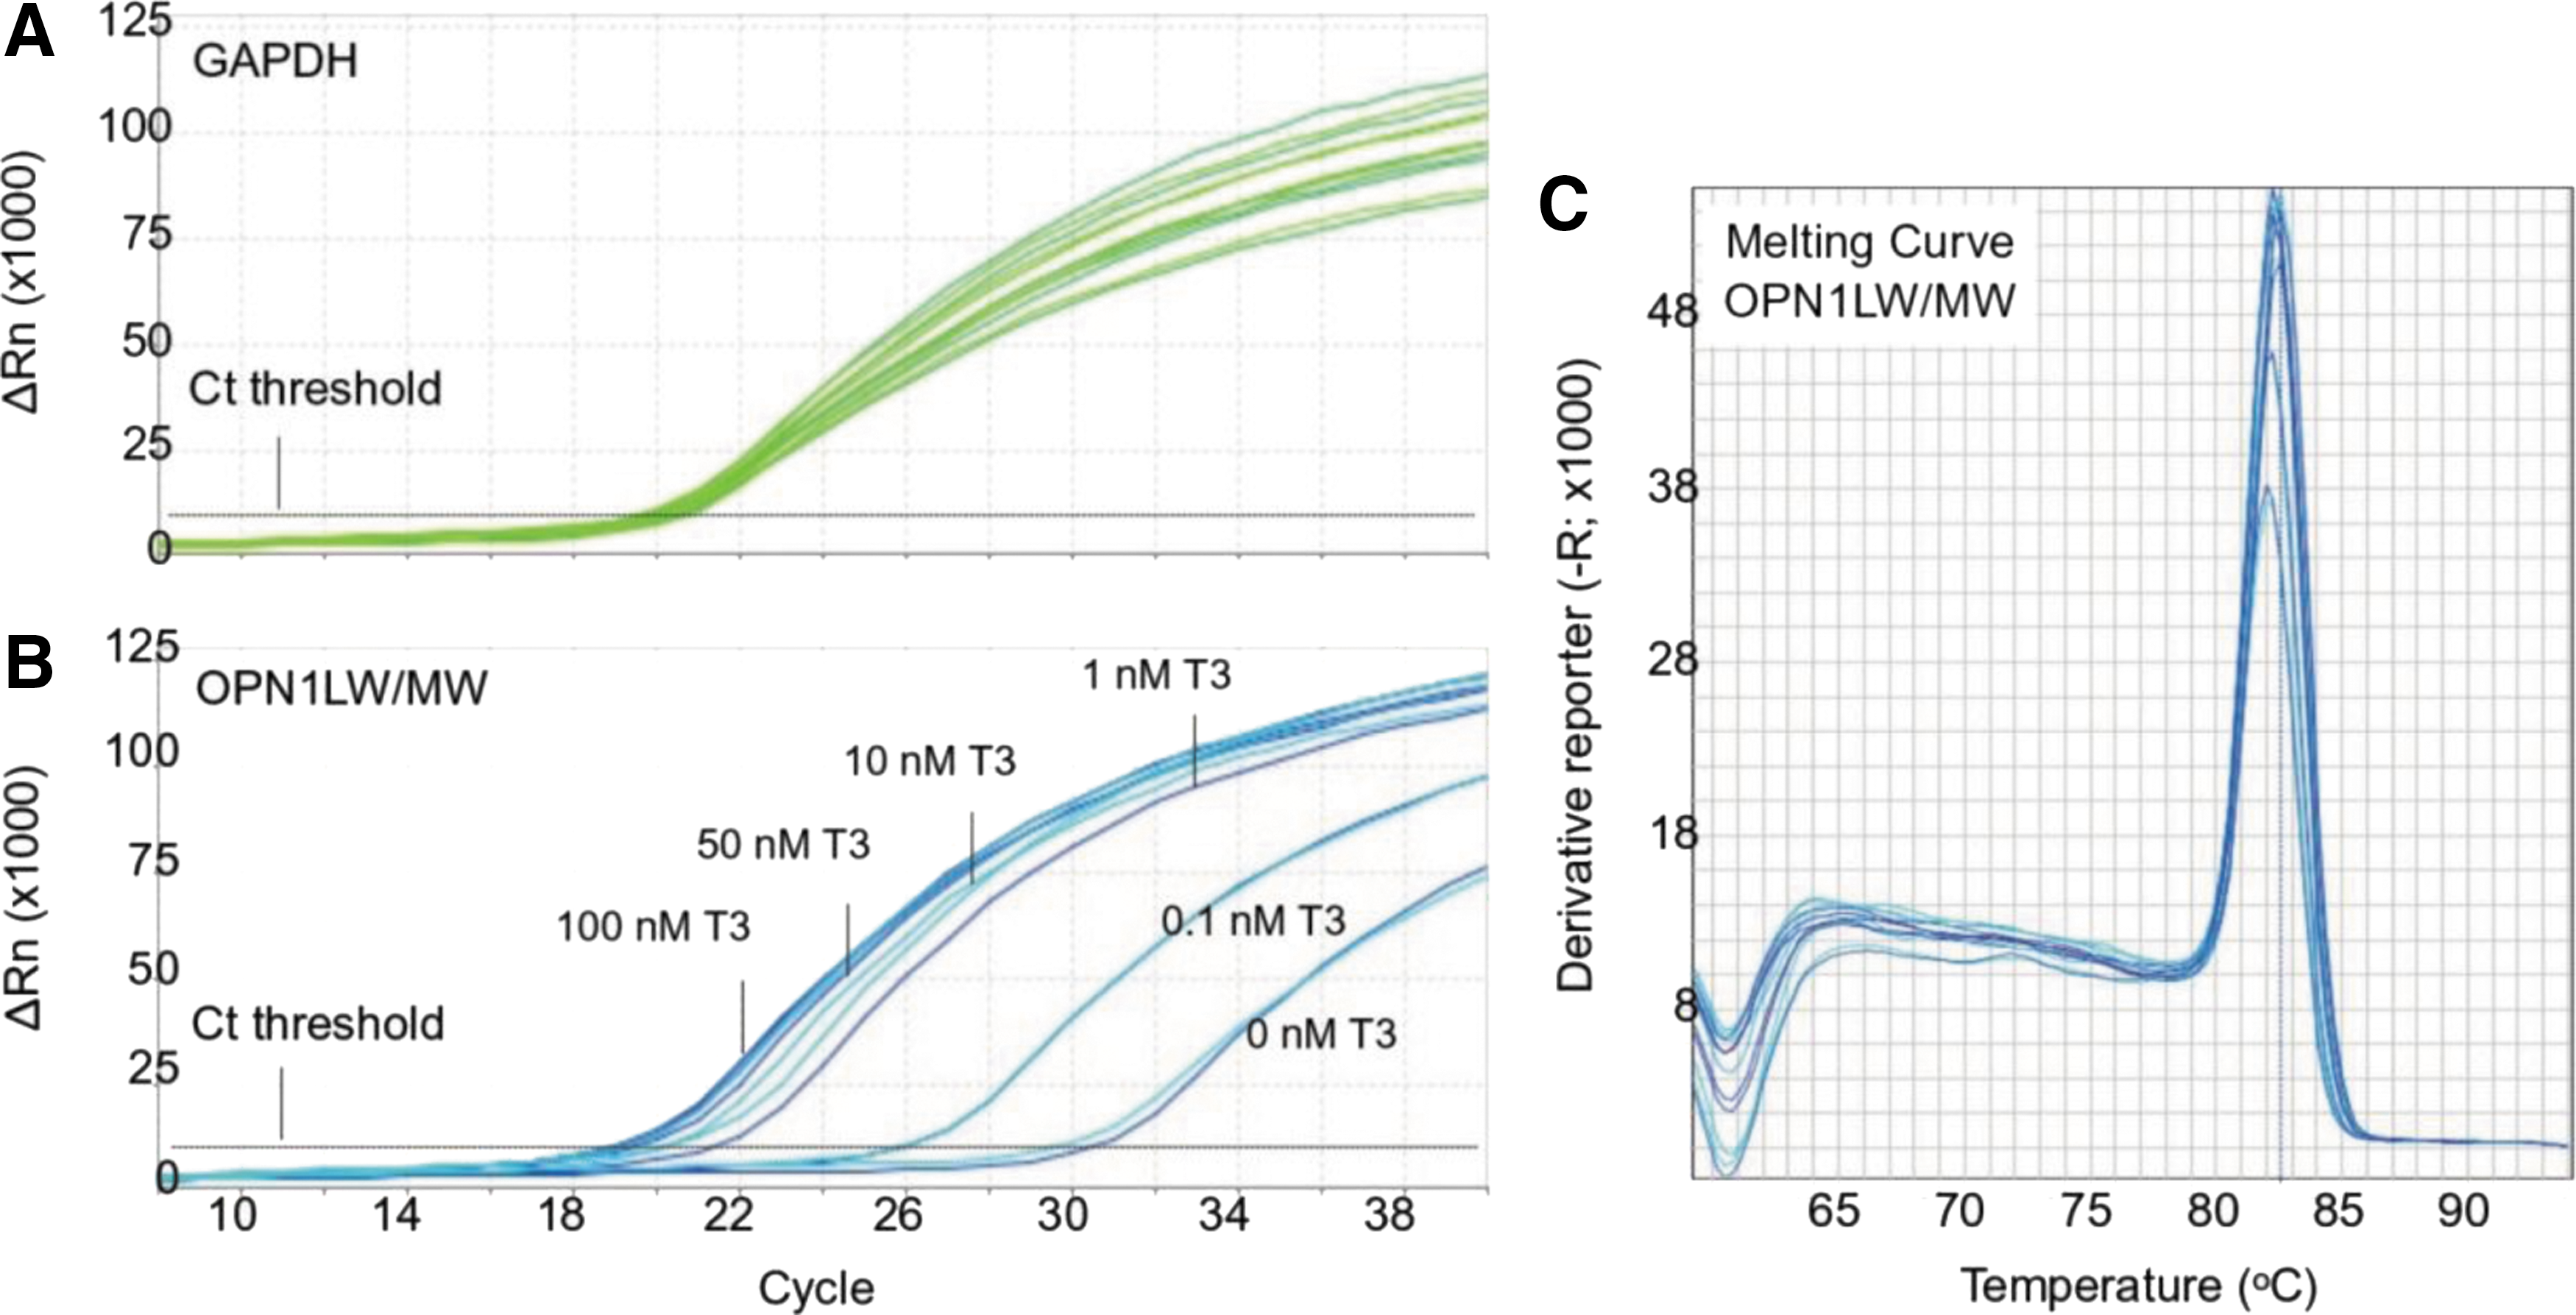
An example of using RT-qPCR to analyze a T3-responsive gene. The qPCR amplification plots indicate change in the mRNA level for the T3-responsive gene OPN1LW/MW (red/green opsin) in the human retinoblastoma cell line WERI following treatment with increasing T3 concentrations spanning the physiological range. The increased SYBER Green detection (ΔRn; SYBER Green fluorescence [reporter] normalized to background) following each PCR cycle demonstrates the accumulation of a PCR amplicon.
Quantification of mRNA by RT-qPCR usually requires normalization to an internal control reference gene. Care should be taken in selecting reference genes for thyroid research because several reports have indicated that commonly utilized reference genes (e.g., Actb, Gapdh) are somewhat responsive to thyroid hormone in some specific tissues (409 –412). The genes Rn18S and Ppia (cyclophillin A) appear suitable for several tissues including brain, pituitary, and liver (351,413).
The abundance of a target mRNA is calculated by either relative or absolute quantification (406,414). In relative quantification, the PCR critical threshold (Ct) of a test RNA sample (e.g., treated with T3) is compared to a reference sample (i.e., vehicle control). Two methods of relative quantification are widely used: ΔΔCt-method and the relative standard curve method.
The ΔΔCt-method of normalization makes use of a reference gene, such as a house keeping (Actb, Gapdh) or other suitable forms of reference gene, that is expressed similarly across all samples with minimal variation. The ΔΔCt is calculated as follows:
where Ct is the PCR cycle number at which the reporter fluorescence is greater than the background signal (414).
In the relative standard curve method, cDNA from an independent sample is used to create a relative standard curve utilizing the known mass of input RNA against which unknown samples, such as reference and test samples, can be quantified. To control for potential variation in RT input RNA, calculated masses can be normalized by the calculated mass of an endogenous control (408).
In absolute quantification, the Ct for the mRNA of a given gene is fitted to the Ct from a standard curve generated using serial dilutions of samples that contain known quantities of the target gene (i.e., plasmid DNA or in vitro transcribed RNA) (406).
The abundance of an mRNA may also be determined by the so-called semiquantitative, or end-point RT-PCR, in which amplicons are visualized by agarose gel electrophoresis after a predefined, arbitrary number of PCR cycles (404). Although arbitrary end-point RT-PCR can detect obvious changes in gene expression, it suffers from low precision, and often involves visualization of PCR products at the plateau phase of the reaction, when the data do not accurately reflect the quantity of initial starting mRNA material (407).
[I.3] Genome-wide analysis of thyroid hormone–responsive mRNA
Background
Microarrays or genome-wide analyses by other methods, such as next-generation sequencing of expressed RNA populations (i.e., RNA sequences [RNAseq]), generate large datasets that demand major computational investigation to extract meaningful data for relevant genes. Typically, thousands of mRNA sequences display some degree of change in levels. Follow-up analysis by other methods is required to determine if candidate genes are direct targets of T3 action.
Microarray or other methods of genome-wide screening for mRNA expression patterns can be used for large-scale analysis of gene expression changes in response to manipulations of thyroid hormone signaling pathways. Candidate transcripts of interest must be corroborated by independent methods, such as RT-qPCR, Western blot, or in situ hybridization analysis.
Commentary
Many studies have been published featuring microarray analysis of a given tissue or cell line following T3 treatment of an intact organism or cultured cells. Specific techniques for genome-wide expression analysis are evolving rapidly, and multiple microarray systems and data mining software packages exist and can be used as desired. Most post-array analytical software platforms allow for manipulation of the stringency parameters that set a threshold for significantly changed genes, such as fold-change, false discovery rate (to correct for multiple comparisons), and p-value. In general, at least three biological replicates per treatment group (e.g., T3 exposure) and control group (e.g., vehicle) are required for “statistically significant” differences to be detected if statistical significance is taken to mean a p value of <0.05, false discovery rate of <0.05, and fold-change >2 (417). Given the high likelihood of false-positive differences, results of microarray studies should best be viewed as “hypothesis-generating data” in nature, and changes in key transcripts must be confirmed via PCR and other methods.
RNAseq uses deep-sequencing technology and can provide a more precise measurement of mRNA and variant mRNA isoform levels compared to microarrays as data derived from RNAseq is not biased by analysis using predetermined genes and probes.
Commentary
RNAseq requires major bioinformatics analysis of sequence reads (418). The inclusion of extraneous cell types in a tissue sample should be minimized, as qualitative variations between samples will increase experimental “noise” and reduce the resolution of analysis. Tissue sampling may be refined using laser microdissection to isolate defined pieces of tissue from histological sections or fluorescence-activated cell sorting to isolate enriched cell populations based on specific cell markers (419,420). Observed changes in mRNA expression patterns might represent indirect alteration in mixed cell populations in tissues (421,422). A cell line in culture, although not a physiological sample, may provide a more homogeneous cell population for certain analyses.
[I.4] Mechanisms of gene regulation by thyroid hormone
Background
The TR binds to DNA elements known as T3 responsive elements (T3REs) (423). In general, TR binds the T3RE as a homodimer or heterodimer with retinoid X receptors (RXRs). These receptor complexes attract co-repressors or co-activators depending on whether the TR is in a T3-bound or unbound state (424 –426). Analyses of TR–DNA interactions often use two broad approaches: (i) transcription response (“transactivation”) assays, typically in transfected cells in culture, and (ii) assays to investigate TR binding to DNA on isolated DNA response elements (electrophoretic mobility shift assay [EMSA]) or on genomic DNA in a chromatin state (chromatin immunoprecipitation [ChIP]).
The regulation of a target gene by TR can be investigated in tissue culture cells co-transfected with a reporter gene plasmid plus a TR-expressing plasmid. Transactivation of the reporter is assessed in response to added T3 at varying doses over a physiological range and can be tested in different cell lines since responses may be influenced by host cell-specific factors.
Commentary
The candidate T3RE or enhancer region of the target gene with its natural promoter or an artificial promoter is ligated to a readily detectable reporter gene, usually firefly luciferase. Luciferase activity generates light, which is detected using a luminometer (427). Promoter-less and enhancer-less luciferase reporters are used as controls to exclude the possibility of spurious responses originating from “stealth sequences” fortuitously present in the luciferase gene or vector backbone (428).
Transfection efficiency is assessed by co-transfection of an internal control reporter plasmid usually with Renilla luciferase driven by a constitutively active promoter. The specific readout of a reporter assay is normalized as firefly luciferase activity (test gene) over Renilla luciferase activity (internal control gene). It is imperative to establish that internal control reporters do not respond to the experimental conditions because this can inappropriately distort the readout ratio (429).
Consideration should be given to whether the reporter vector is chromatin-forming or non–chromatin-forming. Standard or “naked DNA” reporter plasmids such as pGL4 often yield useful data in transiently transfected cells. Alternatively, vectors that carry an episomal replication origin, such as pREP4, can form chromatin in transiently transfected cells. Some DNA response elements require a chromatin-forming vector to display activity (430).
The location of the promoter for a given target gene of interest should be verified. Not all genes represented in the genome databases depict an accurate 5′ gene structure, which requires experimental mapping of 5′ ends of mRNAs from different tissues. The most upstream exons of a gene (translated or untranslated) can be identified by RNAse protection assays or 5′-rapid amplification of cDNA ends analysis (431,432). The function of a presumptive promoter should be demonstrated using luciferase assays in transfected cells or reporter transgenes in an animal model. The preconception should be avoided that relevant enhancers reside only upstream of the promoter of a target gene. Many enhancers reside within introns or downstream of the gene (433).
EMSA can demonstrate direct binding of the TR to a DNA element thereby providing evidence that a gene is a direct target of TR. EMSA is based on the observation that protein-bound DNA migrates at a slower rate than unbound DNA when subjected to electrophoresis. The DNA element (the probe) is usually radiolabeled to allow sensitive detection of protein:DNA probe complexes.
Commentary
TR binding sites are typically related to the consensus motif for a nuclear receptor binding site, 5′-AGGTCA-3′ and often occur in dimeric repeat configurations (423,434). Optimal EMSA probes are short double-stranded oligonucleotides (∼20–30 bp). Longer probes (or degraded probes) may increase nonspecific binding, which appears as indistinct, smeared signals after EMSA. Radioactively end-labeled probes offer great sensitivity and allow detection of protein–DNA complexes using x-ray film or phosphorimaging. Alternatively, probes can be labeled nonradioactively (e.g., with biotin), followed by secondary detection with streptavidin and enzymatic substrates similar to those used for Western blotting (435).
Nuclear or whole cell extracts from the tissue or cell line of interest provide a source of TR protein. Lysates of cultured cells transfected with a TR-expressing plasmid are another common source of TR protein (381). Alternatively, TR protein can be generated using a cell-free in vitro translation system (436,437).
The specificity of the TR–DNA probe interaction is confirmed by two standard control tests: (i) the use of an anti-TR antibody that supershifts or disrupts the retarded band (a parallel negative control using a nonspecific antibody should not disrupt the specific TR–DNA probe complex), and (ii) the specificity of the TR binding to the labeled DNA probe should be confirmed by competition in the presence of an excess of unlabeled “cold” oligonucleotide probe. Two types of competitor oligonucleotide probe are used in parallel samples: wild-type probe and probe containing point mutations within the proposed TR binding site. A dose-dependent reduction in the intensity of the shifted band signal is expected when using cold wild-type probe but not mutant probe (436). Typically, each cold competitor is added in two or three doses, representing a range of approximately 2- to 100-fold excess over the labeled probe.
ChIP can be used to indicate that the TR associates with a target gene in its natural context in the genome in a tissue or cell line. The most critical requirement for ChIP is a high-quality specific antibody for immunoprecipitation, with the specificity being established by control experiments.
Commentary
ChIP is used for testing binding of transcription factors to known target genes or for exploration of previously undefined binding sites. A positive ChIP result indicates an association with a region of chromatin DNA but does not differentiate between direct binding to DNA and indirect binding to a complex of other factors that bind DNA.
Currently, there is little evidence that available antibodies against TR generate consistently reproducible ChIP results for mammalian tissues, although some ChIP data have been reported for cell lines and amphibian tissues (438 –442). The difficulties in generating ChIP data on natural tissues may be a consequence of relatively low concentration of TR in mammalian tissues compared to other types of more abundantly expressed transcription factors.
Optimal conditions for cross-linking and sonicating chromatin should be established empirically for any tissue or cell line (443). A negative control for ChIP utilizes purified nonspecific IgG, pre-immune serum, or antibodies against foreign proteins not present in the tissue. Genomic DNA fragments isolated by ChIP are identified by PCR using a series of primer sets that span the genomic region of interest as well as negative regions of the gene or distant genomic regions (444). All negative controls can generate a background signal and should be tested empirically.
More advanced applications of ChIP, demanding stringent technique and computational analysis, involve the combination of ChIP with microarray (ChIP-chip) or next-generation sequencing to identify genome-wide binding sites for a nuclear factor.
[I.5] Mouse models for indicating thyroid hormone and TR signaling in tissues
Background
Numerous KO and knockin mouse strains derived by genetic manipulation have yielded a wealth of information on the physiological functions of TR isoforms in vivo. Genetic manipulation has also been used to generate models that yield insights into where and when T3 or specific TR proteins are present in tissues in vivo. There is scope for further development of such approaches, to elucidate at the cellular level, the basis of T3 actions in vivo.
It should be borne in mind that the lack of receptor in KO mice may produce certain differences in phenotype compared to a lack of hormone. For example, mice lacking all T3 receptors (TRα1, TRβ1, TRβ2) display multiple tissue phenotypes but are not as small or as retarded as mice with severe, congenital hypothyroidism (75). There may be several explanations for these differences. An explanation that has been supported by study of the cerebellum in vivo, is that in hypothyroidism, the TR exerts chronic ligand-independent dysregulation of gene expression to produce a more severe outcome than the absence of a TR. In the absence of TR, this ligand-independent dysregulation of gene expression could not occur such that the phenotype is less severe (445). However, few tissues and few target genes have been studied in detail to indicate how widely this explanation may apply. In summary, the deletion of TR isoforms yields precise information on the tissue-specific functions of TR isoforms. However, the phenotypes may not always be reflected in hypothyroid models. Conversely, hypothyroid phenotypes may not be fully reflected in TR-deficient models.
Mouse strains with targeted KO or knockin mutations in the endogenous Thra and Thrb genes provide models to study TR functions in vivo.
Commentary
Numerous mutations in the Thra and Thrb genes (also known as Nr1a1 and Nr1a2, respectively) have been derived but only a brief mention of phenotypes is given here. For more detailed reviews on Thra and Thrb mutations, readers are referred elsewhere (286,382,383) and to the Mouse Genome Informatics website (
The initial gene targeting studies established that Thrb is primarily responsible for the regulation of the HPT axis (446,447), the development of the auditory and color visual systems (448,449), and the majority of T3 actions in liver (390,393,450). The Thra gene is primarily responsible for determining thermogenic and cardiac functions (386,451) and the maturation of the intestine (452), bone (453), and certain brain tissues (445,454).
In contrast to KO models, knockin mutations in the coding sequence of the Thra or Thrb genes have generated mouse models that express dominant negative TRα1 and TRβ proteins with little or no response to T3 (456). These mutations create models of localized “tissue-restricted” hypothyroidism selective for tissues in which TRα1 or TRβ is the predominant T3 receptor isoform expressed.
Mice devoid of known T3 receptors (TRα1, TRβ1, and TRβ2) can be used to model the complete absence of TR-mediated signaling.
Commentary
Mice lacking specifically TRα1, TRβ1, and TRβ are viable but have cellular and functional defects in multiple organ systems, indicating that in many tissues, TRα1 and TRβ isoforms serve additional, common functions that were not evident in models with single receptor gene mutations (75,457).
Coding sequence changes introduced into both Thrb and Thra genes have provided mouse models for the human syndromes of resistance to thyroid hormone.
Commentary
The human syndrome of resistance to thyroid hormone is typically caused by heterozygous coding mutations in the THRB gene that generate dominant negative proteins with little or no response to T3 (458). Recently, similar mutations in the human THRA gene have been identified that generate dominant negative TRα1 proteins (459,460). The Thrb and Thra knockin mouse models display a range of tissue-selective phenotypes and offer the opportunity to investigate the cellular and molecular defects underlying the disease symptoms in specific tissues (456,461 –465).
Transgenic reporter mice that express a T3-responsive chimeric protein provide an in vivo model that allows for monitoring of the presence of T3 in various tissues.
Commentary
It has traditionally been difficult to detect T3 at the cellular level in natural tissues, especially in specialized cell populations. RIAs performed on tissue homogenates provide no information on which cell types contain T3. The transgenic FINDT3 mouse model offers the advantage of detection of T3 in localized regions within complex tissues (278,467). These mice express a chimeric protein consisting of a yeast Gal4 DNA binding domain fused to a TRα1 ligand-binding domain. The expression of the reporter does not require endogenous TR. The presence of T3 is detected visually on tissue sections based upon activation by the chimeric protein of a Gal4-responsive promoter-fused to a LacZ reporter gene (Fig. 14).
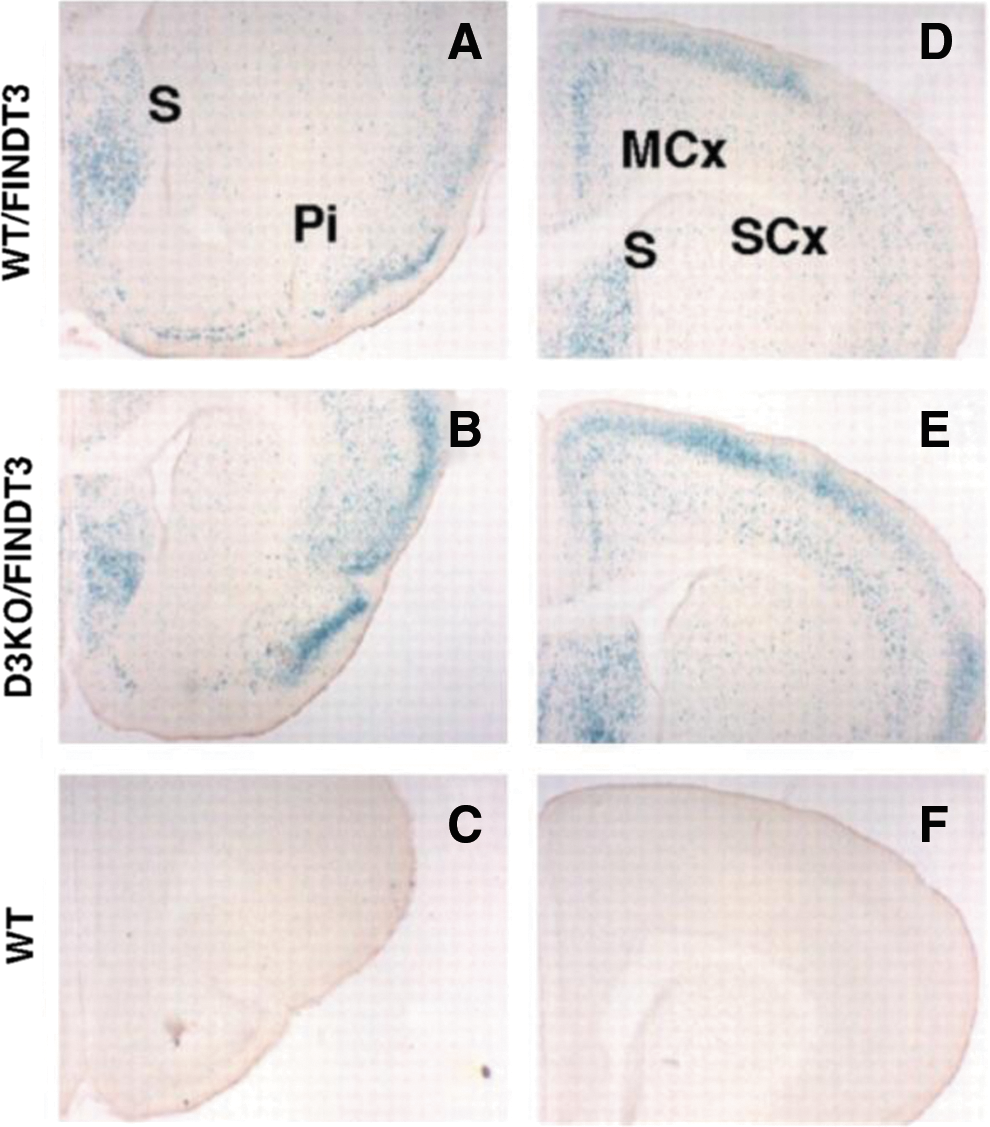
T3 signaling represented by β-galactosidase staining (blue) in coronal brain sections in postnatal day 5 mice carrying the FINDT3 reporter transgene.
This approach can be used to detect T3 activity in several tissues, but reportedly has limited sensitivity in certain brain regions (278). Using beta-gal as the readout in transgenic mice, T3 signaling was absent in the early embryo and was then detected at around E11.5–E12.5 in different primordia (i.e., CNS, intestine, etc.). Since at this time, fetal thyroid function in the mouse is still inactive, and these early signals may reflect maternal T4 or T3 activity. Early T3 signaling was observed in the brain (i.e., diencephalic primordia, medulla oblongata) and sense organs primordia (otic vescicle, olfactory epithelium, retina), whereas at late stages (E15.5–E17.5) beta-gal expression was localized in other primordia (i.e., in the bones, follicular nerves of the vibrissae, as well as in the small intestine primordia, but also in the medulla oblongata) (468).
Targeted insertions in the endogenous Thra and Thrb genes generate TR proteins fused to protein tags that can be used to monitor expression of TR isoforms in specific cell populations in vivo.
Commentary
The fused tag allows detection of TR isoform expression by immunohistochemistry (IHC) or immunofluorescence in tissue sections or whole-mount preparations and offers the possibility of detection at single cell resolution. Thra1 gfp mice carry green fluorescent protein (GFP) fused in-frame at the C-terminus of the intact TRα1 protein (469). Detection of TRα1-GFP protein has been reported in specific brain tissues and cell types. LacZ inserted into the Thrb gene allows detection of TRβ isoforms (430,449,457) and has revealed TRβ2 expression in restricted cell populations in the cochlea, pituitary gland, and cone photoreceptors.
[J] Assessing Thyroid Hormone Signaling by Way of Systemic Biological Parameters
Overview
Thyroid hormones exert diverse actions in virtually all tissues during development, infancy, adolescence, and adulthood in areas such as growth, cognition, skeletal-muscle homeostasis, cardio-circulatory function, energy homeostasis, and intermediary metabolism. It is essential to adopt a physiological whole animal approach for investigation of thyroid hormone action in vivo. By necessity, this requires longitudinal studies of T3-responsive biological parameters and/or biochemical markers.
Studies generally focus on the transition from hypothyroidism to euthyroidism and thyrotoxicosis. Two complementary strategies can be adopted: (i) collect sequential biological measurements from the same animals at baseline and intervals during the period of study, or (ii) run control and experimental groups in parallel and collect biological measurements at specific time points; this model has the advantage that animals can be killed at different time points and tissues harvested for structural or biochemical analyses.
In general these studies are performed in common rat or mouse strains. More advanced animal models include genetically modified mice in which thyroid hormone signaling has been disrupted or modified by either global or tissue-specific gene targeting. With such mouse models it is important to ensure experiments are designed to avoid the confounding influence of mixed genetic background if possible. Ideally, mutant strains should be backcrossed to homogeneity onto a suitable background such as C57BL/6. If this is unrealistic (e.g., if crossing CRE and FLOXED lines from different genetic backgrounds), littermates should be compared and adequate power calculations performed. Males and females may need to be studied separately because responses to thyroid hormones can be sexually dimorphic.
T3-dependent biological parameters can also be studied using ex vivo preparations, such as freshly isolated cells, cultures of primary cells or established cell lines. In general, such in vitro systems have poor responsiveness to T3, with only a few being well characterized. However, cell-based models have been invaluable in the deconstruction and understanding of molecular mechanisms underlying the complex biological effects of T3.
[J.1] Central nervous system
Background
Most effects of thyroid hormone in the brain are observed during development. Endemic neurological cretinism results from maternal iodine deficiency and the consequent maternal hypothyroxinemia, in which circulating T4 levels are low for the stage of pregnancy. Maternal hypothyroxinemia causes neurological thyroid hormone deficiency in the developing fetus resulting in mental retardation, spastic diplegia, deaf-mutism, and squint in the absence of general signs of hypothyroidism. Even though endemic cretinism can be mitigated by iodine supplementation to prevent or correct first trimester maternal hypothyroxinemia, iodine deficiency remains the commonest cause of preventable mental retardation. On the other hand, neurological features of neonatal hypothyroidism may be less profound because they are dependent on the severity of hypothyroidism. Abnormalities are largely preventable by immediate thyroid hormone replacement, although deficits in memory and IQ may persist. Nevertheless, untreated neonates have growth retardation and general features of hypothyroidism with mental retardation, tremor, spasticity, and speech and language defects. The differences between endemic cretinism and congenital hypothyroidism illustrate that the timing of thyroid hormone action is fundamental for neurodevelopment (470,471).
Developmental hypothyroidism also causes sensory impairment, including permanent deafness, which in rodent models has been shown to involve deformity in the inner ear tectorial membrane and impaired maturation of the sensory epithelium (247). There is also a visual phenotype since thyroid hormone affects the development of color vision. In adults, thyroid hormone acts on mood, behavior, and cognitive function, and sophisticated tests have been validated to investigate the effects of thyroid hormones on behavior phenotypes in mice. Thyroid hormone also affects muscle strength and fatigue as well as the motor and cerebellar systems. Individuals with hypothyroidism are sluggish and fatigued with muscle weakness and slow-relaxing reflexes, whereas in thyrotoxicosis there is tremor, muscle wasting, hyper-reflexia, and fatigue.
The adult brain is also responsive to thyroid hormone. A standardized observational screening assessment of behavior and function in rodents has been described (SHIRPA) that allows a general and comprehensive neurological (muscle and lower motor neuron, spinocerebellar, sensory, and autonomic function) and neuropsychiatric (activity, learning, arousal, fear, aggression, feeding, irritability, etc.) analysis to be performed prior to more detailed investigation of abnormal parameters and neurological pathways (472). A modified and standardized SHIRPA assessment has been adopted by the International Mouse Phenotyping Consortium as part of the initial characterization primary phenotype screen of mouse mutants generated by the International Knockout Mouse Consortium (473,474). Such an approach is being adopted to include phenotype analysis of all physiological systems and facilitate standardization and eventual generation of comprehensive and large repositories of phenotype data.
Rodent models can be used to study how thyroid hormone affects brain development and function. The correlation between the time of onset of fetal thyroid function and the chronologic age is different in rodents than in humans; the stage of neurobiological development rather than the chronological age of the animal should be considered.
Commentary
Congenital hypothyroidism promotes profound impairment of brain development and function. For example, selective and persistent cognitive problems may be seen in children that were born with congenital hypothyroidism. Sophisticated imaging, such as magnetic resonance imaging (MRI), has shown that children and adolescents with congenital hypothyroidism have reduced hippocampal size and abnormal hippocampal growth patterns relative to peers. More importantly, reduced hippocampal volumes predict poor memory performance (475).
Rodent models of congenital hypothyroidism have been studied extensively, given that most anatomical and functional components of the mammalian brain are similar between man and other mammalian species (476). However, in many respects they do not constitute an ideal animal model for study of fetal maternal thyroid economy during gestation. The main differences involve the onset of fetal thyroid function and timing of neurodevelopmental events in relation to birth. The issue is how much different species vary in relation to man according to the proportion of the brain growth spurt that is postnatal (476). In this respect, thyroid hormones do not influence very early events such as neural induction and the establishment of polarity during brain development. Instead, they modulate later processes, including neurogenesis and dendrite proliferation, myelination, and synapse formation. The timing of onset of thyroid hormone action in the developing brain is thus crucial and physiologically important. Alternatively, sheep have been extensively used as an animal model. The guinea pig is of potential interest as well because its in utero thyroid maturation is much closer to that of the human (477).
Many rodent studies have focused on the rat cerebellum because its neurobiological development is predominantly postnatal and thus more easily exposed to experimental manipulation (476). However, other regions including the cerebral cortex, basal ganglia, cerebellum, and hippocampus have also been studied using standard histological approaches. These techniques have also been adapted to study the spinal cord and dorsal and ventral nerve roots (478). For example, the Purkinje cell neurons and their spatial organization are central to the function of the cerebellum. They are formed just before birth in the rat and their number is not affect by hypothyroidism at birth but their migration and maturation is severely impaired (476). The effect of thyroid hormone deficiency on maturation of the rat cerebellar cortex may still be observed if hypothyroidism is induced up to the second postnatal week (476). Similarly, most rat forebrain neurogenesis is completed at birth. However, the structural analysis indicates that there is marked hypoplasia of the neuropil (476). Thus, it seems clear that thyroid hormone affects direct brain maturation through specific effects on cell differentiation. Thyroid hormone slows down cell division while concomitantly stimulating the onset of cell differentiation.
Given the functional diversity and structural complexity of the CNS studies of T3-responsive genes in the brain are greatly enhanced if studied via in situ hybridization or IHC.
Commentary
Microarray analysis, Northern blotting, RT-qPCR, next-generation RNA sequencing, and in situ hybridization have all been used to study T3-regulated gene expression in the brain (392,401,479). Protocols for in situ hybridization and IHC have been described (445,480 –484). These may be performed on paraffin-embedded sections or fixed frozen tissue if preservation of detailed histological architecture is of significant importance (485). However, paraffin embedding interferes with RNA quality, thus better signal-to-noise ratio and analysis of gene expression are obtained using fixed frozen tissue. For example, in situ hybridization has been used to define TRH as a negatively T3-regulated gene in the hypothalamus (486 –489) and to study the cortex/dentate gyrus expression of RC3/neurogranin, which is positively regulated by T3 (396).
When using quantitative methods, careful sample dissection is needed given the highly compartmentalized nature of the brain. In some cases, pooled samples from 5–10 mice are required to obtain sufficient RNA for such studies (485). A more appropriate way of obtaining brain samples is through laser-capture microdissection, which allows accurate isolation of specific cell-types embedded in a heterogeneous tissue microenvironment. Laser-capture microdissection works under micromanipulator-assisted direct microscopic visualization and the samples obtained can then be processed for RNA isolation (491).
A microarray analysis of hypothyroid mouse cerebral cortex identified 316 genes positively regulated and 318 genes negatively regulated by T3 (127). The responsiveness of subsets of these genes to T3 was confirmed by RT-qPCR in a brain-specific, severely hypothyroid mouse model, the double Mct8/D2 KO mouse (127) and in the brain of systemically thyrotoxic mice or D3 KO mice (492). Through the study of systemic hypothyroidism or thyrotoxicosis, T3-regulated genes have also been identified in specific regions of the brain (e.g., cerebellum, cortex, hippocampus). In the developing cerebellum, systemic hypothyroidism resulted in altered expression of 2940 genes, of which 1357 were up-regulated and 1583 down-regulated as assessed by microarray analysis (493). However, the number of cerebellar genes directly regulated by T3 is likely to be much smaller as evidenced in primary cultures of cerebellar neuronal cells studied via microarray RNA hybridization (494). In any such screen, stringent statistical criteria should be used to narrow down the number of candidate T3-regulated genes for further confirmatory analyses.
Brain protein expression is typically analyzed by Western blotting or IHC of fixative-perfused brains (post-fixed overnight at 4°C and cryoprotected in 30% sucrose). IHC is suitable for quantitative approaches only if the detection system is kept unsaturated; quantification of secreted proteins and peptides by this method is not recommended. Studies can be performed on free-floating cryostat sections of specific brain regions (478). The approach was used to study the effects of congenital hypothyroidism on microtubule-associated protein-2 expression in the cerebellum of the rat (495) and the expression of thyroid hormone transporters in the cochlea (496). In addition, IHC was also used to study the regulation of reelin and dab1 by thyroid hormone in different brain regions (497), whereas Western blotting and in situ hybridization were used to study tenascin-c (498). These techniques have differing advantages and disadvantages. Thus, immunocytochemistry provides the ability to identify precisely where in the CNS the antigen is located in individual cells or at the subcellular level in the nucleus or cytoplasm or even more precisely if electron microscopy is used. It also provides an excellent method to verify loss or re-expression of a particular antigen in transgenic mouse models or following anatomical manipulation such as electrolytic lesioning or transection. Because the content of an antigen in any particular cell can be influenced by its rate of synthesis, transport, degradation, and secretion, in situ hybridization histochemistry tends to be a much better quantitative approach than IHC. Alternatively, specialist microdialysis techniques can be used to measure secreted protein concentrations. Western analysis also can be subject to some of the same concerns with respect to quantitation as immunocytochemistry, but has the advantage of being able to identify the size of the antigen(s) being identified.
Functional hearing deficits resulting from thyroid hormone deficiency may be studied by measuring auditory evoked brainstem responses to determine stimulus intensity thresholds.
Commentary
Analysis of middle ear anatomy involves histological inspection of the ossicle for deformities (499). Assessment of ossification requires staining with alcian blue and van Gieson to visualize cartilage and bone formation. Cochlear anatomy is examined on inner ear sections. Methacrylate plastic-embedded samples of paraformaldehyde/glutaraldehyde-fixed cochlear tissue yield good preservation of cellular structure; 3- to 4-μm-thick sections can be stained with toluidine blue (448,501) or thionin (499,502) or aqueous hematoxylin (277).
A relatively rapid, noninvasive means of assessing auditory function is the measurement of the auditory-evoked brainstem response (277,448,501,502). Investigation of other features of cochlear function or cochlear nerve function may include determination of the endocochlear potential, compound action potential, and other physiological parameters (277).
Deficits of visual function that result from thyroid hormone deficiency may be studied by measuring visual evoked responses in electroretinograms to determine wavelength sensitivity and light intensity thresholds.
Commentary
Histological analysis of the retina is performed on 2 μm sections obtained from methacrylate plastic-embedded samples. The dorso-ventral axis of the globe is marked. In situ hybridization and immunohistochemistry are used to assess expression of candidate target genes and are typically performed on 10–16 μm paraformaldehyde-fixed cryosections (279,398,503,504). Protein expression analyses can be performed on protein extracts prepared from dissected retina to investigate various opsin and rhodopsin proteins using Western blot and immunohistochemical studies (279,398,503,504,506).
Cone and rod photoreceptor functions can be assessed by analysis of the electroretinogram, which is typically recorded in young adult mice. Given the critical functions of thyroid hormone in different cone types, it is important to analyze photopic (light-adapted) cone responses in response to specific light wavelengths that are selective for the different cone populations, namely, those with peak sensitivity to medium-long (M, or “green” ∼520 nm) and short (S, or “blue” ∼367 nm) wavelengths of light. Scotopic (dark-adapted) rod responses should also be determined (279,398).
Thyroid hormone effects on neuron ion channels and nerve conduction can be investigated by patch-clamp analysis or microelectrode recording.
Commentary
Detailed analysis of neuronal function requires specialist techniques best performed in collaboration with established neuroscience laboratories. For example, patch-clamp analysis of whole neurons in tissue slices or microelectrode recording from tissue slices have been used to study the effects of thyroid hormones on neuron function (478). Whole-cell patch-clamp recordings of individual neurons can be performed using specialist instruments on 300 μm para-sagittal brain slices obtained from mice. Neurons are visualized by infrared-differential interference contrast microscopy to allow selection of cells to be recorded (478). Advanced recording procedures can measure hypothyroidism-induced changes in long-term potentiation in hippocampal neuron populations, a cellular mechanism of synaptic plasticity that is thought to be involved in memory (507 –510).
Standardized neurological tests can be used to investigate how thyroid hormone affects neuromuscular control at both motor and cerebellar levels. The use of complementary methods is recommended.
Commentary
Open-field testing protocols have been used to quantitate locomotor activity for distance travelled and speed over a defined period (187,483,511) in order to investigate both behavioral and stamina aspects of neuromuscular function in response to alterations in thyroid status. Motor and muscle function can be investigated by standardized tests of strength, including grip strength determined using an automated grip strength meter, an electronic pull strain gauge, or a hanging wire test (478). Accelerating rotarod testing of balance and motor coordination is performed by determining the time an individual mouse is able to stay on the rod during its rotation following a defined training period prior to testing (187,483). Beam walk testing using a series of elevated beams of differing widths may be used to determine balance by measurement of foot slippage and time to cross the length of the beam (478). Alternatively, vertical pole tests are used to investigate agility and balance by determining the time taken for a mouse to invert and run to the base of a pole when placed near the top (187). Footprint analysis of gait can be assessed in mice trained to walk along a filter paper with their feet painted with different color nontoxic paints applied to forelimbs and hindlimbs. Determination of stride length, front and hind base width, interstep distance, heel usage, and hind paw angle can be used to assess balance and coordination (478).
Mood, behavior, learning, and memory are responsive to thyroid hormone and can be investigated using established behavioral tests. The use of complementary methods is recommended.
Commentary
Features of depression are investigated by learned helplessness testing. In this situation, an operant learning system, comprising a conditioning chamber with a shock generator, allows analysis of “active avoidance” behavior by discriminating avoidance from escape (511). In order to investigate anxiety a “passive avoidance” system should be used. A light/dark box is employed to determine the time spent in light versus dark during a defined total time period (511 –513). An elevated plus sign–shaped maze, consisting of two opposed open arms and two opposed enclosed arms, can be used as an alternative assessment. In this situation, the time spent in exploratory behavior in the open arms versus nonexploratory behavior time in enclosed arms is determined (187,483). Startle responses as further indicators of anxiety and restlessness may also be investigated (511).
To investigate the effects of altered thyroid status on learning and to measure effects on recognition memory, studies in an open field with familiar and novel objects can be employed in novel object recognition tasks (187,483). Open-field testing can also be used to investigate features of depression because it evaluates the tendency of mice to explore openly or stay frozen at the edges of the field or to present rearing behavior. Additional tests to investigate learning and memory involve the use of a Morris water maze filled with opaque water and containing a small platform located in one quadrant just below the water surface. The mouse is placed on the small platform for 10 seconds and then placed in the water. The time taken to find and climb onto the platform is recorded. The task is repeated on sequential days to investigate learning and memory. The visible cue test replicates the experiment except that the platform is clearly visible (187). The water escape test investigates visual awareness by placing a visible escape ladder on the side of the vessel and recording the time taken to climb on to the ladder (187).
The hypothalamic effects of thyroid hormone on behavioral and metabolic parameters can be studied directly after intra-cerebro-ventricular (ICV) administration of T3.
Commentary
Thyroid hormone exhibits a number of effects that are mediated directly at the medial basal hypothalamus. An example is the increase in food intake that rapidly follows administration of T3 directly into the ventromedial nucleus (514 –516). A related approach is to implant T3 crystals stereotaxically into discrete hypothalamic areas. This method has been used to define the direct role played by T3 in the TRH negative feedback mechanism (487,488) and to study the photoperiod-mediated regulation of seasonal energy balance and reproduction in the Siberian hamster (517). Furthermore, the direct role played by a number of neuropeptides on the HPT axis has been studied using the ICV route; for example, aMHS, neuropeptide-Y, and agouti-related protein (518 –522).
Brain cell models that respond to thyroid hormone in vitro can be used to model T3 effects in the CNS.
Commentary
Primary cultures of hippocampal neurons and neuronal cell lines respond to T3 in vitro. In cultured neurons, exposure to T3 significantly increases the neurite size and length, as well as acetylcholinesterase activity (523). In addition, T3 directly affects the development of cultured cerebellar Purkinje cell dendritic processes through activation of TRα1 (524). T3 can also enhance neuronal differentiation induced by retinoic acid treatment of embryonic stem cells (525). Glial cells are also responsive to T3 (526). For example, the activity of the cell maturation marker glutamine synthetase increases in cultured cerebellar astrocytes in response to T3 (527). Notably, thyroid hormone–evoked changes in neuronal function often involve glia-mediated actions (526). For example, thyroid hormone up-regulates voltage-activated sodium current in cultured postnatal hippocampal neurons through T3-dependent secretion of basic fibroblast growth factor from hippocampal astrocytes (528). Oligodendrocytes are also responsive to T3 and myelination is probably the best characterized T3-mediated effect on glial cell function (529), with T3 stimulating myelin basic protein gene expression in cultures of oligodendrocytes (530).
Cultured brain cells often exhibit substantial deiodinase activity, D2 and/or D3, and thus the type and concentration of the thyroid hormone applied in treatment groups should be considered and experiments planned accordingly. Frequent media changes may be required to ensure stable iodothyronine concentration throughout the experiment. Adding tracer amounts of radiolabeled T4 or T3 with subsequent analysis of the metabolites in the media indicates their metabolic rate (173). In coculture models, T3 produced by D2 in H4 glioma cells affects gene expression in neighboring SK-N-AS neuroblastoma cells (173). In this system, concentrations of T4 as low as 20 pM evoked T3-mediated gene expression in the neuronal cells.
Pituitary cell models respond to thyroid hormone in vitro and can be used to study T3 effects in the anterior pituitary gland.
Commentary
Pituitary cell lines are typically responsive to thyroid hormone given the high TR expression in the gland (101). The GH1 somatotroph cell line was among the first cell models shown to respond to physiological levels of thyroid hormone as monitored by cell growth and glucose utilization (531). In the GH3 somatotroph cell line, exposure to T3 increases growth hormone expression in a TRβ2-mediated manner (532), while in GH-secreting GC cells, T3 decreases D2 mRNA levels (143). The thyrotroph-derived cell line TαT1 also responds to physiological levels of T3 by decreasing TSHβ and D2 expression (259,533).
[J.2] Heart and cardiovascular system
Background
Development of the heart and transition of a fetal to adult cardiac gene expression program is to a large extent dependent on thyroid hormone (534). The heart remains a major target organ of thyroid hormone in adult life and cardiovascular effects are among the most pronounced clinical manifestations of hypothyroidism and thyrotoxicosis in man (535). Rodent hearts are equally responsive, and virtually every aspect of cardiac biology is affected by thyroid hormone, including electrophysiology, ion homeostasis, contraction, energy metabolism, and adrenergic signaling (402). The sum of these effects is evident in the increases in heart rate and rates of contraction and relaxation in the transition from low to high thyroid-hormone states. Together with the reduction of peripheral resistance induced by thyroid hormone, this results in the higher cardiac output required by the hypermetabolic organism. Ventricular growth is also stimulated by thyroid hormone, almost doubling heart weight in the transition from hypothyroidism to thyrotoxicosis. However, thyroid hormone has little direct effect on cardiomyocyte growth and the ventricular hypertrophy is almost entirely in response to the increase in cardiac workload induced by thyroid hormone (537). Therefore, although the functional consequences of altered thyroid-hormone levels are relatively straightforward and well documented, separating the direct effects from the secondary ones may be challenging. This even applies to those cardiac genes that have been identified as direct targets of T3, because they are in many cases transcriptionally coregulated by factors that are themselves influenced by the thyroid status (e.g., through load-dependent signal-transduction routes).
Understanding the mechanisms of thyroid-hormone action in the heart and assessing cardiac T3 activity is relevant, particularly given the suspected role of impaired cardiac thyroid-hormone signaling in the progression of heart disease and the potential therapeutic use of thyroid hormone. This is related to the low serum thyroid-hormone levels seen in heart failure (i.e, the NTI syndrome) as well as to changes in cardiac thyroid-hormone metabolism and TR expression in various forms of heart disease. The recommendations in this section describe approaches and methods that are used to determine the effect of the thyroid status on cardiac parameters. These methodologies are also used to assess the role of cardiac thyroid-hormone signaling in genetically modified mice, such as TR knock-out models (451), and in models of pathological cardiac remodeling and heart failure. Models for LV remodeling include the spontaneously hypertensive rat model (539); surgical induction of myocardial infarction by transient or permanent ligation of the left descending coronary artery (238,540); LV pressure overload by surgical banding of the aorta (transverse aortic constriction) (541 –544); and isoproterenol-induced LV hypertrophy in the context of the D3 knock-out mouse model (64). Involvement of thyroid-hormone signaling in right-ventricular (RV) remodeling has been studied in rat using the model of pulmonary arterial hypertension induced by a single injection of monocrotaline (62, 63). The methods for inducing LV remodeling are used in rats and mice, but monocrotaline cannot be used for inducing RV remodeling in mice.
The effects of thyroid hormone on cardiac function and morphology can be assessed noninvasively by ultrasound or MRI.
Commentary
Noninvasive methods are used to study the effects of thyroid hormone on cardiac function and morphology (540,545,546). These methods are ideally suited for longitudinal analyses of individual animals. Echocardiography is the most widely used, allowing assessment of a range of functional heart parameters (heart rate, stroke volume, cardiac output, fractional shortening, ejection fraction) as well as ventricular volumes and wall thickness during the cardiac cycle (540,546). Ultrasonic devices with high spatial and temporal resolution are required to image the mouse heart accurately because of its small size and high heart rates (i.e., >400 bpm). With proper handling it is possible to analyze awake animals, but echocardiography is typically done on lightly sedated animals using isoflurane or tribromoethanol as anesthetics. These compounds have minimal cardiodepressant effects, unlike other commonly used anesthetics. Maintenance of body temperature during the procedure is essential.
Certain aspects of fetal cardiac function can be assessed using color Doppler–guided spectral Doppler ultrasound (534). This specialized technique has been used in TR-mutant mice to study the effects of disruption of T3 action on functional cardiac development in utero (534).
When the resolution of echocardiography is insufficient to detect effects, MRI provides superior delineation of structures throughout the cardiac cycle with high time resolution (546,547). The same considerations with respect to anesthesia and temperature control apply as for ultrasound analysis. Image collection is triggered by the electrocardiogram (ECG) and processing of acquired images allows reconstruction of the heart through a complete cycle. From these data, functional and structural cardiac parameters can be calculated with greater accuracy.
Analysis of the effects of thyroid hormone on heart rate and blood pressure requires longitudinal analysis in free-moving animals.
Commentary
Telemetry is required to monitor changes in vital parameters accurately without interference from stress. This method has been used in the analysis of thyroid-hormone treatment of rats following myocardial infarction (540), in wild-type mice (548), and in transgenic mice carrying TR mutations (451,549). Heart rate, ECG, body temperature, arterial blood pressure (550), and physical activity are simultaneously recorded by probes connected to a transmitter implanted into the peritoneal cavity with a telemetry receiver located beneath the cage. Continuous telemetry read out is possible for up to 3 months. Key issues are cost and skills required to perform surgical implantation. A telemeter pre-implantation service is available from suppliers including The Jackson Laboratories (
The effects of thyroid hormone on LV contractile function can be assessed by in vivo recording of LV pressures.
Commentary
Hemodynamic parameters are determined in terminal experiments in anesthetized and ventilated mice (238,551) or rats (540) by advancing a micro-tipped pressure transducer or a combined pressure-volume catheter through the right common carotid artery into the ascending aorta and subsequently into the LV. The positive and negative rates of pressure development and the systolic and end-diastolic pressures may be used as sensitive indicators of thyroid hormone–dependent changes in expression of contractile proteins and proteins involved in intracellular calcium homeostasis.
Analysis of the effects of thyroid hormone on cardiac contractile function requires ex vivo experiments using isolated intact hearts or tissue preparations.
Commentary
The perfused heart preparation (Langendorff method) is used to analyze a wide range of cardiac function parameters, with the advantage of being able to control experimental conditions (e.g., stimulus frequency, coronary perfusion, ventricular volume, and pressure). A fluid-filled PVC balloon is inserted into the LV cavity and attached to a pressure sensor and data acquisition system, allowing recording and manipulation of LV pressures and volumes. The method can be applied to assess the cardiac effects of thyroid hormone in both rat (552 –554) and mouse models (555,556). An additional advantage of this heart model is that it allows analysis of the important effects of thyroid hormone on cardiac substrate metabolism and mitochondrial function (552,556, 557). Labeled fatty acids and glucose are used to analyze oxidative and glycolytic metabolism by standard techniques (3H-labeled substrates) (552) or by NMR spectroscopy (13C-labeled substrates) (556). This may be complemented by subsequent tissue analysis of key metabolic enzymes and respiratory function of isolated mitochondria (552,556).
More detailed analysis of the effects of thyroid hormone on contractile and mechanical properties of cardiac tissue is achieved using isolated trabeculae (558,559) or papillary muscles (560). Force and shortening velocities of the electrically stimulated muscles are recorded using a strain gauge. Papillary preparations have also been used to record the effect of thyroid hormone on electrophysiological properties (e.g., the shortening of action potential duration) (561). Thin preparations and/or reduced temperatures are required to prevent tissue hypoxia of the superfused preparations during repetitive stimulation such as when determining force-frequency relationships. For this reason small trabeculae are preferred, which are more readily obtained from the RV than from the LV.
Right atrial preparations containing the sino-atrial node can be used for recording isometric force and frequency of spontaneous beating. This has been done to assess the effect of a TRα1 mutation on the autonomic control of heart rate in mice (549).
The effects of thyroid hormone on cardiac Ca2+ homeostasis can be assessed in trabeculae or papillary muscles as well as in isolated single cardiomyocytes.
Commentary
The positive inotropic and lusitropic effects of thyroid hormone detected using trabeculae or papillary muscles reflect changes in expression of myosin heavy chain isoforms, as well as changes in expression of calcium-handling proteins. The latter include the ryanodine Ca2+ channel, the sarcoplasmic/endoplasmic reticulum Ca2+-ATPase (SERCA2a or Atp2a2) and its regulatory protein phospholamban (536). The effect on beat-to-beat intracellular Ca2+ fluxes can be assessed in trabeculae or papillary muscles using Ca2+ indicators (560,562,563). FURA2 is the most widely used fluorescent indicator that allows determination of intracellular free Ca2+ concentrations by a dual wavelength approach. However, recording of Ca2+ transients with millisecond time resolution requires sophisticated high-speed optics. Dedicated setups are available for combined analysis of contractile properties and Ca2+ fluxes (563).
The same experimental approach can be used to analyze the effects of thyroid hormone on Ca2+ homeostasis in individual, electrically stimulated cardiomyocytes isolated from mouse (564) or rat hearts (565,566). Analysis of single cultured cells has obvious advantages, but the yield of viable, rod-shaped cardiomyocytes is variable. It is particularly low in the case of hypothyroid hearts, creating the risk of selection bias.
The cardiac tissue response to thyroid hormone can be assessed using histological methods and by studies of thyroid hormone–responsive gene expression.
Commentary
The weight of the whole heart or individual ventricles should preferably be determined as a ratio to tibia length, since body weight may vary considerably as a function of the thyroid status. H&E staining of paraffin sections is typically used for measurement of cardiomyocyte cross-sectional area (238,567). It should be noted that the conditions of fixing cardiac tissue can affect cardiomyocyte morphology and additional methods have been developed to determine accurately myocyte cross-sectional area as well as length (539). Masson's trichrome staining of sections is used to assess fibrosis in combination with cardiomyocyte morphology (542), and the collagen volume fraction may be quantified by picrosirius-red staining and polarized-light microscopy (568). Expression of T3 target genes, including Hcn2, Kcne1, Kcnb1, Kcna1, Kcnq1, Thra, Thrb (534), Atp2a2, Myh6, Myh7 (62,238), and Nppa (238), is performed by RT-qPCR on mRNA extracted either from whole heart or from individual chambers or regions (see
It is also important to realize that no cardiac protein is exclusively regulated by thyroid hormone. The effectiveness of T3 treatment may be apparent from changes in expression of the above mentioned genes—in particular the reciprocal changes in Myh6 and Myh7 expression—but changes in expression of these genes in pathological situations does not necessarily imply altered T3 signaling. For instance, many of the signal transduction routes involved in pathological ventricular remodeling and heart failure also converge on the T3-responsive genes, with effects opposite to those of T3. As a result, the phenotype of the failing heart resembles that of a hypothyroid heart, at least for a number of proteins (535). However, assessment of tissue T3 levels (63,238) (see Section B.2,
Contracting myocardium takes up plasmid DNA encoding T3-responsive reporter genes, allowing cardiomyocyte-specific T3-dependent transcription activity to be determined in vivo.
Commentary
Cardiomyocytes in the beating heart have the unique capacity to take up plasmid DNA injected into the ventricular wall. The mechanism of uptake is unknown, but because no other cells present in the myocardium are transfected, cardiomyocyte-specific regulation of fluorescent reporter genes can be studied in vivo. The same considerations outlined for in vitro analysis of reporter genes apply with respect to normalization and controls for off-target effects of thyroid hormone or other interventions (see Section I). However, analysis of T3-regulated transcription does not require co-transfection of a TR-expressing plasmid. During thoracotomy surgery the free wall of the LV (mouse) or LV and/or RV (rat) is injected with a small volume of plasmid solution (Fig. 15). Typically, several thousand cardiomyocytes are transfected, and expression lasts for several weeks. Analysis of reporter and normalization luciferase expression (usually firefly and Renilla luciferase) is done on tissue homogenates. This methodology has been used to investigate the T3-dependent regulation of the Myh7 promoter (572) and to assess the T3-dependent transcriptional activity in rat and mouse models of heart failure (63,238). Because in the latter approach a minimal promoter containing only a T3RE as cis-acting element is used, it yields the net result of all factors potentially contributing to the altered T3 signaling in the cardiomyocyte (e.g., thyroid-hormone uptake, metabolism, and expression of TRs and cofactors).
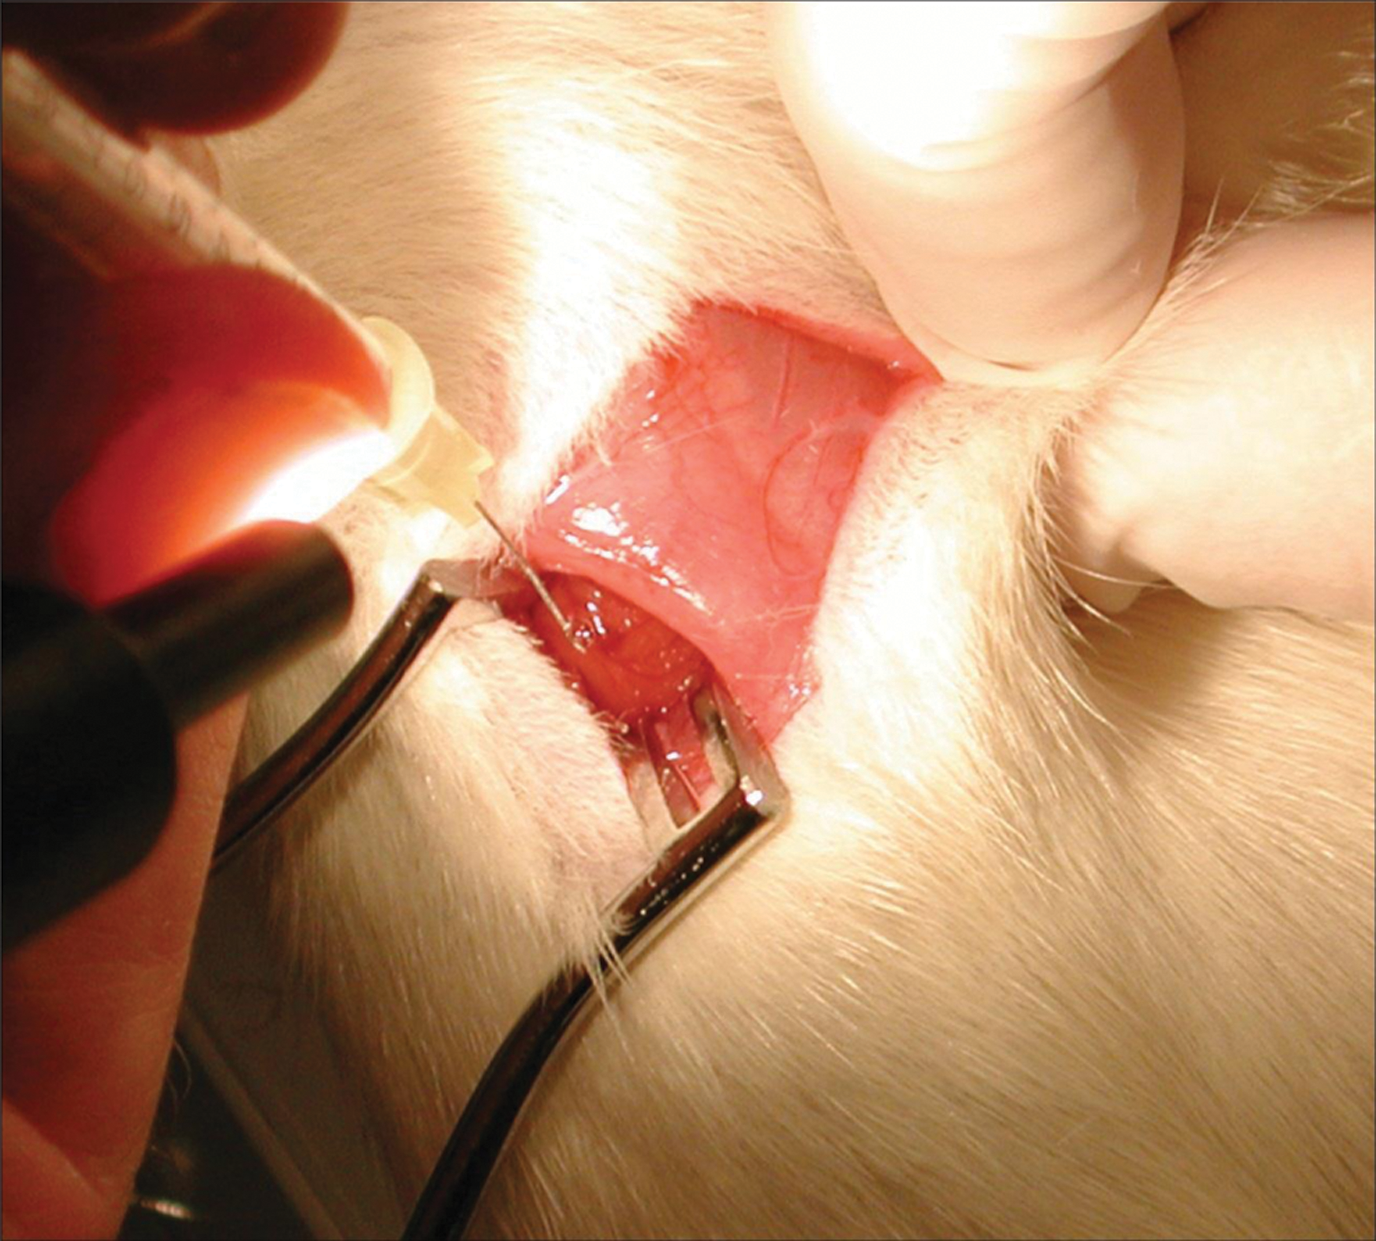
In vivo transfection of rat cardiomyocytes by direct DNA injection. The animal is anesthetized with a mixture of N2O (0.2 L/min), O2 (0.2 L/min), and sevoflurane (2%–3%), and the heart is exposed through a right-lateral thoracotomy. The free wall of the right and/or the left ventricle is injected three to four times each, delivering a total of 20 μg of reporter plasmid(s)/ventricle in 100 μL of saline. In this example injection of the right ventricle is shown, with the 29-gauge needle bent at the tip at an almost right angle to allow easy injection of the thin right ventricle wall. The thorax is then closed and the animal is sacrificed 5 days later. Expression of luciferase reporter and normalization genes is determined in ventricle homogenates. Courtesy of Dr. Warner Simonides.
Primary cultures of rat and mouse cardiomyocytes, as well as the cell line H9C2, can be used to study the effects of thyroid hormone.
Commentary
Primary cultures of adult rat or cardiomyocytes are obtained by Langendorff perfusion of the isolated heart with a collagen-digesting solution. Rod-shaped, viable cardiomyocytes are separated from permeabilized, rounded cardiomyocytes and other cells and plated. The yield of viable cardiomyocytes varies, but it may be as high as 80%. This depends primarily on the quality of the collagenase preparation used, and several batches of the enzyme may need to be tested. Although primary cultures may last for more than 1 week, the cardiomyocytes start to gradually dedifferentiate from the moment of isolation. Consequently, analyses of the effects of altered thyroid status on cell parameters, such as recording of action potentials (573) and Ca2+ transients (564 –566), as well as in vitro effects of thyroid hormone (574), are typically done on freshly prepared cultures.
Because of the limitations of adult primary cultures, most studies of the effects of thyroid hormone on cardiomyocytes in vitro are performed using primary neonatal rat (541,575 –577) or mouse (578) cultures. One- to three-day-old pups are used and cells are plated following collagenase digestion of minced ventricles. Neonatal primary cultures show spontaneous and synchronous contractions and cultures can be maintained for more than 1 week. The interaction of thyroid hormone and contractile activity can be analyzed either by inhibiting spontaneous contractions (576) or by electrically stimulating the cells (575). The cell line H9C2, derived from rat embryonic heart tissue, is used as an alternative to primary cardiomyocyte cultures and various aspects of thyroid-hormone action and metabolism have been studied in H9C2 cells (579 –581). Although this cell line has retained a number of cardiomyocyte characteristics, it exhibits many of the key properties of skeletal muscle. Notably, H9C2 myoblasts will readily fuse to form multinucleated myotubes and respond to acetylcholine stimulation. Care should therefore be taken when extrapolating data to normal cardiomyocytes.
The effects of thyroid hormone on vascular function can be assessed by analysis of arterial rings and cultured vascular smooth muscle cells.
Commentary
The mechanism of thyroid hormone–dependent reduction in systemic vascular resistance is investigated by ex vivo determination of the vasomotor properties of rat arteries. Vascular rings are prepared from explanted aortas or resistance arteries of hypothyroid, euthyroid, or thyrotoxic rats and mounted in a myograph (582 –585). The contractile response to vasodilating or vasoconstricting agents is recorded, allowing differentiation between changes in endothelium-mediated effects and changes intrinsic to the vascular smooth muscle cells (VSMCs). Primary cultures of VSMCs are used to study the rapid effects of thyroid hormone on VSMC relaxation (586) and the signal-transduction processes involved (587).
[J.3] Intermediary metabolism and energy homeostasis
Background
All major metabolically relevant organs and tissues (e.g., brain, adipose tissue, liver, and skeletal muscle) are targeted by thyroid hormone. In most tissues, thyroid hormone activates multiple metabolic pathways, leading to a faster ATP turnover (ATP breakdown and synthesis) and accelerated oxygen consumption (588,589). Energy transfer is an inherently thermodynamically inefficient process; that is, heat is an obligatory byproduct when energy is transferred (i) from the oxidation of substrates into ATP and (ii) from ATP into biological work. Thus, acceleration in ATP turnover leads to heat production (thermogenesis), which is the accepted pathway by which thyroid hormone activates thermogenesis. Specifically, thyroid hormone accelerates turnover of a number of ATP-requiring ionic or substrate cycles including Na/K ATPase, Ca ATPase, lipogenesis and lipolysis, and Cory cycle (590). Both basal metabolic rate (i.e., energy spent to sustain life in a resting state) and adaptive energy expenditure (e.g., cold-induced) are up-regulated by thyroid hormone. Direct activation of the UCP1 gene transcription in BAT is the underlying mechanism by which thyroid hormone accelerates cold-induced thermogenesis (267,269,592); it is less clear that thyroid hormone plays a role in diet-induced adaptive energy expenditure (211,593). In addition to these direct actions in energy homeostasis, thyroid hormone also acts in the CNS (e.g., hypothalamus) influencing major homeostatic pathways; for example, sympathetic activity, appetite, and food intake (594,595). Thus, studies of the metabolic effects of thyroid hormone may also require strict control of food and fluid intake, motor activity, respiration, and heart rate.
Systemic thyrotoxicosis and hypothyroidism can be modeled in rats; experimental endpoints to consider include oxygen consumption (VO2), respiratory quotient (RQ), feeding behavior, food and water intake, and movement/activity.
Commentary
There is an approximately fourfold acceleration in the rate of energy expenditure during the transition from hypothyroidism to thyrotoxicosis in rats (596,597). VO2 is reduced to ∼50% once systemic hypothyroidism is achieved (597). Administration of thyroid hormone rapidly accelerates VO2 in euthyroid or hypothyroid rats, with significant changes observed as soon as 18–24 hours of the administration (597,598). A significant drop in RQ of ∼10% is observed within 2 days of the administration of thyroid hormone to rats (599). The administration of T3 to euthyroid rats also results in rapid acceleration in VO2 (∼60%), which starts at 24 hours and plateaus at 7 days (600).
The energetic cost of living for the mouse is about twofold higher than for the rat (601). Thus, substantial differences exist between mice and rats with respect to their metabolic responsiveness to thyroid hormone. Hypothyroid mice do not exhibit a decrease in VO2 at room temperature, only after acclimatization at thermoneutrality (211). However, the total daily energy expenditure is decreased in the hypothyroid mouse acclimatized at room temperature, a parameter that takes into account the VO2 and the RQ. The sustained total daily energy expenditure in the hypothyroid mouse is due to enhanced sympathetic stimulation of BAT (211,602). This indicates that the reduction in thyroid hormone signaling is compensated for by an increase in sympathetic activity, sustaining VO2 at room temperature (211).
Indirect calorimetry can be studied over 30–120 minutes with reliable results (597,598,603,604). Stress might be a significant factor in these short-term studies and care should be taken to avoid or at least control for such a variable. In some settings animals are anesthetized to minimize movements and stress (597), but anesthetic agents can interfere with thermoregulation and energy homeostasis. A state-of-the-art methodology involves admitting mice to an integrated continuous monitoring system that can house animals for days or weeks at controlled temperature (Fig. 16) (232). This minimizes the effects of stress in addition to allowing for acquisition of 24 hour data profiles. Another major advantage is obtaining data points during the day (which reflect basal metabolic rate) and night (which include acceleration of the metabolic rate caused by feeding).
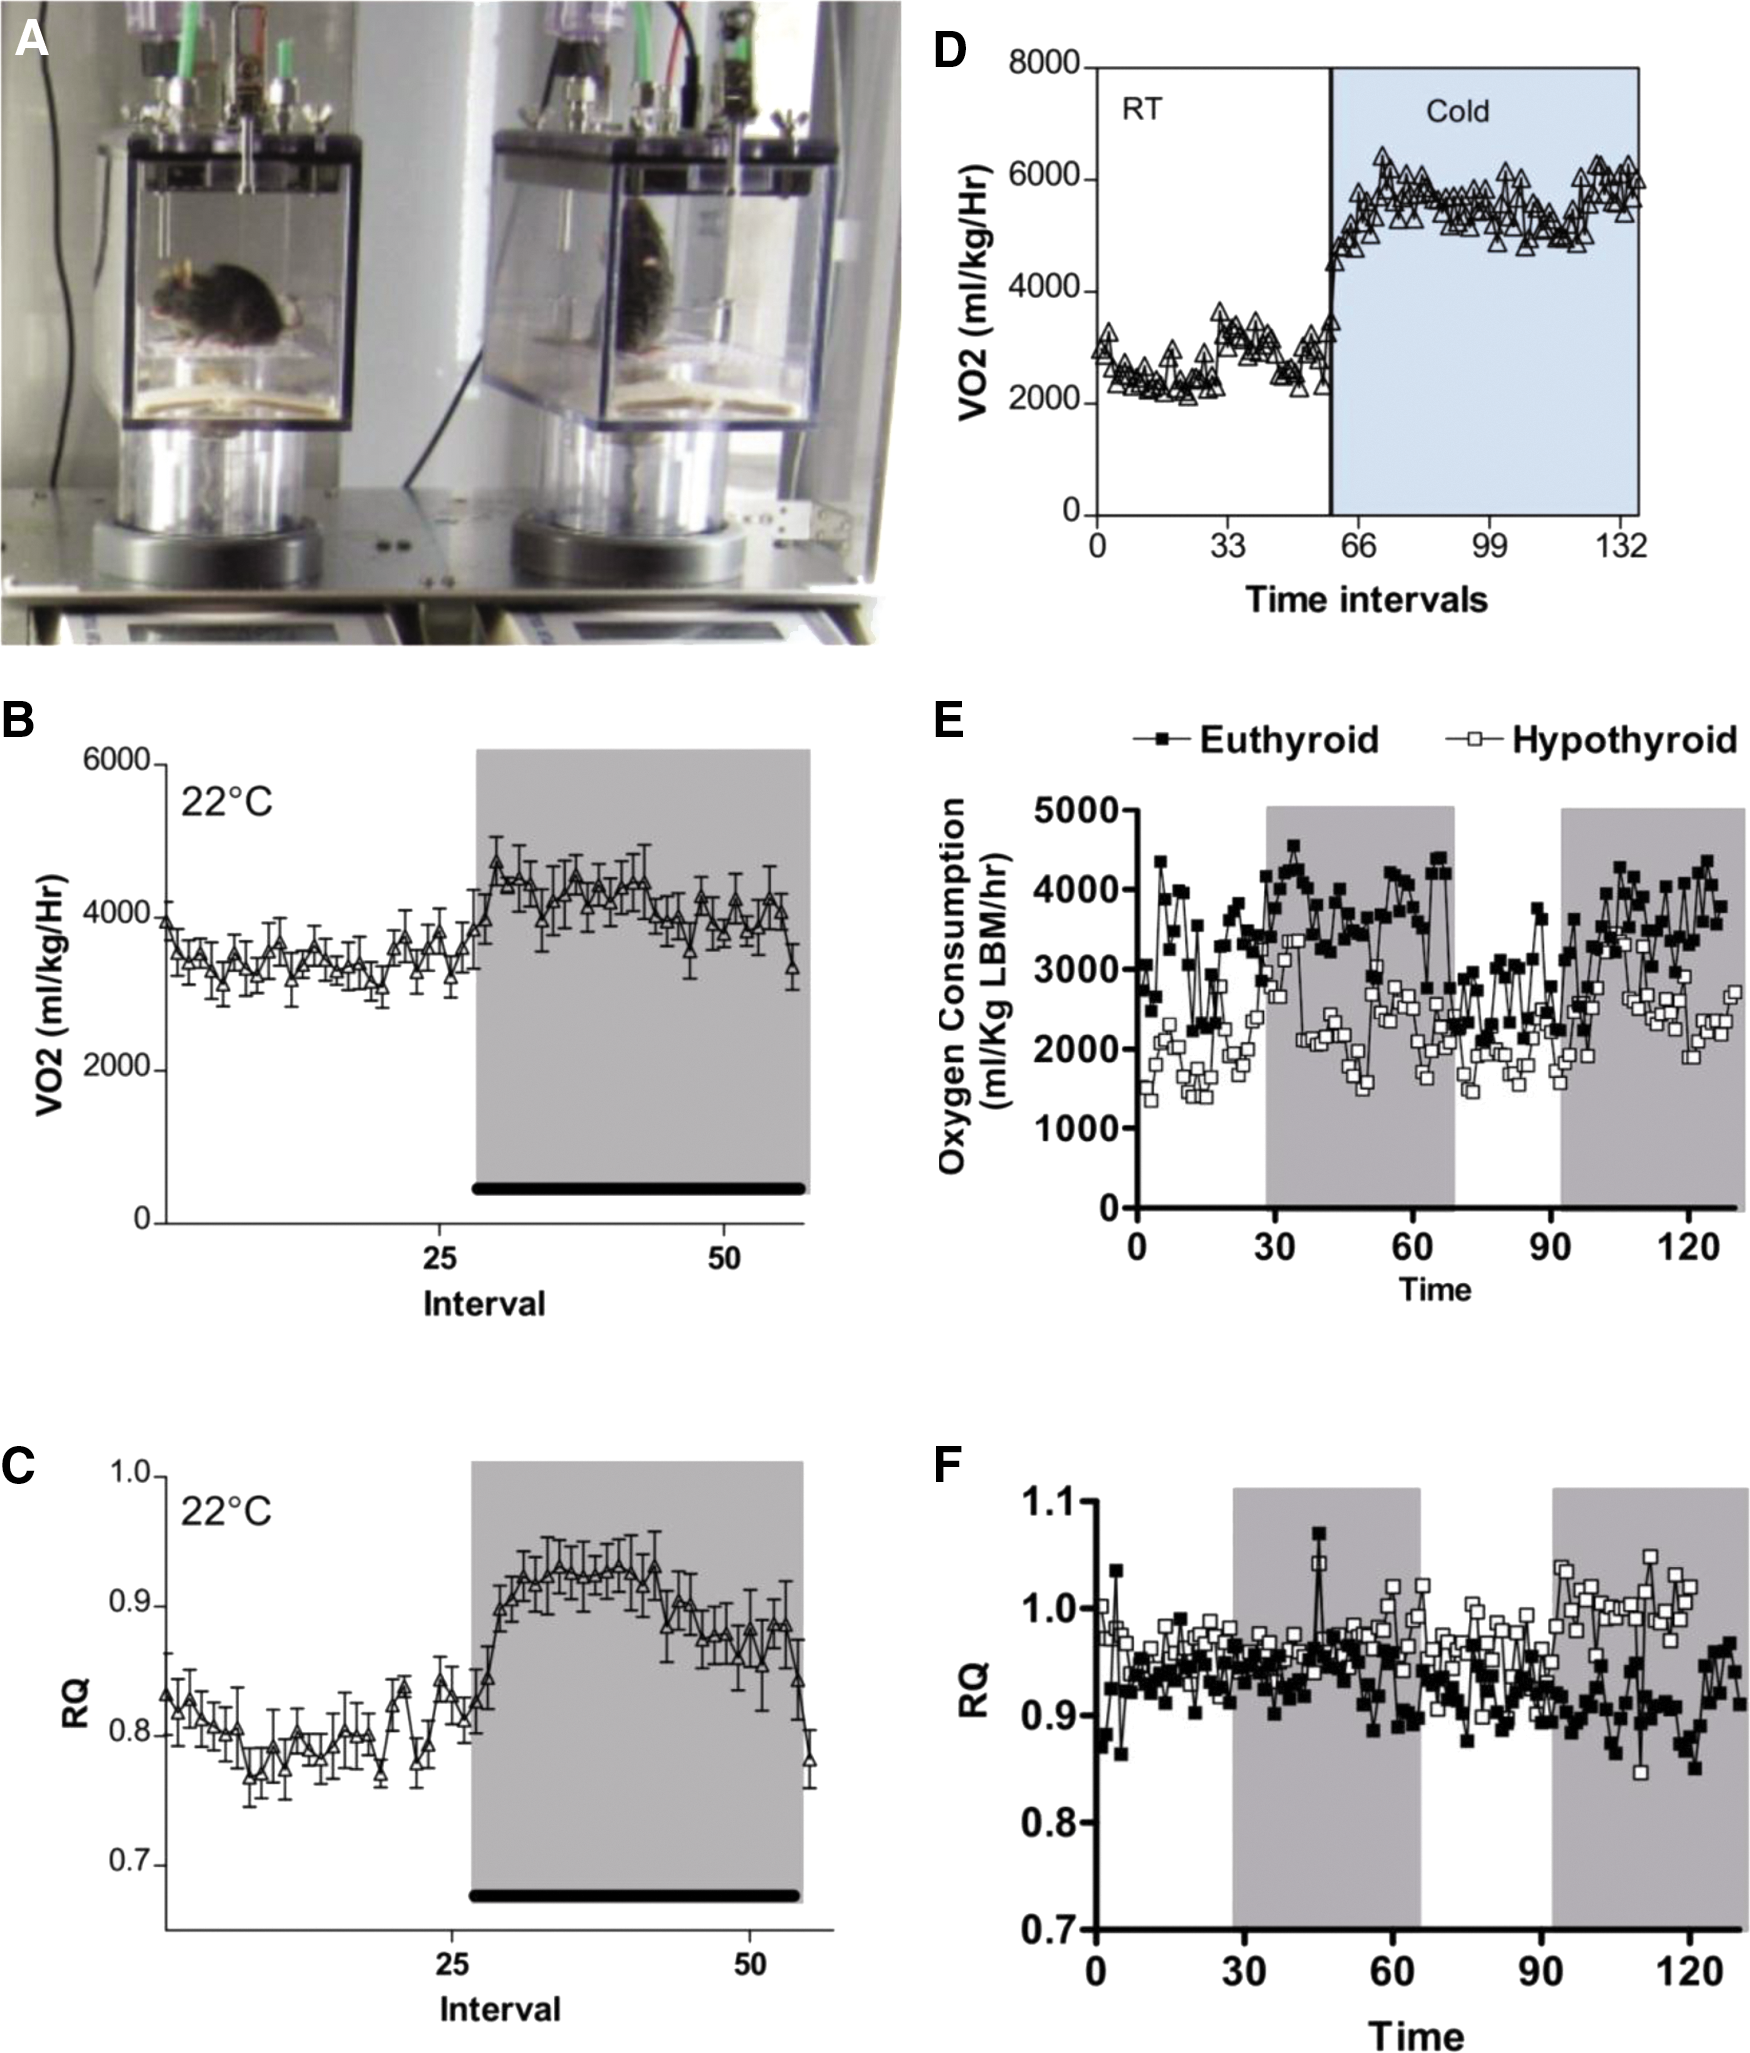
Use of the Comprehensive Laboratory Animal Monitoring System to perform continuous indirect calorimetry in mice.
Ideally, VO2 is expressed as a function of lean body mass determined at or around the time of indirect calorimetry. Fat and lean body masses can be measured by destructive carcass composition analysis or by more recent noninvasive imaging techniques including dual energy x-ray absorptiometry or quantitative MRI. These methods have been compared and may yield differing results, further indicating the importance of careful experimental design and the use of complementary methods for analysis of metabolic phenotypes (606,607).
Core temperature in rodents can be measured via a rectal thermal probe connected to a digital thermometer (608). However, state-of-the-art technology involves surgically implanting radio transmitters into the abdominal cavity to monitor core temperature (609,610). Administration of antithyroid drugs to rats results in rapid reduction of core temperature that is evident after 3 days of treatment; by the end of the first week of treatment, there is an approximately 0.5°C reduction in core temperature that is sustained during all day and night (609). At the same time, rats treated with thyroid hormone for 1 week exhibit an increase of about 1°C in core temperature as assessed with a rectal probe (611).
The effects of systemic hypothyroidism or thyrotoxicosis on a particular tissue can be studied via tissue or cell isolation from appropriately treated animals.
Commentary
Thyroid hormone is well known to influence the metabolic rate of intact organisms; however, the distribution of the effect among various tissues is not as well understood. The liver is clearly established as an important mediator of the metabolic effects of thyroid hormone based on a series of studies utilizing hepatocytes isolated from rats with experimentally induced hypothyroidism or thyrotoxicosis (612), reviewed by Harper and Brand (613). Hepatocyte oxygen consumption was positively correlated with thyroid hormone status of the animal; analysis of respiration indicates that basal mitochondrial proton leak is also positively correlated with oxygen consumption (614). At the same time, other cellular mechanisms differ in their response to hypothyroidism and thyrotoxicosis: in hypothyroid cells, nonmitochondrial oxygen consumption decreases, whereas in thyrotoxic cells reactions involving ATP turnover are increased (613). It should be noted that because the hepatocytes were made hypothyroid or thyrotoxic in vivo (while still part of an intact liver in a pharmacologically treated animal), these effects on respiration cannot be assumed to be directly related to effects of T3 on hepatocytes but may include hepatic effects caused by second messengers arising from extrahepatic sources such as the sympathetic nervous system (SNS).
Historically, energy expenditure of isolated cells has been quantified by measuring oxygen consumption using a Clark electrode or similar apparatus (234). Alternatively, oxygen consumption and media acidification can be measured nondestructively in 24- or 96-well format using modern instruments based on solid state fluorophore/optical sensors (Fig. 17) (615,616).
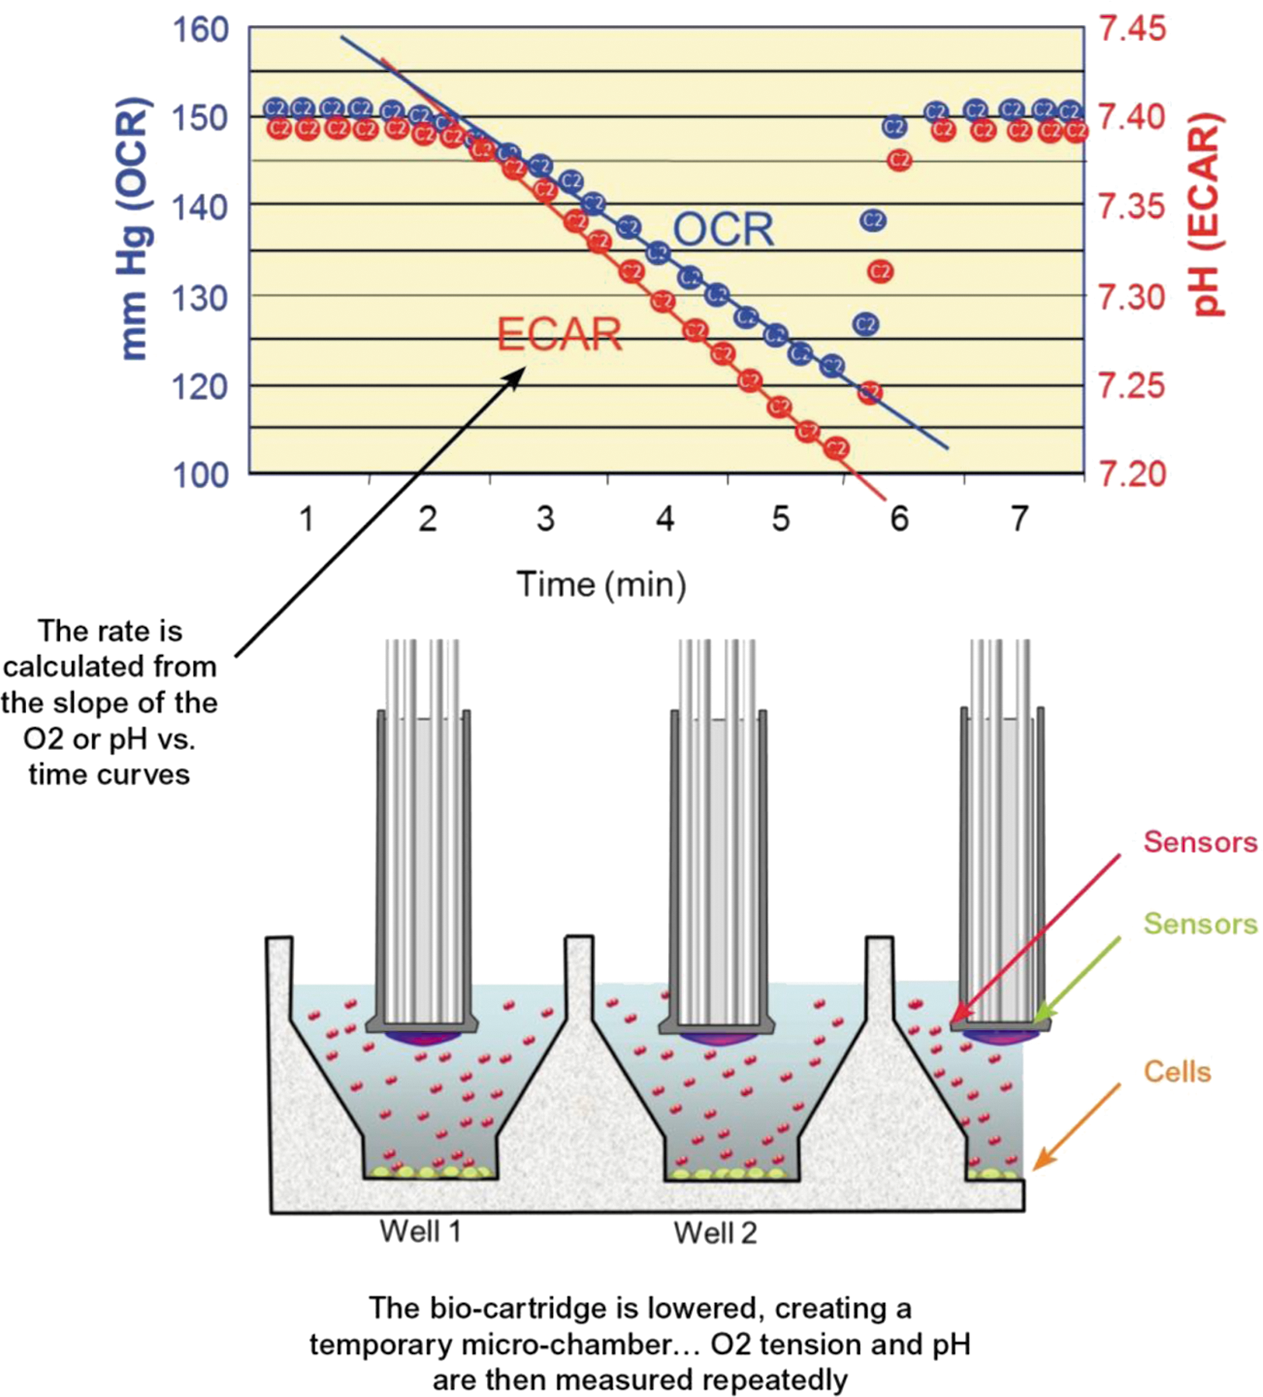
Measuring O2 consumption and the rate of medium acidification in cultured cells. Extracellular flux analysis is performed using XF Analyzers (Seahorse Bioscience, Billerica, MA). Cells are plated in monolayer 24- or 96-well format. Oxygen consumption rate (OCR) and extracellular acidification rate (ECAR) are measured via chemiluminescent sensors applied to disposable cartridge-based probes that are lowered over the cells and a few microliters of media (lower picture), creating a transiently sealed micro-environment. As oxygen is depleted from the media and protons accumulate in the media, the device plots the concentration of O2 and pH in real time (upper picture). The OCR and ECAR are calculated as the slopes of the O2 and pH versus time curves. Modified with permission from a web posting by Seahorse Bioscience; courtesy of Dr. Brian Kim.
To isolate the direct effects of thyroid hormone on cellular energy expenditure and metabolic pathways on a given cell type, in vitro studies should be performed with thyroid hormone treatment of cultured cells.
Commentary
Studies in which cultured cells are exposed to varying concentrations of thyroid hormones in the medium exclude the possibility of second messengers arising from other tissues, and thus may reveal “direct” effects of thyroid hormone on a given cell type. For example, gene expression analysis of hepatocellular carcinoma cells (HepG2) exposed to pharmacologic concentrations of T3 has demonstrated changes in metabolically relevant genes (617). Alternatively, primary hepatocyte cultures from rats or mice may be used for such studies because they represent excellent models of thyroid hormone effects on the liver (618,619). In addition, D3 activity has been shown to be inversely correlated with oxygen consumption in cultured cells, suggesting a direct effect of T3 on energy expenditure (though T3 concentrations were not measured in the intracellular compartment) (63).
Studies utilizing isolated mitochondria can be used to investigate the effects of T3 on mitochondrial biology.
Commentary
The effects of systemic, pharmacologic alteration of thyroid status in rats on hepatic mitochondria have been investigated following their isolation from treated animals; mitochondrial proton leak and the respiratory chain were identified as important sites of T3 control (620,621). While such studies present advantages in that mitochondria can been interrogated apart from other cellular mechanisms, the respiratory phenotype is different from that observed in isolated cells because the physiologic context is lost; for example, the increase in ATP-consuming reactions induced by thyrotoxicosis is not seen given the lack of extramitochondrial ATP-consuming pathways (613).
Acute and chronic responsiveness to cold exposure (4°C–5°C) can be used to study the thermogenic effects of thyroid hormone.
Commentary
Defending core temperature during cold exposure depends on a series of adaptive mechanisms mostly initiated by the SNS. However, because of modifications in the adrenergic signal transduction system, hypothyroid animals respond much less to catecholamines, and the opposite is observed in thyrotoxic animals (622 –624). Thus, hypothyroid rodents exhibit profound hypothermia and succumb in a matter of hours when exposed to cold (4°C–5°C) (625,626). By 2 hours of being moved to cold all rodents exhibit a transient drop in rectal temperature (about 1°C) but recover to baseline values by 4 hours of continued cold exposure (610). In hypothyroid rats and mice, rectal temperature continues to decrease, and to avoid the animals' death the experiment should be interrupted at core temperatures of about 30°C.
BAT thermogenesis is positively regulated by thyroid hormone and can be studied in the interscapular BAT (iBAT) pad during infusion with adrenergic agonists in rats or mice.
Commentary
BAT is an important site of thermogenesis and has been used extensively as a model to study thyroid hormone signaling and its synergism with the SNS. Heat production in the BAT is initiated by SNS stimulation. Thus, the ultimate assessment of BAT thermogenesis should include measurement of BAT temperature in response to adrenergic stimulation. This can be obtained by measuring the thermal response of iBAT to stimulation with an adrenergic agonist (e.g., norepinephrine) in a dose- and time-dependent fashion (627). The setup includes surgical placement of a small thermistor under the iBAT (Fig. 18). Due to the small body size, mice should be kept on a thermal bed set to 30°C at all times (311). The jugular or femoral veins are cannulated and connected to a pump and used as ports for drug infusion. A second thermistor should be inserted in the rectum to monitor core temperature. iBAT thermal response can be observed within minutes of the start of the infusion. The increase in iBAT temperature is usually 1°C–2°C in the first hour and can reach up to 4°C depending on whether the animals were previously fed a high-fat diet or chronically exposed to cold (593). The core temperature should increase less markedly and at later times as an indication that the BAT is warming up the body and not the other way around. This setup allows for direct assessment of the thyroid hormone effects in the BAT, bypassing indirect effects. For example, the hypothyroid iBAT is only minimally responsive to an infusion with norepinephrine (627,629).
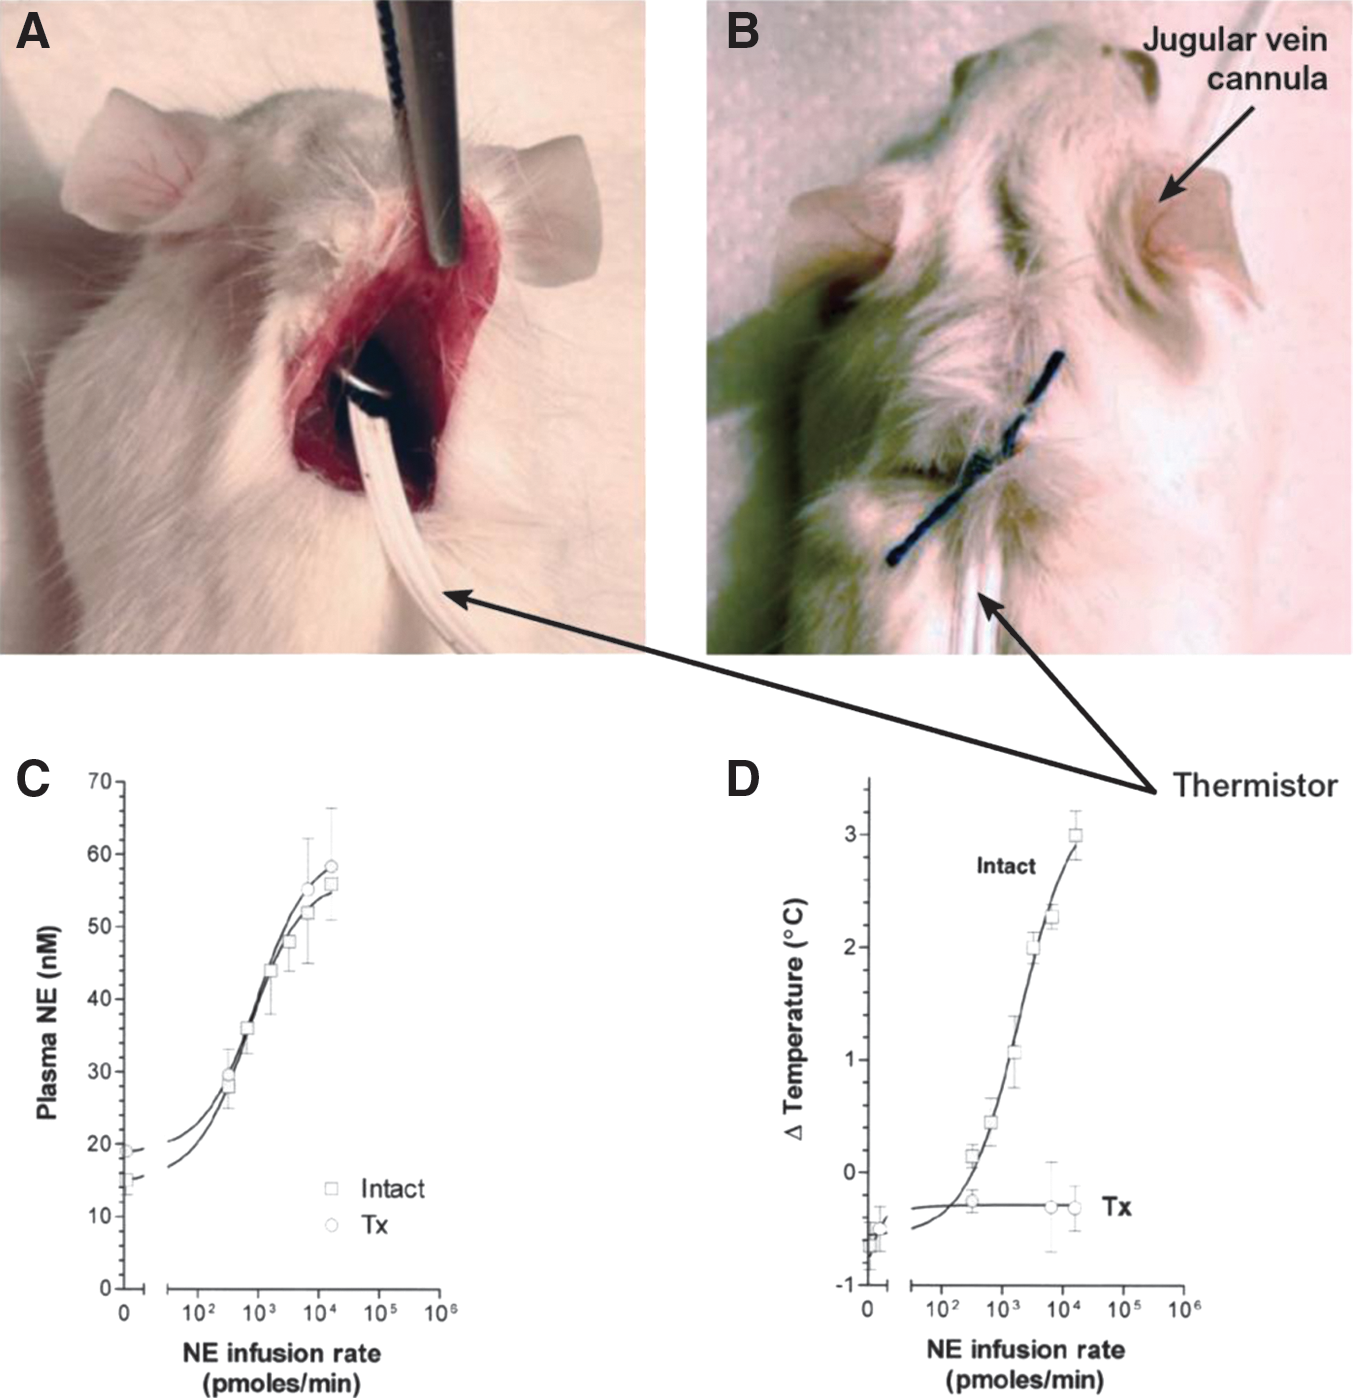
Study of the interscapular brown adipose tissue (iBAT) thermal response to norepinephrine (NE) infusion.
Studies of metabolic effects of thyroid hormone may need to be performed under conditions of thermoneutrality; that is, the ambient temperature at which core temperature is maintained by obligatory thermogenesis (thermogenesis produced by the animals at its basal metabolic rate).
Commentary
Room temperature (21°C) is a significant thermal stress for small rodents, especially mice. Thus, even in animals acclimatized to room temperature, the metabolic effects of thyroid hormone are influenced by a significant synergism with sympathetic activity. Acclimatization at 30°C minimizes the sympathetic activity and thus interference in metabolism. Most sympathetic effects on metabolism are minimized within the first 24–48 hours of acclimatization at 30°C (232). However, it may take up to several weeks for a full sympathetic shut down and investigators may need to determine this experimentally depending on the parameters to be studied (232,608). This is particularly important if the studies involve hypothyroid or thyrotoxic animals given that the activity of the SNS is inversely correlated with thyroid status (630,631); it is increased during hypothyroidism and minimized during thyrotoxicosis (632,633).
The use of diet-induced obesity as a model to study the thermogenic effect of thyroid hormone must take into account additional thyroid hormone-dependent variables; for example, growth hormone secretion and linear growth, appetite, sympathetic activity, and environment temperature.
Commentary
BAT is also a main site of diet-induced thermogenesis in small rodents, which can be triggered by feeding a high-fat diet (634). However, contrary to cold-induced thermogenesis, the role played by thyroid hormone in diet-induced thermogenesis is less clear. Hypothyroid rats or mice are not obese when kept on a chow diet (211,593), but when they are placed on a high-fat diet, the response is different between rats and mice and depends on the environmental temperature (211,593). At room temperature, hypothyroid rats placed on a high-fat diet become just as obese as euthyroid control rats (593), whereas mice are protected against diet-induced obesity (211). Only at thermoneutrality do hypothyroid mice become obese when placed on a high-fat diet (211). For these types of studies, commercially available diets are preferred for consistency and may contain anywhere from 20% to 50% fat. Such diets contain approximately 4.73 kcal/g in which 45% of energy is derived from fat and can be compared to responses in mice fed a standard diet consisting of 3.85 kcal/g in which 10% of energy is derived from fat (608). In general, animals are exposed to different dietary regimens for periods that vary between 30 and 60 days.
Thyroid hormone–dependent metabolic processes in adipose tissue can be investigated in tissue preparations, in freshly isolated white or brown adipocytes, and in white or brown adipocytes differentiated in vitro.
Commentary
The structural or biochemical analysis of fat pads in hypothyroid or thyrotoxic mice or rats constitutes a basic approach to study the effects of thyroid hormone in adipose tissue. Thyroid hormone affects the weight of specific fat pad deposits (e.g., epididymal, inguinal, and interscapular) (635), which should always be expressed as a function of total body weight or femoral length (464). Lipogenesis is stimulated by thyroid hormone in white and brown adipose tissues (237,268,637). At the same time, thyroid hormone also promotes lipolysis via amplification of the adrenergic signaling pathway. The net balance of these antagonistic pathways is a reduction in adiposity, reaching ∼50% in 6 days (600). Although one would intuitively speculate that in hypothyroid animals there should be an increase in adiposity, body fat in hypothyroid rats remains unaffected (593), whereas it is decreased in hypothyroid mice (211).
In the white adipose tissue and BAT thyroid hormone stimulates lipogenesis and lipolysis; only in BAT does T3 stimulate thermogenesis. UCP-1 gene expression (mRNA and protein) is the critical marker for BAT thermogenesis, and it is highly responsive to thyroid hormone (267,269,592,638). Other thyroid hormone–responsive pathways exist in the adipose tissue that can be assessed by measuring the Vmax of key rate limiting enzymes (268,269,640). Examples include the assays of acetyl CoA carboxylase activity by an NADH-coupled assay (237), malonyl CoA decarboxylase activity using a carnitine acetyltransferase-linked assay (641), and the activity of α-GPD in mitochondria preparations using a L-α-glycerophosphate as substrate (464), although investigators should be aware that α-GPD activity may not be thyroid hormone dependent in all mammalian species. Lipogenesis is particularly sensitive to thyroid hormone and can be assessed by measuring de novo fatty acid synthesis in fat pad depots after intraperitoneal or intravenous injection of 3H2O followed by lipid extraction at different time points (600,642).
Isolated white or brown adipocytes prepared from collagenase digestion of specific fat pads can be studied in suspension for a few hours only, given that prolonged incubations are hardly stable (237,622,643). An advantage of this approach is that cellular metabolism can be studied under defined conditions of substrate availability; for example, low/high glucose, fatty acids, and carnitine (644). The results obtained reflect the state of these cells immediately before being harvested. Specific metabolic pathways can be studied by measuring the Vmax of key rate-limiting enzymes under basal conditions and in response to provocative agents such as norepinephrine, forskolin (activating adenylate cyclase), dibutyryl cAMP (a phosphodiesterase-resistant cAMP analogue), terbutaline (β2-selective adrenergic agonist), and dobutamine (β1-selective adrenergic agonist) (464). Examples include measuring the rate of energy expenditure (VO2), lipogenesis, lipolysis, or beta-oxidation, all thyroid hormone-sensitive pathways (237). Lipogenesis can also be studied after a pulse with 3H2O and lipid extraction (237). Lipolysis is also studied by measuring catecholamine-stimulated glycerol release (645 –647).
Isolated adipocytes have limited in vitro responsiveness to thyroid hormone (237,648,649). In contrast, primary cultures of white or brown adipocytes are responsive to thyroid hormone and thus constitute an advantageous alternative system (69,651). Obviously primary cultures of adipocytes do not reflect the metabolic status of an animal, but they have the advantage of generating cells that are stable and thus suitable for prolonged experiments. Mature adipocytes are obtained after white or brown pre-adipocytes are pushed in vitro towards differentiation by exposure to different cocktails and strategies during an 8–12 day period (652). Lines of white or brown pre-adipocytes have also been established and used successfully (653).
Simultaneous induction of lipogenesis and fatty acid oxidation are important effects of thyroid hormone in the liver. Studying expression of key rate-limiting enzymes as well as estimating the rates of both of these processes in animal and cell models can be used to gauge the extent of thyroid hormone signaling in the liver.
Commentary
With the second highest density of TRs in the body, the liver is highly responsive to thyroid hormone (654). Eighteen thyroid hormone–responsive proteins were identified several years ago in the analysis of a translational assay of hepatic mRNA of euthyroid and hypothyroid (655). As with the fat tissue, thyroid hormone stimulates lipogenesis in the liver by activating the expression of key enzymes involved in the synthesis of fatty acids (596), such as malic enzyme (656), glucose-6P-dehydrogenase (both enzymes generating NADPH), fatty acid synthase, and acetyl-CoA carboxylase (657 –659). At the same time, thyroid hormone rapidly accelerates fatty acid oxidation in the liver (660). There is an approximately fivefold reduction in fatty acid oxidation in the isolated hepatocytes of hypothyroid rats. In contrast, the administration of thyroid hormone to euthyroid rats accelerates the rate of fatty acid oxidation (661). This explains in part the reduction in RQ seen during the transition between hypothyroidism and thyrotoxicosis (599). However, the net result of thyroid hormone action in liver triglycerides tends to be neutral given the combined effects on lipolysis, lipogenesis, and fatty acid oxidation (211).
Serum cholesterol levels and liver cholesterol content can be used as biological markers of the metabolic effects of thyroid hormone in the liver.
Commentary
Hypothyroid rats typically have high plasma cholesterol with normal, reduced, or marginally elevated triglycerides (662 –665). The hypercholesterolemia is largely caused by an increase in cholesterol concentration in low-density lipoprotein (LDL) that results from decreased receptor-mediated catabolism of the lipoprotein, primarily in the liver. This is intensified by feeding rodents with a high cholesterol diet. A widely utilized model is feeding a high-fat diet, such as 10% corn oil containing 2% cholesterol (cholesterol diet) or 10% corn oil, 2% cholesterol, and 0.5% cholic acid (cholic acid diet). Hypothyroid rats kept on such diets exhibit marked hypercholesterolemia (665) and hepatic secretion of cholesteryl ester and apoE-rich very low density lipoprotein and LDL (666,667). In contrast, thyrotoxic rats have reduced cholesterol levels in association with reduced LDL turnover. Thyroid hormone administration affects cholesterol metabolism as early as 1 week after treatment (668). This has fostered considerable interest in the potential for thyroid hormone analogs in the treatment of hyperlipidemic disorders (310,315,669,670).
[J.4] Skeletal muscle
Background
The contractile and metabolic properties of skeletal muscles are determined by the properties of the different fiber types that make up the muscle. Groups of fibers innervated by a single motor neuron form a motor unit. The type of innervation and thyroid hormone are the principal modulators of the phenotype of muscle fibers, both during development and in the adult (671). The dynamic interaction between these modulators, together with the developmental origin of the fibers, results in various phenotypes ranging from slow-twitch, oxidative fibers (Type I) to fast-twitch, glycolytic fibers (Type IIB) (671). Skeletal muscle fibers are typically identified by the major type of MHC that is expressed; that is, MHC I, IIa, IIx/d, and IIb (note that MHC I is identical to cardiac MHCβ, but that the other MHC isoforms are not expressed in heart). These isoforms have increasing catalytic turnover rates, with MHC IIb being five times faster than MHC I, and largely determine the rate of contraction. Multiple isoforms also exist for other key proteins that make up the muscle fiber, such as the myosin light chains (MLCs) and the sarcoplasmic/endoplasmic reticulum Ca2+-ATPases SERCA2a (Atp2A2) and SERCA1a (Atp2A1). These SERCA isoforms are responsible for the re-uptake of cytosolic Ca2+, determining the rate of relaxation, and are typically associated with slow (SERCA2a) or fast fibers (SERCA1a) (672). Apart from obvious differences in mitochondrial density between primarily oxidative and glycolytic fibers, marked qualitative differences also exist in composition and function of the mitochondria in these fibers (673).
The fiber composition of different muscles in the body varies considerably, matching their specific tasks. Development of slow characteristics is dependent on innervation by slow motor neurons, whereas development of fast characteristics is much less dependent on neural input (674). Expression of the fast phenotype is, however, co-regulated by thyroid hormone (671,674). For example, the postnatal expression of SERCA1a is completely dependent on thyroid hormone (675,676) and the transition from fetal to adult fast MHC isoforms is delayed in hypothyroidism (677 –679). In the adult animal this responsiveness of fast muscles is greatly diminished, in contrast to slow muscles, which are highly sensitive to changes in the thyroid status. The reason for this is that, generally speaking, thyroid hormone opposes the effect of slow-type innervation; that is, it stimulates expression of fast characteristics, while suppressing slow characteristics, and it increases the overall ATP-generating capacity of the muscle. Fast muscle fibers are energetically less efficient and the increase in speed induced by thyroid hormone is associated with higher energy turnover and concomitant heat production. Because of the total mass of skeletal muscle, these effects of thyroid hormone have an impact on whole body substrate metabolism and thermogenesis (671).
The basis of muscle plasticity is the fairly coordinated regulation of expression of genes governing contractile properties and energy metabolism in response to changes in external cues, such as use or thyroid status. Although the overall effects of thyroid hormone on muscle physiology are relatively straightforward, the effects on gene expression at the level of individual muscle fibers are complex and may be diametrically opposed, depending on the context (676,680). For instance, expression of MHCIIa is strongly stimulated by thyroid hormone in predominantly slow muscles, but equally strongly repressed in fast muscles (674,680). Furthermore, expression of both SERCA1a and SERCA2a is transcriptionally stimulated by T3. However, in thyrotoxic slow muscle the expression of SERCA2a is shut off in the majority of fibers and replaced by SERCA1a (676), but at the same time they are co-expressed at high levels in other fibers. This primarily reflects subtle differences in the various motor units that make up the muscle. Consequently, whole muscle analysis of gene expression may not provide an accurate picture of the effects of thyroid hormone, particularly when working with mixed fiber type muscles. Such studies should therefore include analyses of tissue sections to determine effects in individual fibers.
In larger mammals, all skeletal muscles contain a variable mix of fast and slow fibers. However, in rodents some hind limb muscles are primarily composed of slow type I and intermediate type IIA fibers, such as the slow-twitch soleus (SOL) muscle, or fast type IIB fibers, such as the fast-twitch extensor digitorum longus (EDL) muscle (681,682). These muscle are therefore often used as models to study the effects of thyroid hormone on slow and fast muscle properties.
The effects of thyroid hormone on muscle energy metabolism and contractile properties can be assessed by analysis of perfused hind limb preparations.
Commentary
In the pump-perfused muscle model a single hind limb of the rat is perfused following catheterization of the femoral artery and vein (683). Contraction of a group of muscles or a single muscle is triggered either by stimulating the innervating nerve or by using electrodes placed on the muscle. Contraction parameters are recorded using a force-transducer connected to the Achilles tendon. Control of the rate and composition of the perfusion medium allows manipulation of substrate and oxygen delivery. Analysis of the venous perfusate yields information on the metabolic response during different stimulus protocols and allows calculation of the efficiency of contraction. Blood flow distribution over the various perfused muscles can be determined using radiolabeled microspheres, and histochemical and biochemical analyses can complement the analyses of muscle function (684). Although there are some limitations, notably the absence of normal vasomotor regulation (683), this model best approximates the in vivo situation of active skeletal muscles and has been used to study the functional and metabolic consequences of thyrotoxicosis (685) and hypothyroidism (684,686). This methodology has so far not been described for mouse models.
The interaction between thyroid hormone and neuromuscular activity in regulating muscle properties can be studied in vivo by direct electrical stimulation of muscles.
Commentary
Slow-twitch muscles like the SOL muscle are typically activated by motor neurons generating long trains of low-frequency impulses, whereas fast-twitch muscles are activated intermittently by short bursts of high frequency impulses. The counteracting effects of thyroid hormone and slow-type innervation on muscle gene expression (674) can be studied by imposing a chronic low-frequency stimulation pattern on fast-twitch hind limb muscles. In this model the peroneal nerve of the hind limb is continuously stimulated in vivo at 10 Hz for up to 20 days through implanted electrodes. Gene expression and fiber type composition of fast-twitch tibialis anterior and EDL muscles from the stimulated and contralateral hind limb can then be compared. This method has been used to assess the combined effects of thyroid hormone and slow-type innervation on the expression of myogenic regulatory factors (687) and MHC isoforms (688).
The effects of thyroid hormone on contractile properties can be assessed by ex vivo analysis of intact muscles and isolated muscle fibers.
Commentary
Detailed analysis of the contractile properties of rat and mouse skeletal muscles requires ex vivo analyses. The slow-twitch SOL muscle has typically been used in studies involving thyroid hormone (689 –692) because of the greater responsiveness when compared to the fast-twitch EDL (693). Although contractile properties can be recorded with the muscle left in situ, analysis of isolated muscles in a stimulation chamber allows for greater experimental flexibility (690). The EDL and SOL muscles are relatively thin and superfusion provides sufficient delivery of oxygen and substrates, although reduced temperatures (21°C–30°C) may be required to prevent hypoxia during prolonged stimulation. Contralateral muscles are kept in oxygenated superfusion medium to serve as controls in subsequent biochemical analyses. Typical parameters analyzed include twitch and tetanic contractile response, force-frequency relationships, post-rest potentiation of force development, and fatigue-recovery responses. Dedicated equipment and software is now available for these kinds of analyses (694).
Although technically challenging, single muscle fibers can be isolated from skeletal muscles such as the SOL and EDL muscles (692,695) and the diaphragm (696). In the latter, thyroid hormone also induces a shift in fiber phenotype type from slow to fast (697) and ex vivo analysis of the contractile properties of this muscle requires single fibers or bundles of fibers (698). Isolated fibers are chemically skinned and mounted between a force transducer and a motor, allowing measurement of isometric and isotonic contractions. Contraction or relaxation is achieved by immersion of the fibers in solutions containing high or low concentrations of calcium, respectively. Subsequent single-fiber analysis of contractile protein composition allows for a detailed assessment of the effects of thyroid hormone on fiber phenotype and contractile properties (692).
The skeletal muscle tissue response to thyroid hormone can be assessed by analysis of gene expression and enzyme assays.
Commentary
Analysis of muscle gene expression is performed by RT-qPCR (92,699,700) (see Section I.2,
The sarcoplasmic reticulum (SR) is responsible for up to 50% of the energy consumption in active muscle. The effect of thyroid hormone on this ATPase activity can be assessed spectrophotometrically in homogenates of whole muscles or single fibers (701,705). SR membrane fragments in muscle homogenates reseal into vesicles that retain the ability to take up and store Ca2+. Using assay conditions that selectively stimulate this capacity, it is possible to determine the ATPase-coupled Ca2+-uptake rate and maximal Ca2+-storage capacity (675,704,705). The latter provides an estimate of the degree of proliferation of the SR membrane network, which is in part dependent on the thyroid status. The Ca2+-ATPase and Ca2+-uptake assays determine the total SERCA activities, but do not allow discrimination between the SERCA1a and SERCA2a isoforms.
Standard assays are used to determine activities of enzymes involved in aerobic and anaerobic energy metabolism such as cytochrome c oxidase, citrate synthase, succinate dehydrogenase, lactate dehydrogenase, and creatine kinase (675,703). Mitochondria can be isolated by differential centrifugation for measurements of respiratory rate, membrane potential and other enzymatic assays (706,707).
Assessment of the effects of thyroid hormone on the fiber type composition of skeletal muscle requires histochemical analysis of tissue sections.
Commentary
Skeletal muscle fiber types are primarily distinguished on the basis of the MHC isoform expressed; i.e., the slow MHC I and fast MHC IIa, IIx/d, or IIb isoforms. Antibodies discriminating between these isoforms have been described (708) and although some caution is warranted when using currently available commercial antibodies (709), multicolor immunofluorescence analysis has been described for the simultaneous assessment of expression of all MHC isoforms in rat and mouse skeletal muscle using these antibodies (710). More typically, a histochemical method for myofibrillar ATPase expression is widely used which distinguishes between Type I fibers (MHC I), Type IIB fibers (MHC IIb), and intermediate fibers (MHC IIa, MHC IIx/d) (684,692,700,702,711). Muscles are clamped at their approximate in situ length and frozen in liquid N2-cooled freon or isopentane. Series of cryosections are then cut for various histochemical analyses. It should be noted that not all fibers necessarily run the length of the muscle. This is for example the case in SOL muscle, which should preferably be sectioned at the motor point to include all fibers (682,702).
Additional analyses of fiber-specific gene expression concern the expression and activity of the SR Ca2+-ATPase enzymes. Serial cryosections can be used to correlate MHC-based fiber typing with immunohistochemistry of SERCA1a and SERCA2a (676,682), as well as with isoform-specific mRNAs by in situ hybridization (676). Fiber-specific differences in total SR Ca2+-ATPase activity can also be determined histochemically (676). The effects of thyroid-hormone treatment on fiber characteristics are dynamic and in some cases transient over a period of several days (676). This should be taken into account when studying animals treated for less than 14 days.
Primary cultures of skeletal muscle cells as well as various cell lines can be used to study thyroid hormone–regulated gene expression and its interaction with contractile activity.
Commentary
Primary cultures of muscle myoblasts can be obtained from neonatal rat or mouse skeletal muscles (92,712 –715). Depending on the composition of the culture medium, myoblasts can be maintained in a proliferative state, or they can be induced to fuse and form spontaneously contracting myotubes. The interaction of thyroid hormones and contractile activity on myotube properties can be studied by inhibiting contractions (715) or by direct electrical stimulation of the myotubes in culture (712). Although primary cultures provide a versatile model to study different aspects of muscle gene regulation, it should be noted that myotubes do not fully develop adult phenotypic characteristics.
The mouse C2C12 (704,716 –718) and the rat L6 (704,717, 719 –721) myoblast cell lines are used as alternatives for primary cultures in studies of thyroid-hormone action. Standard techniques for cell transfection can be used to analyze regulation of gene-expression (see Section I.4). Subclones of the L6 cell line with slightly different properties have been isolated by various groups (704,721). Notably, the L6AM subclone (721) shows increased responsiveness to thyroid hormone in comparison to the original L6 cell line. Similar to primary cultures, confluent myoblast cultures of both cell lines can be induced to form myotubes, but only C2C12 myotubes can be induced to contract by electrical stimulation. Methods have been developed to stimulate C2C12 myotubes chronically or intermittently for up to 4 days using stimulus electrodes integrated in standard culture dishes (718,723). This technique allows a more detailed analysis of the interaction between thyroid hormone and contractile activity on muscle gene expression (718).
[J.5] Skeleton
Background
Bone strength in adults is determined by the acquisition of bone mass and mineral during growth and the subsequent rate of bone loss throughout adulthood. Normal euthyroid status is essential for skeletal development, growth, and mineralization and is a key determinant of peak bone mass. T3 also regulates bone remodeling in adults, and thyroid status is an important determinant of the rate of bone loss (724). Hypothyroidism results in a state of reduced bone turnover, which if prolonged may result in to accumulation of bone mass and mineral. By contrast, thyrotoxicosis accelerates bone turnover and loss resulting in osteoporosis.
Thyroid hormones effects on postnatal linear growth and bone maturation are best determined ex vivo by using samples from animals harvested at defined ages.
Commentary
Mice should be genotyped and identified at young postnatal ages while preserving their tail so that linear growth velocity can be determined by weekly measurement of tail length between postnatal days P7 to P70. Maximum growth velocity occurs between P14 and P42 in mice, and comparison of growth curves provides an accurate indication of developmental delay. Neonatal P1 mice and limbs from animals aged between P21 and P42 should be stained with alizarin red (bone) and alcian blue (cartilage) to investigate intrauterine skeletal development and the progress of postnatal bone formation. Measurement of skull dimensions, fontanelles, and suture areas provide an assessment of intramembranous ossification; measures of bone length and growth plate histomorphometry are accurate and sensitive indicators of the progression of endochondral ossification (725 –731).
The structural and mineralization response of adult bone to alterations in thyroid status or disruption of thyroid hormone action can be assessed using complementary imaging techniques at different levels of resolution.
Commentary
Analysis of the skeleton in mice requires collection of bone samples ex vivo. It is not possible to determine structural parameters accurately in vivo because imaging modalities do not have sufficient resolution to discriminate features of trabecular bone accurately and much more information can be obtained from ex vivo samples using complementary approaches and methods (Fig. 19). Bone mineral content, bone length, and cortical bone measurements are determined in long bones and vertebrae from adults aged 12 weeks onwards by Faxitron digital point projection x-ray microradiography (725). Bone microarchitecture and volumetric parameters require sophisticated imaging and can be obtained by high resolution micro-CT (to a maximum nominal resolution of 0.5–2 μm). Cortical and trabecular bone volumes as proportions of tissue volume, trabecular thickness, trabecular separation, and trabecular number can be determined. Such parameters in the mouse are at the limits of spatial resolution by micro-CT. Detailed analysis of bone microarchitecture and micro-mineralization density can be analyzed using specialist back scattered electron-scanning electron microscopy (BSE-SEM) techniques (725 –727,729 –731). The effects of altered thyroid status on linear growth and bone structural parameters are significant and readily determined using these methods, although specialist equipment and data analysis methods are required.
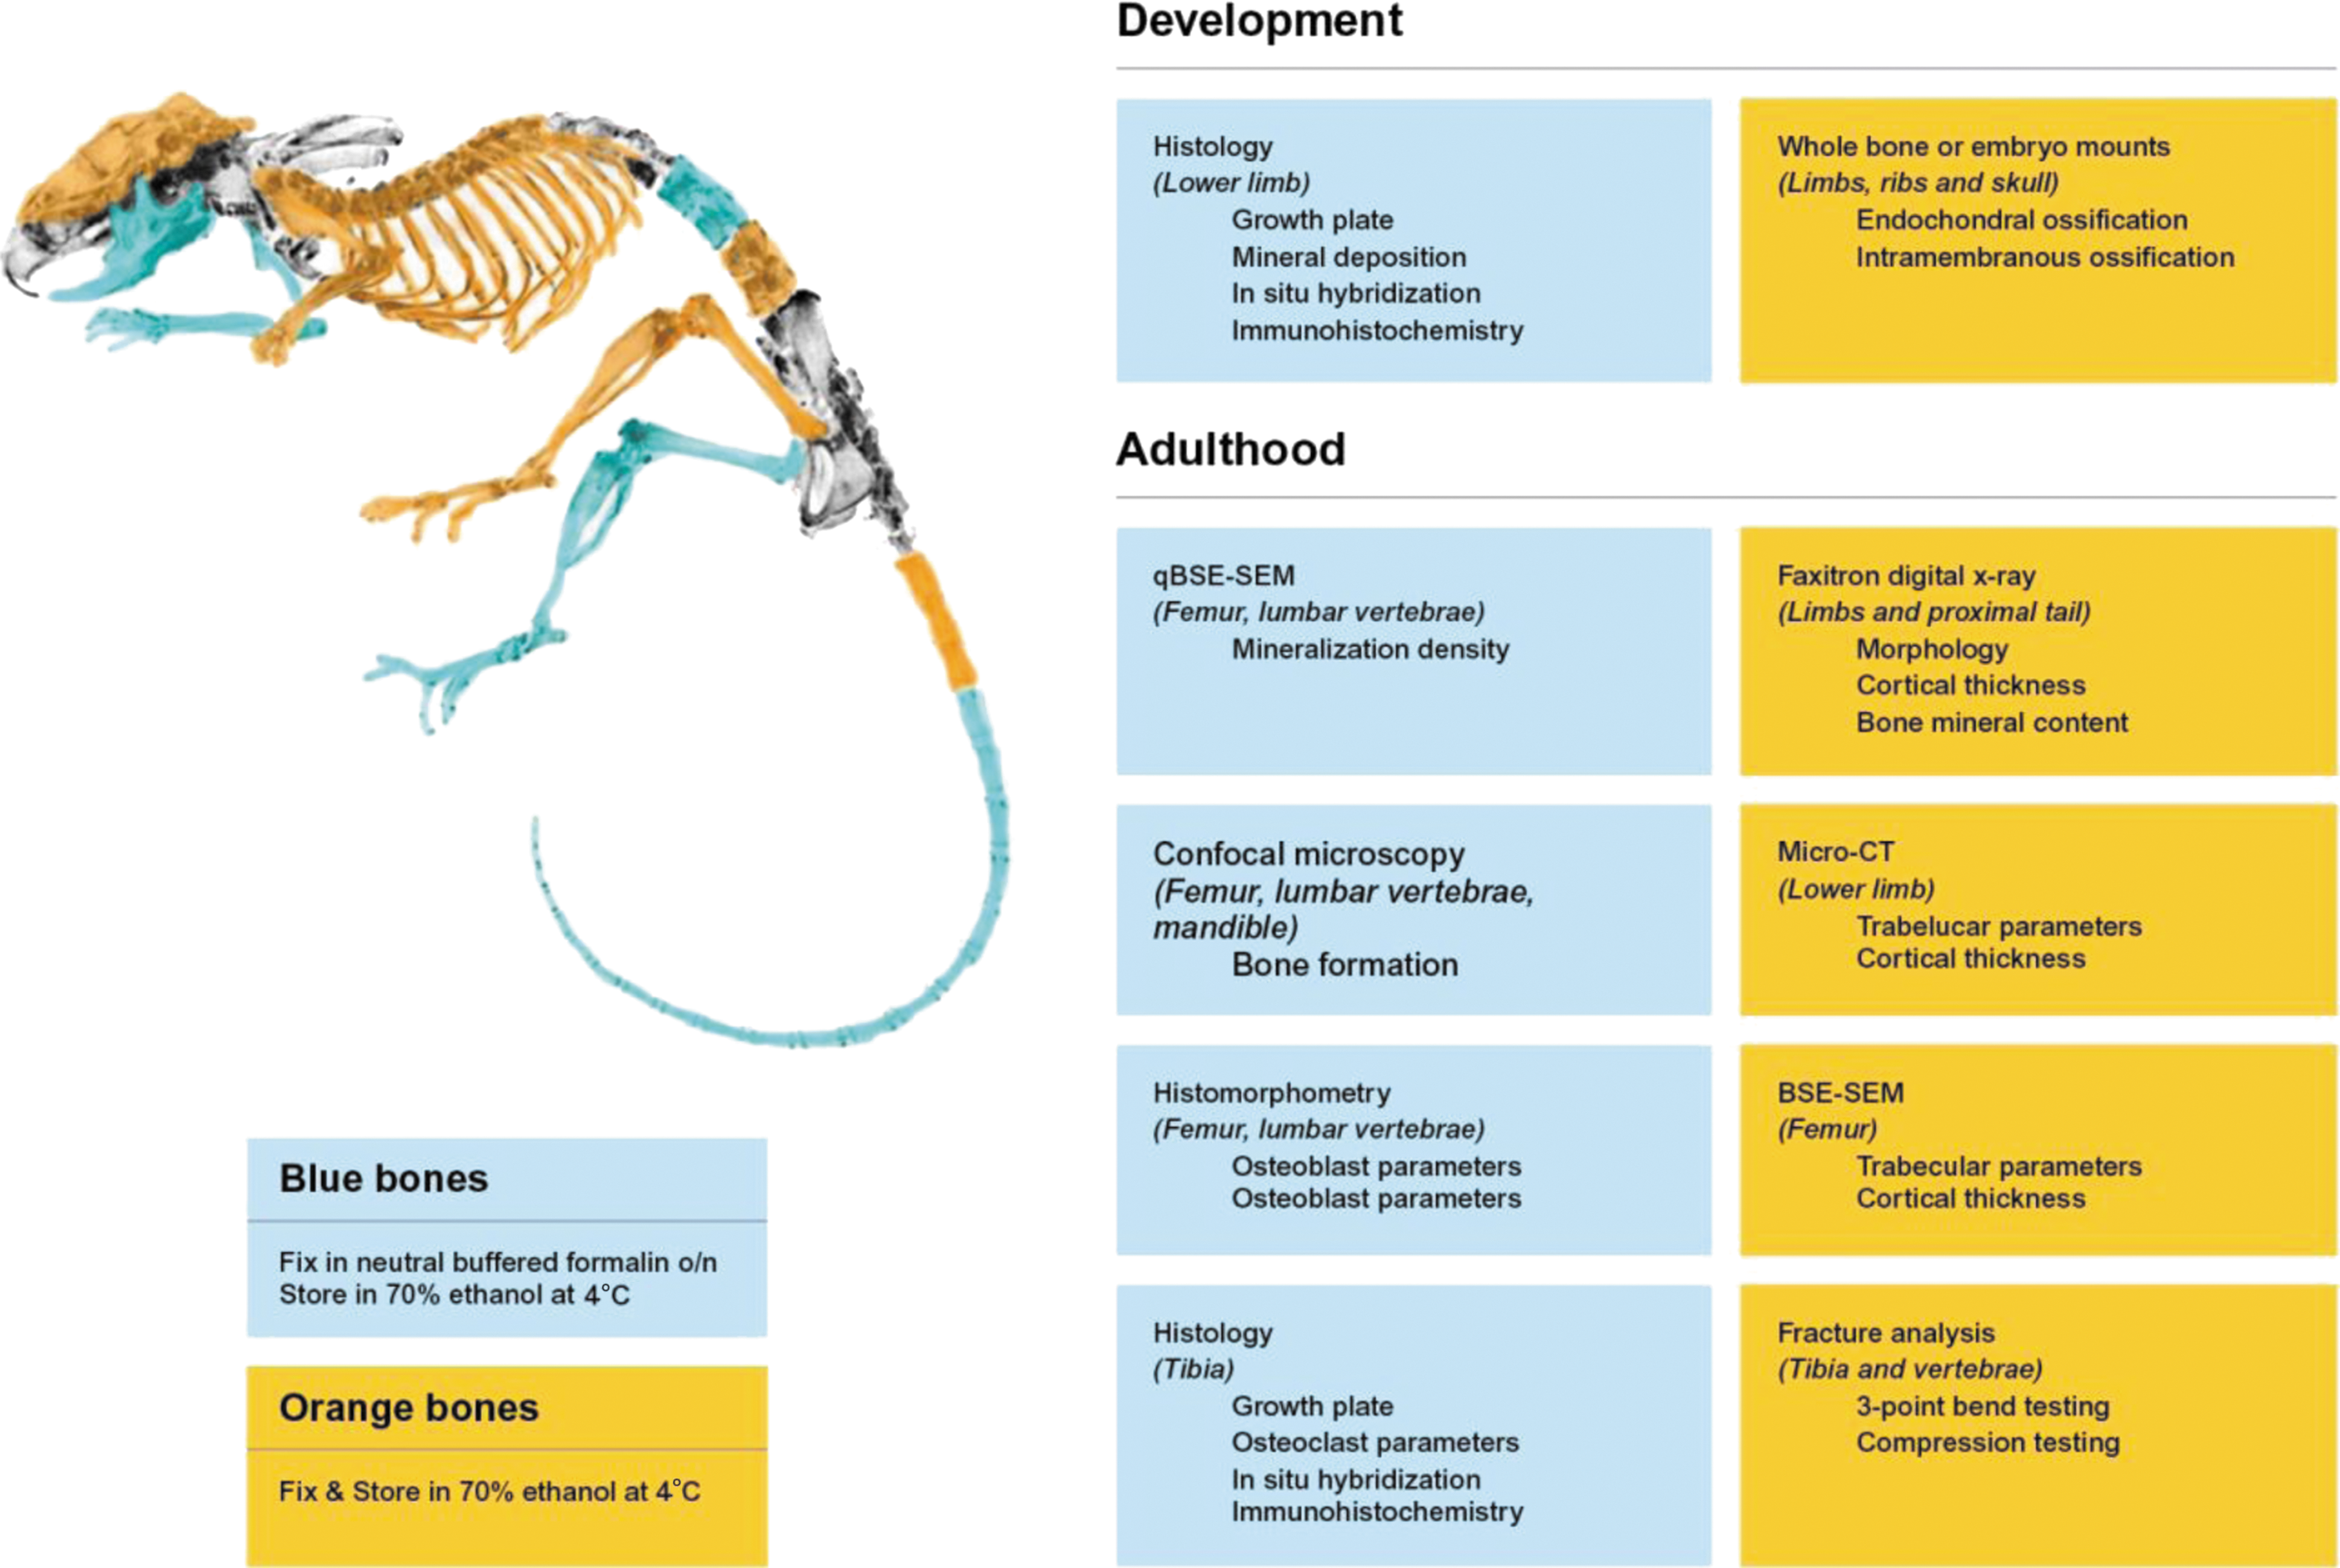
Scheme for collection of bone samples, tissue fixation, and methods of analysis. The usage of this chart can maximize phenotype information obtained from juvenile and adult mice. qBSE-SEM, quantitative back-scattered electron-scanning electron microscopy. Courtesy of Dr. Graham Williams.
The thyroid hormone–induced changes in bone structure and mineralization are reflected by functional abnormalities, which can be investigated by determination of biomechanical properties under loading.
Commentary
The strength of bone is determined using appropriate mechanical loading equipment (Fig. 20). Destructive three-point bend tests are performed on long bones from adult mice to determine cortical bone biomechanical variables from load displacement curves, including stiffness, maximum load, fracture load, and energies dissipated at maximum load and fracture. Trabecular bone compression strength can be determined similarly in vertebrae. Cross-sectional area measurements are obtained from Faxitron and micro-CT data and used with biomechanical data to calculate ultimate stress, yield stress, and modulus parameters (725). More detailed and specialist studies of material properties of bone at various resolution scales can be obtained using highly sophisticated techniques and equipment in collaboration with engineering and other specialist laboratories (732 –734). Such measurements provide accurate determination of bone strength together with assessment of its material properties (brittleness or ductility) that are affected significantly, for example, by loss of bone mass and mineral content in thyrotoxicosis.
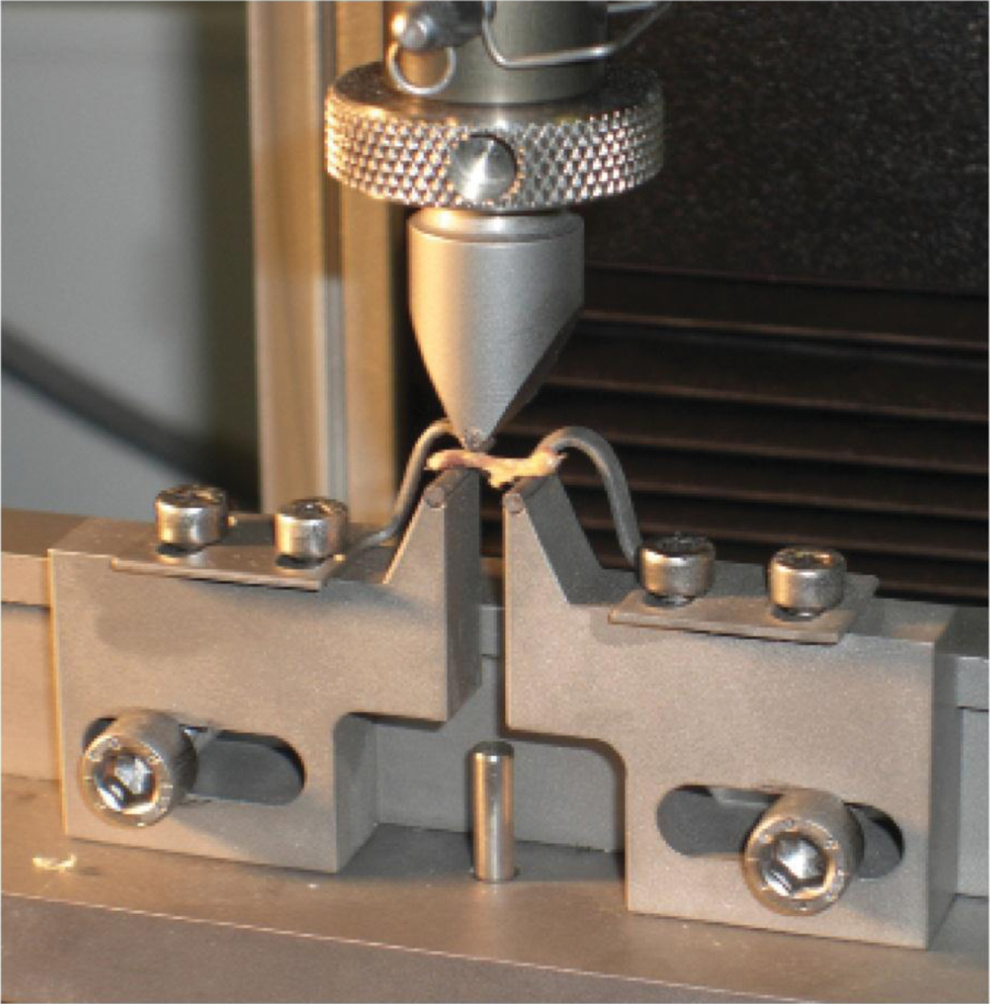
Instron5534 load frame apparatus for destructive three-point bend testing of bone strength. Custom mounts incorporate rounded supports and loading pins that minimize cutting and shear forces, thus enabling biomechanical parameters of bone strength to be determined accurately. Courtesy of Dr. Graham Williams.
Metabolic responses and changes in bone resorption and formation in response to altered thyroid status can be assessed indirectly by measurement of serum parameters.
Commentary
Biochemical analysis of mineral metabolism and bone turnover should include measurement of serum Ca2+, Mg2+, PO4 3−, and alkaline phosphatase, which can be determined using standard auto-analyzers. In addition to determination of thyroid status, other hormones affecting bone can be assayed using commercial assays, including corticosterone, vitamin D, parathyroid hormone, and insulin-like growth factor-1. In addition, sex hormone and gonadotropin status can be determined if required (735). Indirect analysis of bone turnover can be obtained by measurement of bone resorption and formation markers using commercially available kits (725). C-terminal cross-linked telopeptide of type I collagen and tartrate-resistant acid phosphatase (TRAcP) 5b are measured by ELISA and solid-phase immuno-fixed enzyme activity assay as indicators of bone resorption. N-terminal propeptide of type 1 procollagen and osteocalcin are also measured by ELISA and IRMA as markers of bone formation. Assessment of bone turnover markers should ideally be performed ideally in the morning on fasted animals to mitigate the confounding diurnal and dietary effects on bone turnover. Older rodents have low levels of bone turnover in the basal state and determination cannot be performed reliably after about 12–16 weeks of age as levels of markers will be close to the limits of detection. It is important to note there are sex- and strain-specific differences in bone mass and turnover and care in experimental design should be taken to ensure littermates are compared where possible. Nevertheless, measurement of bone turnover using surrogate bone markers is an established method in the field that provides additional information to support imaging and histomorphometry data.
The effects of thyroid hormone on bone turnover might involve effects on osteoclastic bone resorption, osteoblastic bone formation, or a combination of both. Biochemical analysis of markers of bone turnover in response to thyroid hormone provides indirect crude assessment of these parameters, but this must also be investigated directly in the bone tissue.
Commentary
Hypothyroidism results in reduced bone turnover affecting both bone formation and resorption. Thyrotoxicosis accelerates both parameters with a greater effect on bone resorption resulting in bone loss. To investigate and quantify the cellular basis for altered bone turnover, dynamic measurements by histomorphometry are required. Mice are given two intraperitoneal injections of the fluorochrome calcein (15 mg/kg in saline with 2% sodium bicarbonate) approximately 7 and 4 days prior to sacrifice, although the precise interval can be varied and should be determined empirically depending on the locally available analysis techniques. Dynamic bone histomorphometry parameters should be determined according to the standard system of nomenclature (736). Bone resorption is investigated in bone sections stained for TRAcP, and osteoclast numbers and surface determined by light microscopy and normalized to total bone surface. Cortical and trabecular bone resorption surfaces in vivo can also be determined using specialized BSE-SEM techniques (725,727,729), although such methods are not routinely or widely available. Bone formation should be quantified in dual calcein-labeled bone by standard histomorphometry and indices of bone formation determined using ImageJ (
The mechanisms of thyroid hormone action in cartilage can be studied in chondrocyte cultures prepared from limbs or rib cages of neonatal mice.
Commentary
Bone is a complex organ and the cellular responses to thyroid hormone can be determined by in vivo and tissue studies. A deeper understanding of the molecular mechanisms of T3 action and the signaling pathways involved in mediating T3 responses in bone cell lineages can be obtained by studying thyroid hormone effects in primary cell cultures of skeletal cells. Primary chondrocytes are prepared from neonatal mice (741,742) and proliferation, differentiation (collagen X mRNA expression, alkaline phosphatase activity, alcian blue staining), apoptosis, and gene expression responses (Ihh, PTHrP, Sox9 by RT-qPCR) to T3 treatment determined after 7, 14, and 28 days. It should be noted that chondrocytes are difficult to study in vitro because they tend to de-differentiate and acquire a fibroblast-like phenotype in monolayer culture after a few days. This does not pose a problem for gene expression studies if investigation of acute responses to T3 treatment is limited to analysis of freshly cultured cells within the first 48 hours. However, in studies to investigate effects of thyroid hormone on chondrogenesis and cell proliferation over longer periods of time as already indicated, 3D cultures should be performed in agarose suspension to prevent the tendency for de-differentiation of chondrocytes when cultured for prolonged periods in monolayers (653).
Osteoblast cultures can be employed to investigate the mechanisms of thyroid hormone action on cell differentiation, as well as on functional bone mineralization assays in vitro. Such cultures are usually prepared by collagenase digestion of calvariae obtained from neonatal mice using standard techniques.
Commentary
Osteoblasts express TRs and, like chondrocytes, respond directly to the actions of T3. Primary calvarial osteoblasts are prepared from P4 pups and proliferation, differentiation (osteocalcin and osterix mRNA expression, alkaline phosphatase activity, alizarin red and von Kossa mineralization assays), and gene expression (Runx-2, OPG, receptor activator of nuclear factor kappa B-ligand [RANKL] by RT-qPCR) responses are usually determined after 7, 14, and 28 days (738 –740,743).
The effects of thyroid hormone on osteoclastogenesis and function can be determined in osteoclast cultures prepared from 6-week-old mouse long bones. The protocols used include treating extracted bone marrow cells with monocyte colony stimulating factor and RANKL to induce osteoclast formation in vitro.
Commentary
Bone marrow is isolated from long bones of P42 mice and primary cultures treated with monocyte colony stimulating factor and RANKL to induce osteoclast formation in vitro (725,729,740). Osteoclast numbers (following TRAP staining) and cell differentiation (TRAP activity, calcitonin receptor, cathepsin K mRNA expression) are determined after days 0, 3, 6, and 9 days. Osteoclast activity can also be determined by dentine resorption assay using standard techniques employed previously in studies of T3 action (725,729). The mechanism of thyroid hormone action on osteoclast function is currently unclear, and it is uncertain whether the major response to increase osteoclastic bone resorption represents a direct effect of T3 in osteoclasts or whether the response is a secondary effect mediated via the actions of T3 in osteoblasts, bone marrow stromal cells, or other factors.
Footnotes
ACKNOWLEDGMENTS
The task force wishes to thank Ms. Bobbi Smith, Executive Director, ATA, and Ms. Adonia Coates and Ms. Sharleene Cano, ATA staff members, for their assistance to the task force, their expert help, and their support; Mr. Cezar Bianchi for valuable assistance with illustrations; and Ms. Yanette Pericich and Cristina Andrade (Division of Endocrinology, University of Miami Miller School of Medicine) for their assistance preparing the text. The task force also wishes to thank the following colleagues who provided insightful comments and/or support materials: Sherine Abdalla, MD (Division of Endocrinology, University of Miami Miller School of Medicine) Anita Boelen, PhD (Department of Endocrinology, Academic Medical Center, Amsterdam, The Netherlands) Denise P. Carvalho, MD, PhD (Carlos Chagas Filho Institute of Biophysics, Federal University of Rio de Janeiro, Rio de Janeiro, Brazil) Orsolya Dohán, MD, PhD (Department of Clinical Studies, Faculty of Health Science; First Department of Internal Medicine, Faculty of Medicicne; Semmelweis Medical School, Budapest, Hungary) James Fagin, MD (Division of Endocrinology, Memorial Sloan-Kettering Cancer Center, New York, NY) Tatiana Fonseca, PhD (Division of Endocrinology, University of Miami Miller School of Medicine) Ronald Koenig, MD, PhD (Division of Metabolism, Endocrinology, and Diabetes, University of Michigan, Ann Arbor, MI) Vania Nose, MD, PhD (Department of Pathology, Massachusetts General Hospital, Boston, MA) Miriam O. Ribeiro, PhD (Department of Biological Sciences and Health Science Center, MacKenzie Presbiterian University, São Paulo, Brazil) Thomas Scanlan, PhD (Department of Physiology and Pharmacology, School of Medicine, Oregon Health and Science University, Portland, OR) Steven J. Soldin, PhD (Department of Laboratory Medicine, National Institutes of Medicine, Washington, DC) Cintia Ueta, PhD (Department of Anatomy, University of São Paulo, São Paulo, Brazil)
This work was supported in part by the intramural research program of NIDDK at the National Institutes of Health (to D.F.), NIDDK grants 2R01-DK58538-08, 1R01-DK065055-02, R01-DK77148 (to A.C.B.), R37DK015070 (to X.H.L. and S.R.) and R21 HD 072526-02 (to V.A.G.), NICHD grant R03 HD061901 (to P.A.K.), SAF2012-32491 from MINECO and S2010/BMD-2423 from CAM (to M.J.O.), U.S.–Israel Binational Science Foundation (to G.A.), National Science Foundation of Hungary (OTKA K81226) and the European Community's Seventh Framework Programme (FP7/2007–2013) under grant agreement no. 259772 (to B.G.), and the ZonMw Clinical Fellowship Grant (90700412) and a ZonMW TOP Grant (91212044) (to R.P.P.).
DISCLOSURE STATEMENT
Disclosure Information for 2 years before December 2012 and the known future as of November 2013: all authors declare no significant financial conflicts of interest to disclose.