
Abstract
Background:
Over the last decade, annual incidence rates for thyroid cancer have been among the highest of all cancers in the Western world. However, the genomic mechanisms impacting thyroid carcinogenesis remain elusive.
Methods:
We employed an established mouse model of follicular thyroid cancer (FTC) with a homozygous proline to valine mutation (ThrbPV/PV ) in the thyroid receptor β1 (TRβ1) and applied quantitative three-dimensional (3D) telomere analysis to determine 3D telomeric profiles in ThrbPV /PV , ThrbPV/ +, and Thrb+/+ mouse thyrocytes before and after histological presentation of FTC.
Results:
Using quantitative fluorescent in situ hybridization (Q-FISH) and TeloView™ image analysis, we found altered telomeric signatures specifically in mutant mouse thyrocytes. As early as 1 month of age, ThrbPV/PV mouse thyrocytes showed more telomeres than normal and heterozygous age-matched counterparts. Importantly, at the very early age of 1 month, 3D telomeric profiles of ThrbPV/PV thyrocyte nuclei reveal genetic heterogeneity with several nuclei populations exhibiting different telomere numbers, suggestive of various degrees of aneuploidy within the same animal. This was detected exclusively in ThrbPV/PV mice well before the presentation of histological signs of thyroid carcinoma.
Conclusions:
We identified quantitative 3D telomere analysis as a novel tool for early detection and monitoring of thyrocyte chromosomal (in)stability. This technique has the potential to identify human patients at risk for developing thyroid carcinoma.
Introduction
T
Thyroid hormone receptor β1 (TRβ1) is a nuclear thyroid hormone receptor and is regulated by triiodothyronine (T3). Mutations of TRβ1 have been found in human thyroid cancer (12). In human FTC and the TRβ1PV mutant mouse model (ThrbPV/PV ) of FTC, RAS mutations, PAX8-PPARγ rearrangements, and mutations resulting in the activation of the AKT pathway are important contributors to the pathogenesis of FTC (11,13,14). Similar to human FTC, we have shown that homozygous ThrbPV/PV knock-in mice harbor a dominant negative TRβ1 mutant PV and spontaneously develop FTC and distant metastasis (15). These mice have a human-like thyroid hormone resistance syndrome resulting in the complete loss of T3-binding and transcriptional activation (16). TRβ1PV/PV homozygous mice have enlarged thyroid glands, are resistant to thyroid hormones, and display high serum thyrotropin (TSH; 400–500-fold increase over normal) and thyroid hormone (9–15-fold increase over normal) levels. ThrbPV/PV homozygotes develop highly invasive and metastasizing FTC in more than 80% of animals at 5–6 months of age, whereas no apparent abnormalities are observed in the wild-type Thrb+/+ and heterozygous ThrbPV/+ mice.
Telomeres are repetitive nucleotide sequences (TTAGGGn) at the ends of the chromosomes that protect chromosomes from fusions and illegitimate recombination events, as long as they are capped by a protein complex termed “shelterin” (17). The nuclear organization of telomeres in interphase nuclei is directly linked to chromosomal instability (CIN). We showed that deregulation of c-Myc causes telomere remodelling and promotes CIN and carcinogenesis (18,19). A shelterin complex composed of telomeric repeat binding factor (TRF) 1 and 2, and protection of telomeres (POT) 1 proteins directly interact with the TTAGGG repeat of the telomere sequence, and these proteins are interconnected by TPP1, TIN2, and Rap1 (17). Events leading to alterations in this shelterin complex can result in telomeres with impaired protective functions, which cause chromosomal fusions, continuous breakage–fusion–bridge (BFB) cycles, chromosomal imbalances, and gene amplifications. These events will ultimately lead to the generation of complex nonreciprocal translocations, a hallmark of solid tumours and genomic instability in general (20 –23). We previously showed significant differences in telomeric profiles (i.e., in telomere signal intensity and number, the presence/absence of telomeric aggregates, and in the number of telomeres per nuclear volumes) in therapy-sensitive and therapy-resistant Hodgkin's lymphoma patients (24). These results demonstrated the prognostic value of three-dimensional (3D) telomere diagnostic imaging for glioblastoma patients (25), and suggested a 3D telomere dysfunction-based progression model leading to the progression of myelodysplastic syndromes to acute myeloid leukemias (26).
In the present study, we applied quantitative 3D telomere imaging techniques to monitor differences in telomere profiles during FTC in thyrocytes of homozygous ThrbPV/PV mice and compared these data to thyroid tissues from heterozygous ThrbPV/+ and wild type Thrb+/+ mice.
Materials and Methods
Animal work
Animal study protocols were approved by the National Cancer Institute Animal Care and Use Committee. The generation of the ThrbPV/PV mice was described previously (27). Mice harboring the targeted PV mutation are designated as ThrbPV/PV and ThrbPV/+ for homozygous and heterozygous mutant mice respectively. Thyroid tissue sections of Thrb+/+ , ThrbPV/+ , and ThrbPV/PV animals were investigated for this study. The pathological progression of FTC in ThrbPV/PV mice was described previously (15). At the age of 12.9 months, only 50% of ThrbPV/PV mice were still alive, and 20% of ThrbPV/PV mice survived to the age of 14 months. Histopathologic findings were consistent with FTC progression. Information on animal numbers, sex, and age for each genotype are summarized in Table 1.
Quantitative fluorescent in situ hybridization
Q-FISH analysis was performed on 5 μm thick sections of mouse thyroid tissues. Tissue sections were deparaffinized in xylene for 15 min and placed for 1 min in 100% ethanol before a 20 min incubation at 80°C in 1 M sodium thiocyanate to remove RNA and tissue impurities causing autofluorescence before fixation (28). Tissues were postfixed with 10% formaldehyde in 1× phosphate buffer solution (PBS) for 20 min and washed twice for 5 min with PBS. Slides were soaked in 0.5% Triton X-100 for 10 min and transferred for 1 h to 20% glycerol. Thereafter, slides were briefly submerged in liquid nitrogen and allowed to thaw prior to submerging the slides in 20% glycerol. This process was repeated four times and then slides were washed in PBS three times for 5 min. The slides were incubated in 0.1 M HCl with pepsin at a final concentration of 50 μg/mL for 10 min at 37°C. Slides were washed in PBS and stored in 70% deionized formamide/2× standard saline citrate (SSC; pH 7.0), 4°C for at least 1 h. Peptide nucleic acid (PNA) telomere probe (Dako, Mississauga, Canada) was applied to the slides, denatured at 80°C for 3 min, and hybridized at 37°C for 2 h in a Hybrite™ hybridization chamber (Abbott, IL). Once the hybridization was completed, slides were washed twice in 70% formamide/10 mM Tris-HCl (pH 7.4) for 15 min each before being washed for 1 min in 1× PBS, then in 0.1× SSC for 5 min and twice for 5 min each in 2× SSC/0.05% Tween-20. Finally, 0.1 μg/mL DAPI was added to the slides before they were submerged in double-distilled H2O and dehydrated in a 70%, 90%, 100% ethanol series for 2 min each and coverslipped with Vectashield (Vector Labs Canada, Burlington, Canada).
Image analysis
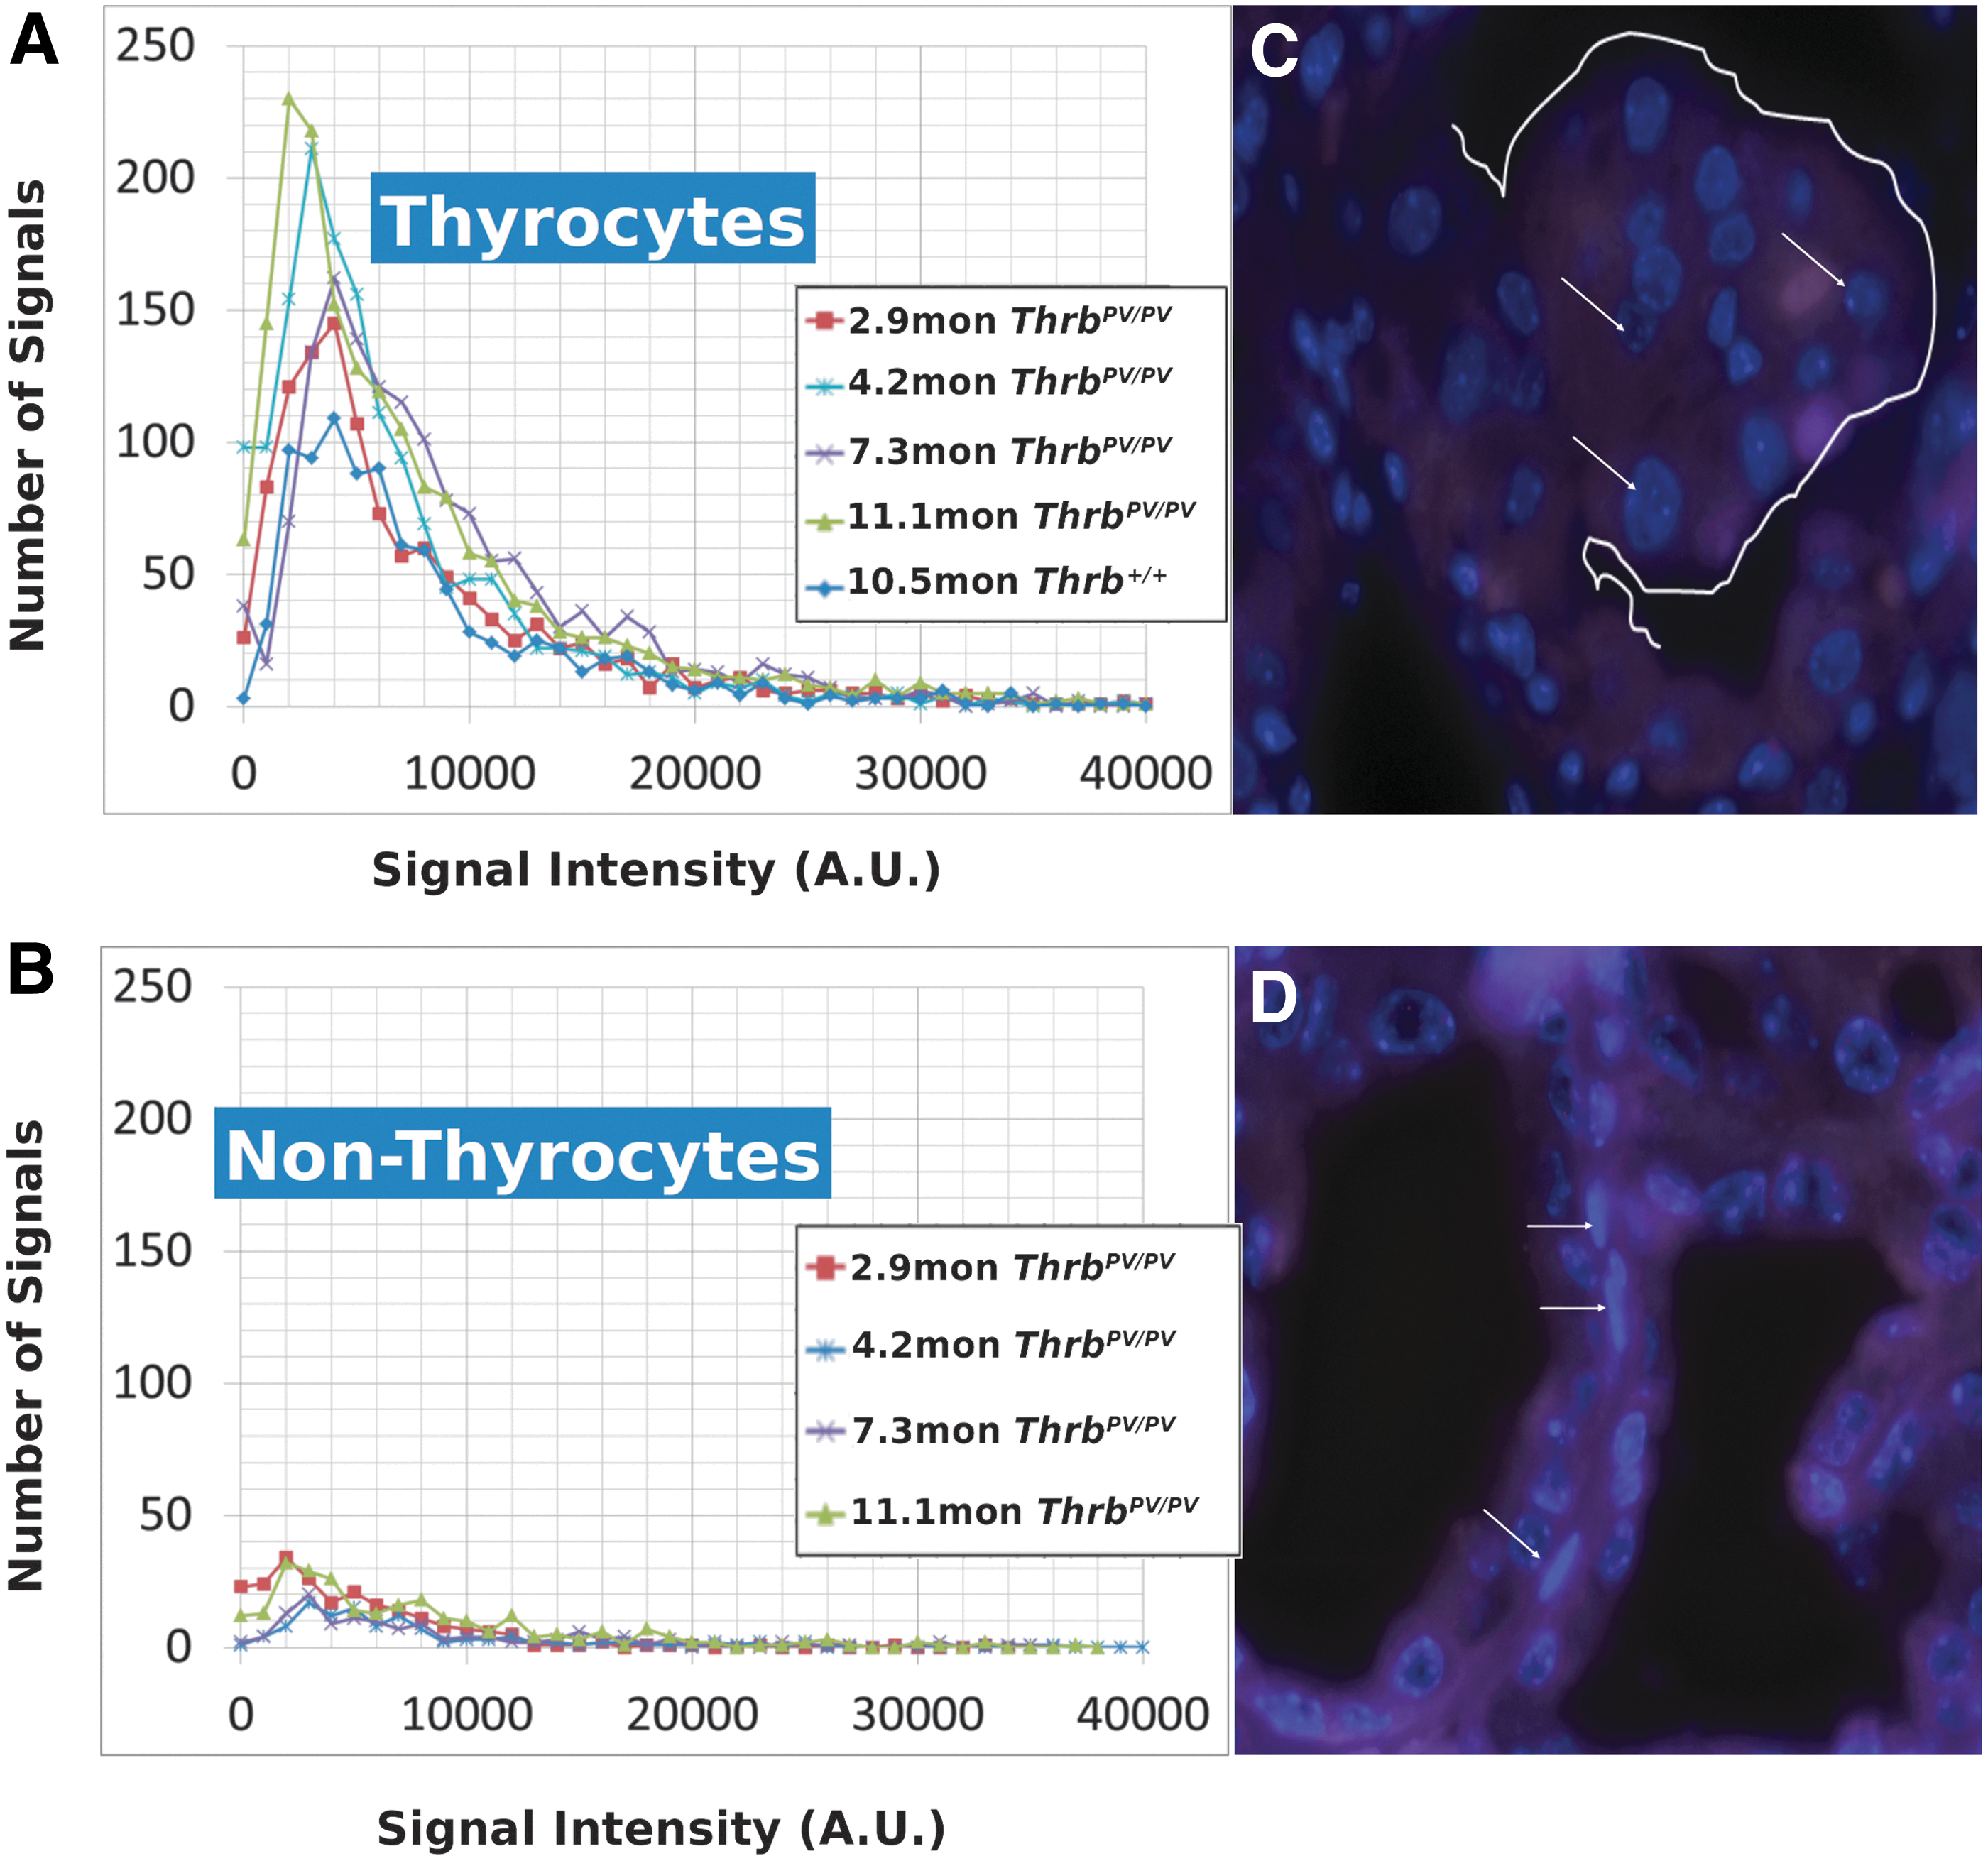
Using a ZeissAxioImager Z1 microscope with a Zeiss AxioCam HRm digital camera (Zeiss, Jena, Germany), 100 nuclear images per mouse sample were acquired. A rhodamine filter with an exposure time of 500 msec was used to image the cy3 labeled telomere probe with a DAPI chromatin counterstain. Images were taken at 100 focal planes (scale lateral: 0.107 μm/pixel; scale axial: 0.2 μm/slice) for each experiment. Images were deconvolved using a constrained iterative algorithm (29). Intensity analysis was performed with TeloView™ (30,31) with the rhodamine signal intensity providing the relative fluorescent intensities of telomere signals that are proportional to telomere size (32). Cells within the thyroid gland tissue that differed distinctly by their elongated cellular and nuclear shape from normal and carcinogenic thyrocytes were imaged as an internal control (Fig. 1B, white arrows) to confirm that changes in 3D telomeric architecture or signal intensity were not common to all cells in the thyroid tissue but specific to thyrocytes. A/C ratio analysis was performed with TeloView™ (30,31), and the rhodamine signal intensity provided relative fluorescent intensities of telomere signals proportional to telomere size (32). The TeloView™ software calculates the center of gravity and the integrated intensity of each telomere and the latter determines the length of the telomere. Telomere aggregates (TA) are larger than single telomeres, represent telomere clusters that cannot be further resolved by conventional microscopy, and show high-intensity hybridization signals. In all samples studied, we were unable to detect TA using TeloView™ software.
Statistics
p-Values for comparing means were calculated using a two-tailed Student's t-test assuming equal variance. Given that we obtained more samples from one genotype than another for most of our age groups, we elected to express the total number of cells with a given number of signals as a percentage of cells within that genotype, as well as the number of signals with a given intensity per 100 cells in order to prevent favoring larger sample sizes.
Results
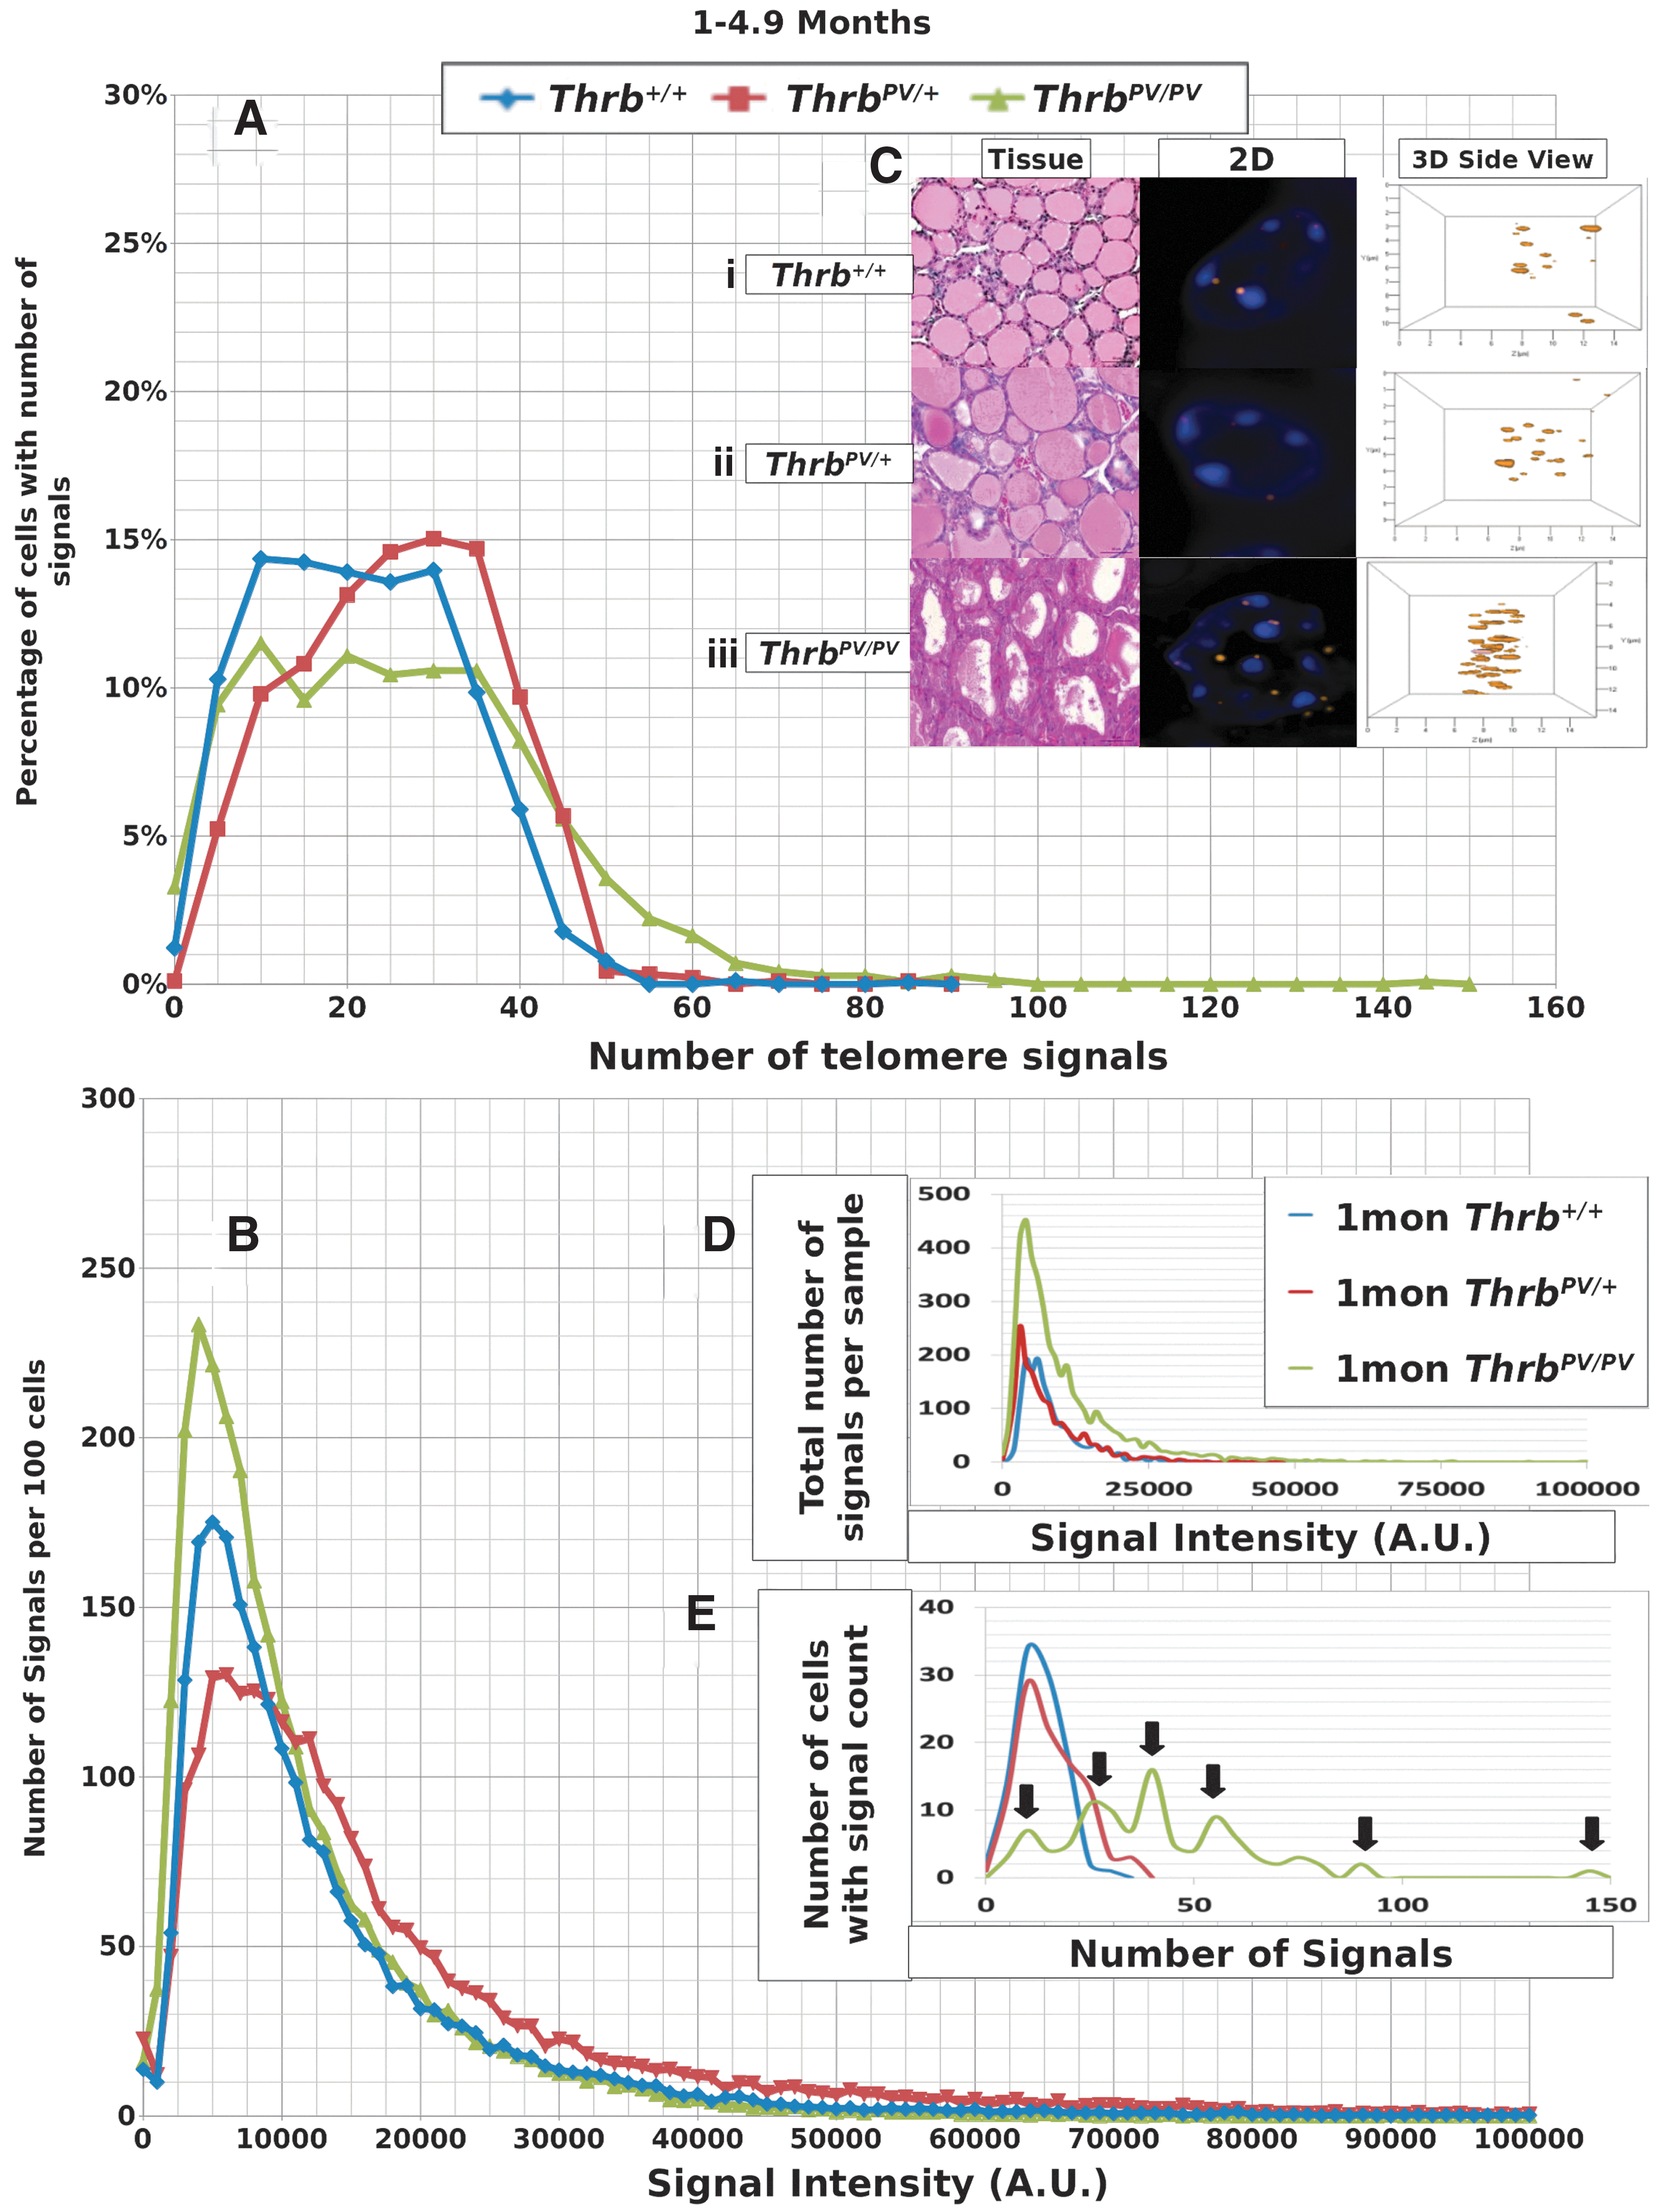
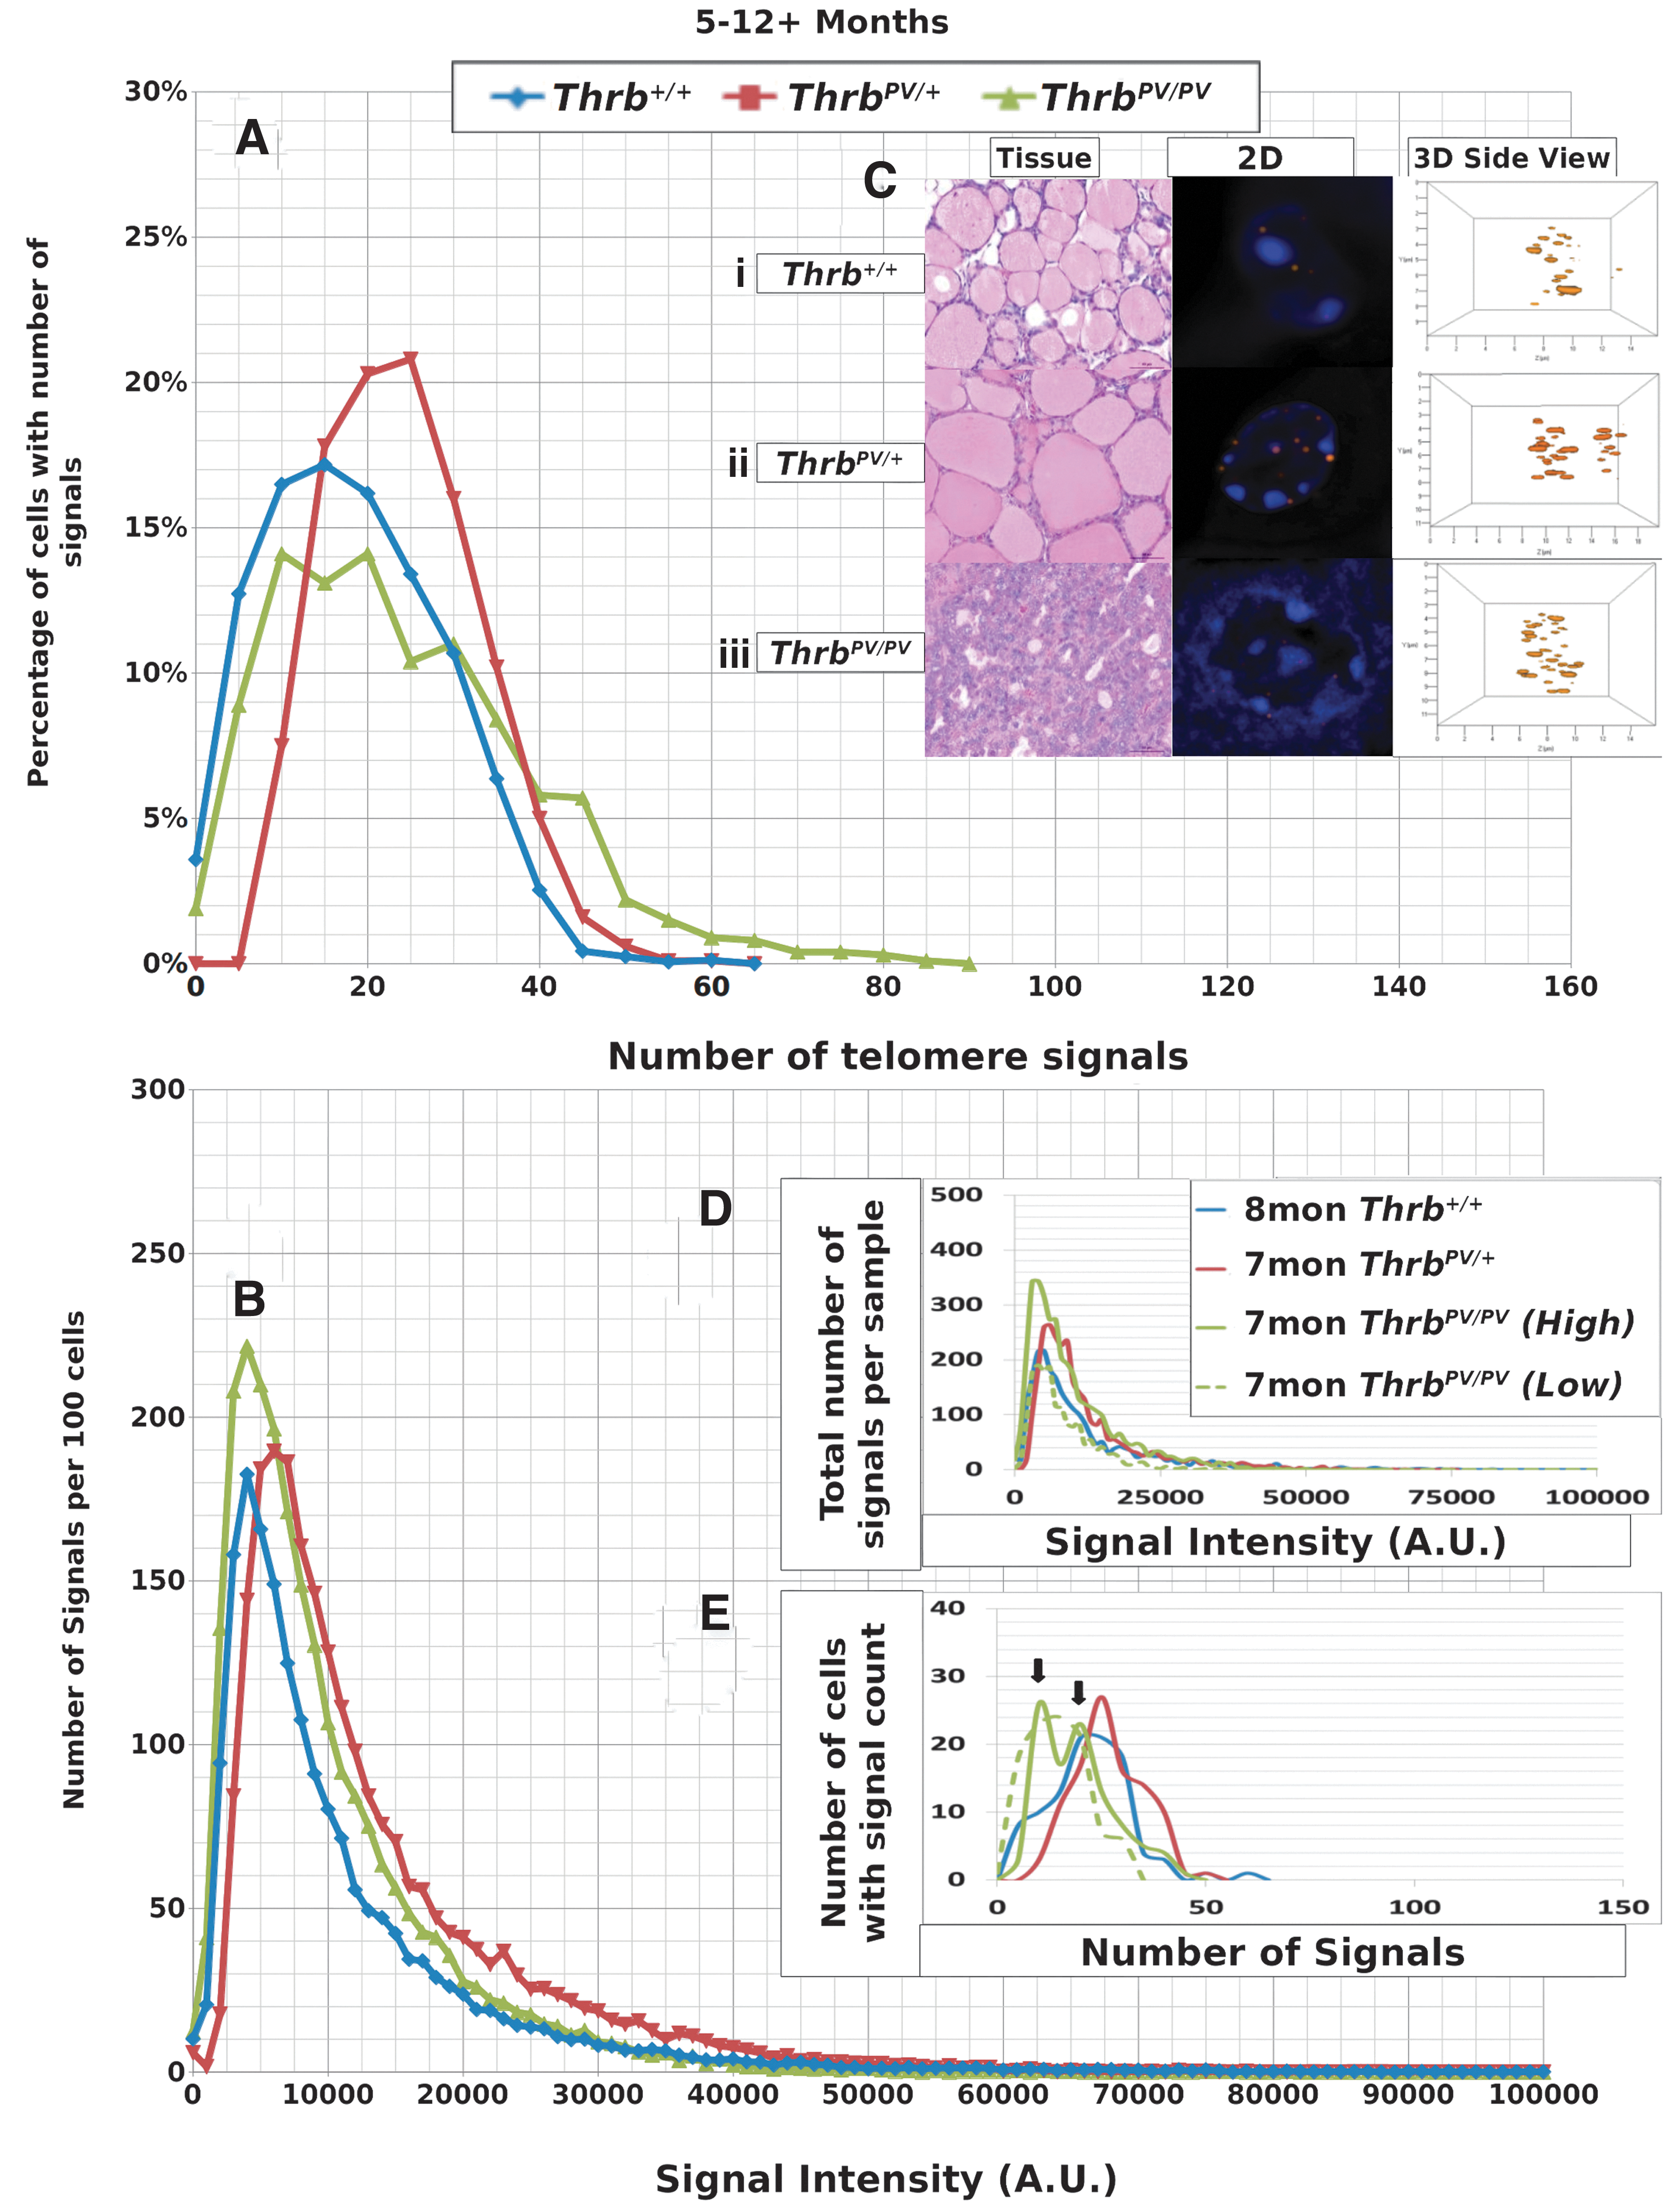
We performed Q-FISH for the detection of telomeres in interphase nuclei on thyroid tissues of Thrb PV/PV , Thrb PV/+, and Thrb +/+ mice between 1 and 13 months of age (Table 1) followed by quantitative 3D image analysis. Independent of the sex of the animals, the Q-FISH telomere analysis revealed changes in mean telomere signal numbers (Table 2) that were specific to thyrocytes (Fig. 1A, B) but were not observed in other nonfollicular cell populations in the thyroid gland as determined by their interfollicular location and nuclear shape (Fig. 1C, D). Of the expected 160 telomeres of mouse chromosomes (four signals per chromosome), 3D telomere FISH and subsequent quantitative analysis using TeloView detects on average 40 separated telomeres in whole interphase nuclei of cultured cells with complete hybridization efficiency as shown in 2D FISH metaphase spreads (30,31). This number is equivalent to previously published findings (33 –35). For our analysis, we did not investigate cultured cells but 5 μm tissue sections. We measured a range for thyrocyte nuclear diameters between 4.5 μm and 10.2 μm in hematoxylin and eosin (H&E) sections, indicating that nuclei in tissue sections are not always complete but represent segments of different nuclear volumes. Our analysis confirmed this situation, as we detected on average 21 telomere signals in thyrocyte nuclei of Thrb+/+ controls (Figs. 2A, 3A; Table 2). Thus, we considered nuclear segments in a 5 μm thick section of thyroid tissue having more than 30 telomeric signals as potentially being aneuploid and nuclear segments having more than 40 signals as potentially being near tetraploid or tetraploid. As early as 1 month of age (Fig. 2A–E), thyrocytes in the ThrbPV/PV and ThrbPV/+ group showed larger number of telomere signals compared to Thrb+/+ thyrocytes (Fig. 2C–E; Table 2). Thyrocytes of the ThrbPV/+ and ThrbPV/PV genotypes continued to show a significantly higher average number of telomere signals compared to the Thrb+/+ controls for all age groups studied (Table 2). In both mutants, we observed a higher percentage of nuclei showing higher telomere signals than corresponding controls (Figs. 2A, 3A). Intensity measurements of these signals showed that thyrocyte nuclei of homozygous mutants amassed a larger number of low intensity signals, indicative of shorter telomeres (32), than their normal counterparts in the 1–4.9 months age group (Fig. 2B). However, only thyrocyte nuclei of ThrbPV/PV showed a peak in the number of critically short telomeres in the 1–4.9 months age group (Fig. 2A) and continued to have an increased number of short telomeres in the 5–12+months age group (Fig. 3A). Compared to the controls, the ThrbPV/+ heterozygous mice showed an increased number of telomere signals with higher intensities in the 1–4.9 months (Fig. 2A) and the 5–12+ months age group (Fig. 3A).
Data for 1–4.9 month old mouse thyrocytes.
Data for thyrocytes of mice sacrificed at 5–12+ months of age.
SD, standard deviation.
Data from representative thyroid samples from each genotype for every age group are shown as signal intensity per 100 nuclei (Figs. 2D, 3D) and as the number of nuclei with defined number of telomere signals per 100 thyrocytes (Figs. 2E, 3E). As expected, the graphs in D resembled the curves for the average number of signals analyzed in all samples per age group (Figs. 2B, 3B). When we separated the number of nuclei with defined signal numbers for each animal, ThrbPV/PV mutants revealed a spiked pattern (arrows in Figs. 2E, 3E) resembling several cell populations with different telomere numbers indicative of various degrees of aneuploidy per sample. We observed a small number of cells with more than 80 telomere signals exclusively in ThrbPV/PV thyrocytes at the 1–4.9 months age group (Fig. 2E) and thyrocyte populations showing 50 or more telomere signals per nucleus indicative of the presence of tetraploid thyrocytes. ThrbPV/VP mice at 5–12+ months of age revealed fewer cell populations and reduced number of telomere signals when compared to thyrocytes of ThrbPV/+ or controls (Fig. 3E) and the few ThrbPV/PV mice investigated at the age of 12 months and above appeared to have only two populations. None of the ThrbPV/+ heterozygous mice or the controls presented a spiked pattern in any of the age groups investigated.
We have previously shown that the spherical nature of telomere distribution (the a/c ratio) is associated with the cell cycle phase, with higher ratios indicating more cells at the G2/M boundary and thus a higher overall level of cell proliferation: a/c ratios of 1.4±0.1, 1.5±0.2 and 14±2 refer to nuclei in Go/G1, S, and G2 respectively (30,36). Although we determined a higher a/c ratio in the ThrbPV/PV
and the ThrbPV/+
, mutants in the 1–4.9 month age group (Supplementary Table S1; Supplementary Data are available online at
Discussion
Like other interphase nuclear FISH techniques (37), 3D telomere Q-FISH analysis of interphase nuclei is a highly sensitive method and was used in this study to quantify the length, number of telomeres, presence of TA, and the overall distribution of telomeres (a/c ratio) in individual thyroid epithelial cell nuclei in the ThrbPV/PV mouse model of FTC. In the thyroid gland of ThrbPV/PV mice, alterations in 3D nuclear telomere architecture were exclusively observed in thyrocytes and absent in other cell types within the thyroid gland. The latter finding exemplifies a strength of 3D telomere FISH over Southern blot-based terminal restriction fragment assays (TRF), which also measures contamination of surrounding stromal, vascular, or interstitial cells. Similarly, 2D FISH only assesses telomere signals in a single optical plane and requires metaphases reflective of the proliferative cell population only. By contrast, 3D Q-FISH analysis of interphase nuclei assesses telomere signals in every single cell of the population analyzed.
Our 3D telomere FISH analysis revealed, for the first time, changes in telomere number and length as early as 1 month of age in thyrocytes of ThrbPV/PV mice. Similarly, in 2.4 month old ThrbPV/PV mice, the combined use of histopathology and quantitative 3D Q-FISH revealed the presence of an altered telomere architecture and an increased number of critically short telomeres in thyrocyte aggregates protruding into the thyroid follicular lumen (Fig. 1A, B). All ThrbPV/PV mice investigated revealed an increased average number of total telomeres as early as 1–4.9 months of age (Table 2; Fig. 2A) and showed a higher percentage of cells with short telomeres (Fig. 2B). These results suggest early focal appearance of thyrocytes with abnormal telomere phenotypes which may contribute to FTC in the ThrbPV/PV mouse model. Precancerous stages and cancer can both present with telomere shortening (38,39), and FISH-based detection of shorter telomeres in histological specimens was shown to be an early event in human prostate, pancreas, bladder, large intestine, esophagus, oral cavity, and uterine cervix cancer development (39 –41). However, shorter telomeres are not always associated with cancer but have also been described in breast ductal carcinoma in situ and in normal breast secretory cells (38).
Telomere length is an essential parameter of telomere protective function and maintained in various cell types either by telomerase-dependent or alternative telomere lengthening mechanisms (ALT) (42,43). Telomere length characteristics are species-specific, differ considerably between human and mouse (44,45), between mouse strains (44), and in different tissues of the same mouse strain with age. While brain and spleen mouse tissues develop significant changes in telomere length with age, terminal restriction fragment (TRF) failed to detect changes in telomere length in liver, testis, or kidney (44). Our 3D telomere FISH analysis revealed that, up to 12 months of age, the average telomere length in thyrocytes of wild type Thrb+/+ mice with C57BL/J6 genetic background remained relatively stable (see B graphs of all figures). This allowed us to compare telomere profiles across different age groups and genotypes and demonstrate that homozygous ThrbPV/PV mice displayed the highest level of genomic instability followed by the ThrbPV/+ genotype. Although we observed a higher number of shorter telomeres at early age in both ThrbPV/PV and the ThrbPV/+ mutants, the ThrbPV/PV mice exclusively presented with various cell populations with different number of telomere signals (Fig. 2E) within the same animal. This suggests an early phase of telomere instability creating cells with various levels of genomic instability, including tetraploidy and aneuploidy. These alterations in 3D telomere profiles were apparent at very early ages and long before histological signs of FTC (13,15) were detectable in ThrbPV/PV mice. We previously described numerical (ranging from near diploid to near tetraploid) and structural chromosome aberration in thyroid cancer cell lines established from ThrbPV/PV mice (46). The presence of ThrbPV/PV thyrocyte populations with 40 or more telomere signals in several age groups is consistent with the notion that both aneuploid and/or tetraploid cells have tumorigenic properties (47 –49). Aneuploidy is common in many human cancers (50,51) and serves as independent prognostic factor for clinical outcome of numerous cancer types, including differentiated and undifferentiated/anaplastic thyroid cancer (52 –54).
In mammalian cells, the 3D nuclear position of telomeres is dependent on the cell cycle and cell type. In normal cells, telomeres are found in microterritories (35) and usually do not overlap or create aggregates (31). A telomeric disks is formed during G2 phase of the cell cycle (31) as determined by a substantially increase in the a/c ratio (30). Despite the thyroid hyperplasia in ThrbPV/PV mice (27), we failed to detect differences in the a/c ratio in thyroid epithelial cells of any mouse genotype studied. These results may in part be explained by the fact that, contrary to nuclei of cultured cells which are scanned entirely, it is difficult to assess the entire a/c ratio of telomere distribution in nuclei of tissue samples, since only the nuclear segment as presented within a particular tissue section can be analyzed. We have previously identified TA as a specific signature of tumor cells (19,31) which is independent of telomerase activity and telomere length (18). TA are telomere clusters with stronger intensity hybridization signals that cannot be further resolved as separate signals by conventional microscopy and likely represent end-to-end telomere fusions which cause breakage–fusion–bridge cycles (18,55,56), thus facilitating chromosomal rearrangements.
Telomere shortening was observed in human PTC (57). In our FTC mouse model, we detected the presence of shorter telomeres at a very early stage, suggesting that in FTC, as in other cancer types, alterations to the organization of the 3D nucleus promotes tumorigenesis as a result of chromosomal instability (58). Short and especially critically shortened telomeres represent telomere dysfunction and may form aggregates that likely are not classified as TA by the software, as their cumulative intensity falls below the threshold level for the fluorescence intensity of normal telomeres. In ThrbPV/PV mice, telomere instability is likely to be responsible for the appearance of several cell populations with deletions, gene amplifications, and/or nonreciprocal translocations we described earlier in cell lines derived from ThrbPV/PV tumors (46). Telomere-driven genomic instability in thyroid lesions was also detected by interphase FISH for cytogenetic subtyping of human thyroid lesions, revealing the presence of specific breakpoint chromosomal aberrations (37). Close proximity of telomere territories combined with altered telomere architecture can increase the risk of recombination especially in subtelomeric regions fuelling genomic instability (59). Our findings implicate telomere architectural changes to trigger early onset, continual, and competitive clonal selection of thyrocyte populations throughout follicular carcinogenesis.
Intriguingly, the 3D telomere profile of ThrbPV/+ thyrocytes was different from wild type controls throughout all age groups. The majority of segmental nuclei of ThrbPV/+ heterozygous thyrocytes showed increased average telomere numbers (Table 2), a higher percentage of nuclei with increased telomere signals (Figs. 2A, 3A), and longer telomeres (Figs. 2B, 3B). ThrbPV/+ nuclei lacked the presence of multiple cell populations with different degrees of aneuploidy. Instead, they showed a homogeneous population of aneuploid nuclei with increased numbers of telomere signals (Figs. 2E, 3E). We interpret these observations as an underlying genomic instability in ThrbPV/+ thyrocytes that requires additional stimuli for carcinoma initiation. Indeed, we demonstrated that elevated thyroid hormone levels (60), the lack of a wild type thyroid hormone receptor beta (TRβ) (13), and TSH levels that are elevated beyond a critical threshold level (61) can promote the initiation of FTC in ThrbPV/+ thyrocytes. The exact mechanisms by which thyroid hormones and/or TSH can affect telomere architecture in ThrbPV/+ thyrocytes remains to be elucidated.
In conclusion, 3D telomere FISH analysis was able to detect thyrocyte-specific alterations in telomere architecture starting as early as 1 month of age prior to histological signs of FTC in the ThrbPV/PV mouse model. In male and female ThrbPV/PV mice alike, FTC involved the dynamic selection of thyrocytes with shorter telomeres and aneuploid and tetraploid thyrocyte populations. These telomere changes were absent in heterozygous ThrbPV/+ or control mice. Our findings confirm previous reports identifying 3D telomere FISH as an effective diagnostic tool for early detection of individual cancer cells, tumor subtypes, and suitable prognostic indicator of disease progression (24,25,31,62). Recently, we developed an automated 3D telomere scanning procedure capable of rapid imaging of telomere profiles from interphase nuclei, and specific TeloScan software was shown to identify individual tumor cells in large samples (63). This novel 3D telomere technique will make it feasible to test large numbers of human thyroid tissues in clinical screening rapidly.
Footnotes
Acknowledgments
S.H.K. and T.K. are both grateful for financial support from the Natural Sciences and Engineering Council of Canada (NSERC), the Manitoba Institute of Child Health (MICH), and the Department of Surgery Research Fund at the Faculty of Medicine, University of Manitoba. L.W. is the recipient of a Manitoba Health Research Council (MHRC) fellowship and S.M. is supported by the Canadian Institutes of Health Research (CIHR). The authors thank Ms. Mary Cheang for statistical analysis of the data.
Author Disclosure Statement
No competing financial interests exist.