
Abstract
Background:
Th1 cytokines exert pleiotropic effects in Hashimoto's thyroiditis. Previous studies reported a downregulation of thyroperoxidase and dual oxidase (DUOX) protein and mRNA expression in thyroid cells treated with Th1 cytokines. Although this effect is partially mediated by intracellular reactive oxygen species (ROS) and reactive nitrogen species, the nature and the source of the ROS involved are currently unknown. The aim of this study was to examine further the nature and source of the ROS produced in response to Th1 cytokines.
Methods:
Two rat thyroid cell lines (PCCL3 and FRTL-5) and human thyrocytes were incubated with Th1 cytokines (interleukin [IL]-1α and interferon-γ) in the presence or absence of the Th2 cytokine IL-4, the nitric oxide synthase inhibitor N-nitroso-L-arginine methyl ester (L-NAME), or the synthetic antioxidant N-acetylcysteine. The nature and source of the intracellular and extracellular ROS produced were determined.
Results:
A rapid increase in intracellular ROS was observed in cells incubated with Th1 cytokines. This increase was not caused by extracellular hydrogen peroxide (H2O2) produced by DUOX because both DUOX expression and extracellular H2O2 synthesis were decreased by Th1 cytokines. Confocal colocalization experiments showed that the Th1 cytokine–triggered ROS were not produced from mitochondria. Electron paramagnetic resonance investigations of PCCL3 cells indicated that the highly reactive hydroxyl radical was not involved in the response to Th1 cytokines. NOX2 mRNA expression was significantly increased in PCCL3 cells incubated with Th1 cytokines, as was the expression of the protein in the thyroid of Hashimoto's thyroiditis patients. NOX4 expression was by contrast unaffected. These results suggest that at least superoxide could be produced after exposure of thyroid cells to Th1 cytokines. The effects of L-NAME and IL-4, both of which partially or totally reverse Th1 cytokine–induced effects, on ROS release were also analyzed. L-NAME and IL-4 significantly reduced the Th1 cytokine–induced surge of intracellular ROS in PCCL3 and human thyroid cells.
Conclusion:
The data presented here reinforce the idea that ROS, other than extracellular H2O2 produced by DUOX, are released from NOX2 after exposure of thyroid cells to Th1 cytokines. ROS/reactive nitrogen species act as important, but as further explained, not exclusive intracellular mediators of Th1 cytokine–induced effects in thyroid cells.
Introduction
T
In addition to reactive nitrogen species (RNS) such as nitric oxide (NO•) (12 –14), reactive oxygen species (ROS) are also thought to act as intracellular mediators of Th1 cytokine–induced effects in thyroid cells (11,15). This must be distinguished from the physiological role exerted by ROS in thyroid epithelial cells. For instance, hydrogen peroxide (H2O2) is physiologically produced in the thyroid gland and is involved in TH biosynthesis (16 –18). H2O2 is therefore part of the physiological oxidative load, which is not the cause of cell injury, but instead associated with cellular events responsible for normal thyroid epithelial cell function (16,19). ROS are also involved in the hypoxia-inducible factor–mediated vascular endothelial growth factor pathway that is activated in thyrocytes in response to iodine shortage, which makes the endothelial compartment closely related to epithelial cells within the angiofollicular units (16,20,21). Other ROS, including hydroxyl radical (OH•), anion superoxide (O2 •−), peroxynitrite (ONOO−), and iodocompounds, are more reactive and sometimes toxic, as demonstrated in animal models of iodine-induced thyroid involution and in the nonobese diabetic mouse model of spontaneous autoimmune destructive thyroiditis (22 –26).
A link between Th1 cytokine exposure and production of ROS was recently reported in rat PCCL3 thyroid cells (11). This observation raised questions about the nature and source of ROS produced after Th1 cytokine exposure; while Th1 cytokines downregulate DUOX expression, and therefore the production of extracellular H2O2 (9 –11), they trigger at the same time a surge of intracellular ROS production (11). Because DUOX is downregulated by Th1 cytokines, and as H2O2 is either consumed during TH synthesis or readily detoxified by the numerous potent antioxidant systems present in the thyroid (16), we propose that ROS other than extracellular H2O2 are produced in response to Th1 cytokines by NADPH oxidases (NOXs) other than DUOX.
The aims of this study were to gain further insights into the nature of the ROS produced in cells exposed to Th1 cytokines and to identify which NOXs are induced under these conditions. The effects of N-nitroso-L-arginine methyl ester (L-NAME), a nitric oxide synthase (NOS) inhibitor, and of interleukin-4 (IL-4), a prototype of Th2 cytokines, on ROS production were also examined and compared with the known inhibitory effect of the potent antioxidant N-acetylcysteine (NAC).
Materials and Methods
Cell cultures
The rat thyroid follicular PCCL3 cell line (27) was a gift from Dr. F. Miot (Université Libre de Bruxelles, Institut de Recherche Interdisciplinaire en Biologie Humaine et Moléculaire, Brussels, Belgium). Cells were seeded into 6-well plates or multichamber glass slides (Nunc International) and were cultured in a humidified atmosphere of 5% CO2. They were grown to 80–90% confluence in Coon's modified Ham's F12 medium (BRL-Gibco) supplemented with 5% newborn calf serum, 50 U/mL penicillin, 50 μg/mL streptomycin, 2.5 μg/mL fungizone (BRL-Gibco), 1 mU/mL thyrotropin (TSH), 10 μg/mL insulin, and 5 μg/mL transferrin (Sigma). A cytokine cocktail comprising recombinant rat IL-1α (2 ng/mL; Chemicon International) and recombinant rat IFNγ (100 U/mL; Chemicon International) was added for 3 additional days, with or without 1 mM NAC (Sigma), 2.5 mM L-NAME (Sigma), or 2 ng/mL recombinant rat IL-4 (a gift from Dr. Vanderbruggen, Université catholique de Louvain, The de Duve Institute, Brussels, Belgium). NAC was added 2 hours before the cytokine cocktail. As a control, NAC, L-NAME, and IL-4 were added to thyroid cells in the absence of IL-1α and IFNγ.
FRTL-5 cells that were used for measurement of extracellular H2O2 were a gift from Dr. P. Kopp (Northwestern University, Chicago, IL). These cells were grown to 80–90% confluence in Coon's modified Ham's F12 medium (Gibco) supplemented with 5% newborn calf serum, 5 mU/mL TSH, 10 μg/mL insulin, 5 μg/mL transferrin, 10 ng/mL somatostatin, 10 ng/mL glycyl-L-histidyl-L-lysine-acetate, and 3.2 ng/mL hydrocortisone (6H medium).
Human thyroid tissues were obtained from patients who underwent thyroid surgery for benign multinodular goiters. Tissues were obtained from the anatomopathology department after patients provided informed consent. Thyrocytes were isolated from the tissue samples as described previously (28) and then seeded into 6-well plates (50 μg DNA per well) or multichamber glass slides (7 μg DNA per chamber). Thyrocytes were incubated in a humidified atmosphere of 5% CO2 and were cultured in modified Earle's medium (without phenol red) supplemented with 5% newborn calf serum, 50 U/mL penicillin, 50 μg/mL streptomycin, 2.5 μg/mL fungizone, and 1 mU/mL TSH. After incubation for 1 week, cells were exposed to cytokines in the presence or absence of NAC, L-NAME, or IL-4 for an additional 3 days, as described for PCCL3 cells. All experiments were repeated at least twice. Unless otherwise stated, all reagents listed were purchased from Sigma.
Human thyroid samples for immunohistochemistry and reverse transcription polymerase chain reaction
Thyroid samples for immunohistochemistry were obtained from five multinodular goiters and five HT thyroids selected from a tissue bank of the pathology department. They were fixed in formol (4%) and embedded in paraffin. Other samples from 3 multinodular goiters and 2 HT thyroids were obtained from surgical cases after patients gave their informed consent and immediately frozen in liquid nitrogen, and thereafter conserved at −80°C until use for reverse transcription polymerase chain reaction (RT-PCR). HT patients had normal to high normal TSH levels along with high levels of plasma anti-TPO and anti-Tg antibodies. They were all treated with thyroxine.
Measurement of ROS production and labeling of mitochondria
Thyrocytes were incubated in multichamber glass slides in the appropriate medium. To label mitochondria, thyroid cells were washed with phosphate-buffered saline (PBS; pH 7.4) and then incubated in Krebs–Ringer HEPES medium (KRH) (pH 7.4) containing 250 nM MitoTracker dye (Molecular Probes) at 37°C for 30 minutes. To measure ROS production, cells were washed with KRH, incubated in the appropriate culture medium at 37°C for 15 minutes, and then incubated in KRH containing 25 μM 2′,7′dichlorofluorescein diacetate (DCFH-DA; Molecular Probes) at 37°C for a further 30 minutes. The excess dye was removed by two washes with PBS. Cells were stained with Hoechst dye for 20 minutes and rinsed in PBS. Cover slides were mounted in the fluorescent mounting medium (DakoCytomation) for confocal microscopy.
Confocal microscopy and identification of colocalized signals
Optically sectioned images were acquired using a Leica SP5 laser scanning confocal microscope and were analyzed using Leica Microsystems LAS AF software (v1.8.2). ROS production was quantified by measuring the mean fluorescence intensity of each cell. For colocalization analysis, the “colocalization” module of Imaris software (v6.1.2; Bitplane, Zurich, Switzerland) was used (29). Briefly, this program analyzes images of confocal sections acquired in two channels. Labels were considered colocalized if they were positioned too close in the tissue to be optically resolved. Each confocal section consisted of an array of pixels, and a voxel was defined as a prism in which the base is the pixel and the height is the thickness of the confocal section. Imaris colocalization software measures the intensity of each label in each voxel in the entire confocal image. A pixel intensity threshold of 16 (on a scale of 0–255) was used for each label, and voxel intensity values above this threshold were considered to be higher than the background intensity. When the intensity of both labels in a voxel was higher than their respective thresholds, the labels were considered colocalized. The Pearson coefficient was used to estimate the degree of correlation between the intensity values for the two labels in voxels showing colocalization. The Pearson coefficient lies between +1 and −1; positive values indicate a direct correlation, and values close to zero indicate no correlation.
Measurement of hydroxyl radical by spin trapping and electron paramagnetic resonance spectroscopy
These experiments were performed according to methods previously published (30,31). PCCL3 cells at 80–90% confluence were seeded into a 6-well plate, incubated with or without 2 ng/mL recombinant rat IL-1α and 100 U/mL IFNγ for 3 days, and then trypsinized and suspended in a final volume of 0.4 ml. Cells were incubated with the spintrap 5-diethoxyphosphoryl-5methyl-1-pyrroline-N-oxide (RadicalVision) at 37°C for 1 minute and then with 12.5 μM K3Fe(CN)6 (Merck) for further 5 minutes. Cells were then transferred into a quartz flat cell (ER 160 FC-Q; Brüker), and the quartz cell was positioned in an X-band electron paramagnetic resonance (EPR) Super High Q cylindrical resonator (ER4122SHQE, 10 mm diameter; Brüker) with its flat side perpendicular to the direction of the magnetic field. EPR spectra were measured at room temperature using a Brüker Elexys 540 spectrometer (Brüker) operating at 9.5 GHz. The magnetic field center was 347.63 mT with a Sweep Width of 20.0 mT (512 pts). The microwave power was 5 mW with a receiver gain of 60 dB. The modulation frequency was 100 kHz, the modulation amplitude was 0.1 mT, the conversion time was 20.48 milliseconds, and the time constant was 81.92 milliseconds. Spectra were determined as the mean of 10 scans.
Detection of H2O2 in the culture medium
FRTL-5 cells were incubated for 4 hours in the KRH medium supplemented with 0.1 mg/mL horseradish peroxidase type II (Sigma) and 440 μM homovanillic acid (Sigma). A standard curve was generated by adding known concentrations of H2O2 to the KRH medium containing horseradish peroxidase and homovanilic acid. The fluorescence intensity was measured at an excitation wavelength of 315 nm and an emission wavelength of 415 nm. H2O2 concentrations were estimated using the standard curve. H2O2 production was calculated as nanograms of H2O2 per milliliter of the culture medium.
Real-time RT-PCR
PCCL3 and human primary cells, as well as thyroid lysates, were suspended in TriPure isolation reagent (Roche Diagnostics GmbH), and total RNA samples were prepared according to the manufacturer's protocol. Reverse transcription was performed by incubating 2 μg of RNA with 200 U of Moloney Murine Leukemia Virus Reverse Transcriptase (Invitrogen) in a final volume of 20 μL of the recommended buffer containing 1 μL RNasin (Promega), 0.5 mM dNTP (Promega), 2 μM oligodT (Sigma), and 10 mM DTT. The reverse transcription reactions were performed overnight at 42°C, and then the resulting cDNAs were diluted 1:5 in water. For real-time PCR, 2 μL of cDNAs was mixed with 500 nM primers (Table 1) and SYBR Green reaction mix (BioRad) in a final volume of 25 μL. Reactions were performed using an iCycler PCR system (BioRad) with the following cycling conditions: 95°C for 1 minute, followed by 40 cycles of 95°C for 15 seconds, specific annealing temperature for 45 seconds, and 81°C for 15 seconds. Amplification levels were normalized to that of β-actin.
Immunohistochemistry
Paraffin sections (5 μm) were used for Nox2 protein detection. Sections were dewaxed, rehydrated, and pretreated in a microwave oven in citrate buffer (0.01 M, pH 6) for 1 cycle of 3 minutes at 750 W and 3 cycles of 3.5 minutes at 350 W. Sections were then washed with PBS supplemented with 1% bovine serum albumin (PBS-BSA) and thereafter incubated with normal goat serum (1/50 in PBS-BSA; Vector Laboratories) for 30 minutes at room temperature. The rabbit polyclonal anti-Nox2 antibody (Abcam) was then applied overnight. After two washes in PBS-BSA, the secondary biotinylated antibody was incubated for 60 minutes followed by avidin–biotin–peroxidase complex for 30 minutes (ABC Perox kit; Vector Laboratories) at room temperature. The peroxidase activity was revealed with DAB substrate (Sigma).
Data analysis and statistics
The data were expressed as mean±SEM (n=6) for all in vitro experiments. Each experiment was repeated at least twice. Statistical analyses were performed using an ANOVA followed by the Tukey–Kramer Multiple Comparison Test (GraphPad InStat), or an unpaired Student's t-test. Differences were considered significant at p<0.05.
Results
Th1 cytokines increase intracellular ROS but decrease production of extracellular H2O2
Consistent with a previous report (11), ROS, which were detected by DCFH-DA fluorescence, were observed as a faint staining within the cytoplasm of both rat PCCL3 (Fig. 1A-i) and human thyroid cells (data not shown). After treatment of cells with Th1 cytokines, the staining was greatly enhanced (Fig. 1A-ii). The fluorescent signal in Th1 cytokine–treated cells was eightfold higher than that in nontreated cells (Fig. 1B).
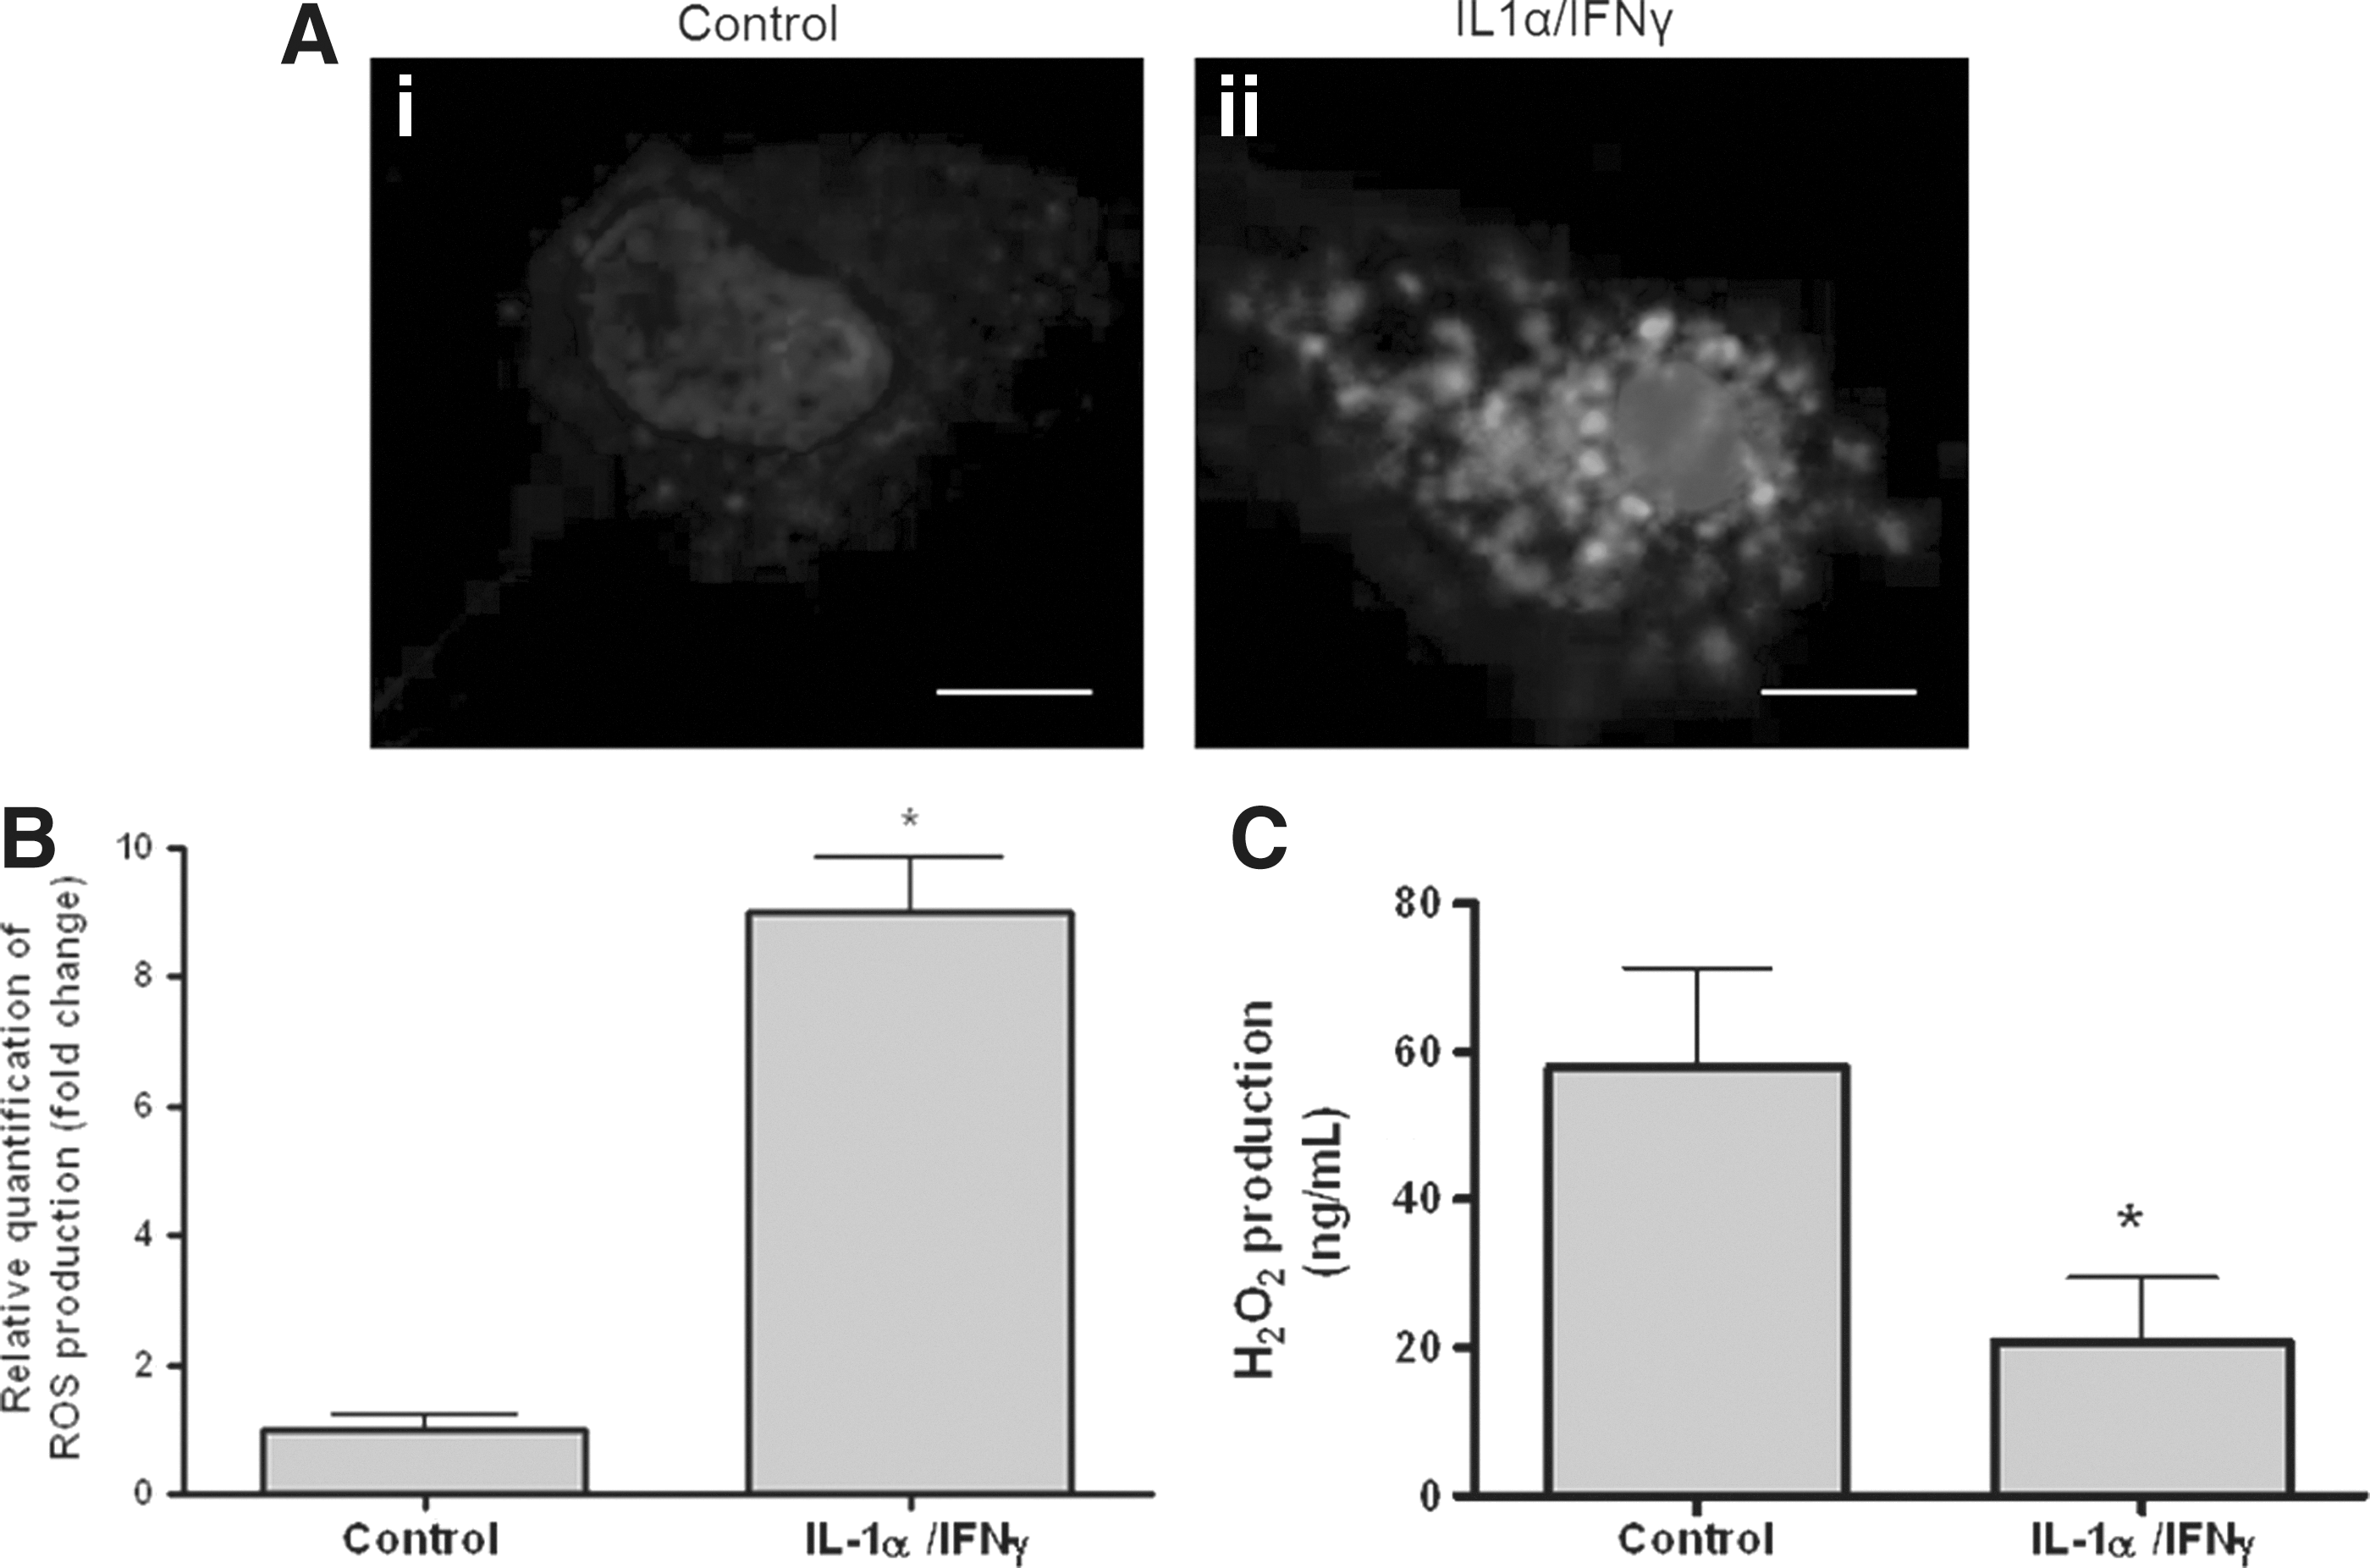
Th1 cytokines increase intracellular ROS and decrease extracellular H2O2.
DUOX2, which is responsible for H2O2 production, is one of the main sources of ROS in thyroid epithelial cells (32). However, since previous studies have repeatedly demonstrated that Th1 cytokines decrease DUOX expression in thyrocytes (9 –11,33), ROS detected in Th1 cytokine–treated cells were thought not to be attributable to DUOX-produced H2O2. To verify this hypothesis, FRTL-5 cells were treated with or without IL-1α and IFNγ, and then extracellular H2O2 levels were measured. Compared with control cells, the level of extracellular H2O2 was significantly decreased in cytokine-treated cells (Fig. 1C). Taken together, these data indicate that Th1 cytokines increase intracellular ROS production, while decreasing H2O2 release from thyroid epithelial cells.
Th1 cytokine–induced ROS are not hydroxyl radicals and are not produced by mitochondria, but are associated with increased NOX2 mRNA expression
To identify the nature of the ROS produced by thyroid cells in response to Th1 cytokines, OH• levels were analyzed by EPR. Although OH• was detected at low levels in PCCL3 cells, production of this species was not affected by exposure of cells to IL-1α and IFNγ (Fig. 2A), indicating that OH• is probably not involved in the response of thyroid epithelial cells to Th1 cytokines.

The hydroxyl radical (OH•) is not released, and intracellular ROS do not colocalize with mitochondria in Th1 cytokine–treated PCCL3 cells.
ROS are physiologically released byproducts of biological reactions that originate from various organelles, including mitochondria, the endoplasmic reticulum, and peroxisomes (34 –40). Although the respiratory chain involved in ATP generation by mitochondria is an important source of ROS (41,42), superimposition of confocal microscopy images of ROS and mitochondria in PCCL3 cells revealed no overlap (Fig. 2B). Calculation of the Pearson coefficient confirmed that the site of ROS production in these cells was not colocalizing with mitochondria (Fig. 2C), indicating that Th1 cytokine–induced ROS do not originate primarily from mitochondria.
Bearing in mind that NOXs other than DUOX may produce ROS in Th1 cytokine–treated cells, other alternatives were explored. NOX4 mRNA was detected in both PCCL3 (Fig. 3A) and human cells (data not shown), but the expression levels were unaffected by exposure of cells to Th1 cytokines. Expression of NOX2 mRNA, which encodes the prototype of NOXs originally identified in phagocytes (43), was strongly increased in Th1 cytokine–treated PCCL3 cells (Fig. 3B), suggesting that NOX2 is a possible source of ROS in Th1 cytokine–treated thyroid cells.
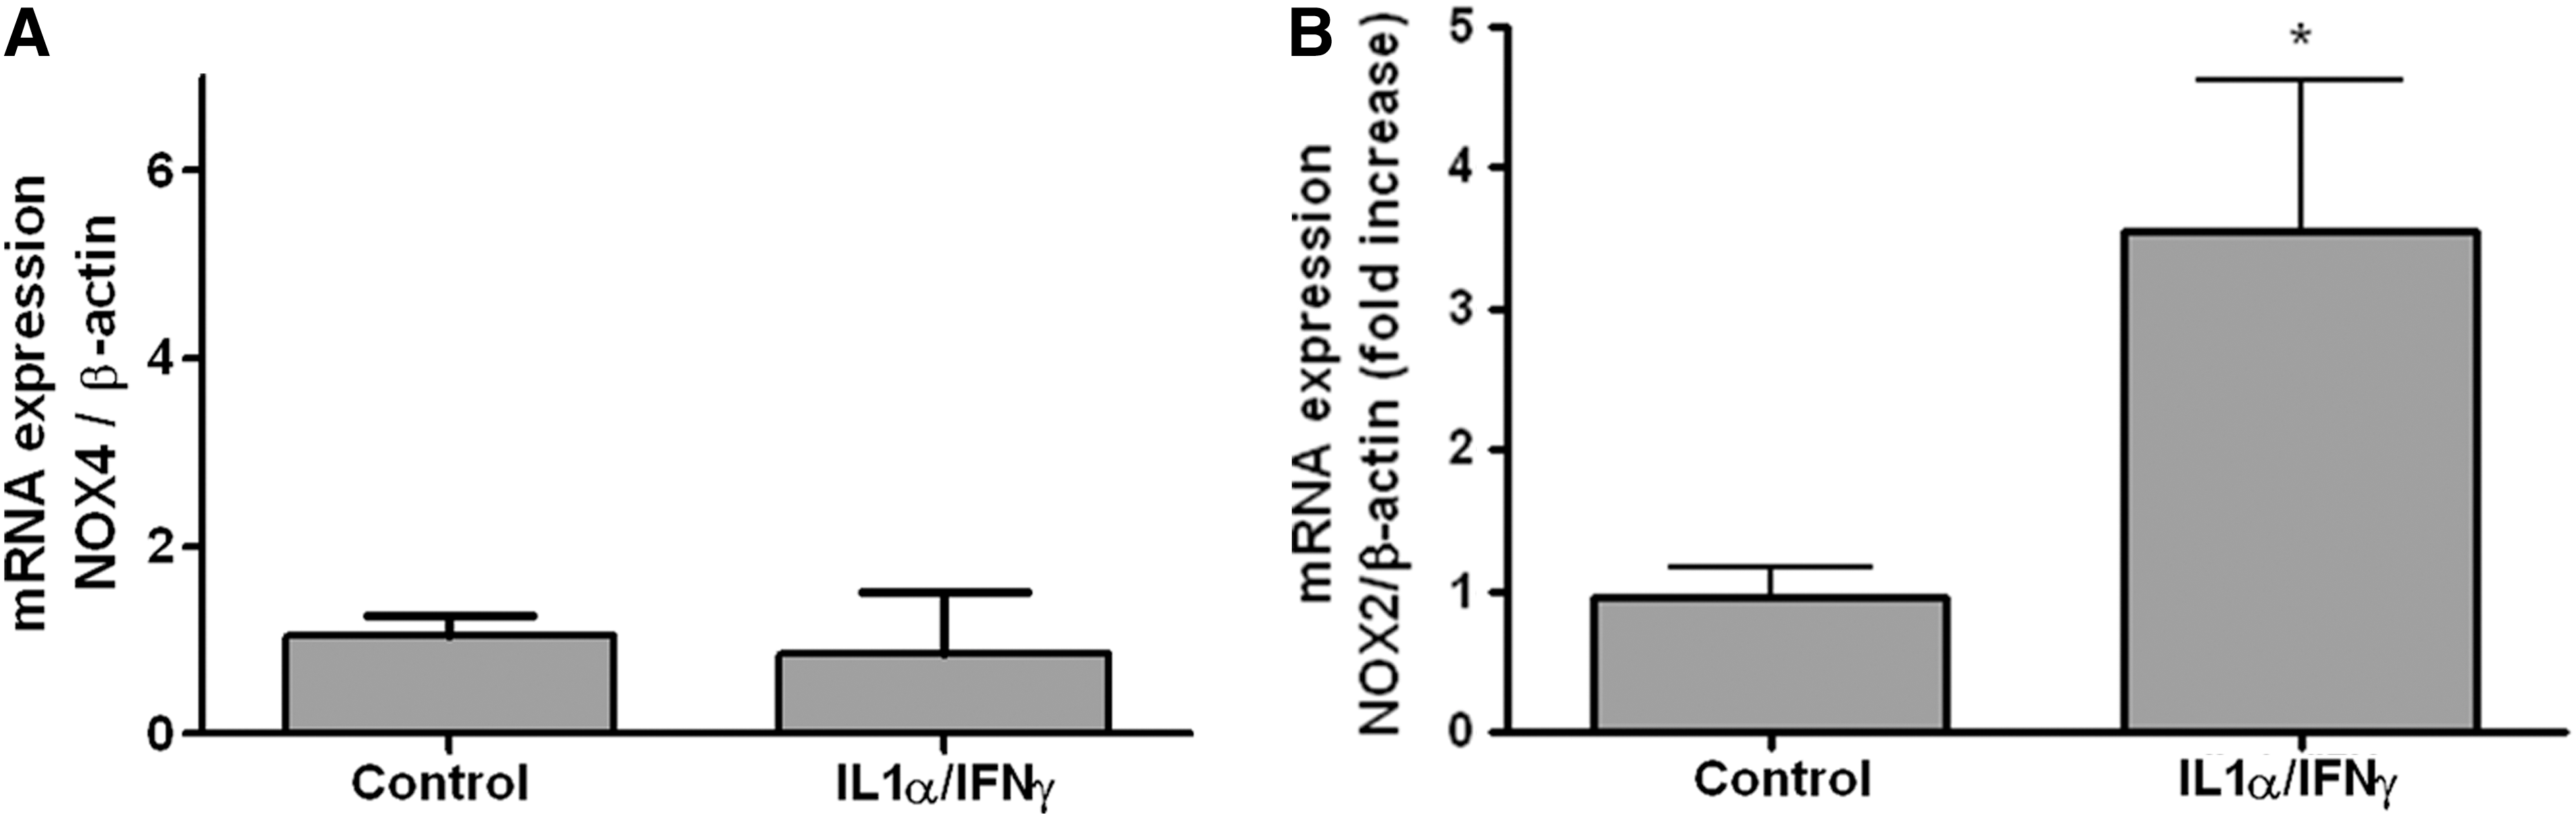
Expression of NOX4 mRNA
NOX2 mRNA and protein expression is increased in HT
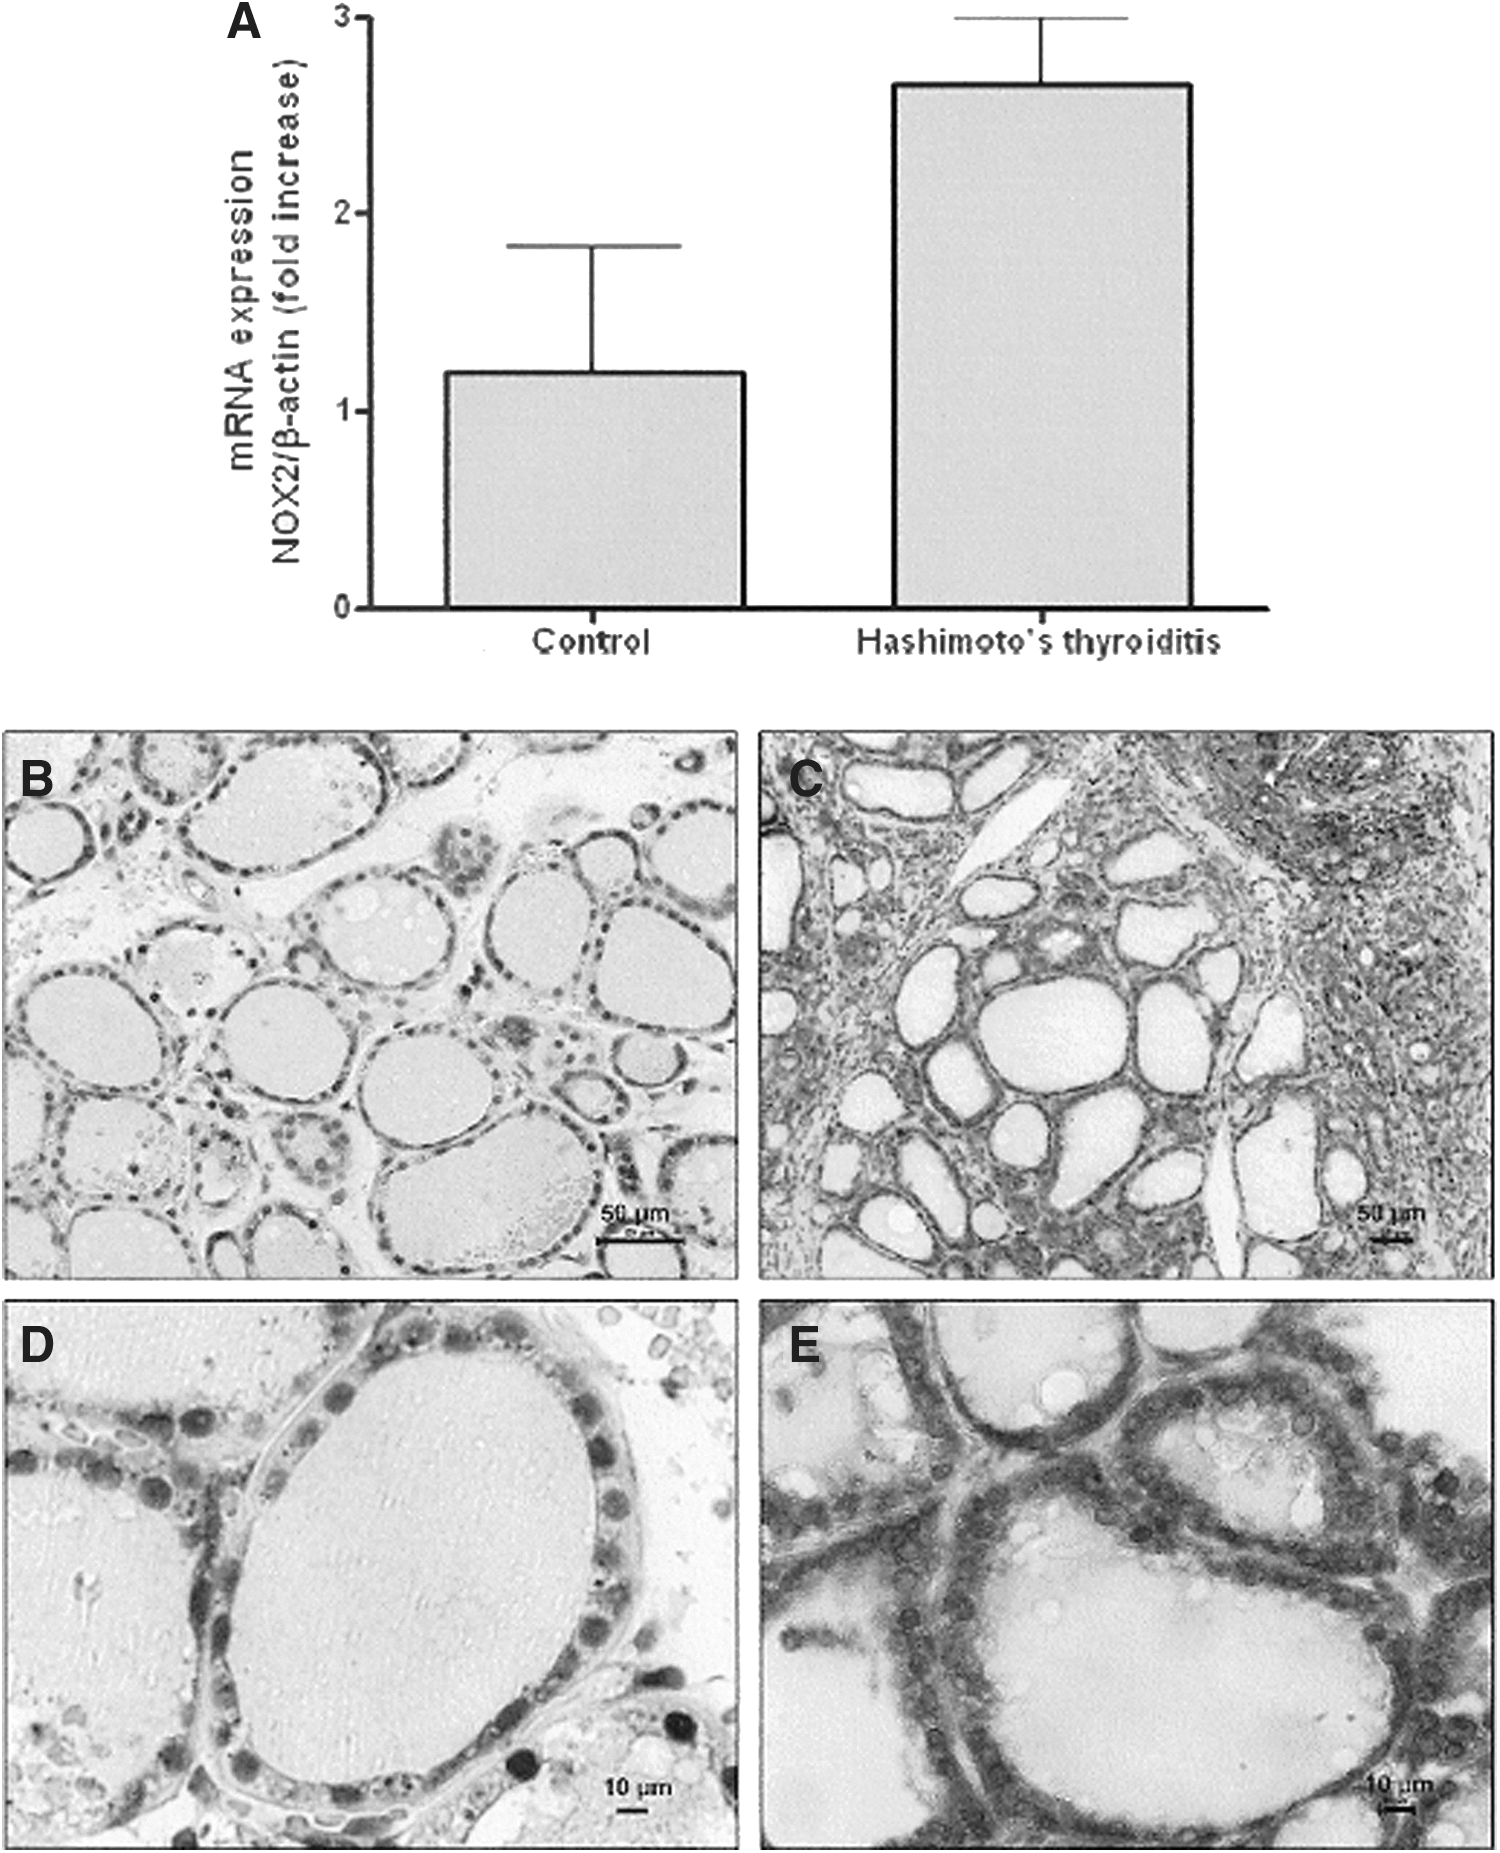
To further explore the hypothesis that NOX2 may be one source of ROS in HT thyroids, we investigated NOX2 mRNA and protein expression in HT thyroids as compared with multinodular goiters as a nonautoimmune control. NOX2 mRNA expression in HT was twofold higher than that in multinodular goiters (Fig. 4A). Nevertheless, because of the low number of HT cases (n=2), the difference was not significant. We then analyzed NOX2 protein expression by immunohistochemistry on tissues obtained from a greater number of cases. In the multinodular goiters (Fig. 4B, D), NOX2 protein expression was detected in the cytoplasm of some cells. In HT thyroids (Fig. 4C, E), in addition to a high level of expression in the inflammatory infiltrate (not shown), a strong staining for NOX2 was visible in the vast majority of thyrocytes. These results are in line with the in vitro results and reinforce the concept of a role of NOX2 in thyroid cells exposed to Th1 cytokine–driven autoimmune processes.
Expression of NOX2 mRNA
The levels of intracellular ROS are decreased in Th1 cytokine–treated thyroid cells co-incubated with L-NAME or IL-4
L-NAME and IL-4 attenuate the effects of Th1 cytokines, at least partially (9,10); therefore, we investigated the effects of these compounds on ROS induction in thyroid cells. NAC, which completely blocks ROS production in cells co-incubated with Th1 cytokines (11), was used as a positive control. As reported previously (11), compared with control PCCL3 (Figs. 5A and 6A) and human cells (Fig. 6B), intracellular ROS levels were significantly higher in Th1 cytokine–treated PCCL3 (Figs. 5B and 6A) and human cells (Fig. 6B). Compared with control cells, exposure to L-NAME alone somewhat increased the ROS signal in PCCL3 cells (Figs. 5C and 6A), but decreased the ROS signal in human cells (Fig. 6B). L-NAME significantly reduced the Th1 cytokine–induced increase in ROS in both PCCL3 (Figs. 5D and 6A) and human cells (Fig. 6B). Compared with control cells, exposure to IL-4 alone somewhat increased the ROS signal in PCCL3 cells (Figs. 5E and 6A), but did not affect the ROS signal in human thyroid cells (Fig. 6B). IL-4 significantly reduced the Th1 cytokine–induced increase in ROS in both PCCL3 (Figs. 5F and 6A) and human cells (Fig. 6B). Compared with control cells, exposure to NAC alone strongly decreased the ROS signal in PCCL3 (Figs. 5G and 6A) and in human thyroid cells (Fig. 6B). NAC significantly decreased the ROS signal in Th1 cytokine–treated PCCL3 cells to a level close to that observed in control cells (Figs. 5H and 6A), whereas in Th1 cytokine–treated human cells (Fig. 6B), the ROS signal was even slightly below to that in control cells.
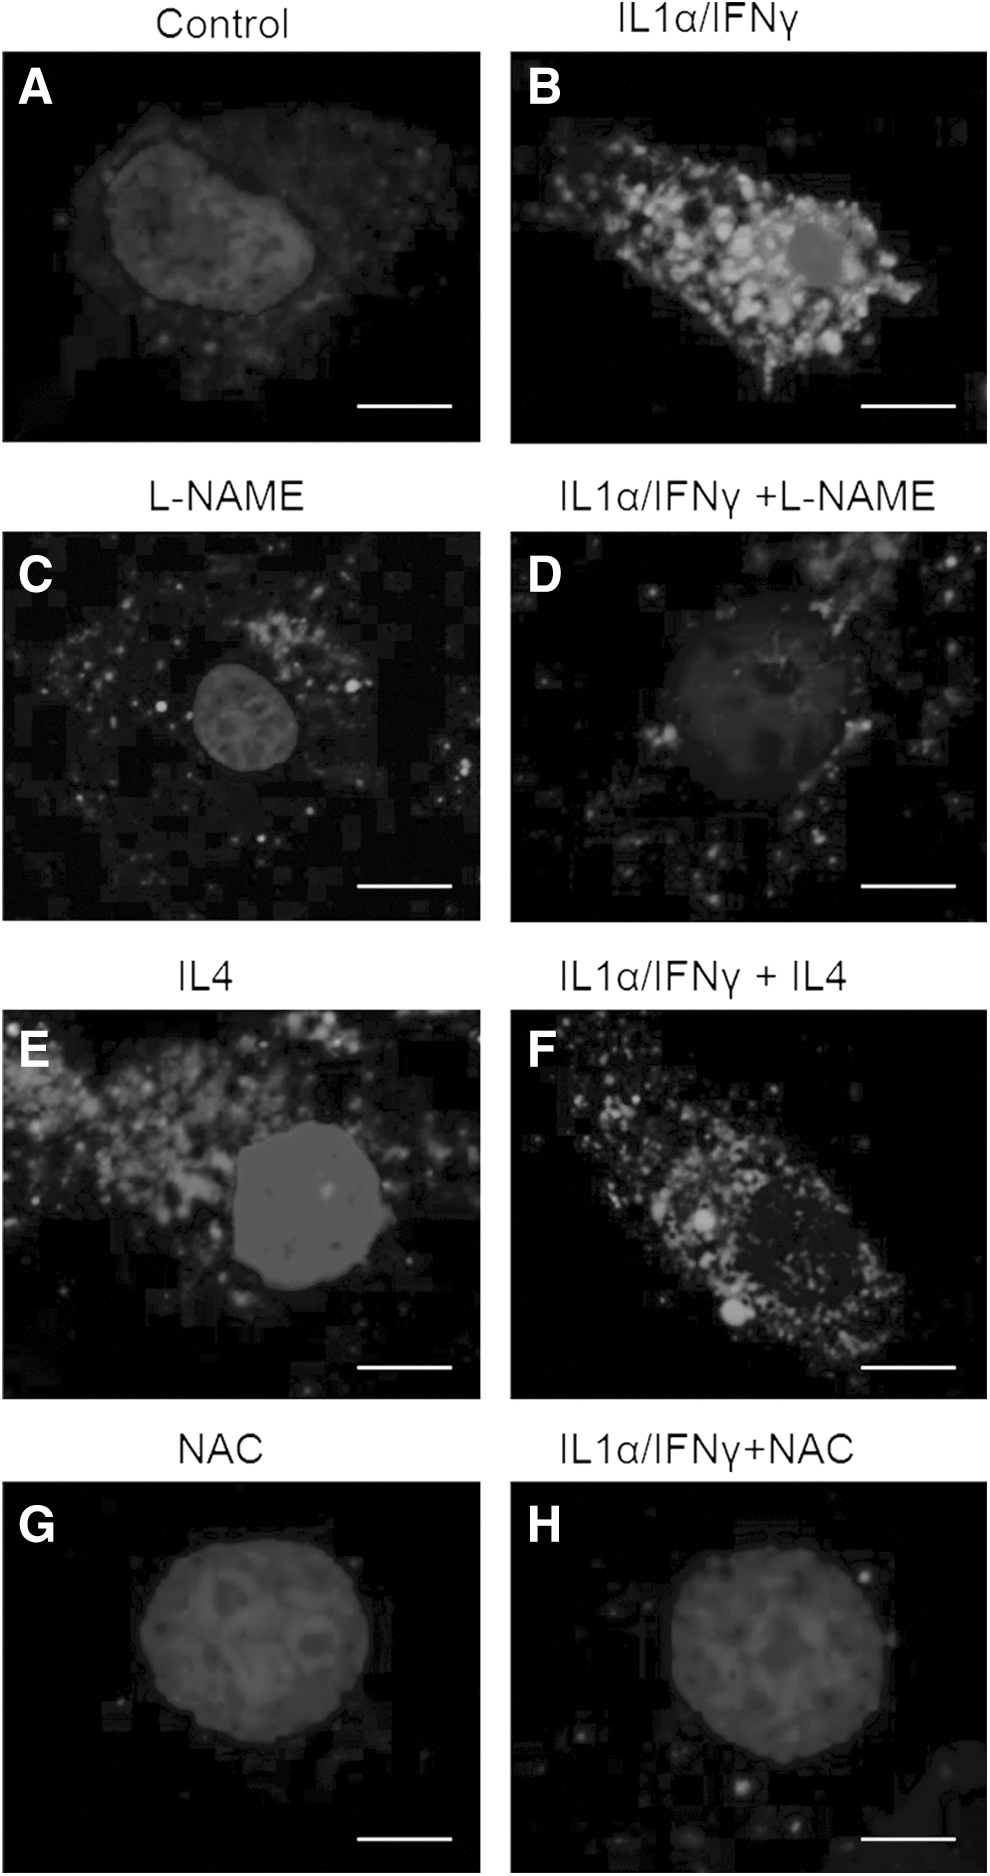
The effects of IL-4, NAC, and L-NAME on intracellular ROS production in PCCL3 cells. The ROS signal was measured in control cells
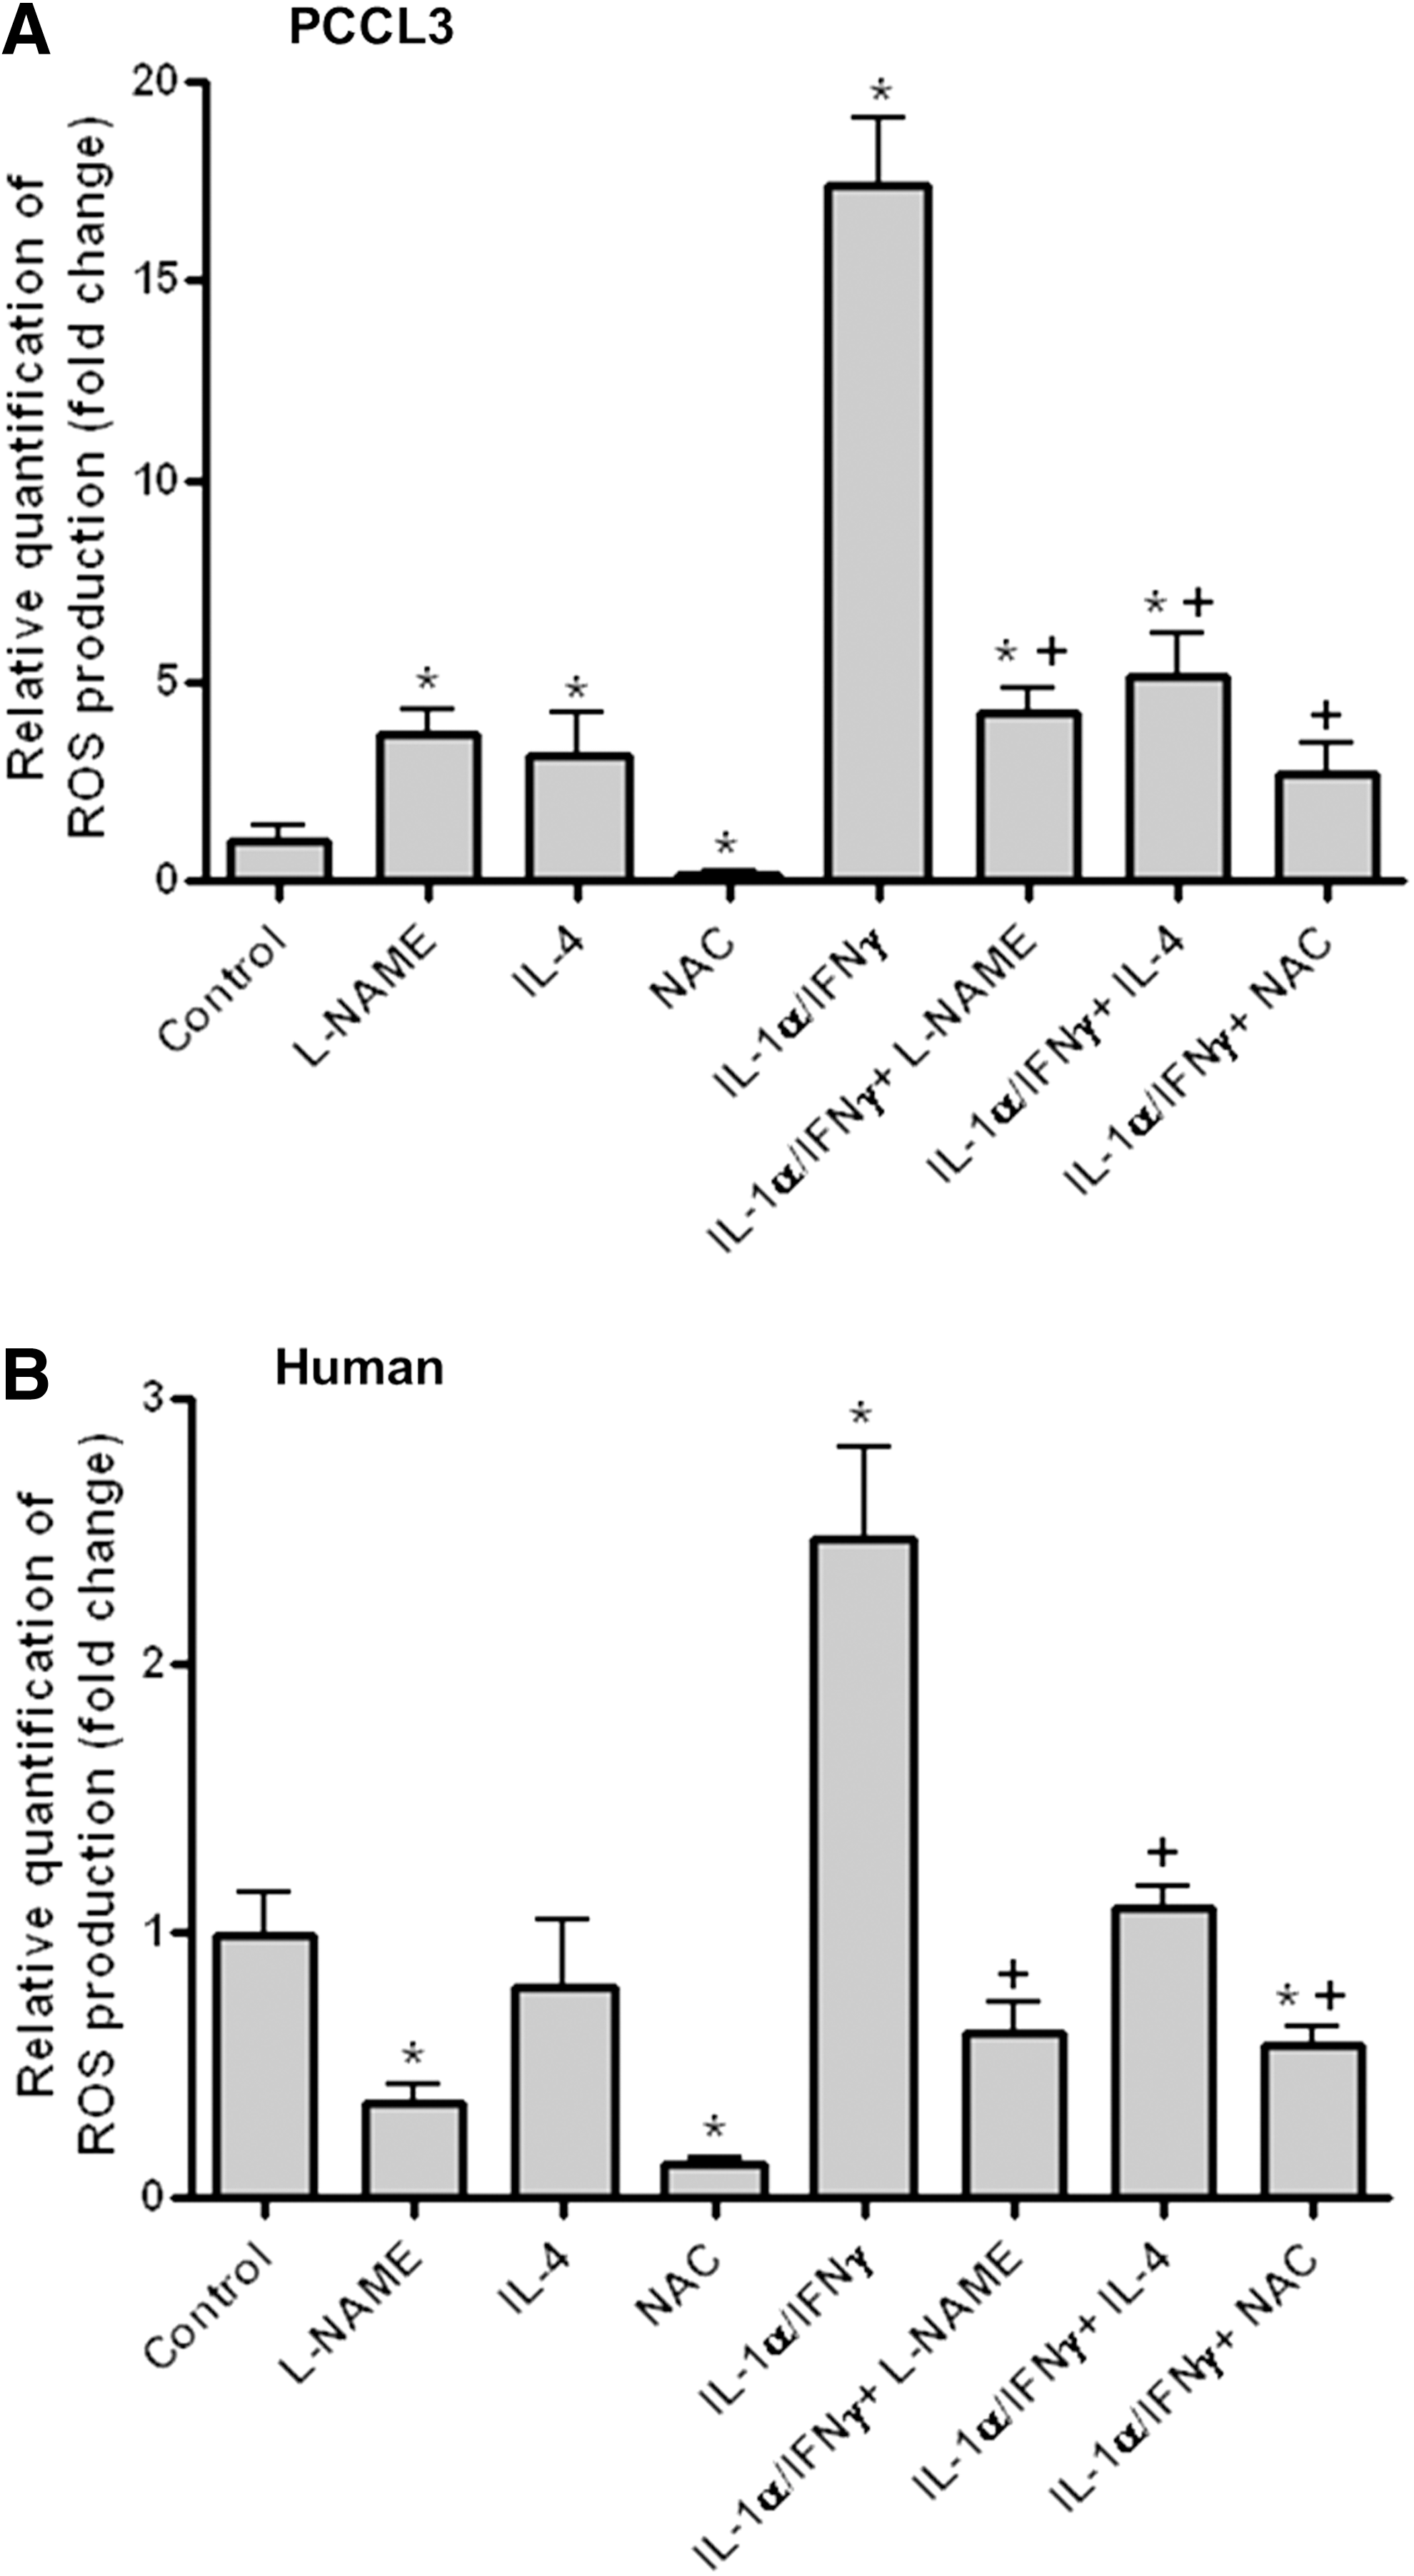
Quantification of ROS production in PCCL3
Together with previous reports that described a partial or total restoration of DUOX and TPO expression in Th1 cytokine–treated thyroid cells co-incubated with either L-NAME or IL-4 (9,10), the data presented here indicate that ROS act as important, but as discussed below, not exclusive intracellular mediators of Th1 cytokine–induced effects in thyroid cells.
Discussion
HT and Graves' disease are at either end of the spectrum of autoimmune thyroid diseases (44,45). Individuals with HT, which is predominantly a Th1 cytokine–driven disease, often experience hypothyroidism caused by cell death and/or impairment of thyroid cell function (1
–5). In addition to their role in the regulation of immune cells, Th1 cytokines can act directly on thyrocytes. For example, Th1 cytokines increase the production of MHC class I antigens, MHC class II antigens, and ICAM-1 by thyrocytes (44,46), and also induce cytotoxicity, as illustrated by the Th1 cytokine–induced production of lactate dehydrogenase by human thyrocytes (14). In addition, IL-1β and IFNγ induce Fas-activated apoptosis (47,48) and inhibit thyroid cell growth (49). Furthermore, Th1 cytokines directly interfere with thyroid cell functions without affecting cell viability, suggesting that cell death is not the sole mechanism leading to hypothyroidism in HT. IL-1α, tumor necrosis factor-α, and high doses of IFNγ inhibit iodide uptake, NIS mRNA expression (6,7), iodine incorporation, and hormone release from human thyrocytes (8). IFNα and IFNβ inhibit iodide uptake and organification, as well as thyroxine release (48,50). Th1 cytokines decrease the expression of differentiation proteins such as NIS, Tg, TPO, and DUOX (6,9
–11,51,52). Previous studies reported that the effects of Th1 cytokines on the thyroid gland are partially mediated by RNS such as NO
ROS are products of normal cell metabolism and can be either harmful or harmless depending on their nature and the amount produced (53). ROS include free radicals, including O2
One aim of this study was to get further insights into the nature of ROS produced in cells incubated with Th1 cytokines. We hypothesized that these ROS are unlikely to correspond to H2O2 produced by DUOX for two reasons. First, the tightly controlled production of H2O2 is restricted to a specific area located in cell microvilli sometimes called the thyroxisome by some authors. At this site, H2O2 is consumed during the process of TH biosynthesis and any leakage of intracellular H2O2 is readily detoxified (16 –18). Second, several studies have shown that expression levels of DUOX mRNA and protein are downregulated in thyroid cells exposed to Th1 cytokines, which suggests that H2O2 produced at the interface with the colloid is not involved in Th1 cytokine–induced pathological effects (9 –11). The lack of involvement of extracellular H2O2 was confirmed here as the exposure of thyroid cells to IL-1α and IFNγ increased the production of intracellular ROS, but decreased at the same time the production of extracellular H2O2. EPR-based examination of ROS other than H2O2 indicated that OH• is likely not involved in the response to Th1 cytokines. This is not really surprising considering the high reactivity of this toxic radical. Indeed, OH• reacts with almost all species it collides with and subsequently generates even more toxic free radicals (64). Conversely, it sounds reasonable to propose O2 •− as possible candidate among other ROS. This hypothesis is supported in part by the DCFH-DA results, even though it is known that the DCFH-DA probe cannot discriminate finely between oxidants (65). One must admit that this hypothesis is indirect as it is based on the observed increase in NOX2 mRNA expression in PCCL3 cells and in NOX2 protein expression in tissue samples of HT patients. To our knowledge, it is the first time that an increase in NOX2 mRNA expression in response to Th1 cytokines is reported in thyroid epithelial cells and that a difference in NOX2 protein expression is reported in HT patients compared with nonautoimmune controls. NOX2 is known to be induced in many cell types, including phagocytes exposed to IFN-γ, myofibroblasts undergoing carotid artery injury, cardiomyocytes undergoing acute myocardial infarction, and adipose tissue, aorta, heart, resistance artery vascular smooth muscle cells, and pancreatic islets in response to angiotensin II (43,53). Bearing in mind that NOX2 produces large amounts of O2 •− in various cell models (activated macrophages and neutrophils, vascular smooth muscle cells) (53), it makes sense to propose that O2 •− is also produced in thyroid cells in response to Th1 cytokines. As O2 •− can be readily converted into H2O2, either by spontaneous reduction or by dismutation (53,64), it is also possible that intracellular H2O2, as opposed to extracellular H2O2 produced at the interface with the colloid, is part of ROS produced in thyroid cells exposed to Th1 cytokines. As a result of the rapid reaction between O2 •− and NO• (53,65), ONOO− could also be an additional candidate, but of course this remains hypothetical and needs obviously to be further explored.
In contrast to NOX2, NOX4 mRNA expression was not affected by Th1 cytokines in this study. We looked at NOX4 because it is constitutively active in the nucleus and in the endoplasmic reticulum of thyroid cells (43), where it is upregulated during the estrous phase in female rats (66), as it is in thyroid carcinomas (67).
There are at least three ways to partially or totally inhibit the effects of Th1 cytokines on TPO and DUOX mRNA and protein expression, as well as on Tg secretion: (i) incubation of cells with increasing concentrations of TSH (9), (ii) co-incubation of Th1 cytokine–challenged cells with L-NAME (9), and (iii) co-incubation of cells with IL-4, a Th2 cytokine (10). How the two last substances influence ROS production was another question raised in this study. We show that when Th1 cytokine–challenged thyroid cells are co-incubated with either L-NAME or IL-4, there was a significant reduction in intracellular ROS production close to that obtained with NAC. Combined with data that have shown a marked or almost complete restoration of TPO and DUOX protein and mRNA expression in Th1 cytokine–treated cells incubated with either L-NAME (9,14) or IL-4 (10), there are strong arguments to claim that ROS/RNS act as intracellular mediators of Th1 cytokine–induced effects in the thyroid. However, ROS/RNS cannot be involved alone in this paradigm for at least two reasons. First, although L-NAME decreases ROS production close to that seen in NAC-treated cells, the thyroid cell function is restored, but only partially (9). Second, even though NAC fully blocks ROS production in Th1 cytokine–treated thyroid cells, TPO and DUOX expression is not only unrecovered, but even further repressed (11), suggesting that, in addition to ROS/RNS, other factors must play a role in the regulation of thyroid cells exposed to Th1 cytokines (see Fig. 7). This hypothesis opens future research perspectives, for instance, addressing the nature of intracellular pathways activated in response to IL-4 and how, beyond the blockage of ROS/RNS production, these pathways control Th1 cytokine–induced effects. Although this research is outside the scope of the present study, we do propose that the Janus kinase (JAK) and signal transducer and activator of transcription (STAT) pathway could be one of those. This proposal is supported by a recent article that described an activation of the JAK1-STAT6 cascade, a rapid induction of DUOX2/DUOXA2, and a significant increase in calcium-stimulated extracellular H2O2 production in human thyroid cells treated with IL-4 (33). These observations may otherwise explain the moderate and harmless increase in the oxidative load by IL-4 observed in the present study.
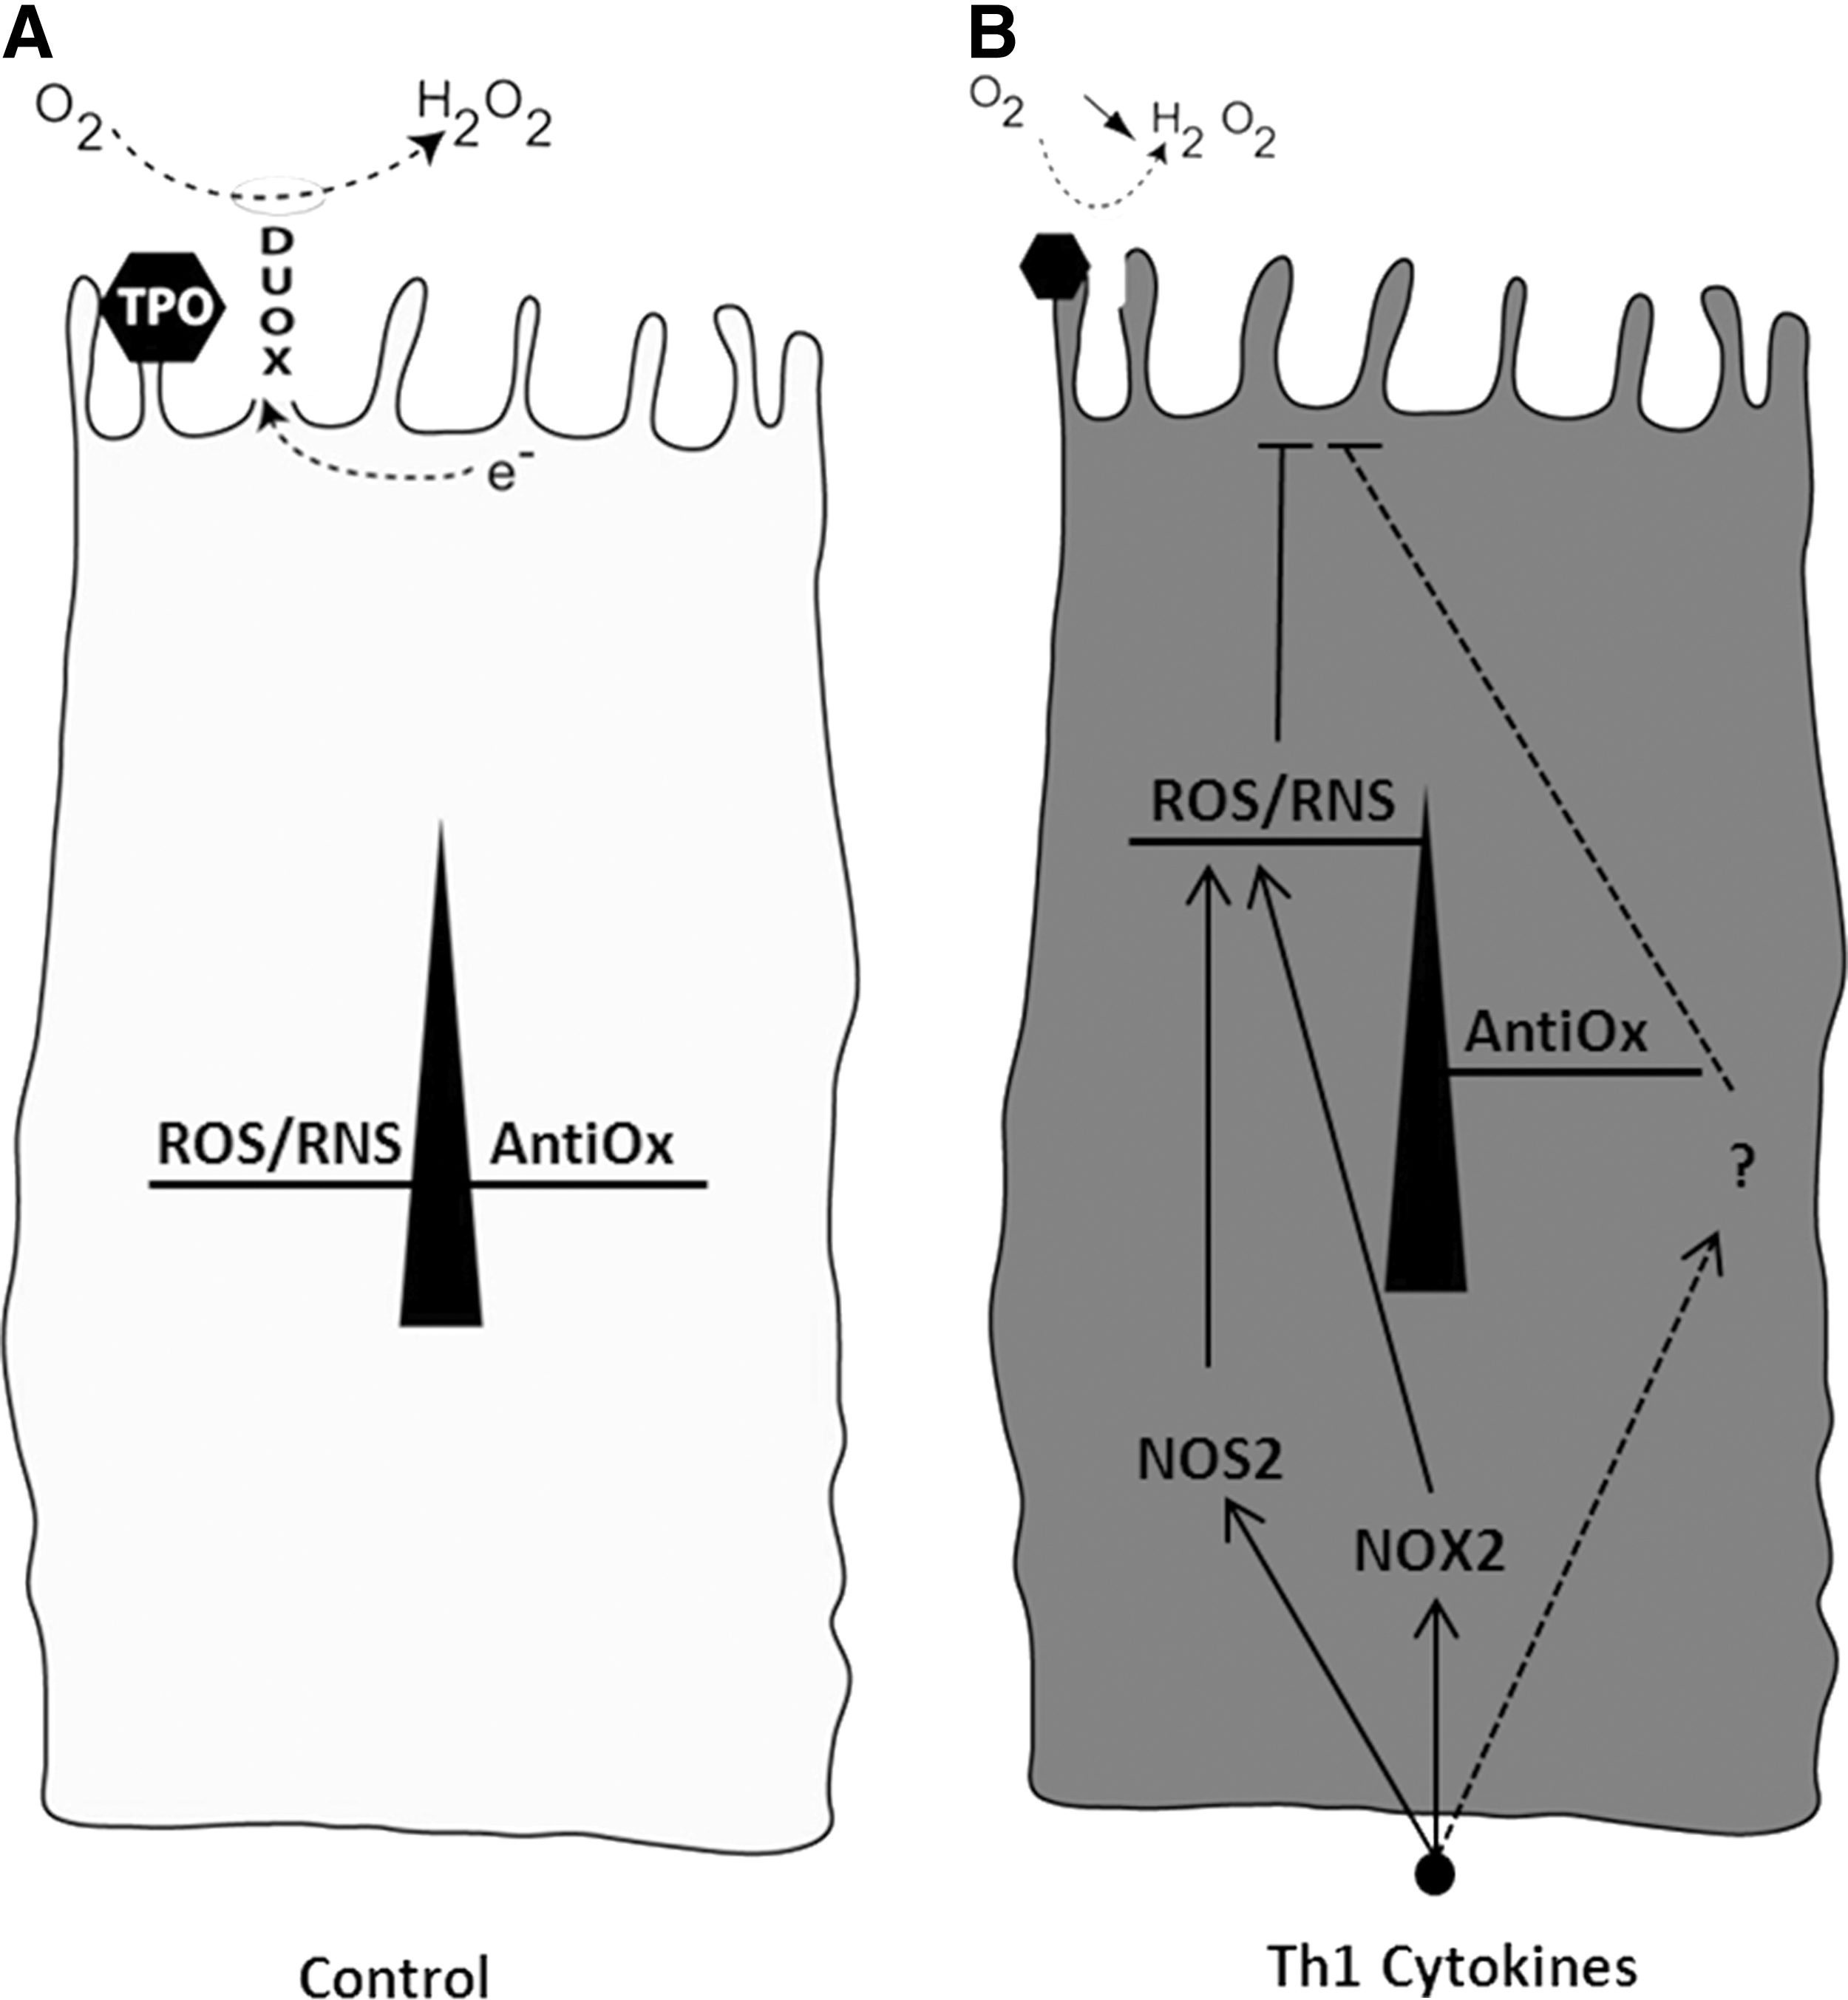
Schematic representation of the role of ROS and RNS as important, but not exclusive, intracellular mediators of Th1 cytokine–induced effects in thyroid epithelial cells.
In conclusion, this study reinforces the concept that ROS and RNS play a role in Th1 cytokine–induced alterations of thyroid cell function. Intracellular production of ROS and RNS may result from the activation of NOS/NOX enzyme complexes; DUOX being concomitantly repressed. Although ROS and RNS are important, they are unlikely to be the sole mediators of the inhibitory effects of Th1 cytokines on thyroid function and additional intracellular pathways may also play a role (Fig. 7).
Footnotes
Acknowledgments
The authors acknowledge Marie-Christine Many, Victoria Van Regemorter, and Lancelot Marique (Pôle de Morphologie, Institut de Recherche Expérimentale et Clinique) for their technical support.
Author Disclosure Statement
No competing financial interests exist.