
Abstract
Background:
Bilirubin may confer cardiovascular protection because of its strong antioxidative properties. Both thyroid dysfunction and the diabetic state affect bilirubin metabolism. Here we tested whether low-normal thyroid function affects serum bilirubin among euthyroid subjects with and without type 2 diabetes mellitus (T2DM).
Methods:
Serum total bilirubin, thyrotropin and free thyroxine (free T4), transaminases, insulin sensitivity (homeostasis model assessment), and lipids were measured in 74 T2DM and 82 nondiabetic subjects with thyrotropin and free T4 levels within the euthyroid range.
Results:
Bilirubin was positively related to free T4 in T2DM subjects (r=0.370, p<0.001), but not in nondiabetic subjects (r=0.047, p=0.68). In age- and sex-adjusted multiple linear regression analysis, free T4 was found to interact positively with the presence of T2DM on serum bilirubin (interaction term: β=0.251, p=0.024). This interaction remained present after additional adjustment for alcohol intake, aspartate aminotransferase and insulin sensitivity (interaction term: β=0.222, p=0.043), or alternatively for cholesterol and triglycerides (interaction term: β=0.203, p=0.057).
Conclusions:
Lower free T4 levels within the euthyroid range confer decreased bilirubin in T2DM. Low-normal thyroid function could enhance atherosclerosis susceptibility in T2DM by decreasing serum bilirubin.
Introduction
With few exceptions, subclinical hypothyroidism is considered to accelerate atherosclerotic cardiovascular disease (7 –10), and accordingly to represent a determinant of a greater carotid IMT (11). Interestingly, the concept is now emerging that effects of low thyroid function on atherosclerosis susceptibility may extend into the euthyroid range (12,13). Low-normal thyroid function relates not only to higher plasma levels of apolipoprotein B–containing lipoproteins, but also to the quality of these atherogenic lipoproteins, as evidenced by higher levels of oxidized low-density lipoproteins (14). In agreement, circulating levels of malondialdehyde, a marker of oxidative stress, are elevated in subclinical hypothyroidism (15). Thyroid hormone stimulates the activity of heme oxygenase, the enzyme that is responsible for bilirubin generation from heme (16,17). Thyroid hormone is also implicated in biliary bilirubin transport by decreasing the enzymatic activity of UDP-glucuronosyltransferase activity (18,19), which governs bilirubin conjugation (20,21). It is, therefore, conceivable that low-normal thyroid function is implicated in lower serum bilirubin levels.
It is well appreciated that enhanced oxidative stress plays a crucial role in the pathogenesis of vascular dysfunction as observed in type 2 diabetes mellitus (T2DM) (22 –25). Hyperbilirubinemia improves oxidative stress in rodent models, and attenuates renal damage in experimental diabetes (26). In human diabetes, higher serum bilirubin levels predict lower IMT (6), and may protect against retinopathy, albuminuria, and nephropathy (26). Of further relevance, plasma levels of heme oxygenase, a proposed treatment target to improve oxidative stress (27), are elevated in T2DM (28). In view of enhanced oxidative stress in T2DM and the supposed role of altered heme oxygenase therein, it is relevant to determine the extent by which possible effects of thyroid function status on serum bilirubin may be affected by the diabetic state.
The present study was initiated to test the hypothesis that serum bilirubin is related to variations in thyroid function within the euthyroid range. Furthermore, we evaluated whether the possible relation of serum bilirubin with thyroid function is different in T2DM subjects compared to nondiabetic individuals.
Materials and Methods
Subjects
The study was approved by the medical ethics committee of the University Medical Center Groningen, The Netherlands. Written informed consent was obtained from all participants. Participants were aged >18 years and were recruited by advertisement in local newspapers. All eligible subjects had a negative history of thyroid disease, did not show a thyroid abnormality on physical examination, had a serum thyrotropin (TSH) and a free thyroxine (free T4) level within the institutional reference range (see below), and did not have raised serum titers of anti–thyroid peroxidase and anti-thyroglobulin autoantibodies (see laboratory analyses). A medical history of liver disease or biliary tract disorders in the preceding year, current smoking, clinically manifest cardiovascular disease, and renal disease (elevated serum creatinine or urinary albumin >20 mg/L) were also exclusion criteria. T2DM had been previously diagnosed by primary care physicians using the Dutch College of General Practitioners guidelines (fasting plasma glucose ≥7.0 mmol/L and/or nonfasting plasma glucose ≥11.1 mmol/L) (29). T2DM patients were treated with diet alone or diet in combination with metformin and/or sulfonylurea. Subjects using lipid-lowering drugs, insulin, and thiazolidinediones were excluded, but the use of antihypertensive medication was allowed.
All participants were evaluated after an overnight fast. Body mass index (BMI) was calculated as weight (kg) divided by height (m) squared. Blood pressure was measured 3 times with 5-minute intervals after 15-minute rest at the left arm in sitting position using a sphygmomanometer. Alcohol consumption was estimated with one drink being assumed to contain 10 g of alcohol. Insulin resistance was estimated using homeostasis model assessment (HOMAir), and was calculated with the following equation: fasting plasma insulin (mU/L)×glucose (mmol/L)/22.5.
Laboratory analyses
Venous EDTA-anticoagulated plasma and serum samples were stored at −80°C until analysis, except for glucose, which was measured shortly after blood sampling with an APEC glucose analyzer (APEC Inc., Danvers, MA).
Serum TSH (sandwich principle; Roche Diagnostics GmbH, Mannheim, Germany; cat. no. 117314591; reference range 0.5–4.0 mU/L; interassay coefficients of variation: 3.3% and 6.3% in the lower normal and higher normal range, respectively) and free T4 (competition principle; Roche Diagnostics GmbH; cat. no. 11731297; reference range 11.0–19.5 pmol/L; interassay coefficients of variation 3.0% and 2.3% in the lower normal and higher normal range, respectively) were measured by electrochemiluminescence immunoassay using a Modulator Analytics immunoassay analyzer. Anti–thyroid peroxidase and anti-thyroglobulin autoantibodies were determined using commercially available automated enzyme-linked immunoassays (ImmunoCap cat. nos. 14-4508-35 and 14-4507-35, respectively; Phadia, Freiburg, Germany). Thyroid autoantibodies were considered to be positive using cutoff values as indicated by the supplier (anti–thyroid peroxidase autoantibodies >60 IU/mL; anti-thyroglobulin autoantibodies >289 IU/mL).
Serum total bilirubin was measured by a colorimetric assay (2,4-dichloroaniline reaction; Merck MEGA, Darmstadt, Germany). The detection limit of total bilirubin is 1.0 μmol/L; the interassay coefficients of variation amounts to 3.8% and 2.9% and the lower normal and higher normal range, respectively. In healthy subjects, bilirubin is most abundantly present in serum as unconjugated (indirect) bilirubin (30). In a validation experiment (n=80), a strong correlation between total bilirubin and indirect bilirubin (Spearman's r=0.92, p<0.001), as well as between total bilirubin and direct bilirubin (Spearman's r=0.82, p<0.001) was found. For the current analyses we only used serum total bilirubin, in keeping with other studies (31 –33).
Serum alanine aminotransferase (ALT) and aspartate aminotransferase (AST) were measured with pyridoxal phosphate activation (Merck MEGA). Standardization was performed according to International Federation of Clinical Chemistry guidelines.
Plasma cholesterol and triglycerides were assayed by routine enzymatic methods (Roche/Hitachi; Roche Diagnostics). High-density lipoprotein (HDL) cholesterol was measured with a homogeneous enzymatic colorimetric test (Roche/Hitachi). Non-HDL cholesterol was calculated as the difference between plasma total cholesterol and HDL cholesterol. Glycated hemoglobin (HbA1c) was measured by high performance liquid chromatography (Bio-Rad, Veenendaal, The Netherlands; normal range 4.6–6.1%). Insulin was measured by microparticle enzyme immunoassay (AxSYM Insulin assay; Abott Laboratories, Abbott Park, IL).
Statistical analysis
SPSS 20 was used for data analysis. Data are expressed as mean±SD or as median (interquartile range). Between-group differences were determined by unpaired t-tests or by Mann–Whitney U-tests. Between-group differences in dichotomous variables were determined by χ2 analysis. Univariate relationships were assessed using Pearson's correlation coefficients. Serum total bilirubin, transaminases, plasma triglycerides, insulin, and HOMAir values were logarithmically transformed because of skewed distribution (Kolmogorov–Smirnov test: p<0.01 for each). TSH and free T4 values were normally distributed (Kolmogorov–Smirnov test: p=0.27 and p=0.35, respectively).
Multiple linear regression analyses were performed to disclose the independent contribution of variables to serum bilirubin. Interaction terms were calculated as the product term between free T4 and diabetes status and between free T4 and sex. To this end, a distribution of free T4 (as continuous variable) centered to the mean was made by subtracting the group mean value from the individual values. This procedure was done in order to avoid relying on values in the highest and lowest range in linear regression analysis. Interaction terms were considered to be statistically significant at a two-sided p-value <0.10 as recommended by Selvin (34), as well as by the Food and Drug Administration authorities (35). Otherwise, the level of significance was set at two-sided p-values <0.05.
Results
Eighty-two T2DM subjects and 74 nondiabetic subjects participated in the study. Among T2DM subjects, diabetes duration was 5.4 (4.0–6.5) years. Eighteen T2DM subjects were treated with diet alone, whereas 15 subjects used metformin, 15 used sulfonylurea, and 24 used both drugs combined. Other glucose-lowering drugs were not taken. Thirty-one T2DM subjects received antihypertensive medication of which angiotensin-converting enzyme inhibitors, angiotensin II antagonists, and diuretics (alone and in combination) were most frequently used. Antihypertensives were not taken by nondiabetic subjects. Among nondiabetic subjects, one premenopausal woman and two postmenopausal women used estrogens. The diabetic women did not use estrogens.
T2DM subjects were older than nondiabetic subjects, but sex distribution was not significantly different between the groups. Systolic and diastolic blood pressure, BMI, plasma glucose, and HbA1c levels as well as plasma insulin and HOMAir were higher in T2DM subjects (Table 1). TSH values were not different between T2DM and nondiabetic subjects, whereas free T4 values were slightly higher in T2DM subjects (Table 1). Furthermore, ALT was higher in T2DM subjects, but serum total bilirubin and AST were not significantly different between the groups (Table 1). Plasma total cholesterol and HDL cholesterol were lower, whereas triglycerides were higher in T2DM. Non-HDL cholesterol was similar in the groups.
Data in mean±SD or in median (interquartile range).
ALT, serum alanine aminotransferase; AST, serum aspartate aminotransferase; BMI, body mass index; HbA1c, glycated hemoglobin; HDL, high-density lipoprotein; HOMAir, insulin resistance was estimated using homeostasis model assessment; T4, thyroxine; TSH, thyrotropin.
In univariate analysis, bilirubin was correlated positively with free T4 in T2DM. In contrast, no correlation of bilirubin with free T4 was observed in nondiabetic subjects (Table 2; Fig. 1). Bilirubin was not related to TSH in either group. In T2DM subjects and in nondiabetic subjects separately, bilirubin was not significantly correlated with transaminases, insulin, and HOMAir (Table 2). In T2DM subjects, the relationships of bilirubin with glucose and HbA1c were not significant (correlation between glucose and HbA1c: r=0.585, p<0.001). In nondiabetic subjects, bilirubin was correlated positively with glucose, but negatively with HbA1c (correlation between glucose and HbA1c: r=−0.046, p>0.80). Furthermore, only in T2DM, bilirubin was correlated inversely with plasma total cholesterol (r=−0.339, p=0.003), non-HDL cholesterol (r=−0.375, p=0.001), and triglycerides (r=−0.465, p<0.001). Serum bilirubin was not correlated with BMI in each group (p>0.80). In the combined subjects, bilirubin was correlated positively with free T4, AST, insulin, and HOMAir (Table 2), and inversely with total cholesterol (r=−0.178, p=0.026), non-HDL cholesterol (r=−0.207, p<0.010), and triglycerides (r=−0.326, p<0.001). Furthermore, in the combined subjects, bilirubin was higher in men (11 [9–14] μmol/L) than in women (8 [7–12] μmol/L, p=0.002), and in subjects using ≥10 g of alcohol per day (11 [9–14] μmol/L)) than in subjects using <10 g of alcohol per day (9 [7–12] μmol/L, p=0.013).
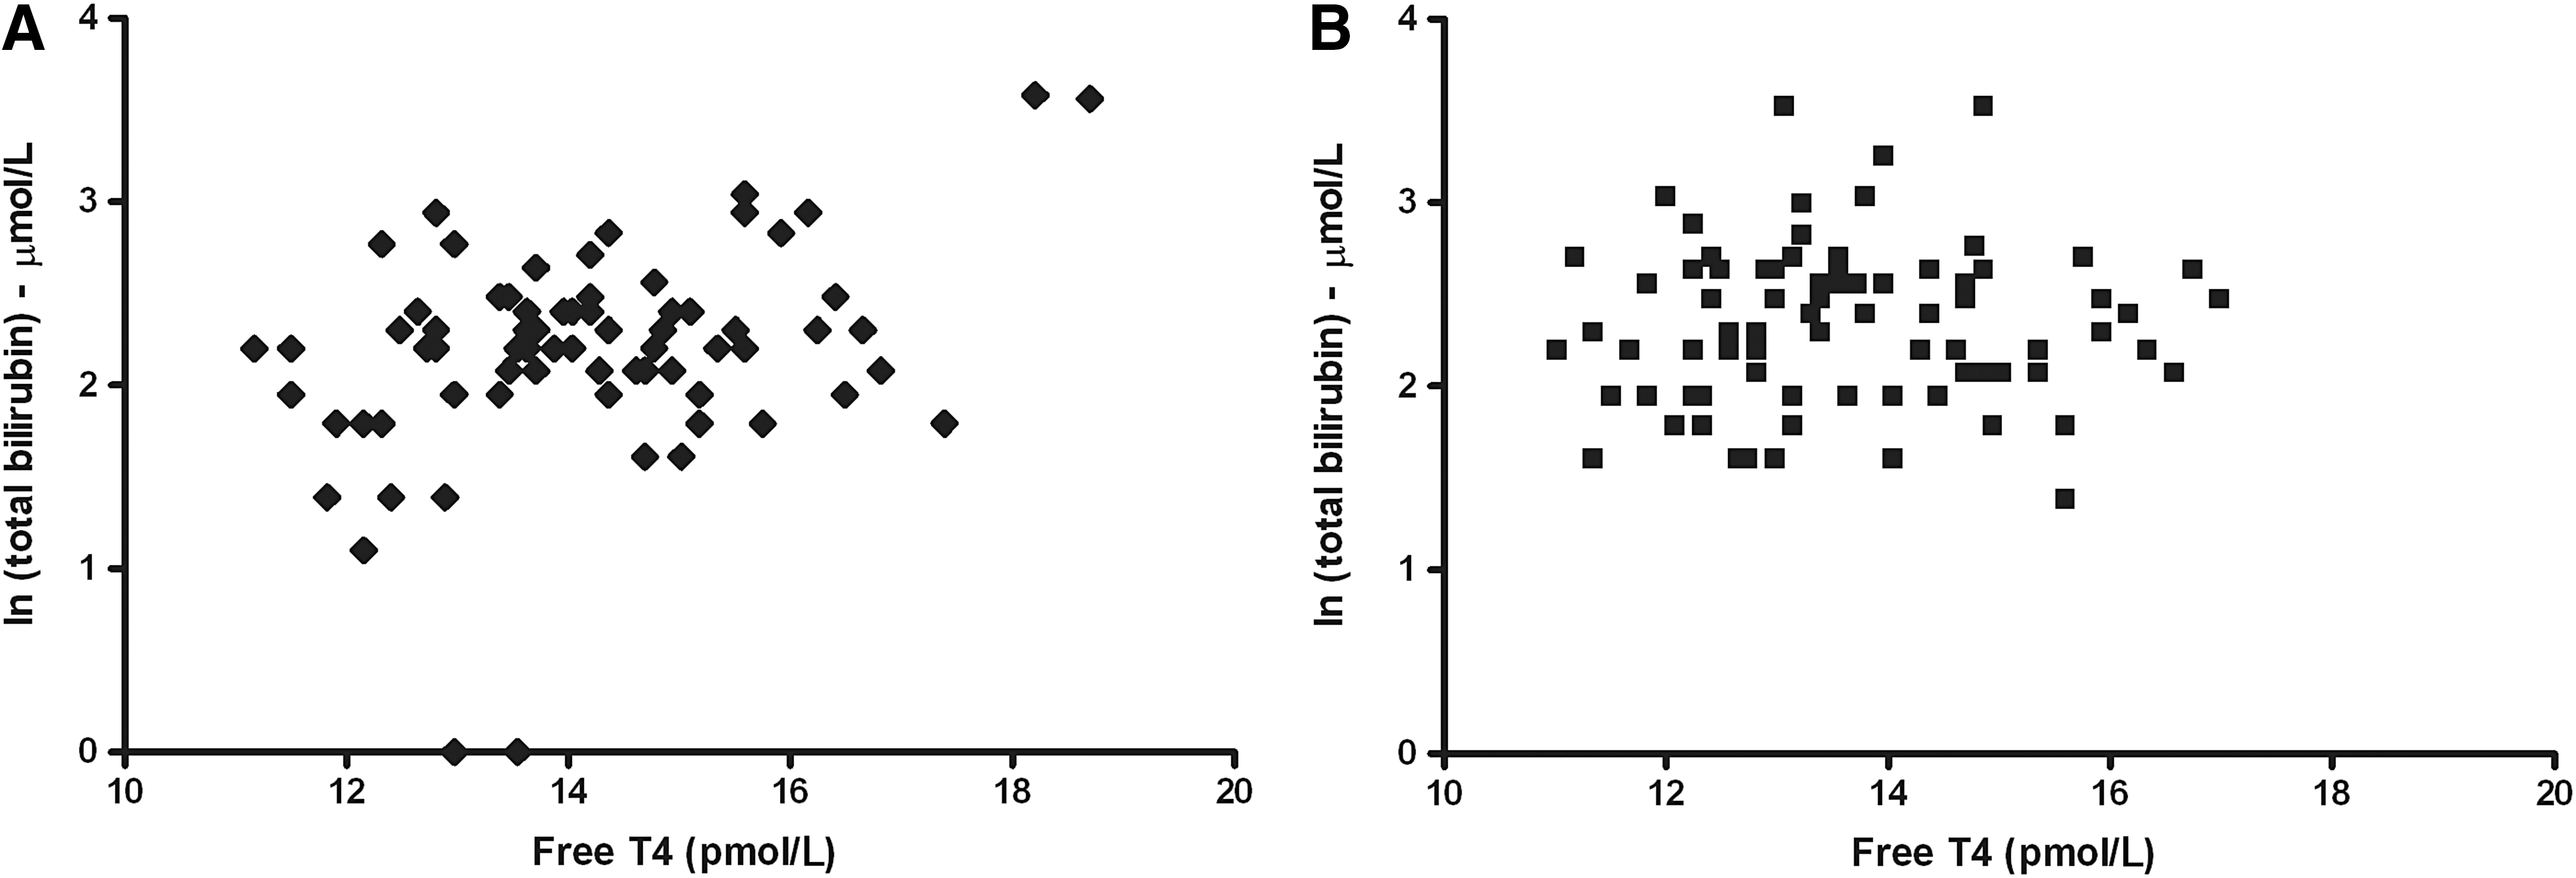
Relationship of free T4 with serum total bilirubin in type 2 diabetic subjects
Pearson correlation coefficients are shown. ALT, AST, insulin, and HOMAir values are logarithmically transformed.
p≤0.05; ** p<0.001; *** p<0.001.
We first carried out multiple linear regression analysis to test a possible interaction of sex with free T4 on bilirubin. There was no interaction of free T4 with sex on bilirubin (interaction term: β=−0.066, p=0.54), thus allowing for further analysis in both sexes together. Subsequently, we established the extent to which serum bilirubin was independently related to diabetes status and free T4. In age- and sex-adjusted analysis, bilirubin was related inversely with the presence of diabetes and positively with free T4 (Table 3, model A). It was then determined whether the relationship of serum bilirubin with free T4 was different in subjects with and without T2DM, as suggested by univariate regression analysis. Indeed, there was a positive interaction of free T4 with diabetes status on serum bilirubin (Table 3, model B), as graphically depicted in Figure 2. This interaction remained present after additional adjustment for alcohol use (dichotomized as <10 g per day and ≥10 g per day), AST, and HOMAir (Table 3, model C), that is, nonlipid variables with which bilirubin was found to be related in univariate analysis. In an additional analysis with adjustment for plasma cholesterol and triglycerides, the interaction of free T4 with diabetes status on bilirubin was essentially unaltered (Table 3, model D). This interaction was also unchanged when total cholesterol was replaced by non-HDL cholesterol (β=0.205, p=0.055; data not shown). Finally, when all these variables were included together in an analysis that also accounted for the use of glucose-lowering drugs and antihypertensive medication, the interaction of free T4 with diabetes status on serum total bilirubin was still present (β=0.182, p=0.086; data not shown). Taken together, these analyses suggested that lower free T4 levels confer decreased serum total bilirubin levels in the context of T2DM.
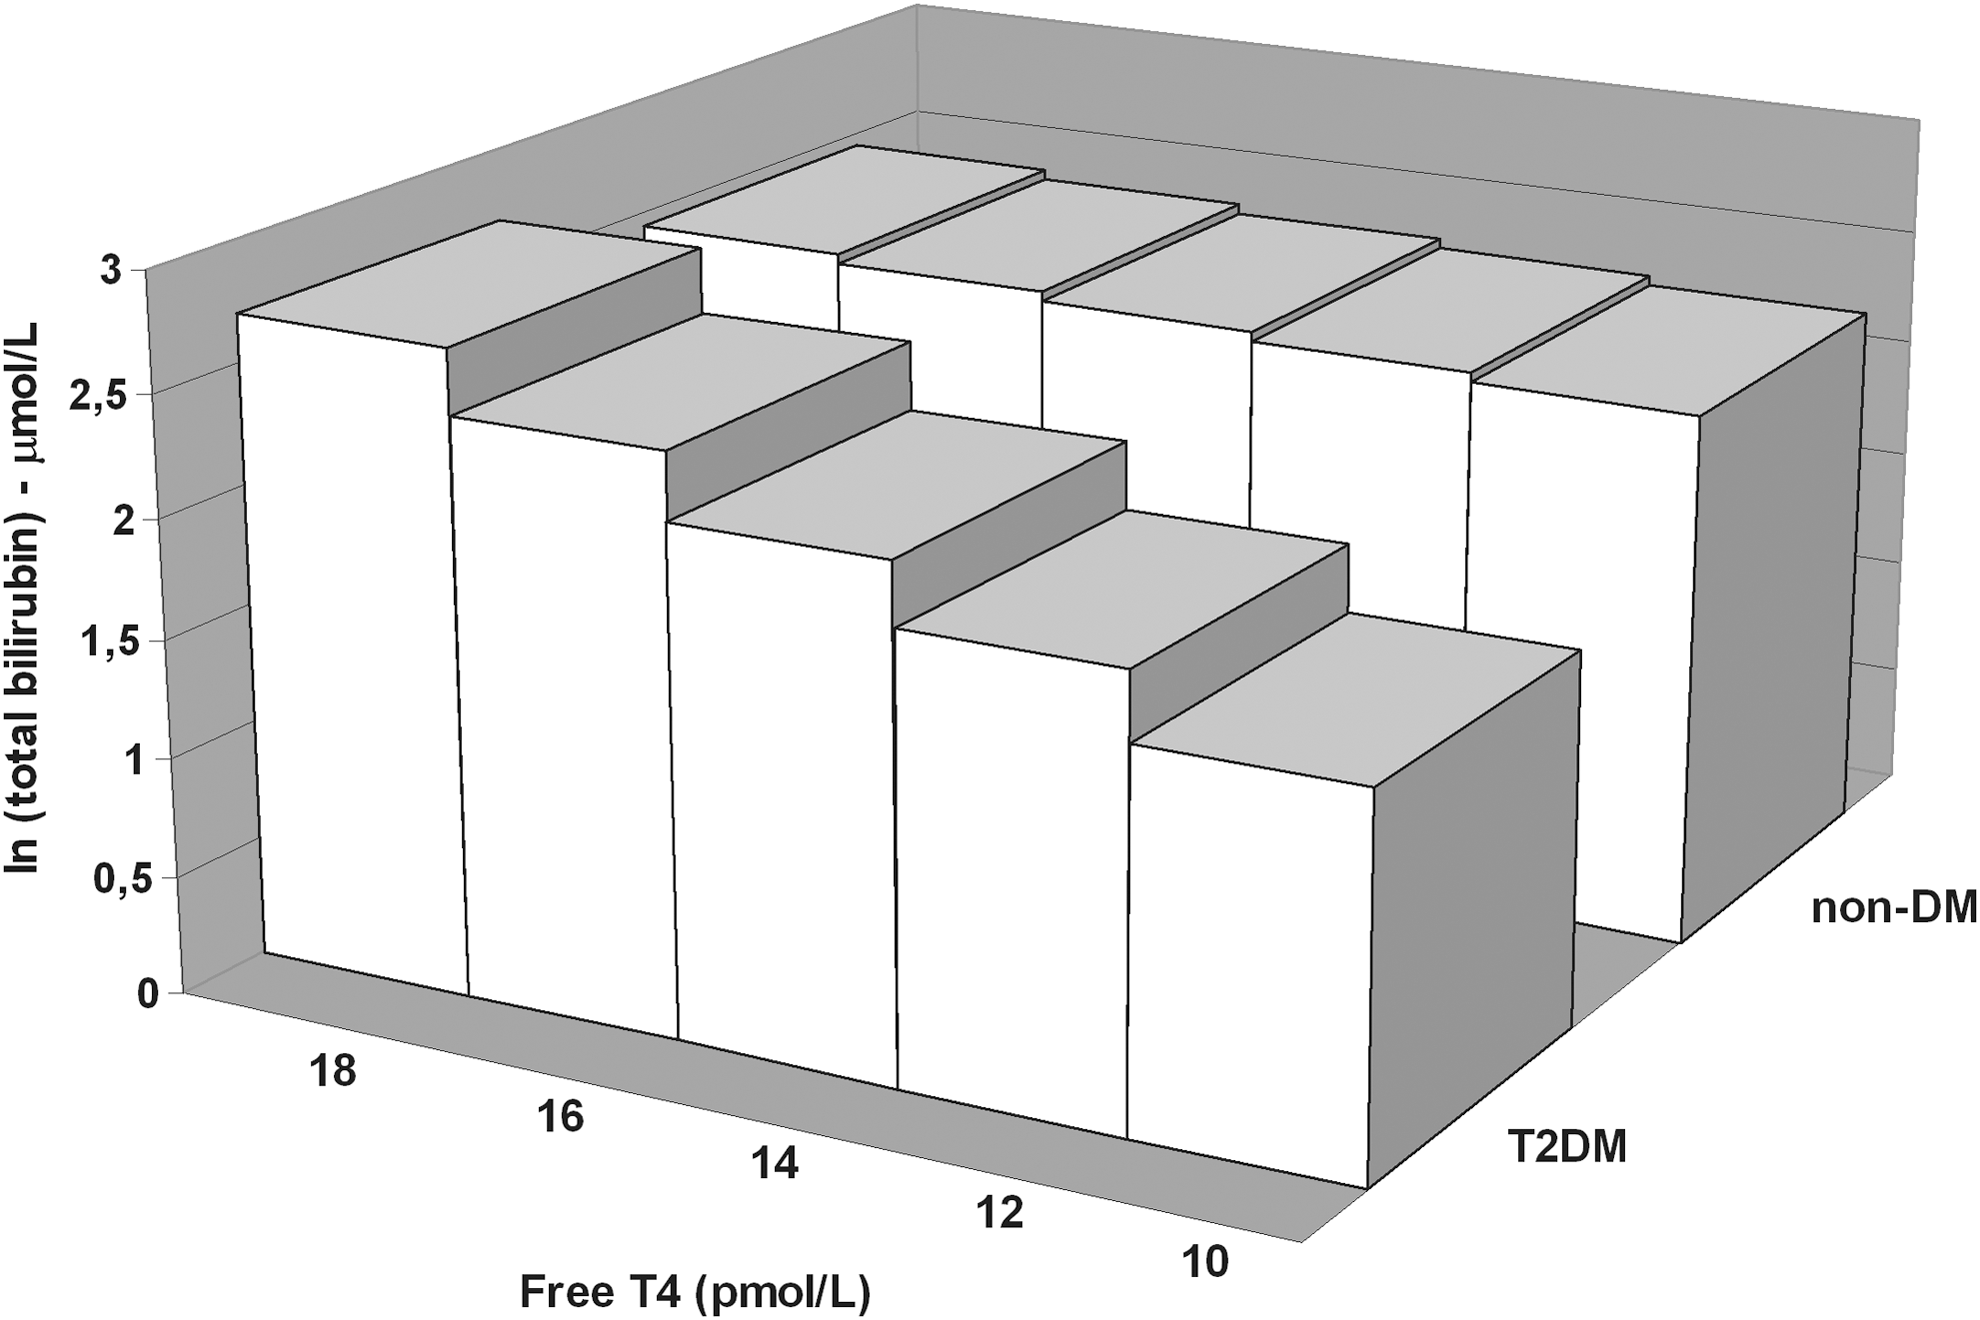
Graphical presentation of the interaction of free T4 with diabetes status on serum bilirubin. The standardized regression coefficient of the interaction term obtained by the multiple linear regression analyses as shown in Table 3 (model B) is used. T2DM, type 2 diabetes mellitus.
Model A includes age, sex, diabetes status, and free T4; model B includes age, sex, diabetes status, free T4, and interaction of diabetes status with free T4; model C additionally includes alcohol intake, AST, and HOMAir; model D additionally includes total cholesterol and triglycerides. Serum total bilirubin, AST, HOMAir, and triglycerides are logarithmically transformed.
β, standardized regression coefficient; T2DM, type 2 diabetes mellitus.
Discussion
In this report we have demonstrated for the first time that serum total bilirubin levels are positively related to free T4 in euthyroid individuals with T2DM, but not in nondiabetic subjects. Multiple linear regression analysis demonstrated a positive interaction of free T4 with diabetes status on serum bilirubin, suggesting that this relationship was indeed different in diabetic compared to nondiabetic subjects. This interaction was essentially unaltered, taking into account of a number of relevant confounders, including alcohol intake, aspartate aminotransferase, insulin sensitivity, plasma lipids, as well as glucose-lowering drugs and antihypertensive medication. Thus, current results are consistent with the hypothesis that low-normal free T4 levels may represent a determinant of lower serum bilirubin in diabetic subjects.
In the present study, only strictly euthyroid individuals were included. Free T4 levels were slightly higher in T2DM subjects. In agreement, a recent report showed higher free T4 levels in subjects with T2DM or impaired glucose tolerance (36). In contrast, an early study showed lower thyroid hormone levels in severely hyperglycemic diabetic subjects that were normalized after glucose-lowering treatment (37). In univariate analysis, serum bilirubin was not significantly different between diabetic and nondiabetic subjects, but the diabetic state predicted lower bilirubin levels when free T4 levels were taken into account, as suggested by multiple linear regression analysis. As such, these findings are in line with the generally held contention that higher serum bilirubin levels protect against diabetes development (26). It is tempting to speculate that higher free T4 in T2DM could operate as a defense mechanism counteracting decreasing effects of the diabetic state as such on bilirubin. Surprisingly, few reports have, however, documented the extent to which serum bilirubin levels are modified in metabolic situations, such as diabetes mellitus and metabolic syndrome in which enhanced oxidative stress may aggravate atherosclerosis development. Increased serum bilirubin levels were observed in type 2 diabetic although not in type 1 diabetic subjects in another study (38). Somewhat unexpectedly, bilirubin was not significantly related to metabolic control in T2DM subjects in our study, which could possibly be explained by participation of predominantly well-controlled diabetic subjects. Of further note, bilirubin was correlated inversely with HbA1c in nondiabetic subjects. Although these findings agree with a larger study among nondiabetic Japanese people (39), the relevance of this relationship in our study is unclear, because we also observed a positive correlation with fasting plasma glucose. As expected, ALT was higher in T2DM coinciding impaired insulin sensitivity, probably reflecting increased hepatic fat accumulation (40,41). Importantly, the interaction of free T4 with the presence of T2DM impacting on bilirubin remained present, when metabolic factors were controlled for in multiple linear regression analysis.
Well-documented increased oxidative stress as observed in the diabetic state (22,23), as well as in conjunction with lower thyroid functional status (14,15), endorsed our main rationale to test whether variations in thyroid hormone levels within the normal range affect serum bilirubin in the context of chronic hyperglycemia. Of note, the robust elevations in heme oxygenase in T2DM and the role of thyroid function in its regulation (19,20,28) raise the possibility that thyroid functional status and T2DM share common mechanisms involved in bilirubin metabolism. Although it seems plausible that heme oxygenase–related metabolic pathways could contribute to the positive effect of free T4 thyroid on bilirubin only in T2DM, it is obvious that the precise mechanisms responsible for this relationship remain unclear at present. We consider our current findings with regard to the relationship of free T4 with serum bilirubin in T2DM to be hypothesis generating. Further studies are required to replicate our findings, and to delineate the precise underlying metabolic basis of the impact of thyroid hormone on serum bilirubin in the context of T2DM.
Several methodological aspects and limitations of our study need to be considered. First, we performed a cross-sectional study. Therefore, cause–effect relationships cannot be established with certainty. Nonetheless, it is plausible that bilirubin metabolism is causally affected by thyroid functional status, in view of the stimulatory effect of thyroid hormone on heme oxygenase and the inhibitory effect on UDP-glucuronosyltransferase, which represent key enzymes responsible for bilirubin generation and biliary transport, respectively (18 –21). On the other hand, it is very unlikely that decreased free T4 levels were instead dependent on increased serum bilirubin, because bilirubin does not affect the integrity of the pituitary–thyroid axis (42). Second, subjects using lipid-lowering drugs were excluded from participation. This selection criterion was primarily chosen since statin use may be associated with lower bilirubin levels (43). As a result, T2DM subjects with relatively mild lipoprotein abnormalities preferentially participated, making that their plasma total cholesterol was slightly lower in conjunction with expectedly lower HDL cholesterol and increased triglyceride levels. In the present study, non-HDL cholesterol was indeed not different between diabetic and nondiabetic subjects. Of note, the interaction of free T4 with diabetes status impacting on serum bilirubin was also not relevantly attenuated after adjustment for cholesterol and triglycerides, indicating that the relatively mild dyslipidemia did not substantially confound the interpretation of our current results. Since bilirubin levels could be affected by metformin (6), it is also important that this interaction was not appreciably modified when taking the use of glucose-lowering drugs into account.
In conclusion, this study suggests that low-normal thyroid function may be a determinant of lower serum total bilirubin levels in euthyroid T2DM subjects. Since bilirubin is a pathophysiologically relevant natural antioxidant, it is plausible to postulate that low-normal thyroid functional status could contribute to increased atherosclerosis susceptibility in euthyroid T2DM by aggravating oxidative stress. Our findings warrant prospective evaluation to discern the extent to which more overt hypothyroidism and its treatment affects serum bilirubin in T2DM.
Footnotes
Acknowledgments
This study is in part supported by Grant 2001.00.012 from the Dutch Diabetes Research Foundation. We appreciate the dedicated technical assistance of Dr. R. de Vries, MD, PhD, in performing the clinical experiments. Thyroid function parameters were determined in the laboratory of Dr. A.C. Muller-Kobold, Laboratory Center, University Medical Center Groningen, Groningen, The Netherlands.
Author Disclosure Statement
No competing financial interests exist.