
Abstract
Background:
The hierarchical model of solid tumor proposes the existence of rare tumor cell subpopulations with stem-cell properties. The glycoprotein prominin-1 (CD133) represents one of the cancer stem-cell markers in several tumor types. The CD133+ cell subpopulation was shown to be enriched for tumor-initiating and highly chemoresistant cells in human cancer(s).
Methods:
We investigated whether CD133+ cells derived from human medullary thyroid carcinoma (MTC) possess tumor-initiating properties in vivo and exhibit differential responses to chemotherapeutic agents. We demonstrated that separated CD133+ cells from the human MTC cell line TT are enriched for tumor-initiating cells as demonstrated by tumor formation in vivo. Nevertheless, TT CD133+ cells do not exhibit increased chemoresistance in comparison to parental cells. However, when MTC xenotransplants were treated with the chemotherapeutic drug 5-fluorouracil (5FU) in vivo, CD133 expression increased in MTC cells.
Results:
This cell line, designated FTTiv isolated from the drug-exposed xenotransplants, exhibits a significantly different response to 5FU associated with the substantial change in the expression profile of genes involved in 5FU metabolism and drug resistance. Moreover, the CD133+ tumor-initiating subpopulation derived from these drug-exposed FTTiv cells is significantly more resistant to 5FU and retains the chemoresistant properties upon FTTiv culture propagation.
Conclusions:
These data suggest that the chemoresistant phenotype and the CD133+ MTC subpopulation emerged in response to chemotherapy in vivo.
Introduction
M
Recent data suggests that thyroid cancer might originate from a small subpopulation of so-called cancer stem cells (6,7). Tumors follow a similar pattern of hierarchical organization as other tissues and organs within the body (8). Thyroid cancer stem-like cells should possess the capability of cell population maintenance independently from the cell input—self-renewal. These cells should be capable of giving rise to more differentiated progenitor cells and recapitulating the tumor in vivo. However, these cells may represent a variable proportion in the tumor, which can be minor (∼1%) with a quiescent or slowly proliferating nature that is generally highly chemo- and radioresistant (9,10).
Several markers were associated with cancer stem-cell subpopulations, such as prominin-1 (CD133), aldehyde dehydrogenase 1 A1, hyaluronate receptor (CD44), and others [reviewed in Lloyd et al. (7) and Keysar and Jimeno (11)]. Initially, Zito et al. reported the existence of a CD133+ subpopulation and its cancer stem-cell-like properties in anaplastic thyroid cancer cell lines in vitro (12). The existence of a CD133+ cell subpopulation with chemo- and radioresistant properties in anaplastic thyroid cancer was reported (13,14). In MTC cell lines, the existence of CD133+ cells with self-renewing properties was demonstrated in vitro (15). However, the studies by Todaro et al. and Li et al. demonstrated the absence of CD133 expression in anaplastic thyroid tumors, and suggested that ALDHhigh cells represented the thyroid cancer stem-cell population (16,17).
Mechanisms of cancer stem-cell resistance may include preferential activation of DNA damage checkpoint (18), and increased drug exclusion by efflux pumps (14), including the multidrug resistance protein ABCG2 (19). Moreover, Todaro et al. have shown that CD133+ colon cancer cells possess stem-cell properties and have inherently higher resistance to 5FU and oxaliplatin (20). CD133+ cells were largely inert to chemotherapeutic drug-induced apoptosis, and the ED80 values indicated an approximate 60-fold increase in resistance to 5FU. The authors also demonstrated the chemoresistance in vivo, as the xenograft treatment resulted in reduction of tumor size but a significant increase in the proportion of CD133+ tumor cells, thereby demonstrating their survival advantage. Key determinants of the 5FU intracellular metabolism belong to the enzymes involved in the nucleotide metabolic pathways (21,22). The role of thymidylate synthase (TS), thymidylate phosphorylase (TP), orotate phosphoribosyltransferase (OPRT), and dihydropyrimidine dehydrogenase (DPD) was previously described. The expression ratio of these particular genes can be used as a predictive marker for the clinical responses to 5FU (23,24). Furthermore, some of the cancer cells can also overexpress the multidrug resistance proteins such as ABCC5 and ABCC11 contributing to efflux of 5FU metabolites, and thus linked to the 5FU resistance (25 –27).
Previously we have demonstrated a good response of the human model MTC cell line TT to 5FU treatment in vitro (28). We have achieved IC50 (5FU)=0.63 μg/mL, which is below the plasma concentration of 5FU (∼1.5 μg/mL). This is in contrast to the 5FU refractoriness of the tumor xenotransplants derived from the TT cells in vivo. 5FU administration did not result in any decrease in tumor volume, a finding well in line with the results of clinical trials with systemic chemotherapy in MTC patients. Our major aim in this study was to investigate whether the MTC TT cell line contains a CD133+ subpopulation with chemoresistant properties responsible for the refractoriness to 5FU in vivo. We could show that the CD133+ fraction of MTC cells was enriched for tumor-initiating cells by their capability to initiate xenograft growth in vivo. TT CD133+ cells initially responded to 5FU treatment similar to parental or TT CD133− cells. Highly 5FU-resistant CD133+ cells emerged in the in vivo drug-exposed cells expanded from MTC xenotransplants, and these retained their chemoresistant phenotype upon long-term propagation of derived FTTiv cells.
Material and Methods
Chemicals
The following drugs and substances were used: 5-fluorouracil (5FU), raltitrexed monohydrate, gimeracil (Sigma, St. Louis, MO), doxorubicin (Ebewe Pharma, Unterach am Attersee, Austria), 5-chloro-6-(1-(2-iminopyrrolidinyl) methyl) uracil hydrochloride (TPI, kindly prepared and provided by Dr. R. Nencka, Prague, Czech Republic), and vincristine (Gedeon-Richter, Budapest, Hungary).
Cell line
The epithelial adherent TT cell line (ATCC. No. CRL-1803™) derived from human MTC was purchased from ATCC and cultured as described (28). Cell-line authentication was performed by STR profiling. FTTiv is a derived of the TT cell line prepared in our laboratory as described in detail below. These cells were derived from TT xenotransplants from 5FU-treated immunodeficient mice. Treated tumors were excised, cut into small pieces, enzymatically/mechanically dissociated, and adherent outgrowing tumor cells subsequently expanded. The identity of the tumor cells was confirmed based on the immunophenotype (EpCAM positivity >98%), neuroendocrine marker positivity, calcitonin and carcinoembryonic antigen expression and secretion by methods described previously (28,29).
Luminescence viability assay
Relative cell viability was evaluated by CellTiter-Glo™ Luminescent Cell Viability Assay (Promega Corporation, Madison, WI). Quadruplicates of 15,000 cells/100 μL per well were seeded in white-walled 96-well plates two days prior to the start of the experiment. Drugs with or without inhibitors were diluted in culture media and added in the appropriate concentration, and cells were incubated for 9–14 days. Relative viability was determined on a LUMIstar Galaxy reader (BMG Labtechnologies, Offenburg, Germany). Values were expressed as an average relative viability±SD, when luminescence of untreated cells was taken as 100%. Experiments were repeated at least twice with similar results, and one representative result is shown.
Kinetic proliferation assay
A total of 15,000 parental TT or FTTiv cells or 25,000 viable CD133+ separated cells were seeded in 96-well plates (CytoOne, Starlab GmbH, Hamburg, Germany) and incubated for 15 days in the presence or absence of 5FU. Images were taken every three hours by the IncuCyte ZOOM™ Kinetic Imaging System (Essen BioScience, Welwyn Garden City, United Kingdom). Cell confluence was evaluated by IncuCyte ZOOM software 2012A based on processing definitions and confluence mask appropriate for the FTTiv and TT cells. Data were expressed as mean relative cell confluence of quadruplicates±SD.
Apoptosis assay
Quadruplicates of 30,000 TT or FTTiv cells per well were seeded in 96-well white-walled plates 48–72 hours prior to treatment start. Time and drug doses ≥IC90 were chosen based on preliminary experiments to induce maximum caspase activation. Caspase-3/7 activity was determined by the Caspase-Glo® 3/7 Assay (Promega Corporation) on a LUMIstar Galaxy reader (BMG Labtechnologies) five days later. Values were expressed as an average of relative luminescence units (RLU)±SD. Experiments were repeated at least twice with similar results, and a representative result is shown.
Multiplex viability/apoptosis assay
Triplicates of 15,000 CD133+, CD133−, or parental cells per well were seeded in 96-well white-walled plates 24 hours prior to the start of treatment. Time and drug doses ≥IC90 were chosen based on preliminary experiments to induce caspase activation. Cell viability and caspase-3/7 activity was determined by the ApoLive-Glo™ Multiplex Assay (Promega Corporation) on a FLUORIstar Optima and a LUMIstar Galaxy reader (BMG Labtechnologies) 72 hours later. Values were expressed as an average of relative viability determined as a fluorescent signal and relative caspase-3/-7 activity in RLU±SD. Experiments were repeated at least twice with similar results, and a representative result is shown.
Chemiluminescent BrdU cell proliferation enzyme-linked immunosorbent assay
Triplicates of 15,000 cells per well were seeded in 96-well black-walled plates 48 hours prior to the start of treatment. Cells were treated with the indicated concentration of 5FU for four and six days. Then the medium was replaced for standard culture medium for the following three days. BrdU was added to the wells 18 hours prior to evaluation. Time and drug doses were chosen based on preliminary experiments. BrdU incorporation was determined by the cell proliferation enzyme-linked immunosorbent assay (ELISA), a BrdU positivity (chemiluminescent; Roche Diagnostics, Mannheim, Germany) on a LUMIstar Galaxy reader (BMG Labtechnologies). BrdU incorporation of cells incubated without 5FU was taken as 100%. Values were expressed as an average of relative BrdU incorporation±SD. Experiments were repeated twice with similar results, and a representative result is shown.
Immunomagnetic separation
In order to separate the CD133+ cell subpopulation from parental TT and FTTiv cultures, a MACS® positive cell separation protocol with CD133 MicroBeads (Miltenyi Biotec, Gladbach, Germany) was used according to the manufacturer's recommendation. Briefly, separation was performed with 50–75×106 parental cells loaded onto a MACS® MS Column placed in the magnetic field of a MACS Separator. Flowthrough from the column was collected as the CD133− negative fraction. Columns were washed three times, and then the positive fraction of CD133+ cells was eluted and used in subsequent experiments.
Gene expression analysis
Total RNA was isolated from 5×10⁶ cells by RNeasy mini kit (Qiagen, Hilden, Germany) and treated on the column with RNase-free DNase (Qiagen). RNA was reverse transcribed with the RevertAid™ H minus First Strand cDNA Synthesis Kit (Fermentas, Hanover, MD).
A quantitative polymerase chain reaction (PCR) was performed in 1× ABsolute™ QPCR SYBR® Green Mix (ABgene, Surrey, United Kingdom), 0.16 μM primers, and 500 ng of template cDNA on Bio-Rad CFX96™, and analyzed by Bio-Rad CFX Manager software v1.6. Primer sequences for CD133 and HPRT1 were as follows: CD133for, 5′-TTG TGG CAA ATC ACC AGG TA-3′; CD133rev, 5′-TCA GAT CTG TGA ACG CCT TG-3′; HPRT1for, 5′-TGA CAC TGG CAA AAC AAT GCA-3′; HPRT1rev, 5′-GGT CCT TTT CAC CAG CAA GCT-3′. Other primer sequences were used as previously published (30,31). PCR products were resolved on 2% agarose or 4% MetaPhor® Agarose gels (Lonza, Rockland, ME) for qualitative analysis. Relative gene expression change was calculated according to the ΔΔCt method. GAPDH and HPRT1 gene expression was taken as endogenous reference. Analysis was performed three times in duplicates, and data were expressed as means±SD.
For the expression array, total RNA from CD133+ subpopulations and parental cells was isolated by the Agilent Total RNA isolation Mini kit (Agilent Technologies, Santa Clara, CA), reverse transcribed with RT2 First strand kit (SABiosciences™—a Qiagen Company, Frederik, MD) and mixed with RT2 SYBR® Green qPCR Mastermix (SABiosciences™). Drug transporter expression was analyzed by RT2 Profiler PCR Array Human Drug transporters PAHS-070 (SABiosciences™) and evaluated with Excel-based PCR array data analysis software (SABiosciences™).
Xenotransplant growth in vivo
Six- to eight-week-old athymic nude female mice (Balb/c nu/nu) were used in accordance to the institutional guidelines under an approved protocol. Tumor xenotransplants were induced with 5×10⁶ TT cells resuspended in serum-free RPMI diluted 1:1 with ECM gel (cat. no. #1270; Sigma), injected subcutaneously. Animals (n=4–6/group) were randomly divided into two groups for 5FU treatment, which was started on day 18 postinoculation. The treated group of animals received an intraperitoneal dose of 10 mg 5FU/kg/day every other day for five weeks. At the experiment endpoint, xenotransplants from the 5FU treated animals were excised and pooled. Tumors were cut into small pieces, homogenized in accutase solution (PAA Laboratories GmbH, Pasching, Austria) with GentleMACS homogenizer (Miltenyi Biotec GmbH, Bergisch Gladbach, Germany), and seeded in TT culture medium for tumor-cell expansion. The derived expanded growing cell line will hereafter be referred to as FTTiv-derived.
In order to examine the tumor-initiating properties of the CD133+ subpopulation, parental TT, TT CD133+ cells, TT CD133−, FTTiv CD133+, and FTTiv CD133− cells were resuspended in 100 μL serum-free RPMI diluted 1:1 with ECM gel and subcutaneously inoculated as above (n=3–6/each cell subset and dose). Animals were regularly inspected for tumor growth, and the volume was determined by caliper measurement of two perpendicular diameters. At the experiment endpoint, xenotransplants were analyzed by immunohistochemistry.
Immunohistochemistry
Excised tumor xenotransplants were fixed in buffered formalin, embedded in paraffin, cut into 5-μm-thick sections, stained with hematoxylin and eosin (H&E), and evaluated by light microscopy (Leica DM2000, Wetzlar, Germany). Immunohistochemical staining was performed to detect calcitonin, chromogranin, and CD133. The following antibodies were used: monoclonal mouse anti-calcitonin, monoclonal mouse anti-chromogranin, and polyclonal rabbit anti-CD133 antibody orb116450 (Biorbyt). The reaction was visualized by universal peroxidase polymer Histofine (anti-mouse, anti-rabbit) with diaminobenzidine (Dako, Glostrup, Denmark) as a substrate for color reaction.
Statistical analysis
Student's two-sample t-test was used to compare the difference in means of two samples. p-Values of p<0.05 were considered to be statistically significant.
Results
The MTC-derived CD133+ subpopulation is enriched for tumor-initiating cells
In accordance with a previous report (15), we could detect very low expression of CD133 in the human MTC TT cell line. This cell line recapitulates properties of human MTC and can therefore serve as a valuable model for the exploration of biological properties of the CD133 subpopulation in MTC. Separated CD133+ cells represented 1.5% (range 0.72–2.00%, number of isolations n=9) of all cells with a mean viability of 72.8% (range 61.8–82.7%). Expression analysis confirmed substantial enrichment for CD133+ cells in the positive fraction and the absence of CD133 expression in flowthrough CD133− cells (Fig. 1A). TT CD133+ cells exhibited similar viability when treated with 5FU in comparison to the TT CD133− or parental TT cells. TT CD133+ cells were not able to reinitiate DNA synthesis more efficiently after 5FU withdrawal in a 5FU pulse experiment (Fig. 1B, C). Nevertheless, CD133+ cells could give rise to growing tumors in immunodeficient mice. The TT CD133+ fraction was at least 10-fold enriched for tumor-initiating cells, as only 0.75×10⁵ CD133+ cells were sufficient to induce tumor growth in three out of four animals. A total of 10×106 unseparated or TT CD133− cells had to be injected to induce exponentially growing tumors with >75% penetrance (Table 1). Immunohistochemical examination confirmed neuroendocrine marker positivity. Moreover, tumors exhibited scattered CD133 cytoplasmic positivity, thus confirming the capability of the CD133+ cell subset to give rise to both CD133+ and CD133− progeny and recapitulate MTC tumor biology in vivo (Fig. 1D-i–iii). High numbers of TT CD133− cells could give rise to MTC-like tumors (Fig. 1D-iv, v), although these were either all CD133− (Fig. 1D-vi) or diffusely cytoplasmic positive for CD133 (Fig. 1D-vii). Thus, CD133 cannot be considered an exclusive tumor-initiating cell marker, although the cancer-initiating cells seem to be enriched in the CD133+ subpopulation. Our experimental data may also underestimate the frequencies of tumor-initiating cells. Fig. 1E shows that a single inoculation of CD133+ cells led to growth of two independent tumors at the inoculation site.
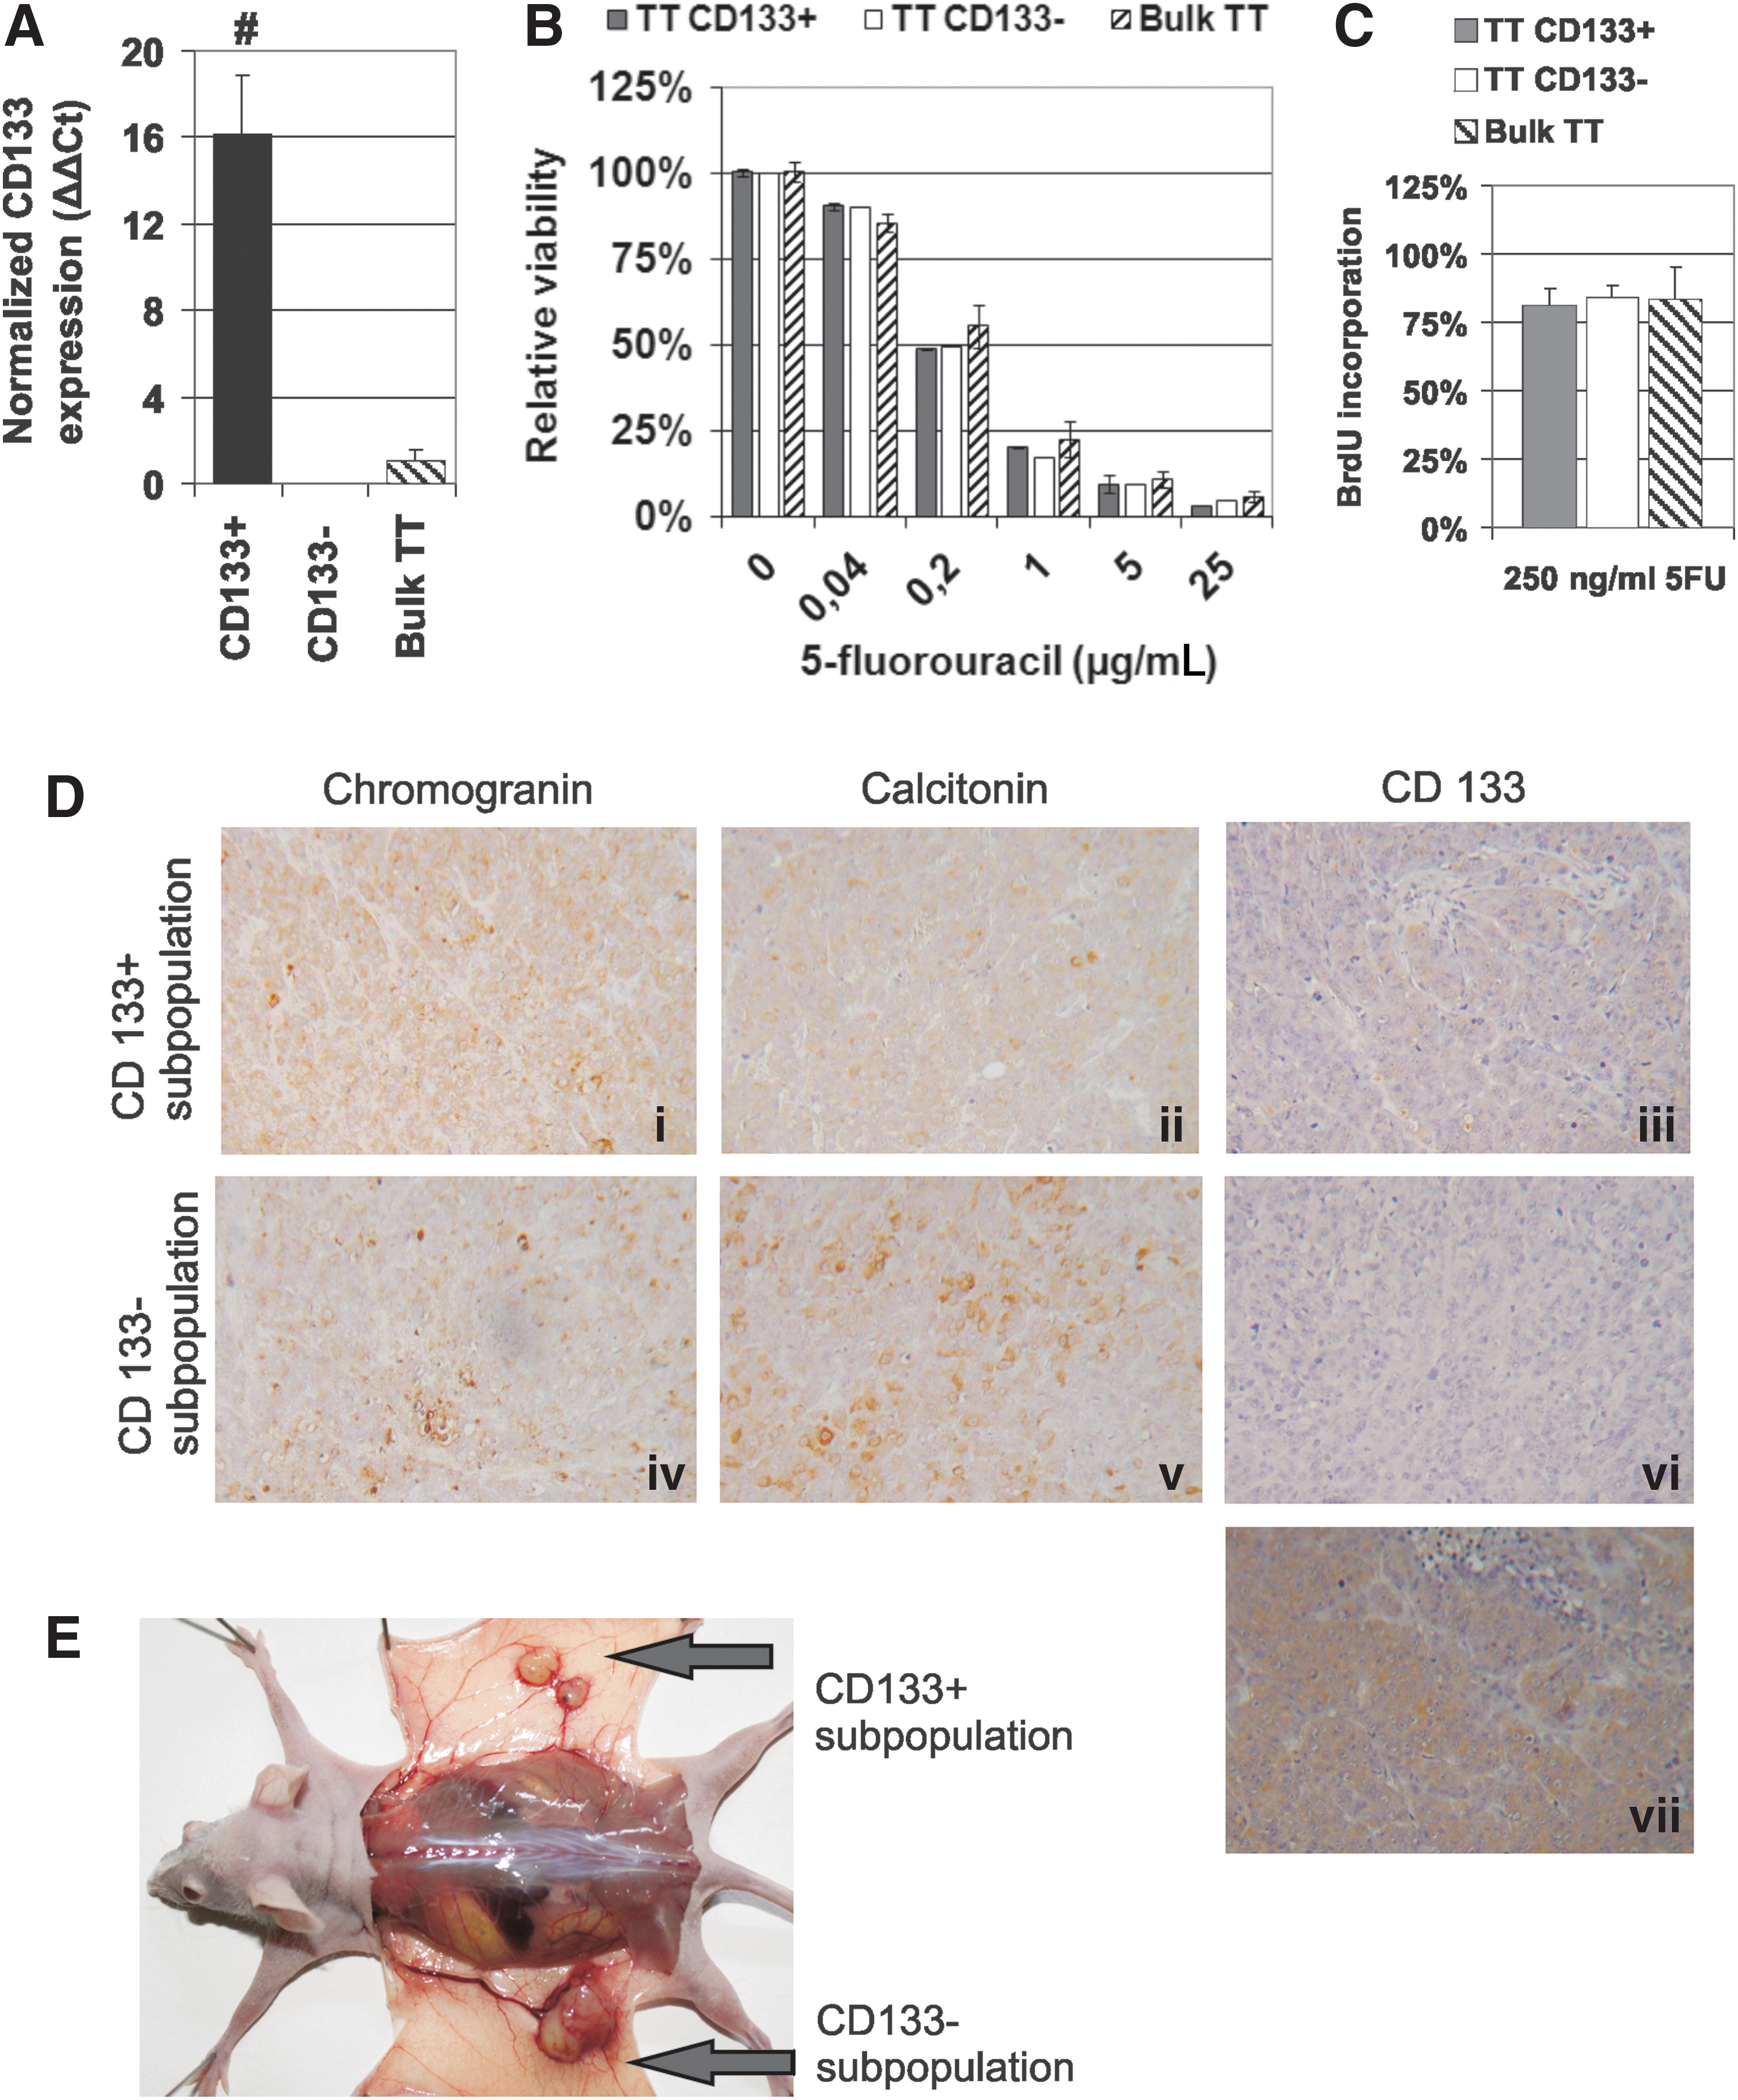
CD133+ subpopulation enriched for tumor-initiating cells can be derived from human medullary thyroid carcinoma (MTC) cells. The CD133+ subpopulation and the CD133− subpopulation were separated from the MTC cell line TT by positive immunomagnetic separation.
Parental, TT CD133−, or TT CD133+ cells were resuspended in serum-free RPMI medium mixed with ECM 1:1 and subcutaneously injected in to the flank of nude female mice. Tumor growth was monitored for 60 days and considered positive when tumors exceeded 1 mm3 and exhibited subsequent gradual volume increase.
Xenotransplanted tumor cells formed transiently small masses and regressed. One of the xenotransplants exhibited presence of tumor cell clusters, as determined by immunohistochemistry 60 days postinoculation at the site of inoculation in the absence of tumor growth.
CD133, prominin-1; s.c., subcutaneously.
The derived cell line FTTiv exhibits differential chemosensitivity to 5FU
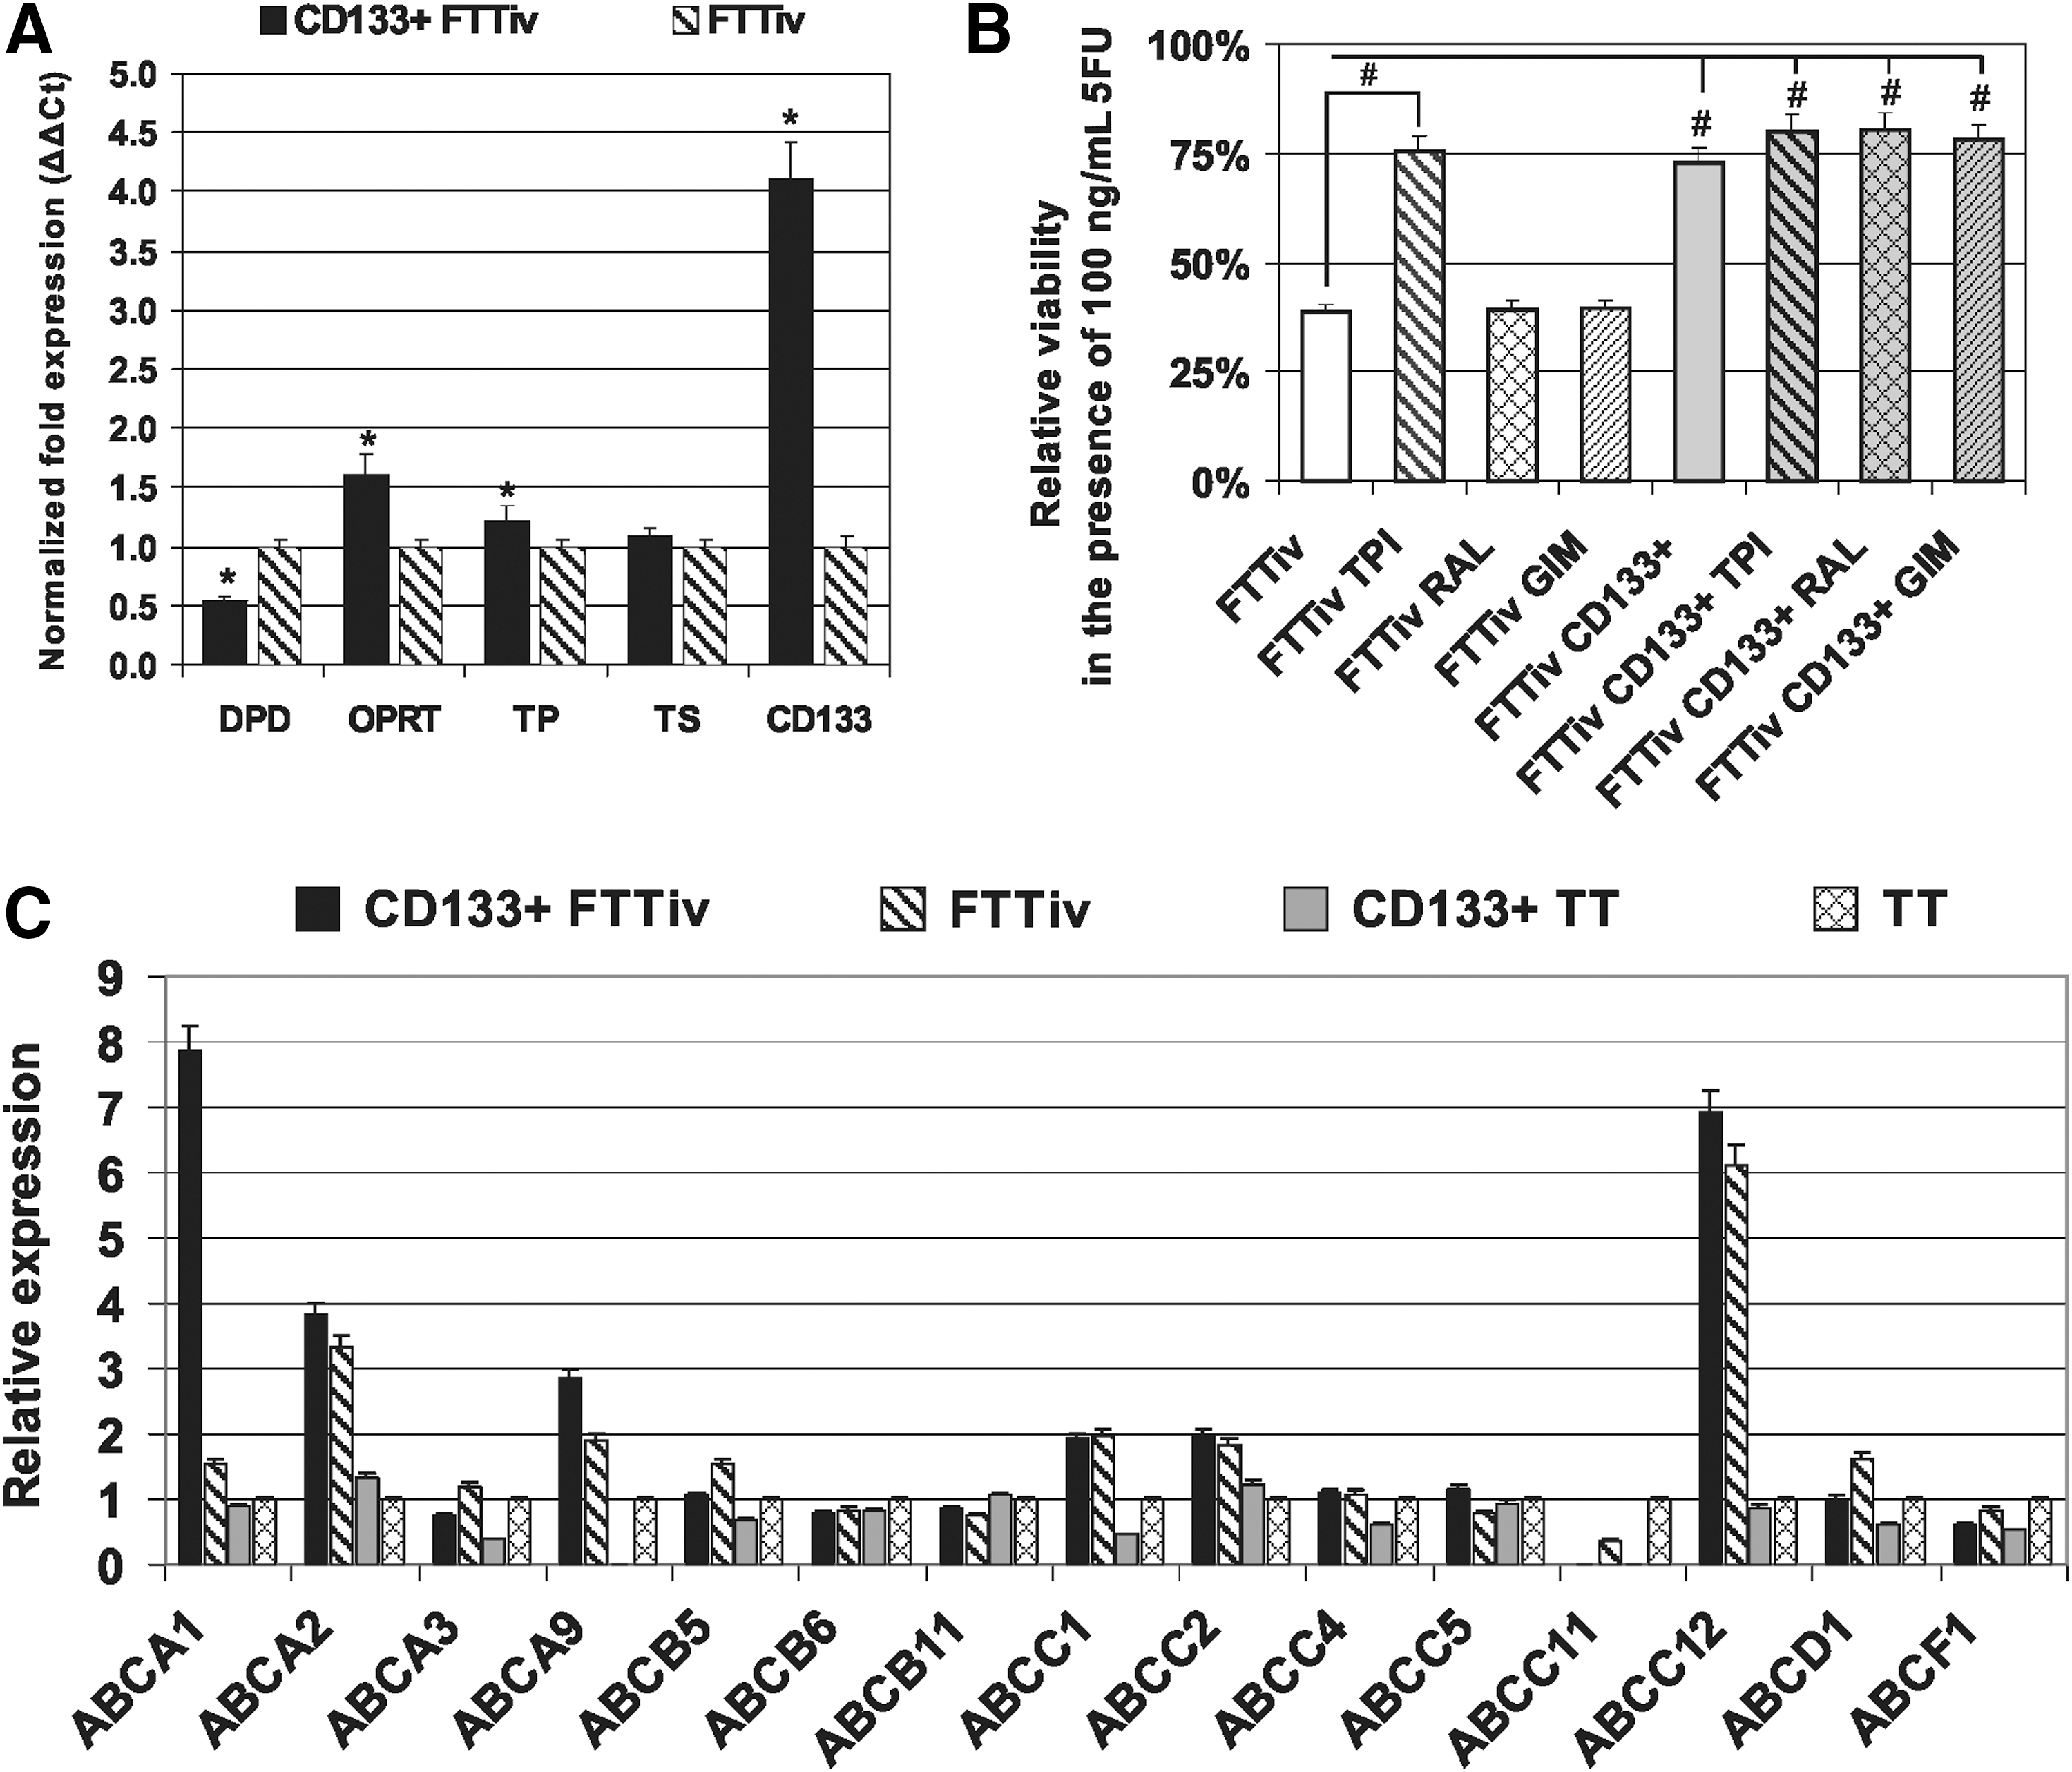
Next, we evaluated whether the exposure to the chemotherapeutic drug 5FU in vivo results in any changes in chemoresistance of tumor cells. Prolonged treatment of tumors with 5FU did not decrease the tumor volume significantly (Fig. 2A). 5FU-exposed TT cells from the tumor xenotransplants were expanded for future analysis. These cells were designated FTTiv and exhibited decreased apoptosis induction by 5FU in vitro (Fig. 2B). Moreover, the derived FTTiv cells exhibited higher resistance to 5FU in comparison to parental TT cells (Fig. 2C). Gene expression analysis confirmed a substantial increase in the thymidylate phosphorylase (TP)/thymidylate synthase (TS) ratio (high TP and low TS profile), as well as stem-cell marker CD133 expression in derived FTTiv cells (Fig. 2D). Strikingly, the decrease in viability in response to increasing 5FU concentrations was significantly different in FTTiv cells in comparison to parental TT cells, and remained stable over one year of cell culture (Fig. 2E). The viability of FTTiv-derived cells was significantly lower at a 5FU concentration <0.2 μg/mL and higher at 5FU concentrations >0.75 μg/mL. This discrepancy could be explained by increased chemoresistance of derived FTTiv cells, which could better proliferate in the presence of low suboptimal 5FU doses at earlier time points, thus incorporating more toxic metabolites, resulting in a higher toxicity later on, as demonstrated by kinetic proliferation measurements (Fig. 2F).

In vivo drug-exposed FTTiv cells have differential chemosensitivity to 5FU.
Differential 5FU responses in FTTiv cells were further investigated. Dihydropyrimidine dehydrogenase (DPD) was not differentially expressed, and its inhibition by gimeracil (GIM) did not affect 5FU chemosensitivity (Fig. 3A). The TP inhibitor TPI substantially increased the chemoresistance in both TT and FTTiv-derived cells. The shift was more pronounced in FTTiv cells, which exhibited TP overexpression. These data indicate the role of TP overexpression for the sensitization of FTTiv cells to 5FU at concentrations ranging from 25 to 500 ng/mL (Fig. 3B). TS inhibition by raltitrexed (RAL) could not affect the chemosensitivity of TT cells, but increased FTTiv chemoresistance (Fig. 3C). These results indicate that low TS activity is necessary for cell responsiveness to 5FU. TS inhibition could compensate for the increased chemosensitivity, as mediated by TP overexpression in FTTiv cells, and shift these cells back to the parental phenotype. As both these compounds (RAL and TPI) could increase the chemoresistance in both parental and drug-exposed MTC cells, they have not proven suitable for combination with 5FU to augment chemotherapeutic response.
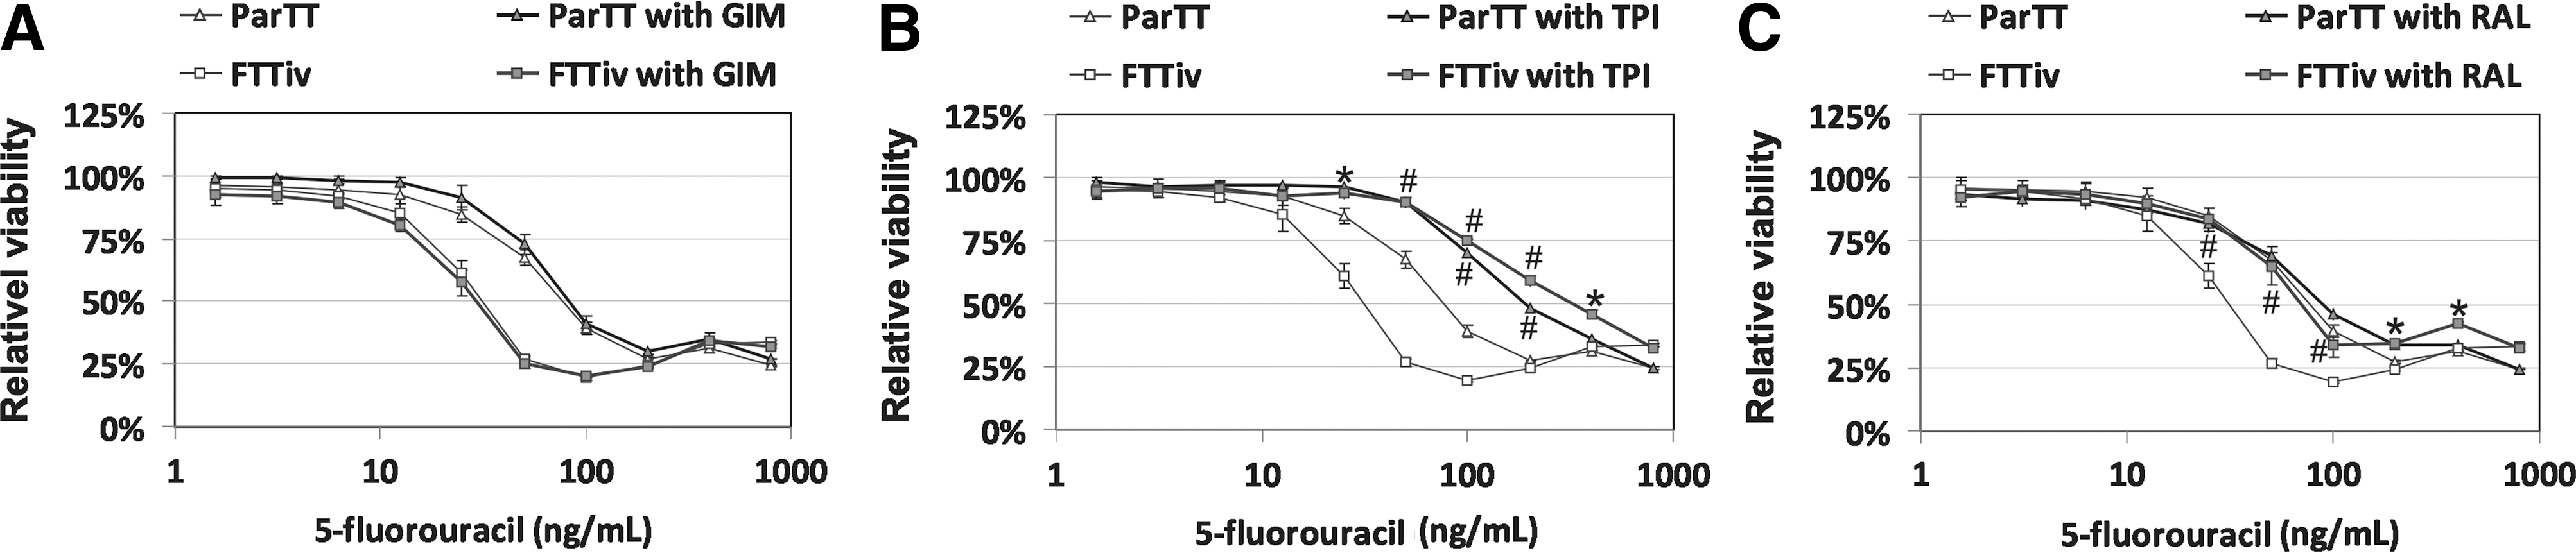
Selective inhibition of TP and TS enzymes increases 5FU chemoresistance in derived FTTiv cells. Derived FTTiv or parental TT cells were treated with increasing concentrations of 5FU for 14 days in the presence or absence of specific inhibitors.
A 5FU-resistant CD133+ FTTiv tumor-initiating subpopulation emerged in response to drug treatment in vivo
Next, we analyzed the tumor-initiating properties and chemosensitivity of the CD133+ subpopulation from FTTiv-derived MTC cells. Increased CD133 expression in FTTiv cells did not reflect an increased proportion of CD133+ FTTiv cells. They represented 1.7% of the population (range 0.83–2.46%, n=8) with a mean viability of 71.2% (range 65.5–80.0%). The FTTiv CD133+ subpopulation retained a similar proliferation capacity, as demonstrated by kinetic proliferation measurement in vitro (Fig. 4A) and similar tumor-initiating properties in comparison to TT CD133+ cells in vivo (Fig. 4B). The viability of FTTiv CD133+ and parental cells did not differ when exposed to 5FU for three days (Fig. 4C). However, the level of caspase-3/7 activation was decreased in FTTiv CD133+ cells in comparison to parental FTTiv cells (Fig. 4D). FTTiv CD133+ cells could reinitiate cell proliferation much more efficiently in comparison to parental or FTTiv CD133− cells, as demonstrated by significantly increased BrdU incorporation as a measure of cell proliferation after 5FU withdrawal (Fig. 4E). In accordance with these data, the subset of FTTiv CD133+ cells exhibited significantly higher resistance to 5FU in comparison to parental FTTiv cells (Fig. 4F). FTTiv CD133+ cells generated through drug exposure have an IC50(5FU)=0.6 μg/mL in contrast to TT CD133+ cells with an IC50(5FU)=0.125 μg/mL (Fig. 5A). Moreover, this cell subset was also more resistant to doxorubicine and vincristine: IC50(DOX)=250 ng/mL for FTTiv CD133+ subset of cells in contrast to IC50(DOX)=110 ng/mL for TT CD133+, and IC50(VIN)=9.25 ng/mL for FTTiv CD133+ subset of cells in contrast to IC50(VIN)=11.25 ng/mL for TT CD133+ (Fig. 5B, C). Taken together, these data indicate that the exposure of tumor cells to a chemotherapeutic agent did not increase the proportion of tumor-initiating cells. Altered response to chemotherapeutic treatment with increased resistance in cells derived from the parental population was associated with emergence of a 5FU-resistant CD133+ FTTiv cancer-initiating cell subpopulation.
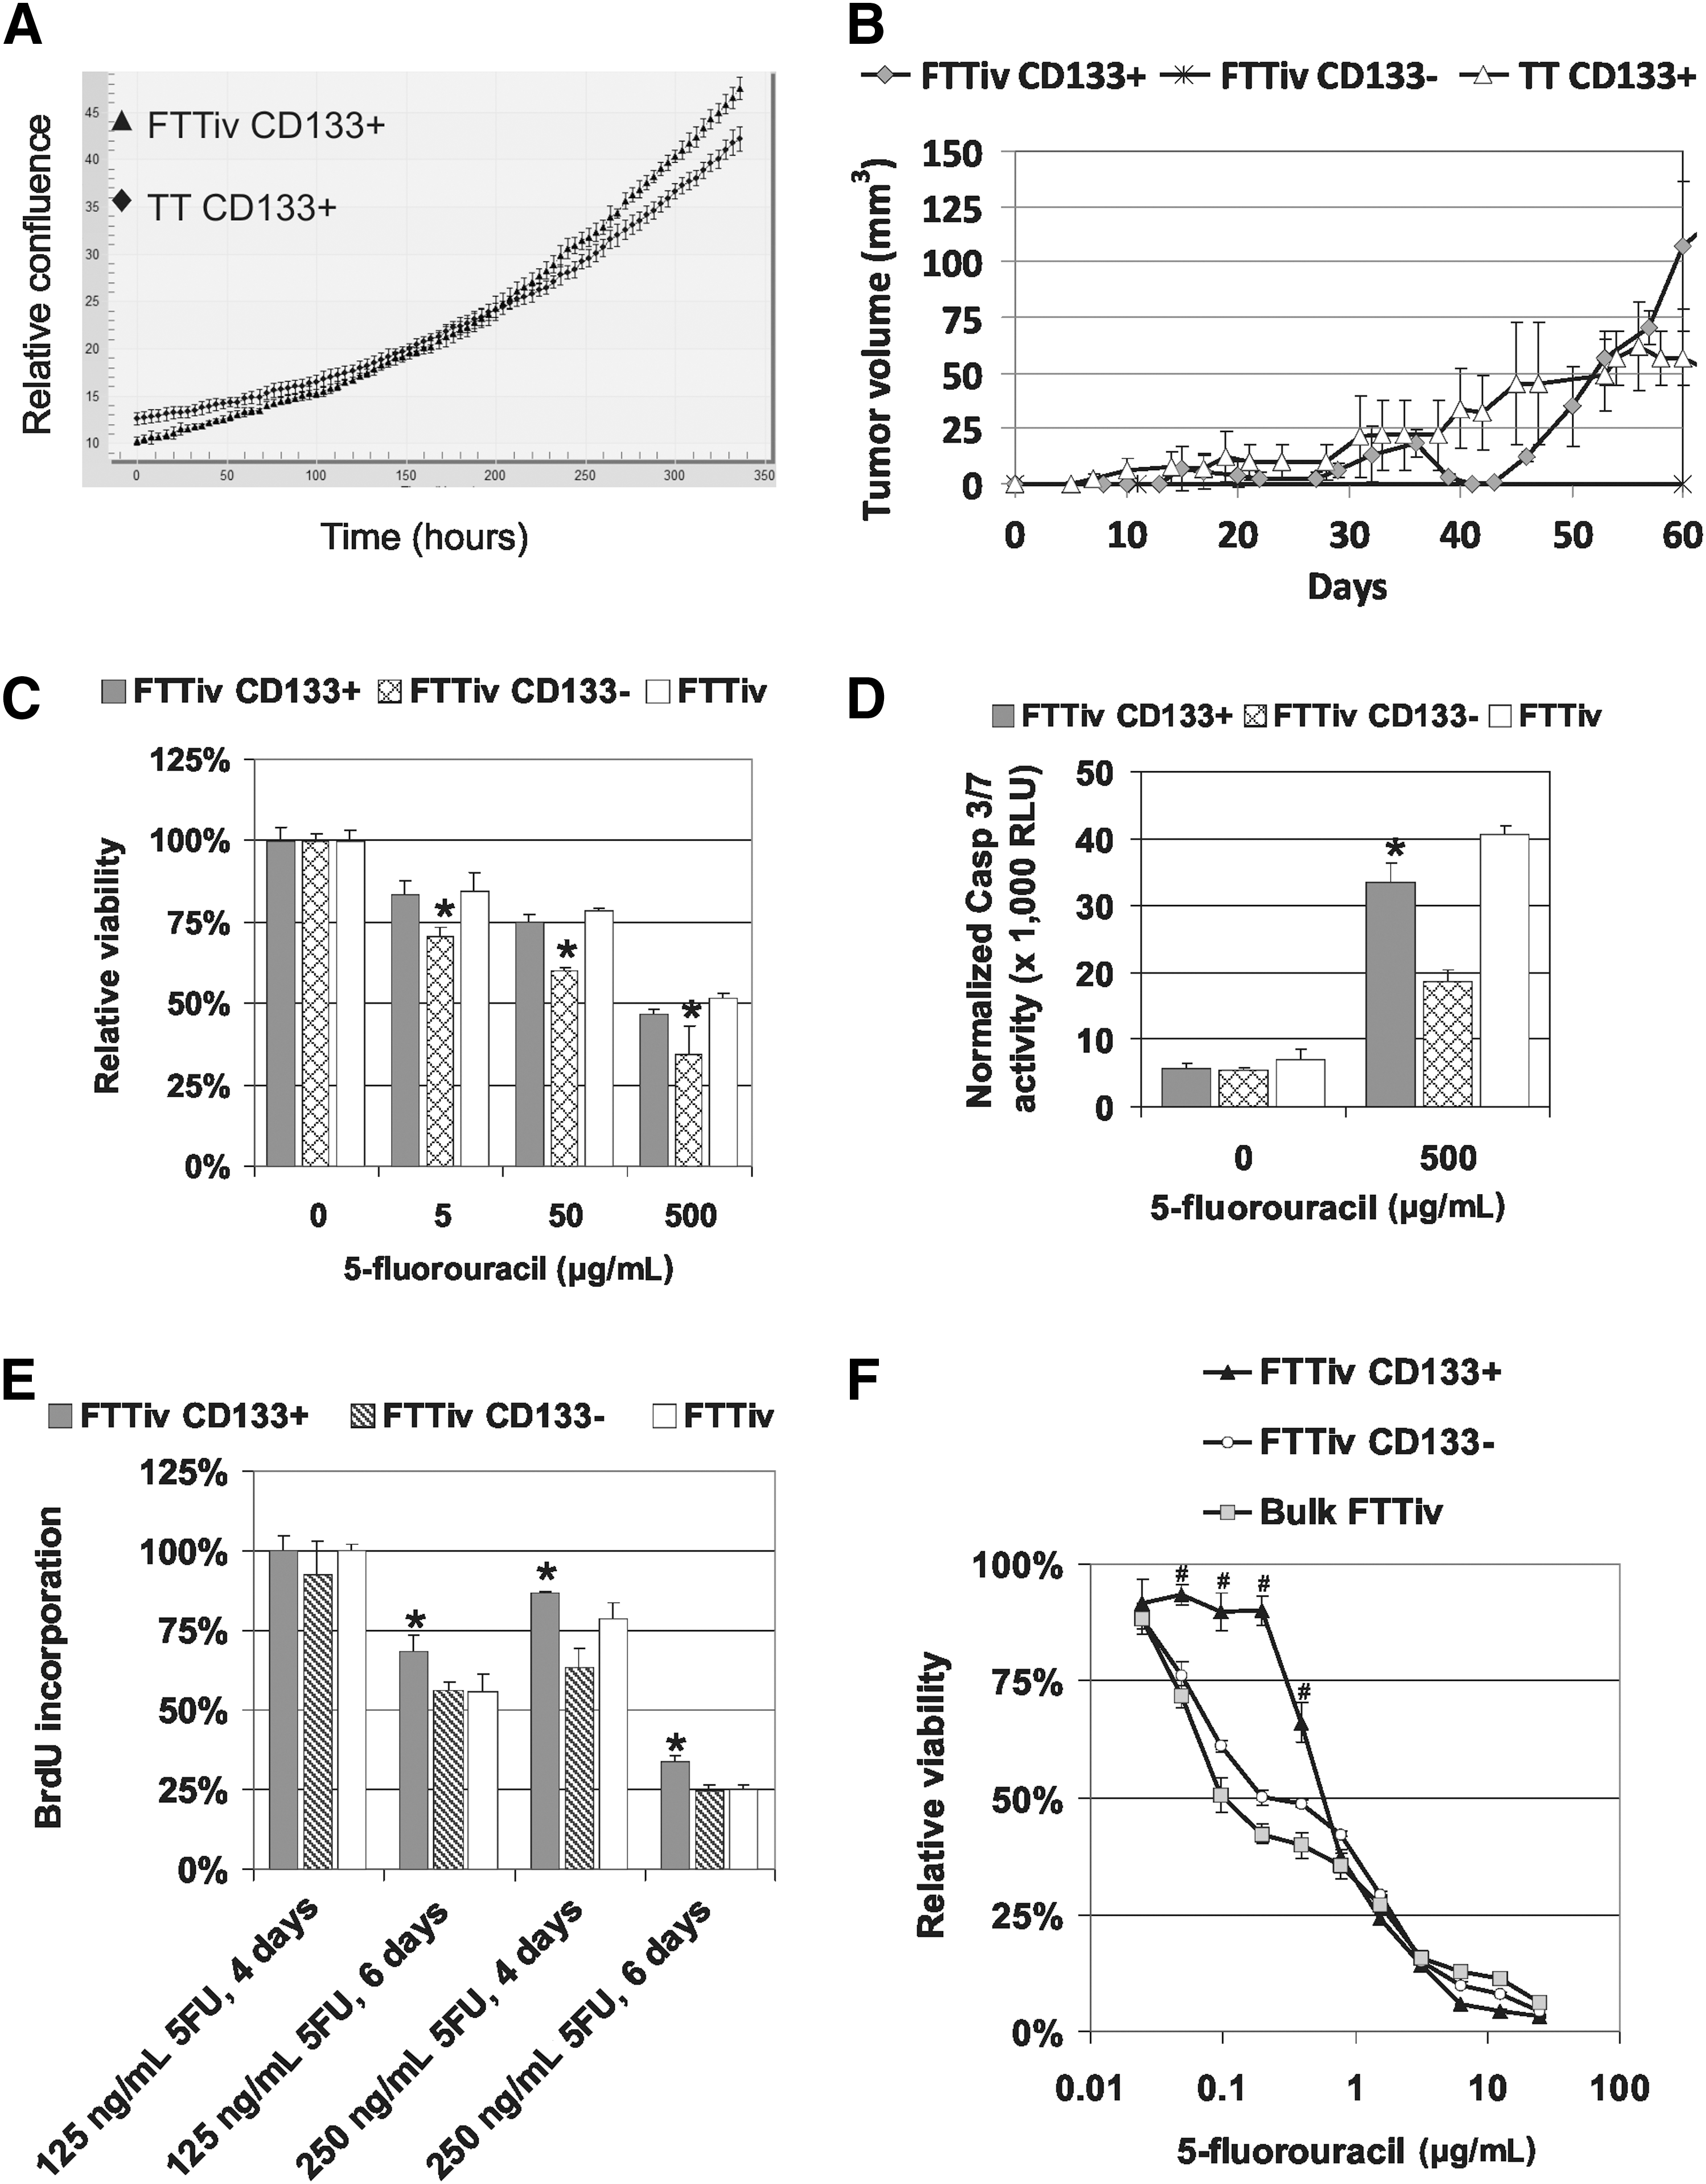
CD133+ tumor-initiating cell subpopulation in the derived FTTiv cell line possesses chemoresistant properties.
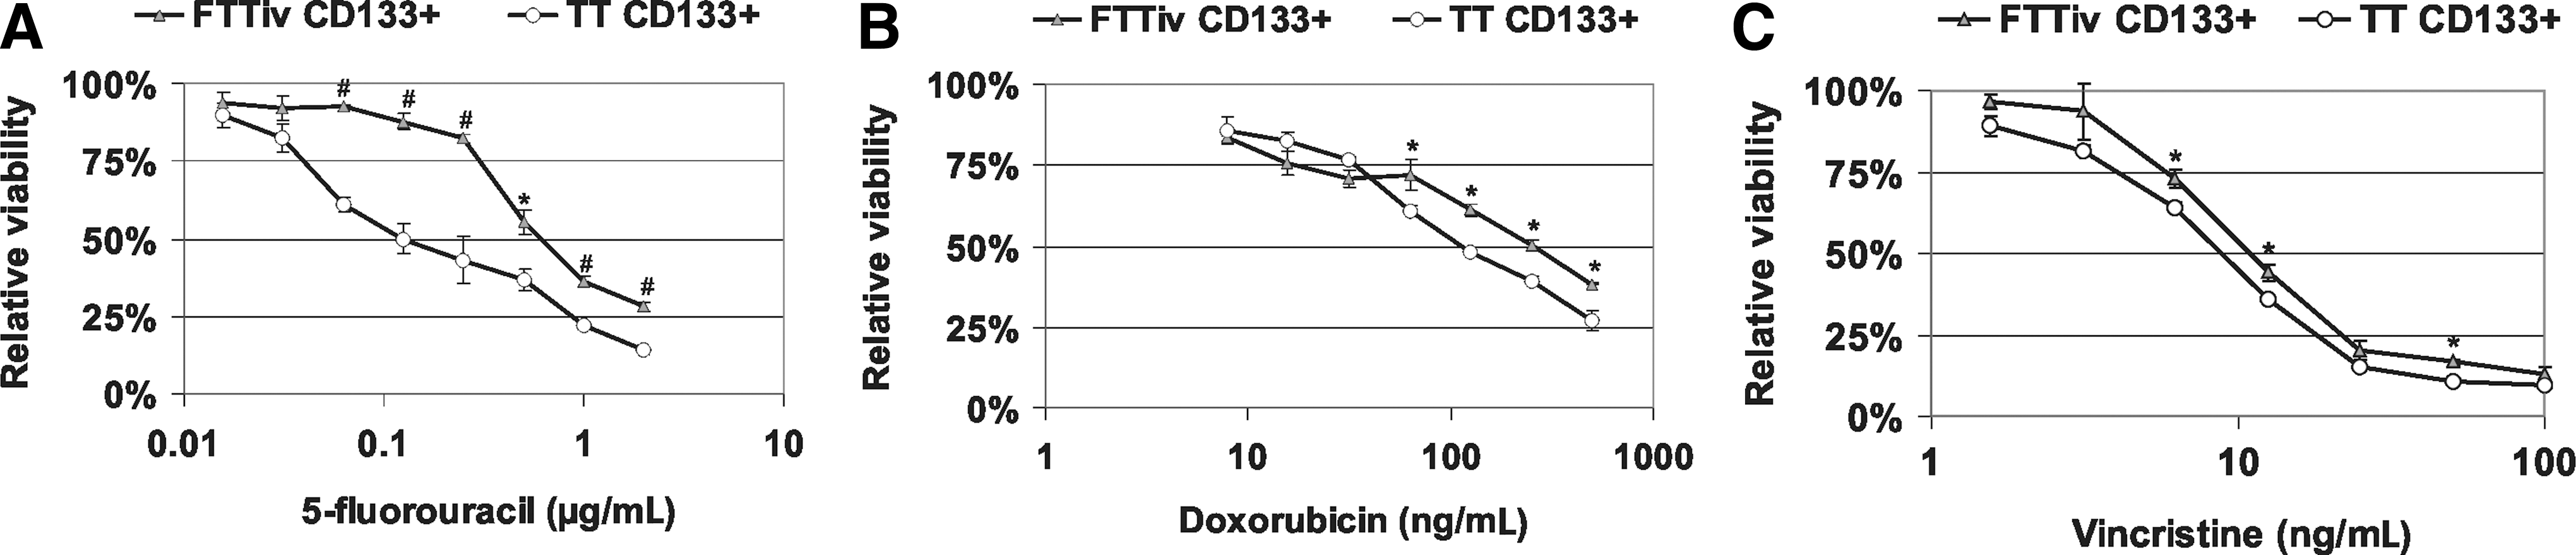
CD133+ subpopulation responses to cytotoxic treatment. FTTiv CD133+ and TT CD133+ cells were plated in 96-well plates and treated with 5FU
Chemoresistance of FTTiv CD133+ subpopulation cannot be reversed by TP, TS, and/or DPD inhibitors
The expression analysis indicated differential expression of several key enzymes involved in 5FU metabolism in the FTTiv CD133+ subpopulation (Fig. 6A). However, the chemoresistance of FTTiv CD133+ subpopulation could not be reverted back to the parental FTTiv sensitivity by treatment with TP, TS, or DPD inhibitors (Fig. 6B). Differential expression of the studied genes does not seem to be responsible for the chemoresistance in the FTTiv CD133+ cell subset. As previously demonstrated (Fig. 5B, C), the shift in doxorubicin and vincristine sensitivity could be indicative of the activity of ATP-binding cassette (ABC) drug efflux pumps. Therefore, the analysis of multidrug resistance genes was performed. The analysis of the ATP-binding cassette (ABC) gene expression pattern unraveled a pattern of drug transporter expression that could contribute to the differential chemosensitivity in the evaluated cell subpopulations (Fig. 6C). Our analysis indicates a high ABCA1 expression level in CD133+ FTTiv cells, and increased expression of ABCA1, ABCA2, ABCA9, ABCC1, and ABCC12 in the derived FTTiv cell line in comparison to naïve TT cells. Based on these data, we anticipate that the complex differences in the expression pattern of key molecules conveys the drug-exposed cells with differential chemosensitivity properties where no single target inhibition could have reversed the cells back to the original chemosensitivity phenotype. Nevertheless, it was demonstrated that there is a window of 5FU concentration that could be therapeutically efficient in antitumor response.
Gene expression analysis and chemoresistance of CD133+ FTTiv.
Discussion
Recent reports on the hierarchical organization of malignancies and chemoresistant properties in the subset of cancer-initiating cells suggested that thyroid cancer stem cells might share these properties (6). It has been previously published that the CD133+ subpopulation was enriched in thyrosphere cultures of MTC and possessed self-renewing properties in vitro (15). In our work, we show for the first time that the CD133+ marker can be used to enrich for the MTC cell subset with tumor-initiating properties. The subpopulation of CD133+ cells isolated from parental TT cells fulfilled several criteria of cancer stem cells (32,33). They were relatively rare, representing only 1.5% of the population; they were shown to produce exponentially growing tumor xenotransplants with the properties of the original tumor at a decreased cell inoculation number; and they differentiated to both CD133+ (very rare) and CD133− (major) subpopulations. Nevertheless, we were also able to grow TT xenotransplants from the CD133-depleted fraction similar to the CD133-depleted glioma and colon cancer cells (34 –36). We suppose that the process of immunomagnetic separation enriches for highly positive cells, and therefore MTC cancer-initiating cells are not exclusively present in the CD133+ subpopulation. Thus, positivity for CD133+ cannot be regarded as an exclusive cancer stem-cell marker in MTC, a finding that is similar to other solid tumors (11,37).
Contrary to some other reports (20,37,38), we could not confirm increased chemoresistance in the TT CD133+ cells (Figs. 1B, 3A, and 5A). Nonetheless, we observed refractoriness of the parental TT cell population to 5FU treatment in vivo even though the cells were relatively sensitive to 5FU in vitro. This contradictory finding might reflect the low intratumoral concentration of 5FU when injected systemically, as well as its very short half-life due to the liver expression of the 5FU-inactivating enzyme DPD in vivo. Moreover, our data confirm that the expression of the DPD enzyme in TT cells and derived FTTiv cells is another factor that may contribute to 5FU resistance of MTC cells (28). Importantly, tumor-cell exposure to 5FU in vivo has resulted in acquired changes in the response to 5FU. Derived FTTiv cells were significantly more resistant to 5FU at high concentrations above the IC50 value for TT cells (≥0.4 μg/mL 5FU; Fig. 2C, E). Contrastingly, these cells had a significantly inhibited proliferation at lower 5FU concentrations upon prolonged exposure. Our kinetic data indicate that the initial cellular resistance to the chemotherapeutic drug resulted in higher proliferation of FTTiv cells and thus increased incorporation of toxic 5FU metabolites. Our data support the observation by Mizutani et al., who achieved synergistic toxicity with TRAIL in combination with low subtoxic 5FU concentrations in otherwise chemoresistant cells (39).
Favorable enzyme profiles (high TP and low DPD) should generate high intratumor levels of 5FU that are effective against many tumors, especially those with low TS. A total of 32% of papillary thyroid cancers exhibited this profile, and therefore the authors suggested them to be sensitive to 5FU-based treatment (40). Patient MTC samples have not been analyzed in detail for the enzyme expression pattern so far. FTTiv-derived cells had favorable profile according to the data by Patel et al. (40), but they are not responsive to 5FU treatment in general. The link between expression as predictive markers and the therapeutic response is more complex (22). Our model suggests that it is not only the expression level of key enzymes such as TP, TS, and DPD that determines response to 5FU therapy (41,42). The sensitivity is also determined by the dose of the treatment in a given cell type, with lower doses being more efficient and resulting in higher cytotoxicity. Salonga et al. suggested that the low level of all three enzymes—TP, TS, and DPD—determines a favorable outcome (43). Our data do not contradict this study, as the TP expression was markedly increased in FTTiv cells. Low DPD and TS expression were previously linked to the responses of tumors to 5FU as higher DPD levels contributed to increased 5FU catabolism and increased TS level to acquired 5FU resistance (24). In our study, the TP expression was higher in derived cells, which increased the TP:TS ratio in the case of derived FTTiv cells in comparison to parental TT cells. The role of TP upregulation in increased sensitivity of derived cells in the context of low TS expression is illustrated by the use of the TP inhibitor TPI, which restored the 5FU resistance at low concentrations. Moreover, the inhibition of TP in parental cells also significantly increased the 5FU resistance. We hypothesize that this effect can be explained by a lower production of toxic 5FU metabolites that are incorporated into nucleic acids, decreased TS inhibition, and a shifted balance toward higher DPD-mediated 5FU degradation. Inhibitors of TP were developed in order to counteract the angiogenic function of TP in tumor tissues (38,44,45), but based on our results, their use might have a negative role in contributing to 5FU chemoresistance.
In contrast to other reports, which showed CD133+ enrichment upon drug exposure in vivo (38,46,47), the proportion of the FTTiv CD133+ cells did not significantly change in the drug-exposed cells, but their chemoresistant properties were significantly affected. We could demonstrate that the FTTiv CD133+ subpopulation was more resistant to 5FU as a consequence of 5FU-driven selection pressure in vivo. More importantly, these cells retain acquired chemoresistant properties, as their proportion and chemoresistance was stable upon culture expansion of the FTTiv cells in the absence of 5FU, and the IC50 (5FU) for CD133+ FTTiv cells did not decrease during one year of cell culture propagation of FTTiv cells. As demonstrated by the treatment with specific enzyme inhibitors, none of them could significantly sensitize the CD133+ subpopulation to 5FU, and thus the changes in the expression levels were not crucial for mediating the chemoresistance in the CD133+ FTTiv subpopulation. Alternate putative cancer stem-cell markers were tested in order to enrich for the chemoresistant MTC cancer stem-cell subpopulation. TT cells do not express ABCG2 (28), and its expression was not induced by 5FU treatment, although CD133+/ABCG2 subpopulation in lung xenografts was reported to emerge in response to cisplatin treatment (19). Nevertheless, several ABC transporters were upregulated in CD133+ FTTiv and/or parental FTTiv-derived cells such as ABCA1, ABCA2, ABCA9, ABCC12, and ABCC2. Their function was not directly linked to 5FU resistance and/or a role in thyroid cancer so far, and therefore this requires further investigation. ABCA1 was recently reported to inhibit the proliferation of hematopoietic and multipotent progenitor cells. Thus, it might not be directly involved in drug resistance rather than prevention of stem-cell expansion (48). The significance of these findings is further supported by the ABC expression profiling study in breast cancer, which identified a high expression of ABCA1 and ABCC12 in patients with residual disease after neoadjuvant chemotherapy (49). Surprisingly, drug exposure in vivo did not produce cells with stably upregulated MRP5/ABCC5 or MRP8/ABCC11, which were previously linked to 5FU resistance (26,27). We have tried to derive chemoresistant TT cells by exposing them to increasing 5FU concentration in vitro. Our effort failed, and resistant proliferating cells could not be produced. Treatment of TT cells by 5FU in vitro resulted in cytotoxicity, apoptosis, and tumor-cell quiescence and senescence (unpublished data). However, the cells were refractory to 5FU administration in vivo from the beginning; their treatment generated selection pressure under low suboptimal 5FU doses and stable changes in the expression of key enzymes of nucleotide metabolism and several other membrane transporter systems, such as ABCC12, which has high homology to ABCC11, although its function remains unknown (50). The approach used in our analysis recapitulates the clinical situation in metastatic MTC where in many patients no response to standard chemotherapy could be observed (4,5). Importantly, our data indicate that the cells might adapt to the treatment and shift toward differentially responding subsets with acquired and maintained chemoresistance in the CD133+ subpopulation. The approach differs substantially from the derivation of chemoresistant cell lines in vitro; and therefore it does not produce stable chemoresistant-derived cells with a shifted drug responses. 5FU-treatment in vivo did not affect FTTiv cell population doubling time, morphology, or any other biological features, such as calcitonin or neuroendocrine marker expression. In vivo drug-exposed cells could be propagated indefinitely, did not undergo senescence, and retained specific drug responses during long-term culture expansion and propagation. In vivo grown and expanded TT cells from xenografts did not have any changes in the examined properties compared to the parental TT cells. Hence, none of the described molecular and chemosensitivity responses can be attributed to the growth of the tumor xenotransplant in vivo through any of the utilized assays.
Our findings with the MTC model cell line demonstrate that the CD133 surface marker can serve for the enrichment for tumor-initiating cell in MTC as in many other solid tumors (51,52). Although the proportion of these cells remains unchanged, drug exposure of the parental population can increase the level of CD133 expression, as well as substantially change the responses to chemotherapy of the parental cells and the CD133+ subpopulation. Our data indicate that even for the chemoresistant cells, there is a sensitivity window and specific conditions that might enable to decrease cell viability upon prolonged low-dose chemotherapeutic treatment, which further supports the rationale for testing metronomic (low dose, long term) chemotherapy (53).
Our data provide evidence for the existence of rare tumor-initiating cells in MTC, which are enriched in the CD133+ subpopulation. The CD133+ subpopulation derived from the parental TT cell line did not exhibit increased chemoresistance, but it emerged by the in vivo drug exposure of the CD133+ subpopulation. The CD133+ subpopulation has multiple changes in the transcriptome. It could retain a long-term chemoresistant phenotype, and it exhibited an increased chemoresistance as a consequence of drug exposure in vivo.
Footnotes
Acknowledgments
We thank M. Dubrovcakova, V. Frivalska, R. Bohovic, and E. Klincova for excellent technical assistance. This work was supported by the Slovak Research and Development Agency under the contract no. APVV-0230-11, Scientific Grant Agency VEGA grant no. 2/0088/11, and by the Framework Program for Research and Technology Development project: Building of Centre of Excellency for Sudden Cerebral Vascular Events, Comenius University Faculty of Medicine in Bratislava (ITMS: 26240120023), cofinanced by European Regional Development Fund. Expression analysis was financed by the Cancer Research Foundation. Authors' contributions: L.K., conception, design, and development of methodology; L.K., L.F., Z.K., and M.M., acquisition of data; L.K., L.F., M.M., and P.B., analysis and data interpretation; L.K. and P.B., writing of the manuscript and review; M.P. and R.N., technical and material support.
Author Disclosure Statement
All authors declare no conflicts of interest.