
Abstract
Background:
Median urine iodine concentration (UIC; μg/L) in spot urine samples is recommended for monitoring population iodine status. Other common measures are iodine:creatinine ratio (I/Cr; μg/g) and estimated 24-hour urine iodine excretion (UIE; I/Cr×predicted 24-hour Cr; μg/day). Despite different units, these measures are often used interchangeably, and it is unclear how they compare with the reference standard 24-hour UIE.
Methods:
Volunteers aged 18–39 years collected all their urine samples for 24 hours (n=400). Voids from morning, afternoon, evening, overnight, and a composite 24-hour sample were analyzed for iodine. We calculated median observed 24-hour UIE and 24-hour UIC, and spot UIC, I/Cr, and two measures of estimated UIE calculated using predicted 24-hour Cr from published estimates by Kesteloot and Joosens (varies by age and sex) and published equations by Mage et al. (varies by age, sex, race, and anthropometric measures). We examined mean differences and relative difference across iodine excretion levels using Bland–Altman plots.
Results:
Median 24-hour UIE was 173.6 μg/day and 24-hour UIC was 144.8 μg/L. From timed-spot urine samples, estimates were: UIC 147.3–156.2 μg/L; I/Cr 103.6–114.3 μg/g, estimated 24-hour UIE (Kesteloot and Joosens) 145.7–163.3 μg/day; and estimated 24-hour UIE (Mage) 176.5–187.7 μg/day. Iodine measures did not vary consistently by timing of spot urine collection. Compared with observed 24-hour UIE, on average, estimated (Mage) 24-hour UIE was not significantly different, while estimated 24-hour UIE (Kesteloot and Joosens) was significantly different for some ethnicity/sex groups. Compared with 24-hour UIC, on average, spot UIC did not differ.
Conclusions:
Estimates of UIC, I/Cr, and estimated 24-hour UIE (I/Cr×predicted 24-hour Cr) from spot urine samples should not be used interchangeably. Estimated 24-hour UIE, where predicted 24-hour Cr varies by age, sex, ethnicity, and anthropometric measures and was calculated with prediction equations using data from the sample, was more comparable to observed 24-hour UIE than when predicted 24-hour Cr was from published estimates from a different population. However, currently no cutoffs exist to interpret population estimated 24-hour UIE values.
Introduction
I
More than 90% of iodine consumed is excreted in the urine, making urine iodine a good indicator of recent iodine intake. Collection of urine over 24 hours (μg/day) to quantify urine iodine excretion (UIE) is often considered the “reference” standard for describing population iodine intake, and is often used for validating other methods (7). Because collection of 24-hour urine samples is expensive and burdensome, large epidemiologic studies usually collect spot (casual) urine samples. The World Health Organization (WHO) currently recommends using the median urine iodine concentration (UIC; μg/L) from spot urine samples to describe the iodine status of a population (8). Despite the WHO recommendation, the best method for estimating iodine status of a population based on spot urine samples is still debated, and several different measures for expressing urine iodine are commonly found in the literature (Table 1). Despite different units, many of these measures are often used interchangeably.
In this analysis, estimates of predicted 24-hour Cr for persons aged 25–29 years were used for participants 18–24 years, since no estimates were available for this group from Kesteloot and Joosens.
BMI, body mass index; Cr, creatinine.
Since UIC is expressed per urine volume, it varies by recent fluid intake. Creatinine, a product of muscle metabolism, is excreted at a relatively constant rate throughout the day, and therefore has been used as a correction factor to minimize variation in urine volume (7). The iodine-to-creatinine ratio (I/Cr ratio; μg iodine/g creatinine) has been considered by some to reasonably estimate 24-hour UIE and is commonly reported in the literature (5,7,9). However, the WHO describes the use of a creatinine correction factor for iodine as “unnecessary” and “unreliable” (8). Since creatinine excretion does vary by sex, age, racial/ethnic background, body mass index, and protein intake (10), some research suggests that a further correction, multiplying I/Cr by an estimate of 24-hour urine creatinine (I/Cr×predicted 24-hour Cr; μg/day) is more strongly predictive of 24-hour UIE. This adjusted I/Cr is considered an estimate of 24-hour UIE (11 –14). In the iodine literature, the predicted 24-hour urine creatinine most often used in this calculation varies by age and sex, and is based on a study by Kesteloot and Joossens, conducted among a large Belgian population (aged 25–75 years) from 1979–1984 (11 –13,15). It is unclear if estimates of 24-hour creatinine in this study are applicable to the U.S. population given the differences in race/ethnicity between the U.S. and Belgian populations, and increases in overweight and obesity over the last several decades.
A recent workshop sponsored by the Office of Dietary Supplements at the National Institutes of Health aimed to identify research areas for improving the monitoring of iodine status in the United States (16). This workshop concluded that it was important to “determine whether UIC is an appropriate proxy for 24-hr urine collections…[and to assess] the validity of the multiple correction factors used to estimate total daily UI excretion” (16). Based on these recommendations, the objective of this analysis was to describe how 24-hour and spot urine measures of iodine compare at the population level among adults aged 18–39 years, overall, by race/ethnicity and by timing of the spot urine collection.
Methods
Calibration study and sample
We used data from a urine calibration study whose primary objective was to assess whether timed-spot urine samples, as collected in the current NHANES protocol, could be used to estimate the “gold standard” of 24-hour urine sodium excretion reliably. The overall design and preliminary results of the calibration study and an analysis of the utility of existing equations for estimating 24-hour urine sodium have been published elsewhere (17,18). The 24-hour and timed-spot urine samples collected in the calibration study were also analyzed for iodine and creatinine. One secondary objective of the calibration study was to assess whether spot urine iodine samples are an adequate proxy for 24-hour urine iodine measures for describing population-level iodine status, which is the focus of this manuscript.
Volunteers aged 18–39 years were recruited from the Washington, D.C., metropolitan area through recruitment advertisements sent to employees of the National Center for Health Statistics and its contractor, Westat, Inc., and through a Westat database of participants who had previously volunteered to participate in research studies. Women who were pregnant or trying to become pregnant, and individuals taking loop diuretics, with self-reported kidney disease, or with a new/modified treatment for hypertension in the previous two weeks were excluded from participation. Recruitment was stratified by sex and race/ethnicity attempting to obtain equal representation of males versus females, and blacks versus other racial/ethnic groups. This purposive sampling of blacks was done for the sodium study. “Other race” includes anyone who responded “no” to the question “Do you consider yourself to be Black or African American?” Data collection for all participants included questions on socio-demographics, medication use, a 24-hour urine sample, a 24-hour dietary recall, and measured height and weight. For each urine void during the 24-hour period, participants recorded the time of the void and collected the urine into a separate container. The length of collection (>20 hours), total urine volume (>500 mL), and the responses to eight questions asked in person upon return of specimens were used to assess the completeness of the collection (17). This study was reviewed and approved by the National Center for Health Statistics ethics review board. Written consent was obtained from all participants.
From June to August 2011, 481 eligible participants were recruited, of whom 441 (92%) completed the initial visit and were provided with a urine collection kit, and 407 (85%) returned a complete set of 24-hour urine specimens. Six of these participants were excluded from iodine analyses due to the reported use of thyroid medications, and one participant was missing data for iodine measures. A proportional aliquot from each void was taken to create a composite 24-hour urine sample for analysis. NHANES currently collects two spot urine samples from participants: one at the mobile examination center (morning, afternoon, or evening), and one sample that is the first void after waking that is returned by mail (overnight). In accordance with the timing of when spot urine samples are currently collected in NHANES, four timed-spot urine specimens were aliquoted for analysis in this urine calibration study. These were identified as the first void that occurred during the specified time period: morning (8:30 AM to 12:30 PM), afternoon (12:31 PM to 5:30 PM), evening (5:31 PM to 11:59 PM), and overnight (upon waking, 4:00 AM to 12:00 PM). Not all participants have urine iodine values for all of the timed spots. Analyses of iodine and creatinine were conducted at the CDC's National Center for Environmental Health (NCEH). Urine iodine was analyzed by inductively coupled plasma mass spectrometry (19). Two concentration levels of quality controls were analyzed in each analytical batch. Reported results met the accuracy and precision specification of the quality control/quality assurance program of the Division of Laboratory Sciences, NCEH, CDC. Absolute assay accuracy was verified from the analysis of National Institute of Standard Technology 2670A, 2672a, and 3668 Standard Reference Materials. Urine creatinine was analyzed by the Roche Creatinine Plus enzymatic assay (Roche Diagnostics, Indianapolis, IN) on the Hitachi Modular P clinical analyzer (Hitachi High Technologies America, Inc., Pleasanton, CA) (20).
Statistical analysis
We standardized the volume of the 24-hour urine sample to a 24-hour collection time: (total volume collected/self-reported collection time)×24. For each timed-spot sample, we calculated UIC (μg/L), I/Cr ratio (μg/g), and two estimates of 24-hour UIE (μg/day), which is the I/Cr ratio multiplied by predicted 24-hour Cr. Following the method of Knudsen et al. (12), we used estimates of predicted 24-hour Cr from Kesteloot and Joosens, which varies by age and sex (15). No estimates of predicted 24-hour Cr were available for individuals <25 years from this study, so estimates for persons 25–29 years were used for those aged 18–24 years in this analysis. Additionally, we estimated 24-hour UIE using individual predicted 24-hour Cr calculated from the current study data with equations developed by Mage et al. (21). The Mage equations were developed to be used with NHANES data, and vary by age, sex, anthropometry, and race (see Table 1 for calculations) (21).
While UIE is the reference standard that we were most interested in comparing iodine estimates from spot samples to, UIC is the most commonly used measure for describing iodine status. Hence, we present data for both observed 24-hour UIE and observed 24-hour UIC. If 24-hour urine volume were 1 L for each individual, then 24-hour UIC would be equal to 24-hour UIE. Data on the various measures of urine iodine were skewed, and the WHO recommends assessing the population median of UIC to describe the iodine status of a population. Therefore, we calculated the median and 25th and 75th percentiles for observed 24-hour UIE and 24-hour UIC and spot UIC, I/Cr, and estimated 24-hour UIE calculated using predicted 24-hour creatinine values from Kesteloot and Joosens, and prediction equations used with our data (from Mage et al.). Median observed 24-hour UIE and 24-hour UIC were calculated for each of the samples of participants with the specified timed urine spot so that sample populations would be comparable. For example, only 332 participants had a morning urine spot, so median 24-hour UIE and 24-hour UIC were calculated using only these 332 participants when comparing with morning urine spot estimates.
Analyses comparing observed 24-hour urine and spot urine estimates were conducted only for estimates with similar units: observed 24-hour UIE with spot estimated 24-hour UIE using the methods of Kesteloot and Joosens and Mage et al. (μg/day), and observed 24-hour UIC with spot UIC (μg/L). We calculated the mean difference and confidence intervals between estimated and observed 24-hour UIE, and between spot and 24-hour UIC. We examined the relative difference in estimated and observed 24-hour UIE and in spot and 24-hour UIC over the range of iodine measures with Bland–Altman plots. The relative difference is the spot urine measure minus the observed 24-hour measure, divided by the mean of the two measures. This was plotted against the mean of the two measures.
To understand the performance of the indicators of estimated 24-hour UIE, we calculated mean observed 24-hour Cr and mean predicted 24-hour Cr using each of the two approaches described earlier. We compared estimates of each predicted 24-hour Cr with observed 24-hour Cr using paired t-tests. All analyses are presented in total, and stratified by race/ethnicity and sex.
Results
Among these U.S. volunteers aged 18–39 years, the observed median 24-hour UIE is 173.6 μg/day, and median 24-hour UIC is 144.8 μg/L (Table 2). Median estimates of iodine status from spot urine samples are 147.3–156.2 μg/L for UIC, 103.6–114.3 μg/g for the I/Cr ratio, 145.7–163.6 μg/day for estimated 24-hour UIE using Kesteloot and Joosens, and 176.5–187.7 μg/day for estimated 24-hour UIE using the Mage equation. Observed median 24-hour UIE is highest among “other race” males (225.2–226.9 μg/day), followed by “other race” females (185.1–187.5 μg/day), black males (167.9–171.2 μg/day), and black females (140.1–148.0 μg/day). These notable race/sex differences in measures of observed 24-hour UIE are diminished or have different patterns in estimates from spot samples. For example, within the same race/ethnic group, 24-hour UIE estimates are higher among males versus females, while with the I/Cr ratio estimates are higher among females versus males. Iodine excretion did not appear to vary consistently by timing of spot urine collection among population subgroups.
Data are presented as median (25th, 75th percentile).
Timing of specimens: morning, the first void occurring between 8:30 AM and 12:30 PM; afternoon, the first void occurring between 12:31 PM and 5:30 PM; evening, the first void occurring between 5:31 PM and 11:59 PM; overnight, the first void after the longest period of sleep occurring between 4:00 AM and 12:00 PM.
24-hour urine iodine estimates are limited to the sample with data for the spot sample in the corresponding row.
Estimated 24-hour UIE (μg/day)=I/Cr ratio multiplied by predicted 24-hour creatinine, where predicted 24-hour creatinine follows the method of Knudsen et al. (12), and uses data from a large Belgian population study by Kesteloot and Joossens and varies by age and sex (15).
Estimated 24-hour UIE (μg/day)=I/Cr ratio multiplied by predicted 24-hour creatinine, where predicted 24-hour creatinine is from Mage et al. and varies by age, sex, anthropometry, and race/ethnicity (21).
UIE, urine iodine excretion; UIC, urine iodine concentration; I/Cr ratio, iodine:creatinine ratio.
Compared with observed 24-hour UIE, mean estimated 24-hour UIE using Mage equations is unbiased among all participants together and among race–sex subgroups regardless of the timing of the spot urine collection (Table 3). The mean differences in observed and estimated 24-hour UIE were not significant (indicated by CI not including 0). Estimated 24-hour UIE using Kesteloot and Joosens was biased in some race–sex subgroups. Using this method, estimated 24-hour UIE was lower than observed 24-hour UIE, particularly among black females.
Data are presented as mean [95% confidence interval].
For individuals, the relative biases in estimates do not appear to vary across the distribution of UIE levels for either Kesteloot and Joosens or Mage equations (Figs. 1 and 2). Using Kesteloot and Joosens, the mean relative bias ranged from −15.1% for the overnight spot to −7.8% for the afternoon spot, and using the Mage equation from −0.8% for the overnight spot to 6.1% for the afternoon spot. Mean relative bias varied little by timing of the spot urine sample for either estimate.
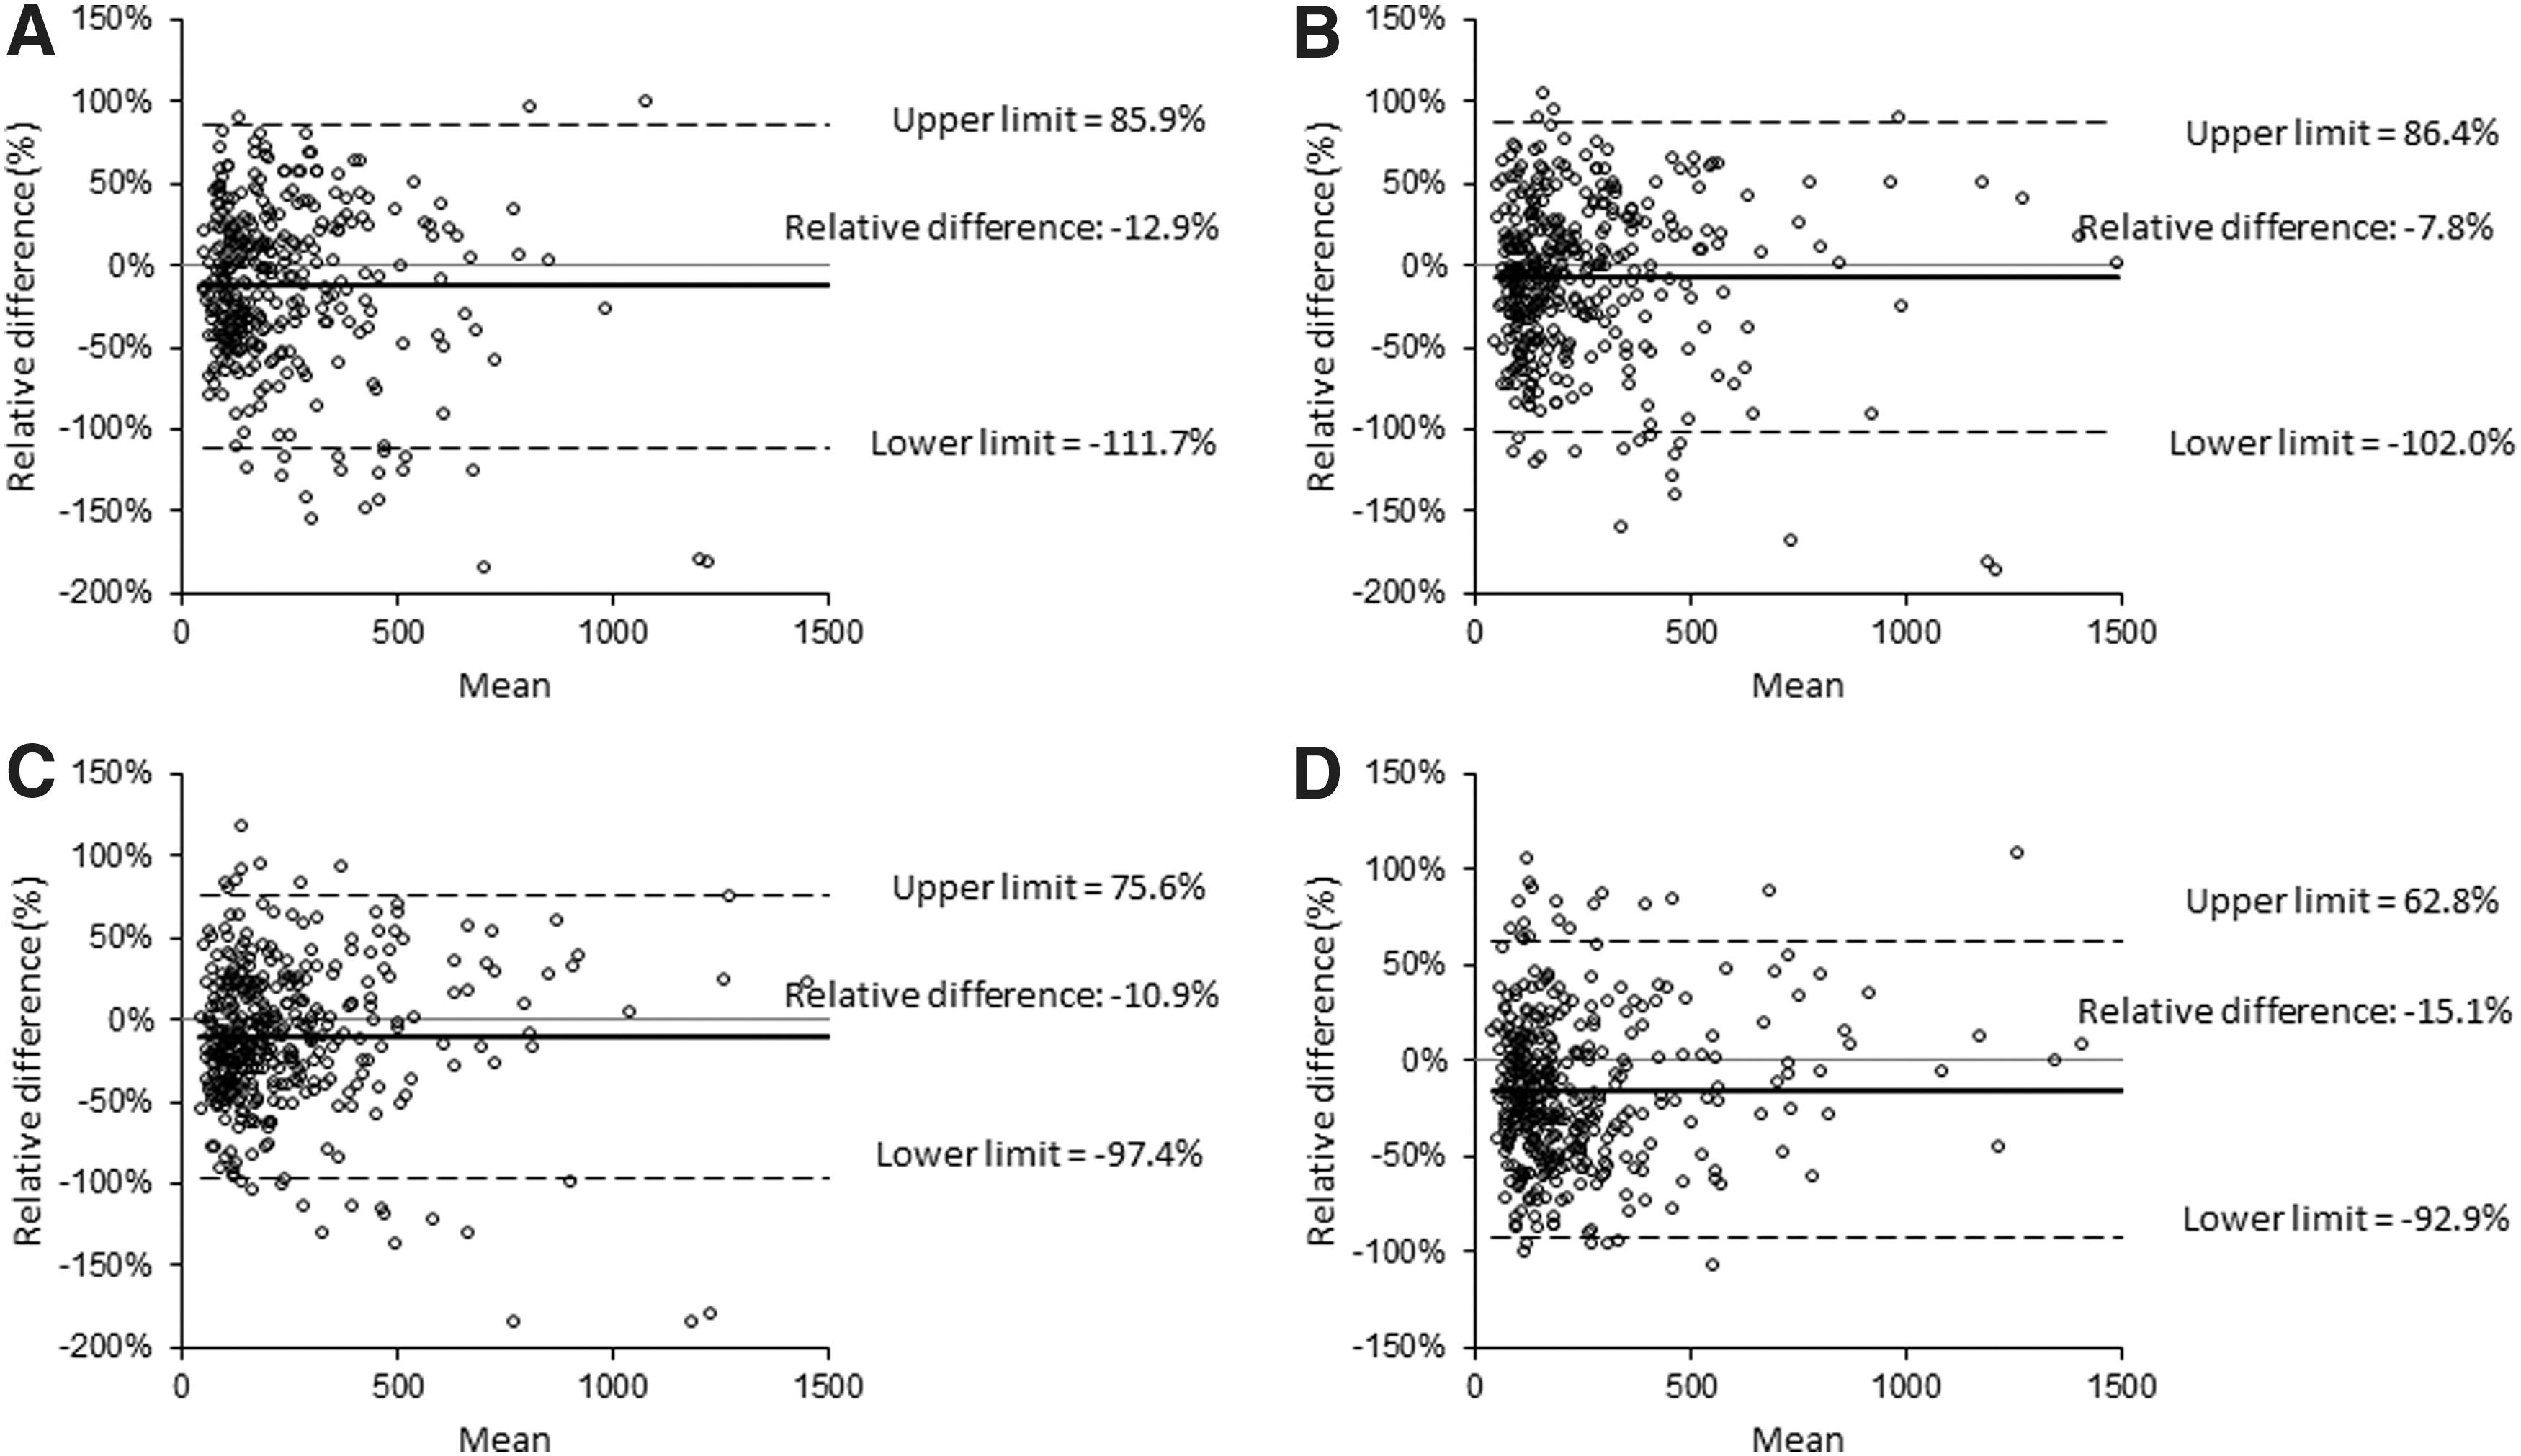
The Bland–Altman plots show the relative level of agreement between observed 24-hour and estimated 24-hour urine iodine excretion (UIE; μg/day) from spot urine samples using predicted 24-hour creatinine (Cr) from Kesteloot and Joosens to calculate estimated 24-hour UIE (15). Timed-spot urine samples were collected in the morning
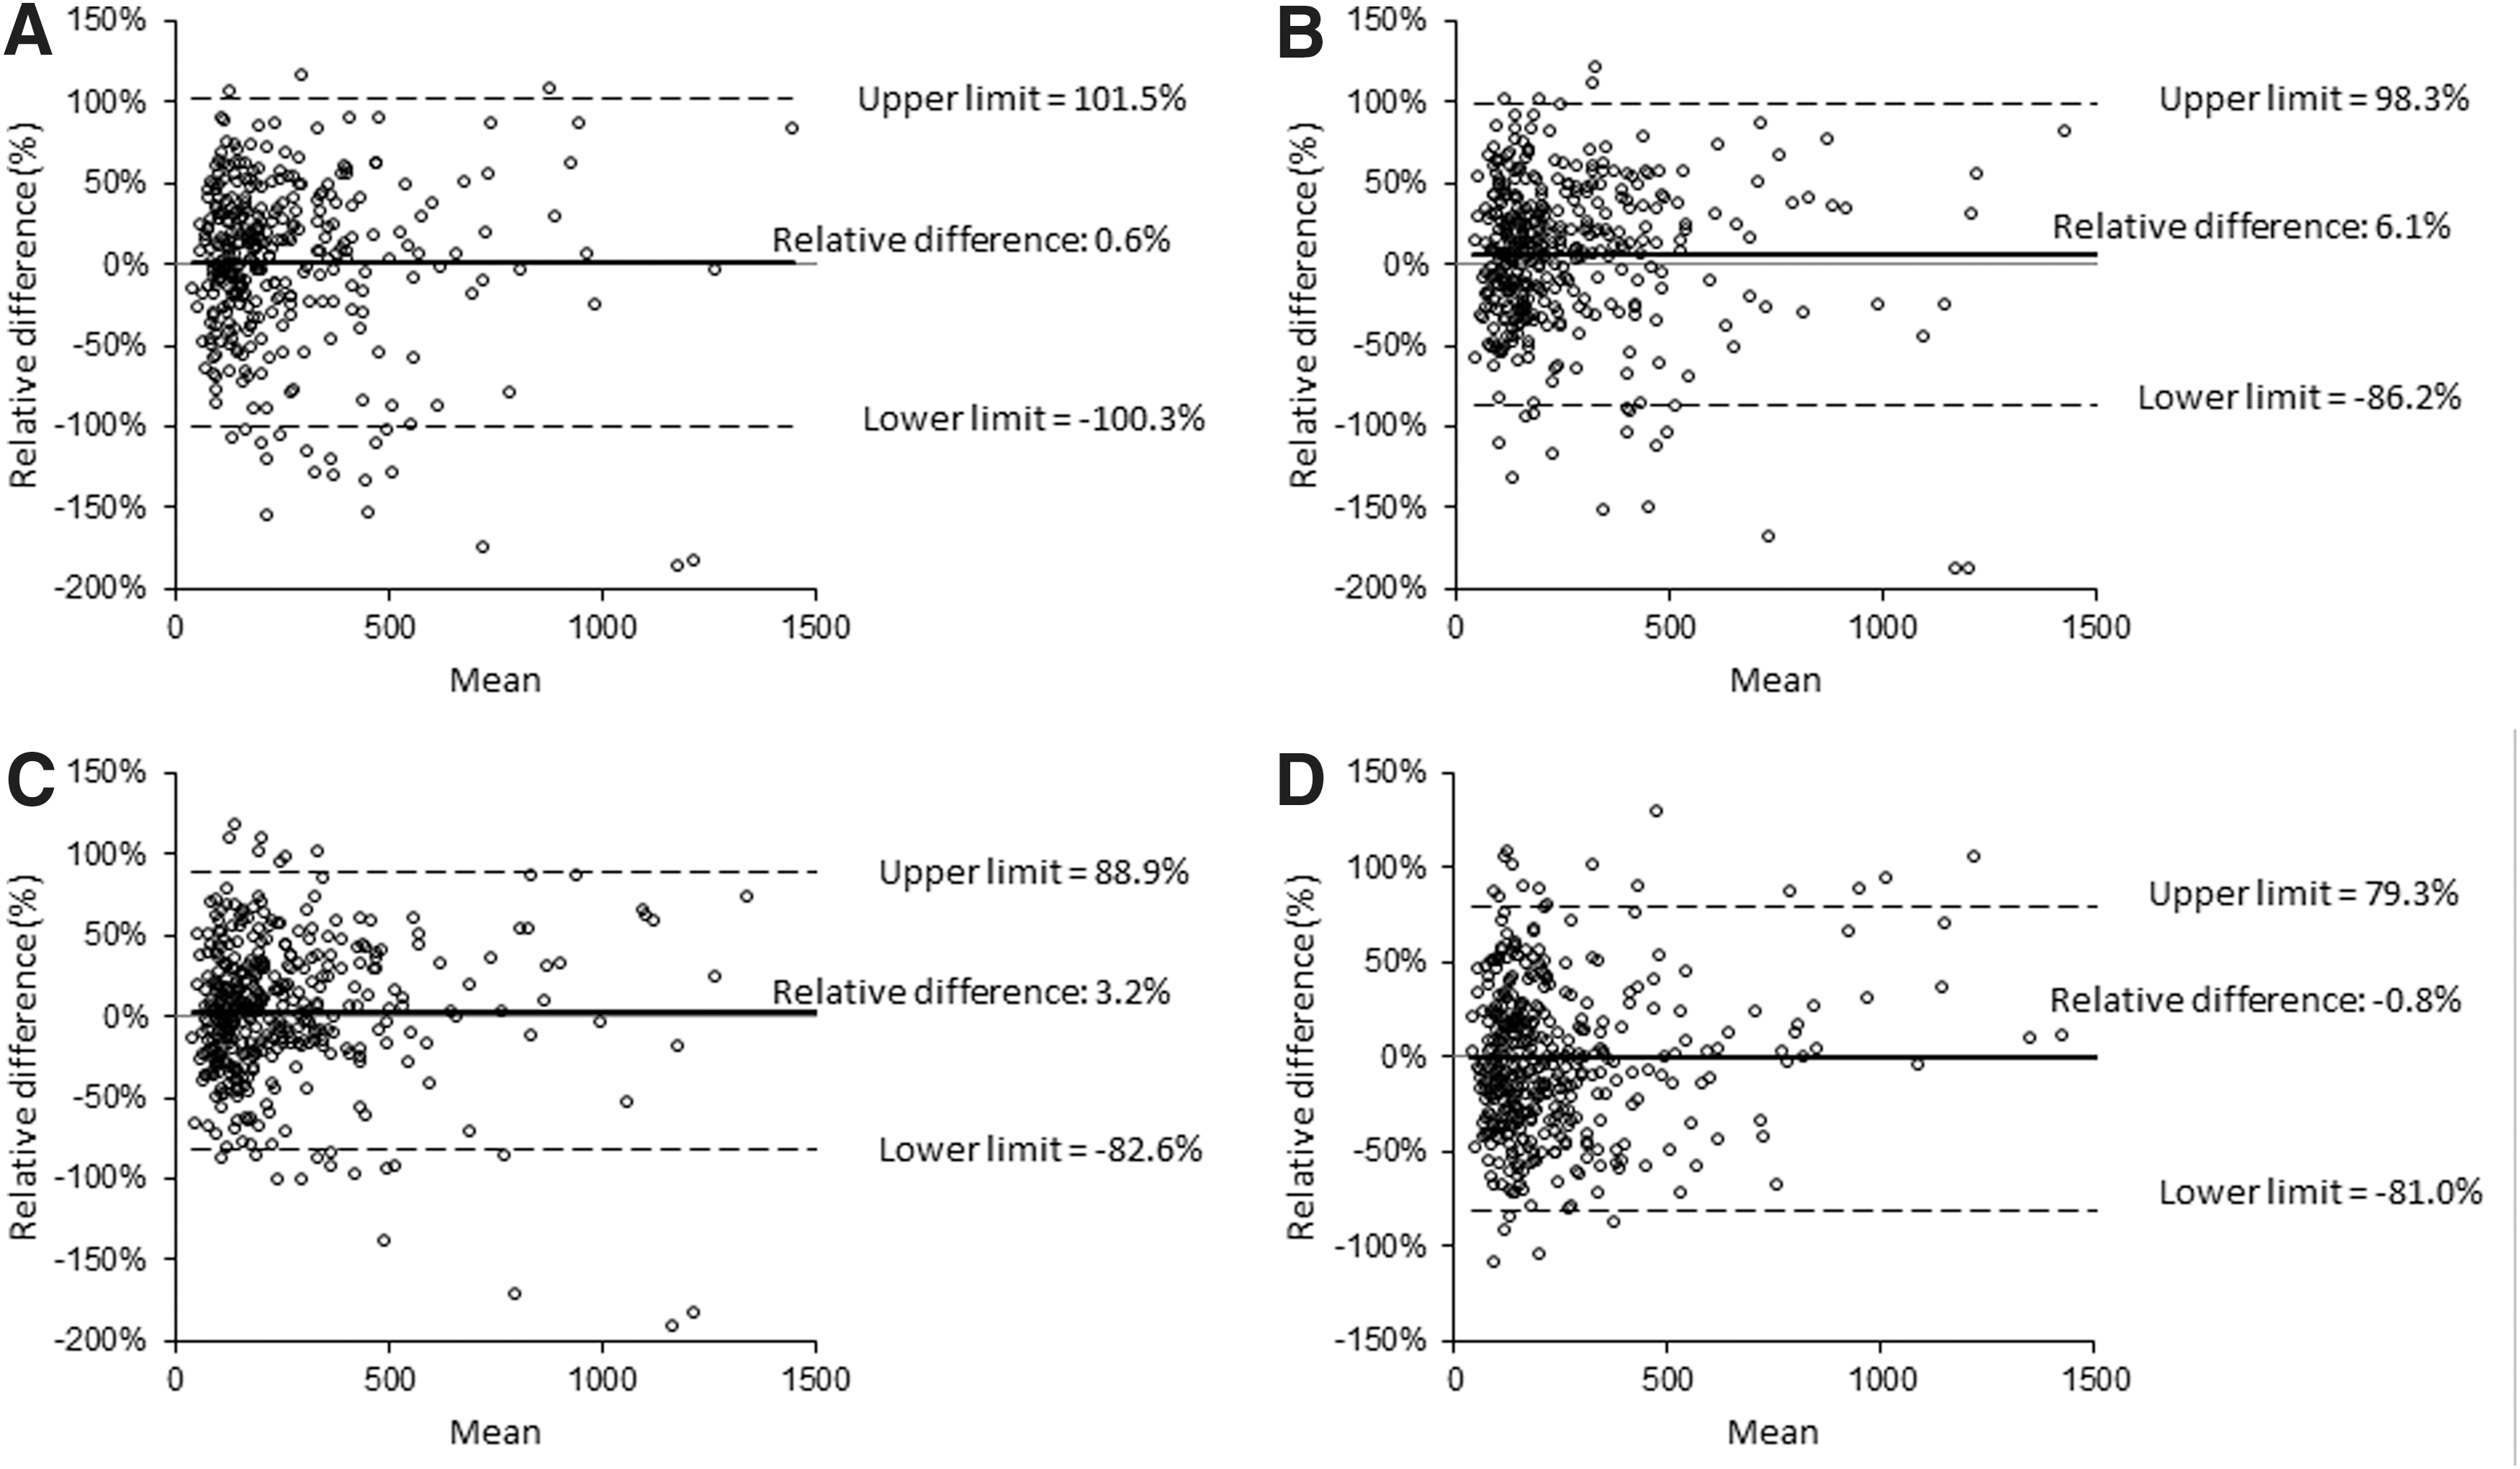
The Bland–Altman plots show the relative level of agreement between observed 24-hour and estimated 24-hour UIE (μg/day) from spot urine samples using 24-hour Cr from predictive equations by Mage et al. to calculate estimated 24-hour UIE (21). Timed-spot urine samples were collected in the morning
Mean bias in spot UIC is not significant for spot urine collected in the morning, afternoon, or evening (Table 4). Overall and among females of other races/ethnicities, spot UIC from an overnight specimen overestimates observed 24-hour UIC. Mean relative differences range from −4.9% for the afternoon spot to 3.9% for the morning spot (Fig. 3).
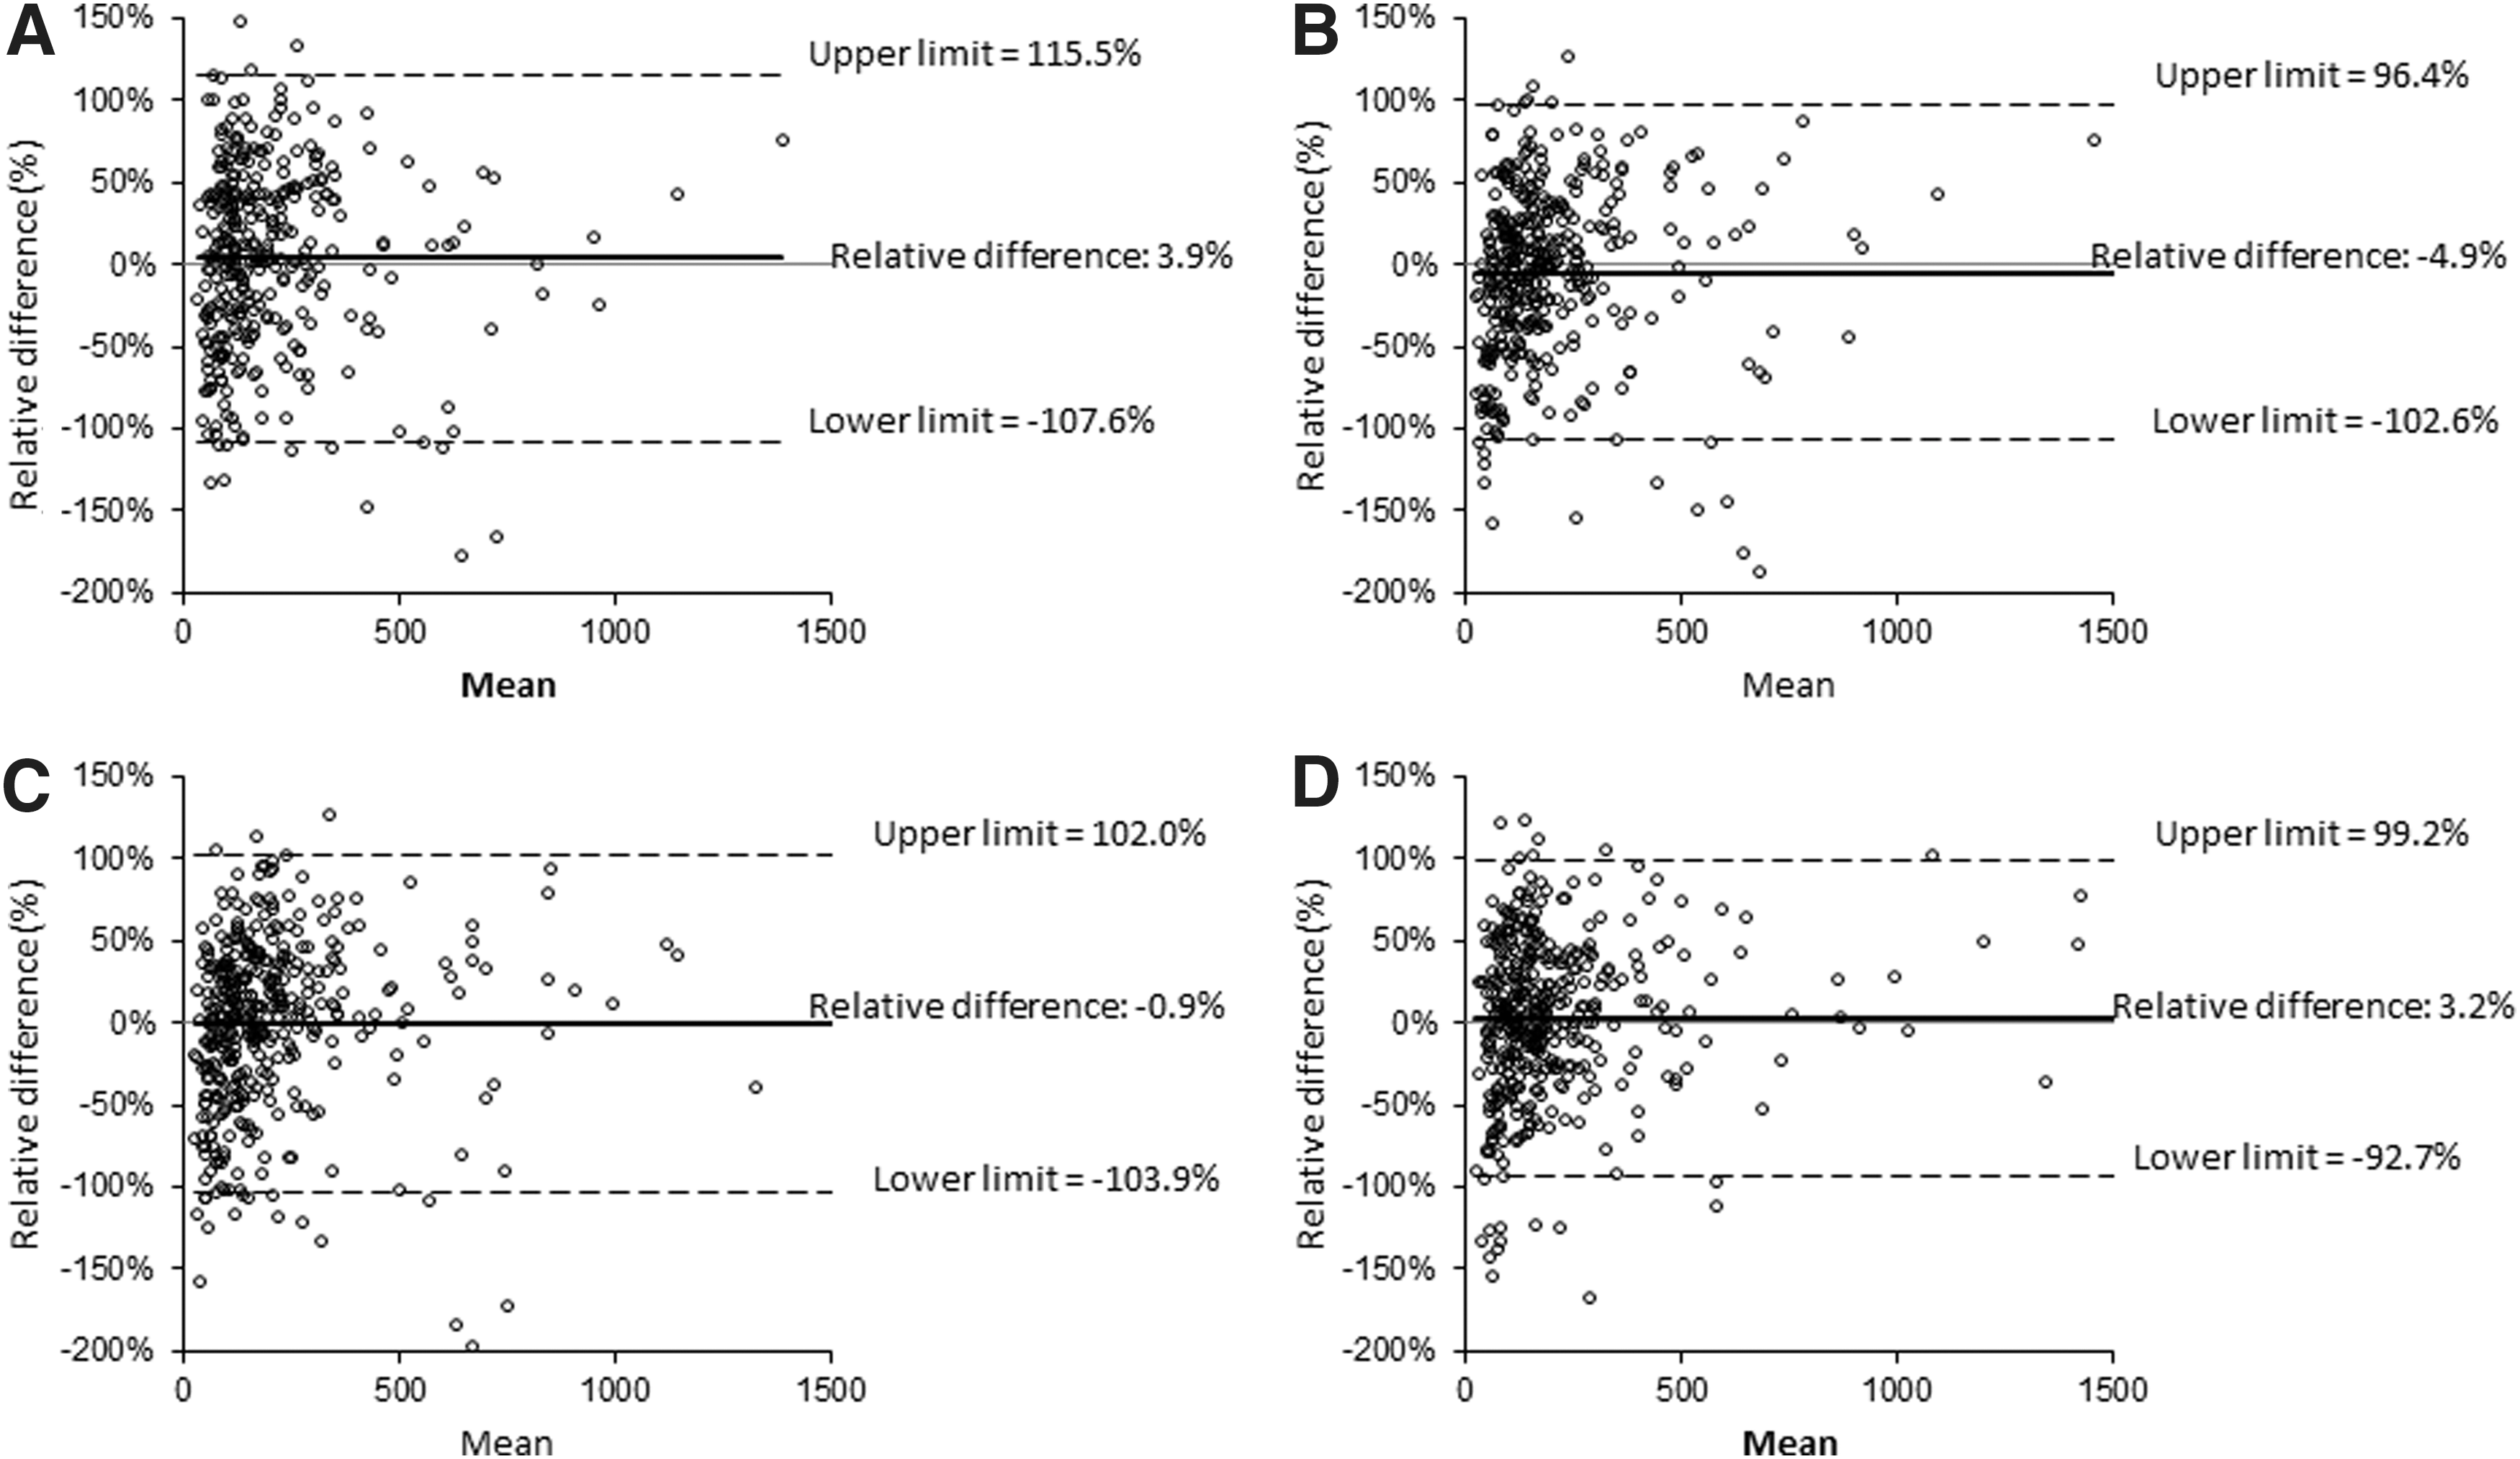
The Bland–Altman plots show the relative level of agreement between observed 24-hour urine UIC (μg/L) and UIC from spot urine samples. Timed-spot urine samples were collected in the morning
Data are presented as mean [95% confidence interval].
Mean observed 24-hour Cr measured among this sample population is 1.61 g, ranging from 1.22 g among “other race” females to 2.04 g among black males (Table 5). Mean predicted 24-hour Cr used in the equations for calculating predicted 24-hour UIE by the methods of Kesteloot and Joosens and Mage differ significantly from observed 24-hour Cr overall and for all racial/ethnic groups (p<0.001). The estimates from Kesteloot and Joosens tend to underestimate, while the estimates from Mage et al. tend to overestimate observed 24-hour Cr.
Data are presented as mean (standard deviation).
Differs from observed 24-hour Cr in paired t-test, p<0.001.
Discussion
In analyses of iodine status, despite different units for some of the measures, UIC, I/Cr, and adjusted measures of I/Cr used to estimate 24-hour UIE have often been considered equivalent to 24-hour UIE (22). While previous studies have explored how some of these measures compare to 24-hour UIE, many had a small sample size, focused on correlation coefficients that lack data on bias, and did not compare all of these estimates to measured 24-hour UIE in the same population (11,12,23 –25). In our analysis, I/Cr consistently and substantially underestimates 24-hour UIE. This is consistent with previous studies reporting that the I/Cr ratio is not a suitable proxy for UIE (22,23,26). The underestimation in our population may be partially due to the relatively young age of our sample, as creatinine is known to decrease with age (10). We found that spot UIC reasonably estimates 24-hour UIC, but both are lower than 24-hour UIE, which is expected, since daily urine output for adults usually exceeds 1 L (27), as was the case in our study. In contrast to Knudsen et al., we did not find that estimated 24-hour UIE using predicted 24-hour Cr from Kesteloot and Joosens is a more accurate estimate of 24-hour UIE than UIC from spot samples (12). This difference in findings may be because estimated 24-hour Cr from Kesteloot and Joosens' analysis of a Belgian population is more comparable to actual 24-hour Cr in the Danish population examined by Knudsen et al. than it is to 24-hour Cr in our sample population. In our sample population, using a measure of estimated 24-hour Cr from a predictive equation developed for use with NHANES data, and that varied by BMI and race/ethnicity, in addition to age and sex, improves performance of the estimated 24-hour UIE.
A sample of spot UIC specimens collected from a population is currently the internationally recognized method for assessing and monitoring the iodine status of a population (8). One appeal of this method is that it only requires the biochemical analysis of one analyte. Further analysis of urine samples for creatinine may be an added constraint to monitoring iodine status in resource-poor settings. Additionally, while WHO has published cutoff values for median UIC to define the iodine status of a population, no such cutoffs exist for any of the other indicators examined here, including 24-hour UIE, making interpretation of these other measures challenging. If analyses in other diverse populations with varying iodine intakes confirm that estimated 24-hour UIE (calculated as I/Cr×predicted 24-hour Cr) better predicts actual 24-hour UIE and should be considered as an indicator of population iodine status, then new thresholds for interpreting iodine status will need to be identified.
While it is well accepted that urine iodine measures can vary throughout the day and from day to day (28), there is less research on whether iodine excretion follows a circadian rhythm, or whether timing of spot urine collection is important for assessing population iodine status. A study of 42 healthy Swiss volunteers aged 4–60 years found a circadian rhythm in spot UIC that increased from approximately noon to midnight, with the lowest UIC levels between 8:00 AM and 11:00 AM (29). Another study of 50 healthy volunteers from New Zealand found no consistent diurnal variation from spot UIC samples (25). Among 10 healthy Danish volunteers, estimated 24-hour UIE (calculated using predicted 24-hour Cr from Kesteloot and Joosens) was significantly lower than measured 24-hour UIE in fasting morning spot samples, but not in spot samples from the first spot after the fasting morning sample or from an evening sample (11). While some of the overnight spot samples in our analysis may have been fasting samples, we did not specifically collect a fasting first morning sample, and we cannot determine if participants were fasting at the time of the urine void. Generally, our data do not suggest that timing of the spot urine collection affects assessment of iodine status at the population level.
This analysis has several limitations. Our study does not include a biochemical validation method, such as the use of para-aminobenzoic acid (PABA) as a recovery biomarker, to determine the completeness of the 24-hour urine collection. Our assessment of urine collection completeness is based on duration of collection time, urine volume, and response to questions about urine collection completeness adapted from the International Cooperative Study on Salt, Other Factors, and Blood Pressure (INTERSALT) (30). Previous analyses among our sample population explored the completeness of the urine collections, including conducting sensitivity analyses excluding individuals who missed collecting one void or who did not meet a threshold of predicted creatinine, a standard method to assess completeness of urine collection (31). These sensitivity analyses found no differences in urine volume or iodine excretion and concluded all participants should be included in analyses (17).
Another limitation is that our sample population is not representative of the U.S. population. Our sample includes healthy volunteers with a relatively narrow age range and stratified selection of participants by race/ethnicity (50% black). Due to the serious consequences of iodine deficiency and the uncertainty of iodine status of pregnant and lactating women and young children, these groups are the most important for monitoring iodine status. It is unclear if our results comparing measures of 24-hour and spot urine iodine would be consistent among these key target groups. Comparison of measures of iodine status among pregnant and lactating women is limited. One analysis of 14 breastfeeding women found that I/Cr×24-hour Cr (using measured 24-hour Cr) was a poor predictor of observed 24-hour UIE (32). Further studies comparing correction factors for iodine estimates and 24-hour UIE among these target groups are needed.
This analysis also has several strengths. First, our sample includes nearly 400 adults, a relatively large sample size for studies collecting 24-hour urine. Second, we used the gold standard ICP-MS method for quantifying urine iodine. This method was not used in most of the previous studies comparing estimates of spot urine iodine and 24-hour UIE. Third, we obtained urine samples from specified time periods throughout the day, allowing us to assess whether the timing of spot urine collection is important for describing population iodine status. Finally, to our knowledge, this is the first study to compare observed 24-hour UIE and an estimate of 24-hour UIE calculated using individual predicted 24-hour Cr from prediction equations used with data from our study population.
Conclusion
The WHO recommends median UIC from spot samples to monitor population iodine status. In this analysis of healthy volunteers aged 18–39 years, we found that spot UIC measures are unbiased estimates of 24-hour UIC. However, since daily urine output among adults usually exceeds 1 L/day, estimates of 24-hour UIC tend to be lower than estimates of 24-hour UIE. In this analysis, estimated 24-hour UIE, calculated as the I/Cr ratio multiplied by predicted 24-hour Cr, is a good estimate of 24-hour UIE when predicted 24-hour Cr is estimated from prediction equations that vary by age, sex, race, and anthropometric measures using individual data from the study sample. Further analyses should confirm if this indicator is a good estimate of 24-hour UIE among pregnant women and women of reproductive age.
Footnotes
Disclaimer
The findings and conclusions in this manuscript are those of the authors and do not necessarily represent the official position of the Centers for Disease Control and Prevention or the National Institutes of Health.
Author Disclosure Statement
The authors have no competing financial interests or other conflicts of interest.