
Abstract
Background:
Nuclear receptors (NRs) play a key role in endocrine signaling and metabolism and are important therapeutic targets in a number of hormone-dependent malignancies. Studies on the role of NRs in thyroid cancer are limited.
Objective:
The objective of the study was to examine systematically the expression of the 48 human NRs in a series of benign and malignant thyroid tissues. Within the papillary carcinoma cohort, we sought to determine if NR expression differed significantly by BRAF mutation status.
Patients and methods:
RNA was isolated from multinodular goiter (MNG; n=6), papillary carcinoma (PTC, n=14), follicular carcinoma (FC; n=5), and Hürthle cell carcinoma (HCC; n=7). The 48 human NRs were profiled in this panel by quantitative real time polymerase chain reaction. Protein expression for selected NRs (Rev-erbα and LXR-β) was examined by immunohistochemistry (IHC) on tissue microarrays comprising benign and malignant thyroid tissues.
Results:
Across all groups of benign and malignant thyroid tissue, there was prominent expression of LXR-β and ROR-γ. Key findings in PTC were marked overexpression of RXR-γ and Rev-erbα compared to MNG. Within the PTC cohort, when BRAF V600E tumors were compared with wild type BRAF, there was relative upregulation of RXR-γ and Rev-erbα and downregulation of AR, ERR-γ, and ROR-γ. In FC, EAR-2 was overexpressed, while PPAR-α and PPAR-δ were underexpressed compared to MNG. The NR expression profile of HCC was distinct, characterized by significant downregulation of a wide range of NRs. IHC for Rev-erbα and LXR-β localized protein expression to the tumor cells. Moderate to strong Rev-erbα immunostaining was seen in 22 out of 23 PTC, and, overall, staining was stronger than in the benign group.
Conclusions:
These results represent the first systematic examination of NR expression in thyroid cancer. Our finding of tumor-specific patterns of NR expression, as well as significant differences in NR expression between BRAF V600E and wild type BRAF PTC, provides a basis for further mechanistic studies and highlights potential novel therapeutic targets for this malignancy.
Introduction
T
Differentiated epithelial thyroid cancer includes papillary carcinoma (PTC) and follicular carcinoma (FC). Hürthle cell carcinoma (HCC) or oncocytic follicular carcinoma has been considered a subtype of FC, although these tumors have distinct morphological features and are characterized by underlying mitochondrial alterations (2). The majority of differentiated thyroid cancers are effectively treated by thyroidectomy with or without radioactive iodine ablation. In a minority of cases, there is persistent disease, which may result in considerable morbidity and, in some cases, mortality. Advanced thyroid cancer is often refractory to radioiodine therapy, and treatment options are limited, with most tumors responding poorly to conventional chemotherapy (3). Tyrosine kinase inhibitors have shown promise. However, only a subset of patients respond, and the duration of response is variable (4). Consequently, there is a need for new therapies targeted at the underlying biology of thyroid tumors.
The nuclear receptor (NR) superfamily members include ligand-dependent transcription factors, as well as apparently ligand-independent orphan nuclear receptors. NRs play a key role in endocrine signaling in metabolism and hormone-dependent malignancies. There have only been limited studies on the role of NRs and their expression in normal thyroid tissue and thyroid malignancy. Estrogen receptor-α and -β expression in normal and malignant thyroid tissue has been examined, although results are conflicting (5 –8). Studies using thyroid cancer cell lines have suggested that estrogen is pro-proliferative and may promote tumor progression (9,10). In vitro and in vivo studies of retinoids have been conducted in thyroid cancer on the basis of purported effects on proliferation and differentiation (11 –16); the expression of retinoid receptors has been studied in this context (17,18). A potential tumor suppressor role of thyroid hormone receptor in thyroid malignancy has been reported in a mouse model of FC (19). Little is known about the role of other NRs in thyroid cancer, nor has there been a systematic expression profiling of the entire NR superfamily. Although such data might in principle be obtained from microarray data sets, the relatively low abundance of transcription factors means that NRs are often not captured in microarray analysis.
Therefore, in order to evaluate the expression of NRs in differentiated thyroid cancer systematically, we used the commercial ABI TaqMan® Low-Density Nuclear Receptor Gene Signature Array (TLDA; Applied Biosystems. Foster City, CA; Cat. no.: 4379961) to screen cohorts of PTC, FC, HCC, and multinodular goiter (MNG). MNG was used as a benign comparator on the basis that nodule formation in these glands is distinct (20 –23).
We further subdivided the PTC cohort according to the presence of the BRAF V600E mutation. BRAF is a member of the RET/RAS/RAF/MAPK signaling pathway. The BRAF V600E mutation is exclusive to PTC and is the most common somatic mutation (40–60%) in this tumor. Evidence supports its role in the pathogenesis of PTC (24).
This data set corroborates and extends previous studies on individual NRs in thyroid cancer. The distinct tumor-specific NR gene expression profiles in these tumors provide a basis for further mechanistic studies and suggests potential novel therapeutic targets for the treatment of thyroid malignancy.
Materials and Methods
Isolation of RNA from tissue
Prior to RNA extraction, a representative section of each malignant thyroid tumor was reviewed by a pathologist and scored for the percentage of tissue components such as tumor, stroma, and inflammatory infiltrate. Only those tissues in which the representative sample contained at least 70% tumor component were included in the study. MNGs were sampled randomly.
RNA was extracted from frozen tissue using the PureLink RNA Mini Kit (Invitrogen, Carlsbad, CA). The RNA quality was checked by electrophoresis using a Bio-Rad Experion™ automated electrophoresis system (Bio Rad Laboratories, Hercules, CA). RNA was isolated from PTC (n=14), HCC (n=7), FC (n=5), and MNG (n=6). The details of the individual tumors and the BRAF mutation status of PTC are shown in Table 1. The collection and use of this tissue were approved by the Research and Ethics Committee of Box Hill Hospital, Box Hill, Australia. Tissue was accessed through the Victorian Cancer Biobank, and all patients gave written informed consent for the collection of tissue.
PTC, papillary thyroid carcinoma; HCC, Hürthle cell carcinoma; FC, follicular carcinoma; MNG, multinodular goiter; F, female; M, male; Y, yes; N, no; NS, not sampled.
BRAF mutation detection
Screening for BRAF mutations was by real time polymerase chain reaction (RT-PCR) as described previously (25) (see Supplementary Data, available online at
TLDA
As in previous studies of NR gene expression (26,27), commercial microfluidic cards, the TLDAs that contain an exclusive set of TaqMan Gene Expression Assays for the 48 NRs and 16 internal controls were used to profile gene expression (Supplementary Data). These controls span the relative abundance/Ct range of the genes on the card.
For each sample, 1.5 μg of total RNA was reverse transcribed using random hexamers with SuperScript III reverse transcriptase (Invitrogen) in a total volume of 45 μL. A total of 100 μL reaction mixture containing 50 μL cDNA template (333 ng) in RNase-free water and an equal volume of TaqMan universal master mix (Applied Biosystems) was added to each TLDA fill reservoir. Four reservoirs per sample were filled. The TLDA includes all NRs and endogenous controls in triplicate. After sealing the plate, it was run on an ABI 7900HT Real Time instrument (Applied Biosystems).
Statistical analysis
The TLDAs were analyzed using the relative quantification method of ΔCt (Fig. 1). The geNorm software imbedded within the ABI/Intergromics StatMiner v4.1 software package was used to compute least expression variation and select the most appropriate, stable, and robust combination of internal control genes with which to normalize the expression data (against the mean of the most stable controls). The expression data were normalized to the median of HPRT1, PPIA, and TFRC.
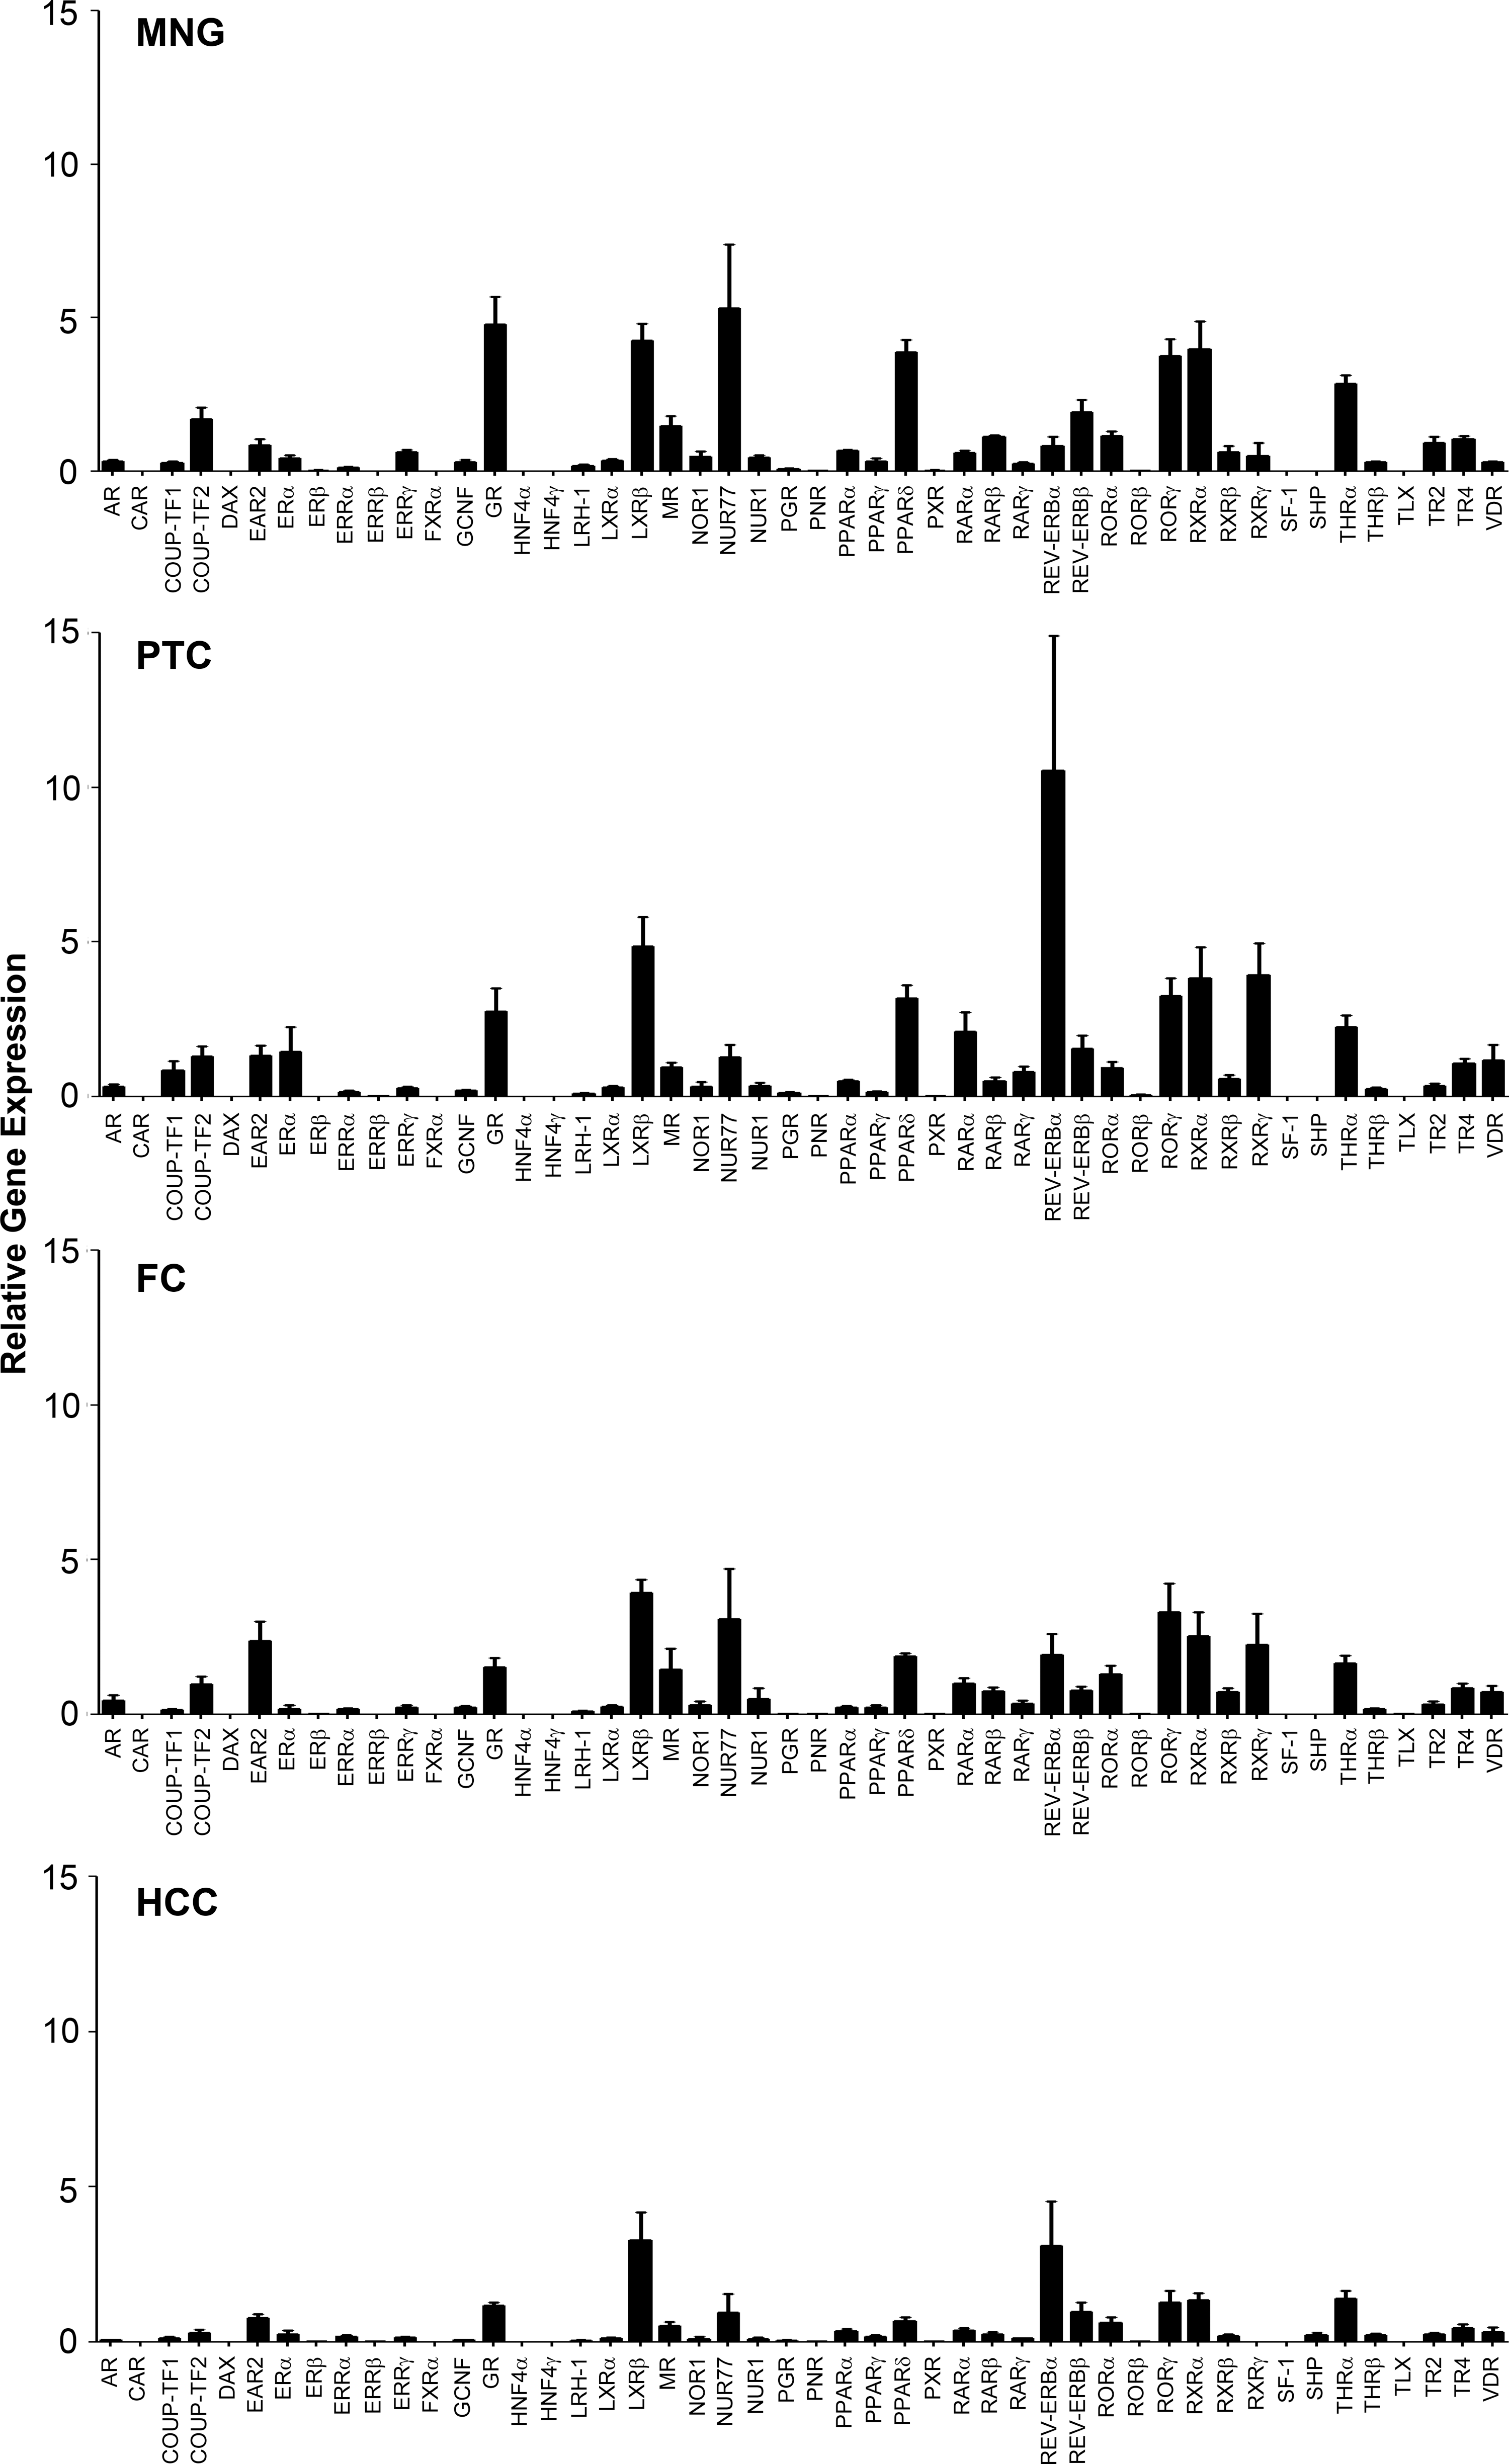
Nuclear receptor gene expression in multinodular goiter (MNG; n=6); papillary carcinoma (PTC; n=14); follicular carcinoma (FC; n=5); Hürthle cell carcinoma (HCC; n=7). Samples with a CT value of ≥35 were given a value of 0. Data are presented as the relative expression normalized to the median of the geNorm selected controls of HPRT1, PPIA, and TFRC. The bar graphs represent mean±standard error of the mean (SEM) for each of the tumor types. Each tumor sample was run in triplicate.
Significant changes in expression relative to reference samples or an FDA approved universal human tumor RNA sample (Stratagene, La Jolla, CA), were analyzed using the ABI/Integromics StatMiner software package as previously done (26,27); see Supplementary Data.
Tissue microarray
Formalin-fixed, paraffin-embedded blocks routinely prepared from surgical specimens were selected. Representative areas containing tumor were identified by a pathologist. Duplicate tissue cores with a diameter of 1 mm were taken from each specimen (Beecher Instruments, Silver Spring, MD). The following tissues were studied: benign (normal thyroid, n=2; MNG, n=6); PTC (BRAF wild type, n=9; BRAF V600E , n=14); FC (n=5); and HCC (n=5).
Immunohistochemistry
Three micrometer tissue sections were cut from each arrayed paraffin block and prepared on pathological slides. Prior to staining, the sections were dewaxed and rehydrated in graded ethanol washes. After microwave antigen retrieval, endogenous peroxidase activity was blocked with 3% hydrogen peroxide for 10 minutes. The sections were incubated with anti Rev-erbα polyclonal antibody, dilution 1:100 (Sigma Aldrich, St. Louis, MO; Cat. no.: HPA007935) and anti LXR-α/β polyclonal antibody, dilution 1:100 (Lifespan Biosciences, Seattle, WA; Cat. no.: LS-B262). Sections were incubated at room temperature for 60 minutes with the primary antibody dissolved in EnVision FLEX Antibody Diluent (Dako, Glostrup, Denmark). Subsequently, the sections were incubated for 30 minutes with Envision Link HRP (Rabbit/Mouse) reagent (Dako). Diaminobenzidine (DAB) was used as a substrate for staining development, and slides were counterstained with hematoxylin. Negative controls were stained with rabbit polyclonal IgG (Abcam, Cambridge, United Kingdom; Cat. no.: 27472) at the same concentration as the primary antibodies.
Immunohistochemical interpretation
Immunohistochemical stains for Rev-erbα were scored, blinded to the histopathologic diagnosis and BRAF mutation status of the tumors. Staining intensity in the epithelial cells was scored as 0 (no staining); 1+ (faint), 2+ (moderate), or 3+ (strong).
Results
Details of the thyroid tissues examined and the BRAF status of PTC are shown in Table 1. The relative expression of each NR normalized against software-selected geNorm controls for MNG, PTC, FC, and HCC is shown in Figure 1. We use the same names as the Nuclear Receptor Signaling Atlas (NURSA), the HUGO Gene Nomenclature Committee (HGNC), and the International Union of Basic and Clinical Pharmacology (IUPHAR) for the NRs; the systematic numbering nomenclature can be found in Supplementary Table S1.
In MNG, the highest levels of expression were seen for Nur77 and the glucocorticoid receptor (GR), with abundant expression also seen for liver X receptor-β (LXR-β), retinoid X receptor-α (RXR-α), retinoic acid receptor (RAR)–related orphan receptor-γ (ROR-γ), and peroxisome proliferator-activated receptor-δ (PPAR-δ). The NR expression profile of MNG was compared with the NURSA mouse thyroid data set (28). Concordance in relative expression was seen for the majority of NRs, with several exceptions. Of the six most abundantly expressed NRs in each group, concordance was seen for LXR-β, RXR-α, ROR-γ, GR, thyroid hormone receptor-α (TR-α), and PPAR-δ. The expression profiles of three NRs were dichotomous, including Nur77 (abundant in MNG only) and vitamin D receptor (VDR) and RXR-β (abundant in mouse thyroid only).
Considerable variability in NR expression was observed in both PTC and FC, with very low or no expression seen for a number of NRs, while other receptors showed relatively abundant expression. The PTC group was remarkable for high expression levels of Rev-erbα and RXR-γ. As with MNG, abundant expression was also seen for LXR-β, RXR-α, ROR-γ, and PPAR-δ.
In FC, the highest expression levels were seen for LXR-β, with abundant expression also seen for ROR-γ, Nur77, RXR-α, RXR-γ, and v-erbA-related receptor (EAR-2).
The HCC cluster was notable for low relative expression of the majority of NRs. Within this group, LXR-β and Rev-erbα showed higher relative expression compared to the other NRs.
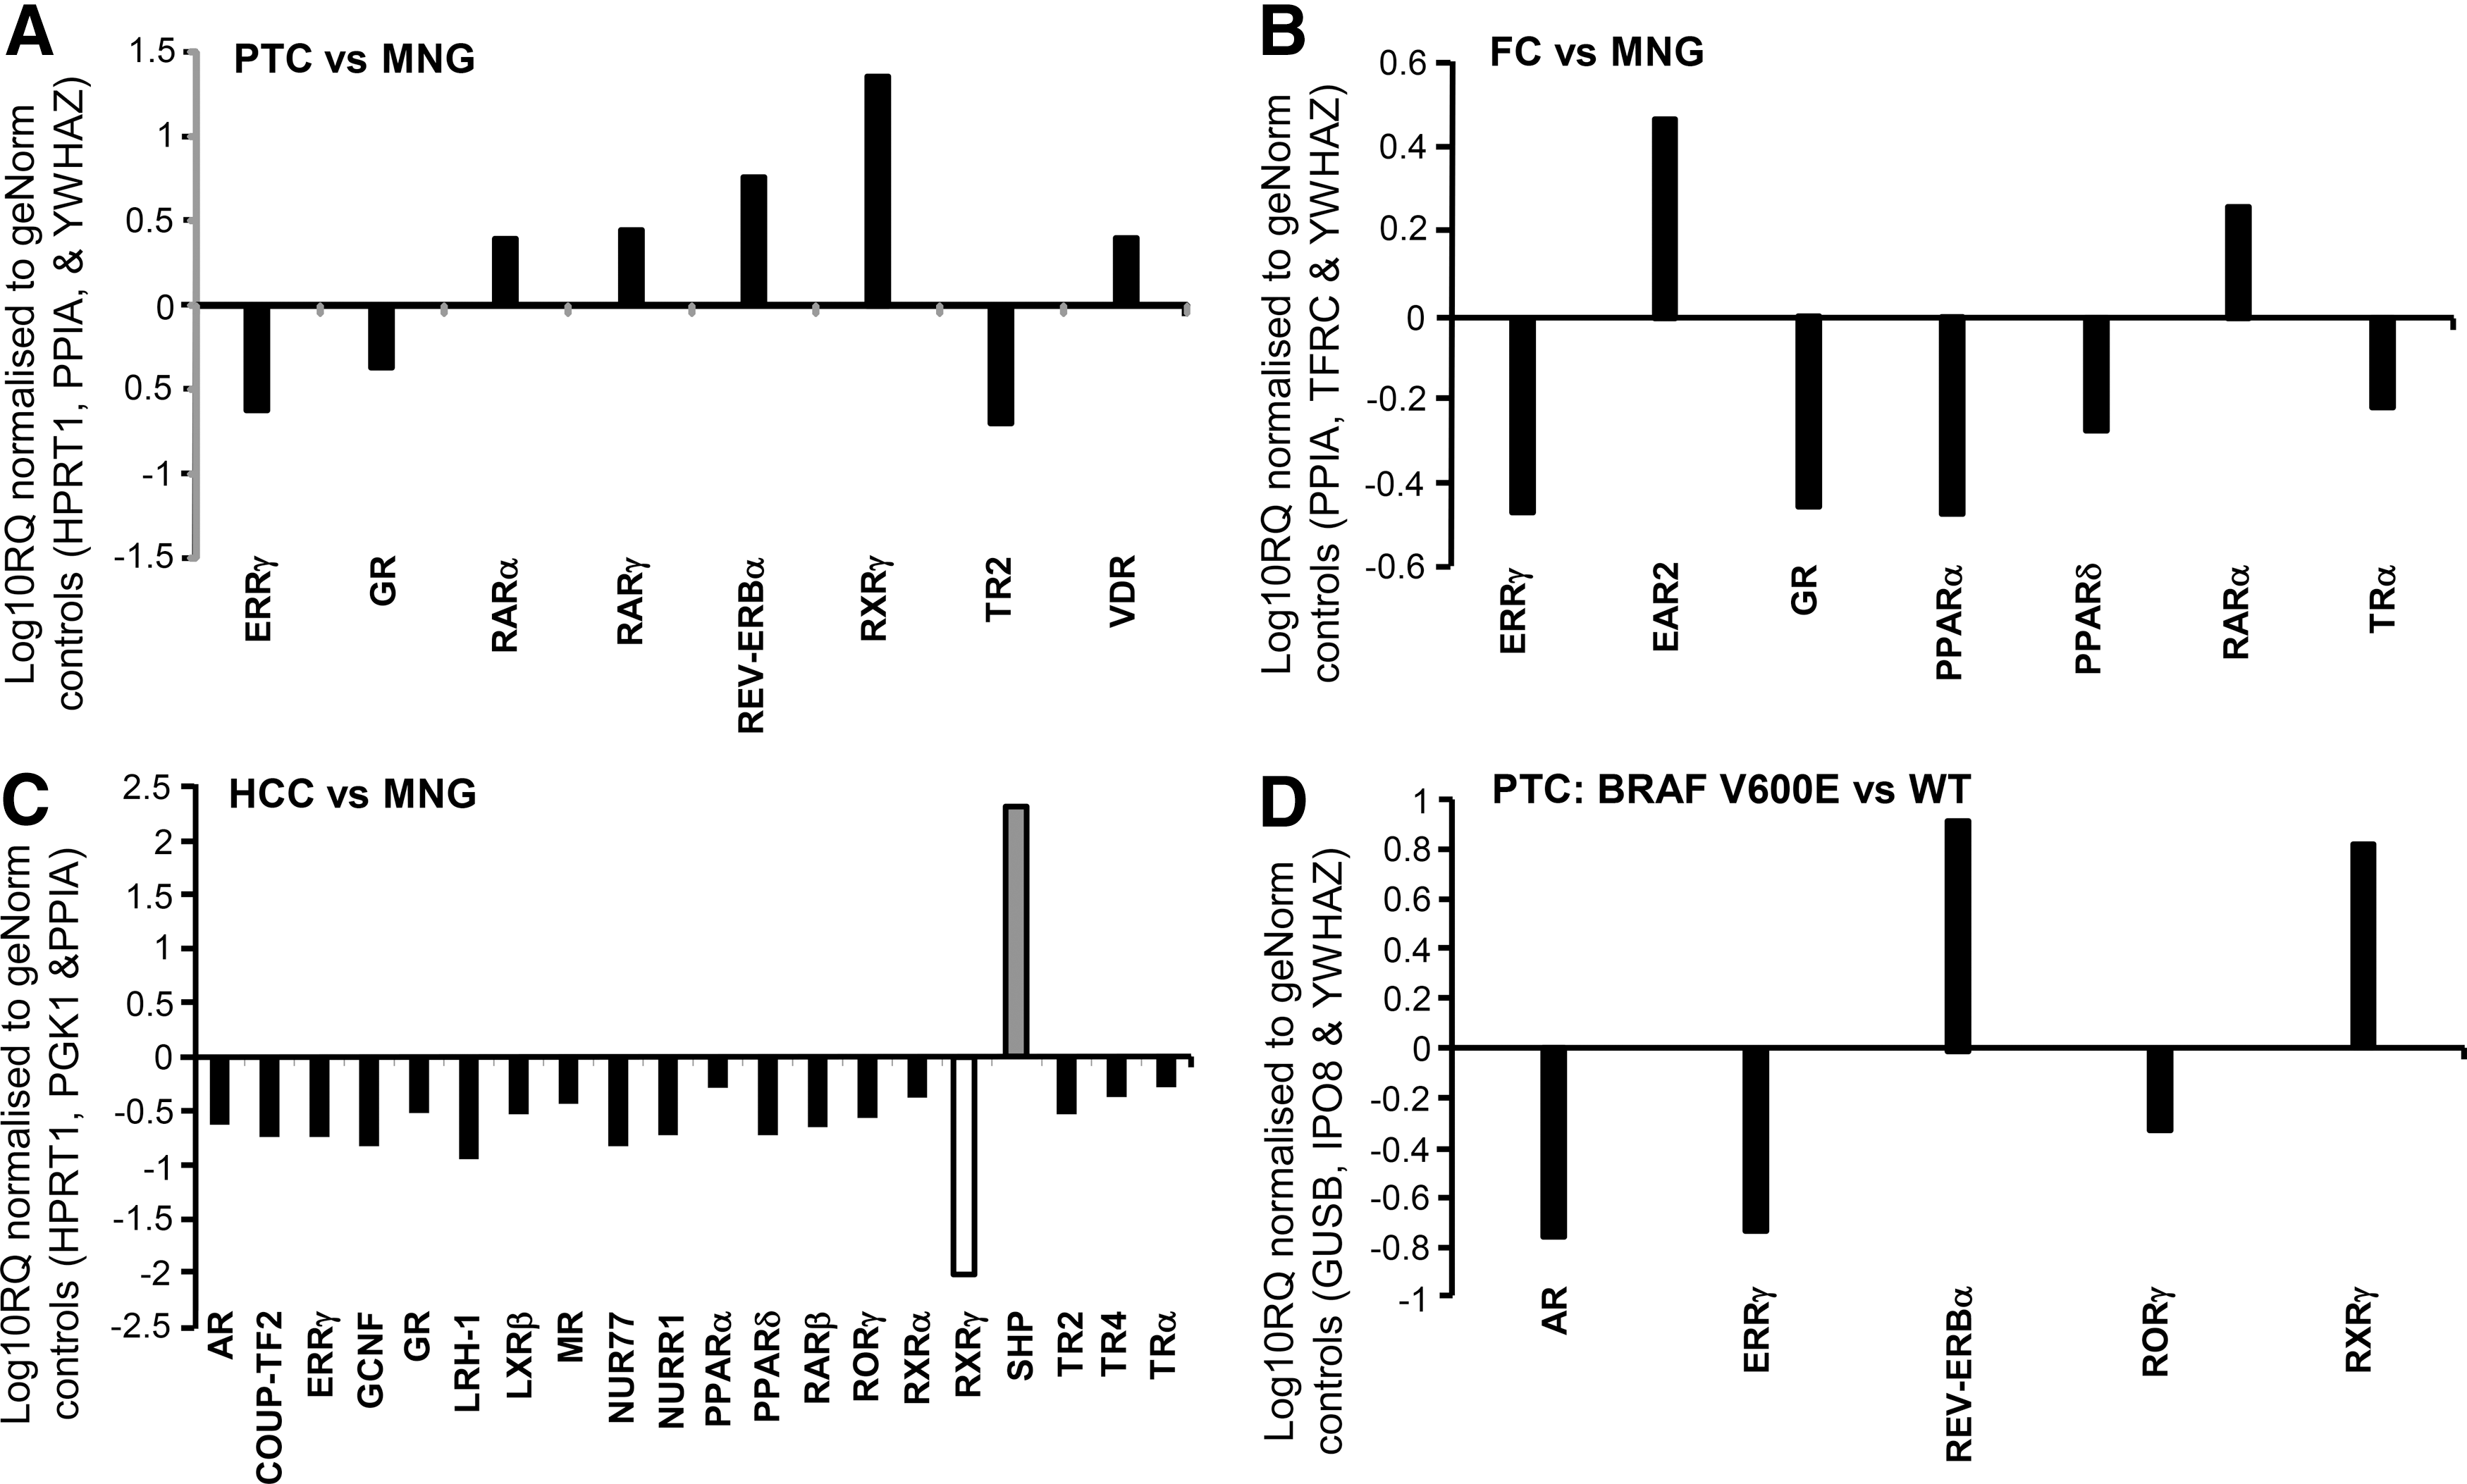
Figure 2 shows comparisons of relative expression between the three tumor groups (PTC, FC, HCC) and MNG (Fig. 2A–C) normalized to software-selected geNorm controls (unique to each comparison). These data are expressed as a fold change (either increased or decreased expression relative to baseline) on a logarithmic scale. Figure 2D illustrates the comparison between BRAF mutation–positive and wild type BRAF PTC. All of the comparisons shown in Figure 2 represent statistically significant differences in NR expression (p<0.05), recognized as valid by the StatMiner software. Further data showing nonsignificant differences in NR expression can be found in the Supplementary Data.
Genes identified as significantly different in StatMiner analysis of
Key findings in PTC were marked overexpression of RXR-γ and Rev-erbα compared to MNG. Within the PTC cohort, when BRAF V600E tumors were compared with wild type BRAF, there was relative upregulation of RXR-γ and Rev-erbα, and downregulation of AR, ERR-γ, and ROR-γ. In FC, EAR-2 was overexpressed, while PPAR-α and PPAR-δ were underexpressed compared to MNG. The NR expression profile of HCC was distinct, characterized by the significantly decreased expression of a wide range of NRs. Although the short heterodimer partner (SHP) gene appears relatively upregulated in HCC, absolute levels are low in HCC and negligible in the other groups, so this finding is unlikely to be biologically significant.
The individual tumor levels for the five genes whose expression was significantly different (p<0.05) between BRAF mutation–positive and wild type BRAF PTC (Fig. 2D) are shown using scatter plots (Fig. 3). Of these genes, RXR-γ expression segregates most distinctly according to BRAF mutation status, with only one outlier in each group. Expression of Rev-erbα was relatively low in all the wild type BRAF PTC, whereas a subset of BRAF mutation–positive PTC had substantially higher levels, and one tumor had markedly elevated expression.
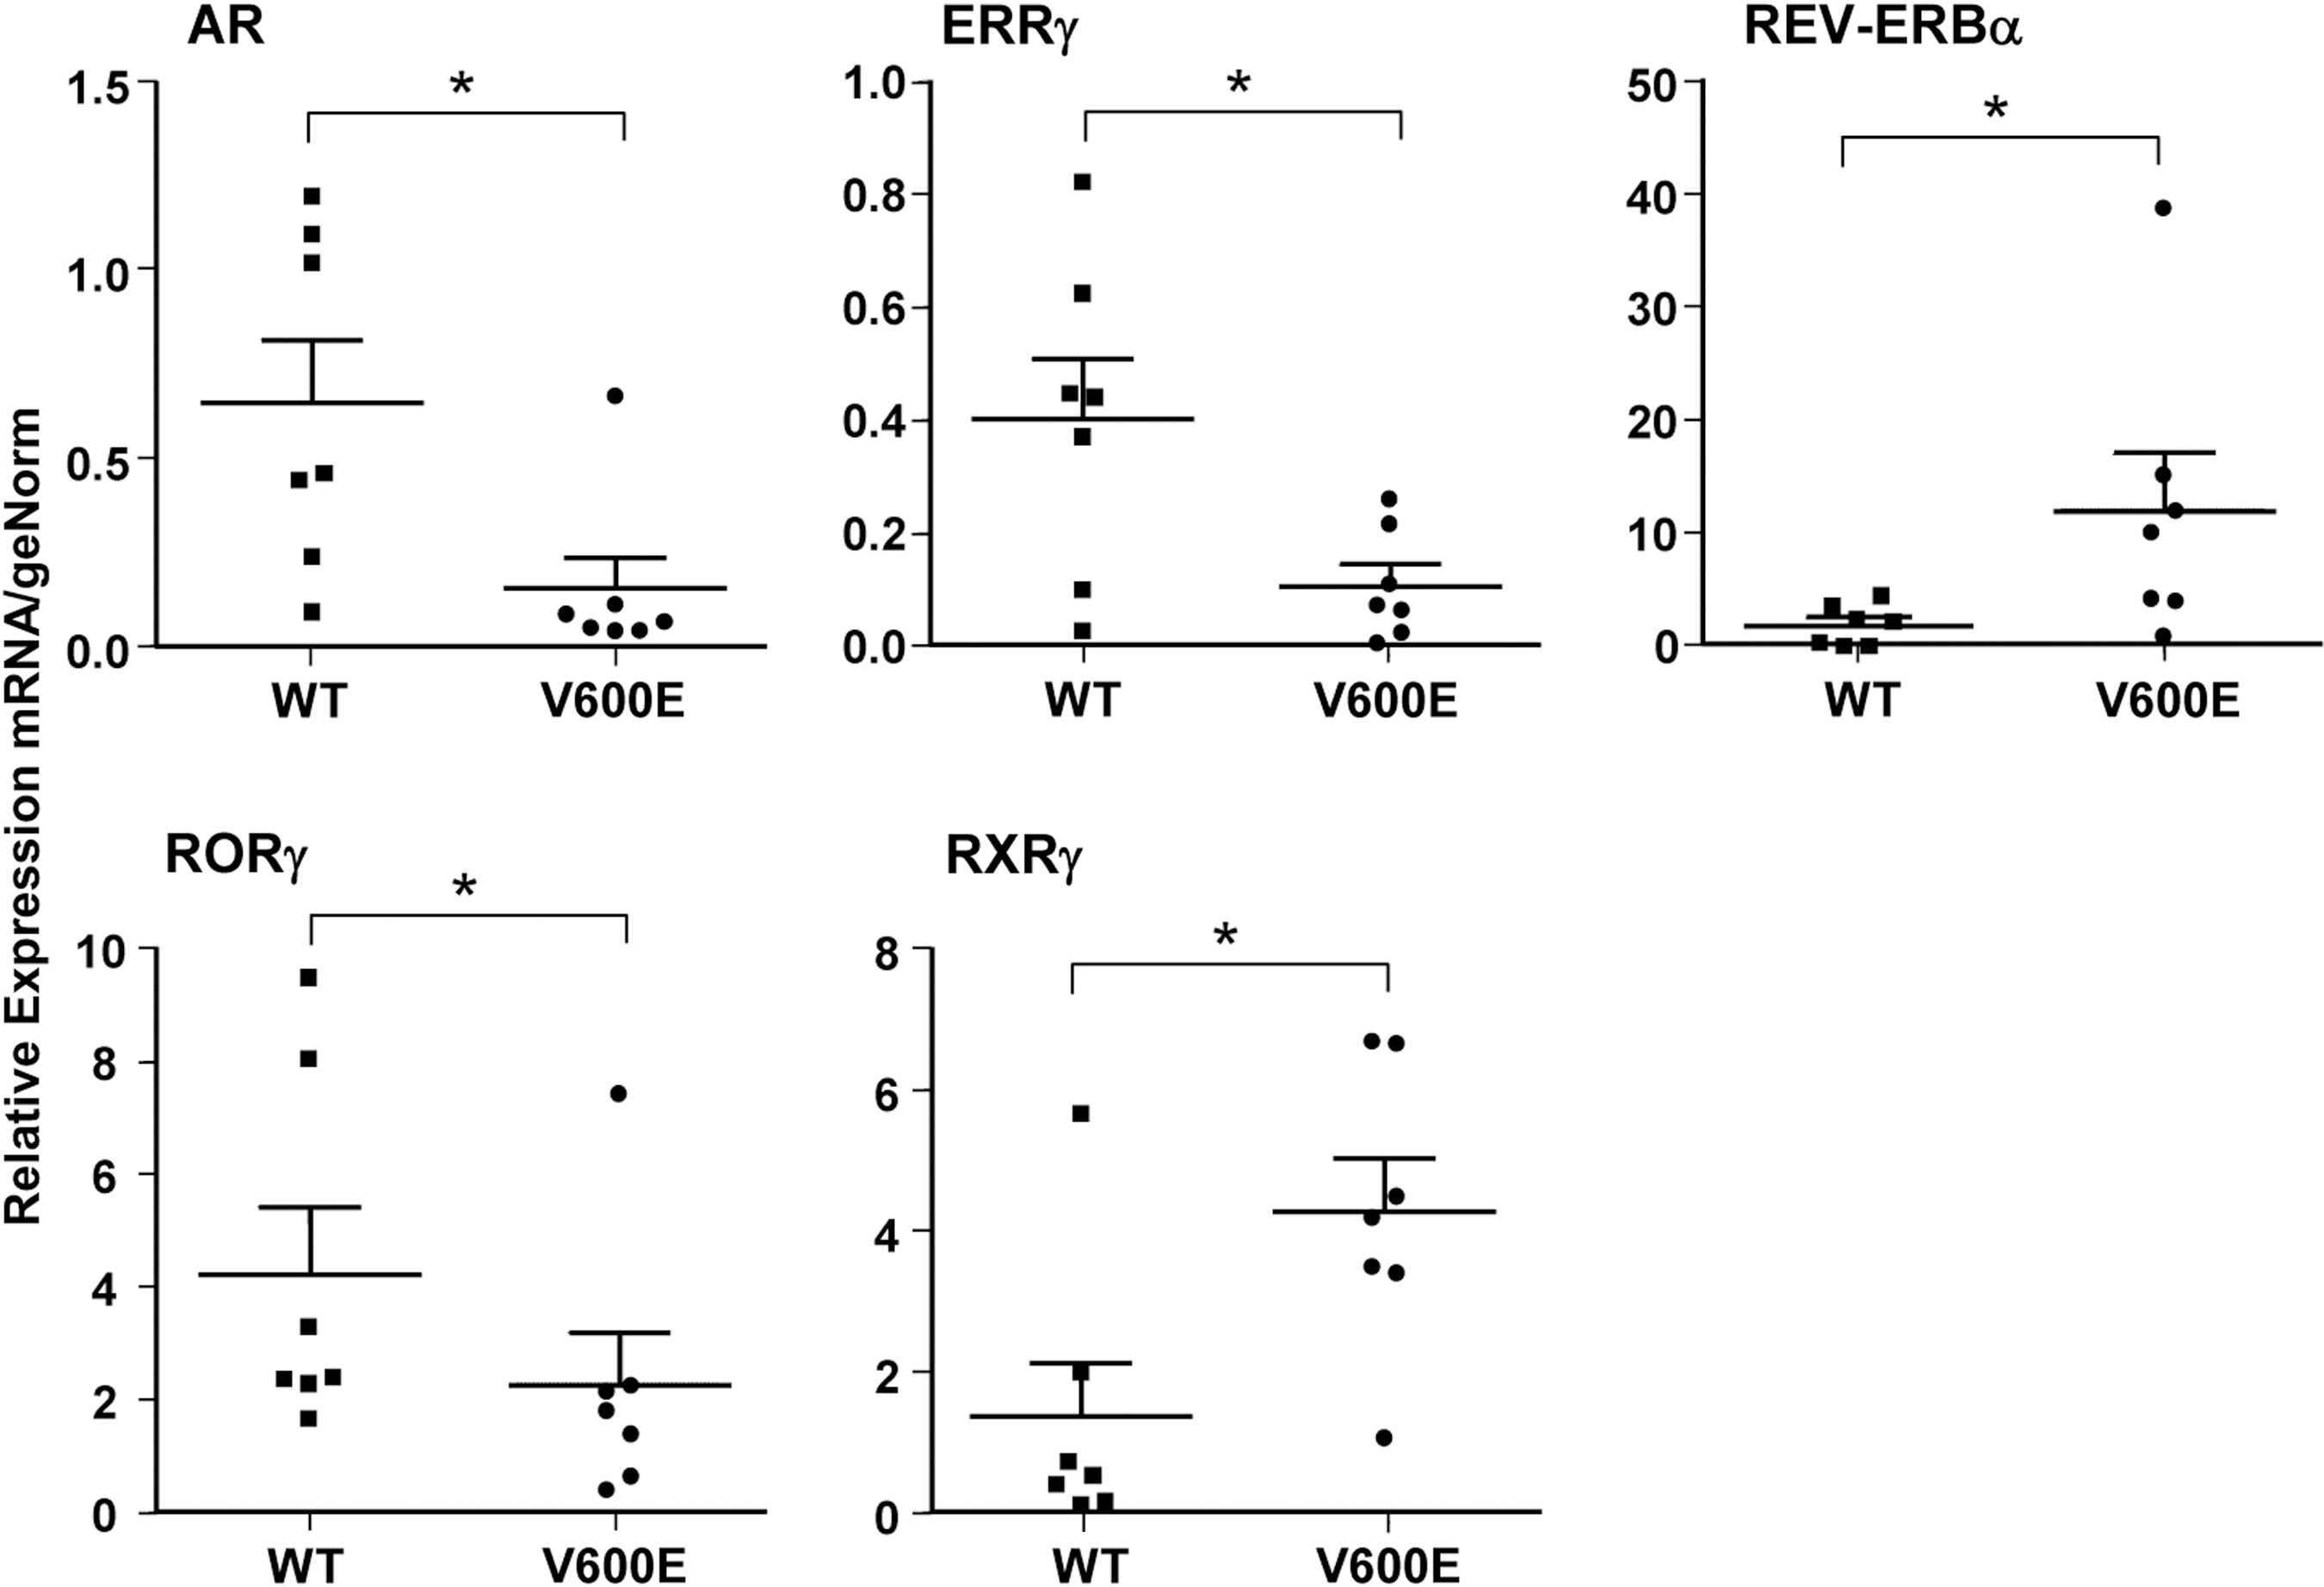
Scatter plot analysis showing individual tumor levels for the five significantly different (p<0.05) genes in the papillary BRAF mutation–positive carcinoma versus papillary BRAF wild type carcinoma comparison as identified by StatMiner (Fig. 2D). The middle line represents the mean and the lines below and above delineate the standard error of the mean.
Immunohistochemistry (IHC) for Rev-erbα and LXR-β localized protein expression to the epithelial cells and, unexpectedly, expression for both NRs was predominantly cytoplasmic in the malignant tumors. Figure 4 demonstrates immunostaining for Rev-erbα (Fig. 4A,B) and LXR-β (Fig. 4C,D) in a representative BRAF mutation–positive PTC. While LXR-β mRNA expression was abundant across all types of thyroid tissue, significant differences in expression were observed for Rev-erbα between PTC and MNG and between BRAF V600E PTC and wild type BRAF PTC. Therefore, the intensity of staining for Rev-erbα protein in a range of thyroid tissues was scored, and the results are shown in Table 2. Overall, the intensity of staining was stronger in malignant tumors than in the benign group. Moderate to strong intensity (2+/3+) staining was seen in all but one PTC. Strong intensity staining was seen in 8 out of 14 BRAF V600E PTC (57%) and four out of nine wild type BRAF PTC (44%). Staining at 3+ was also seen in three out of five HCC. The relationship between mRNA levels and protein expression was examined, and a positive correlation was seen (data not shown).
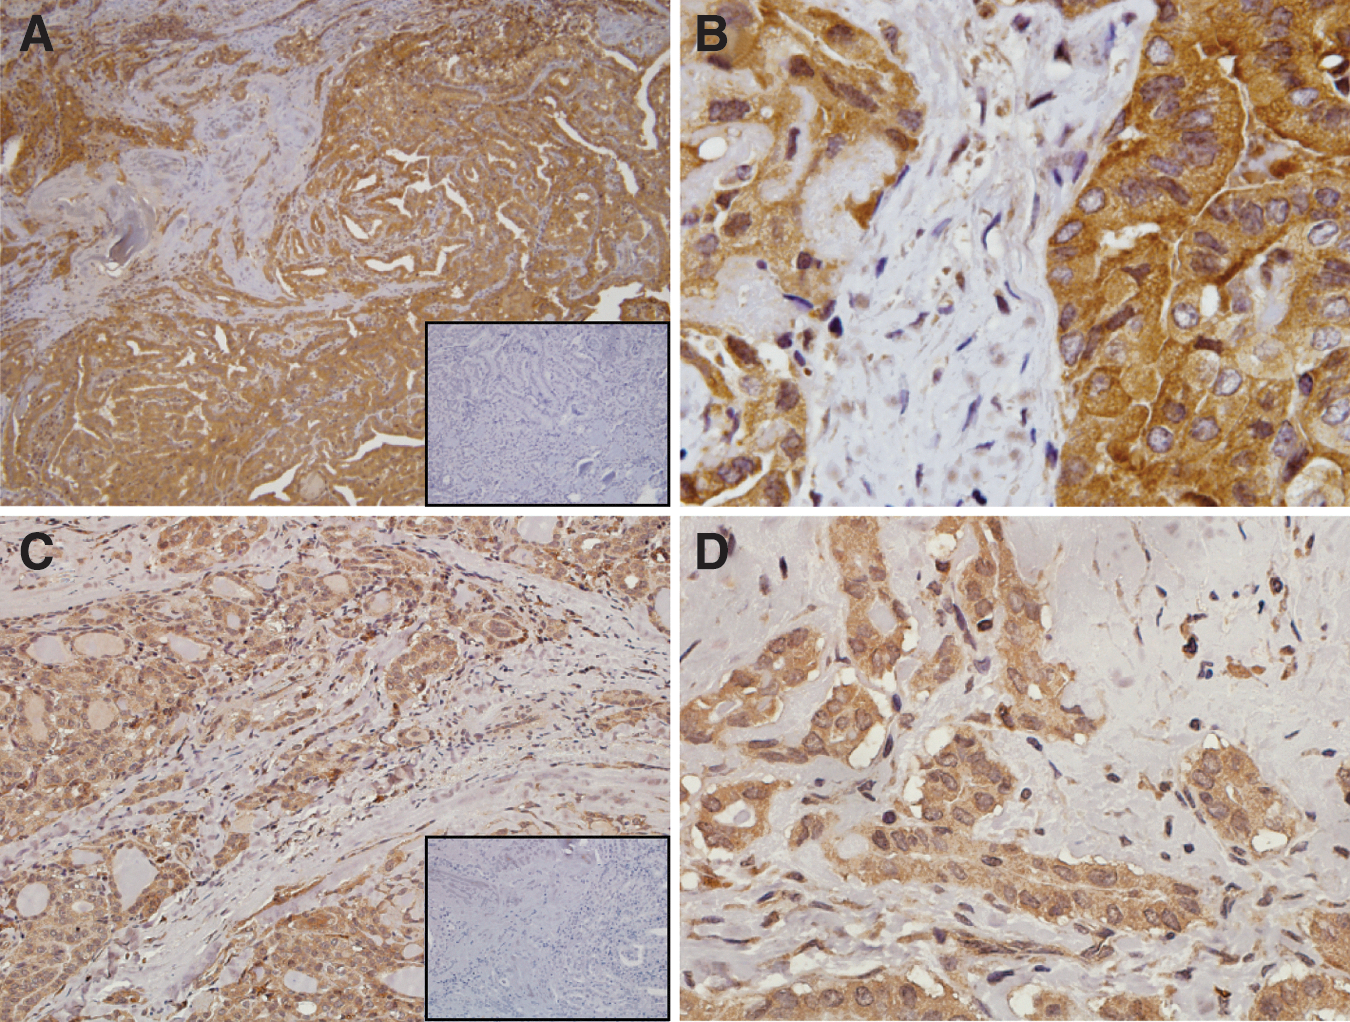
Representative section of BRAF mutation–positive papillary carcinoma.
Staining intensity in the epithelial cells was scored as 0 (no staining), 1+ (faint), 2+ (moderate), or 3+ (strong).
IHC, immunohistochemistry.
An unsupervised hierarchical cluster analysis was performed, and the results are presented as a heat map (Supplementary Fig. S1). Within the PTC group, clustering was observed for subsets of tumors, including five out of seven BRAF mutation–positive PTC (seen at far left of heat map). HCC also demonstrate some clustering while MNG and FC are distributed amongst the other groups without evidence of clustering.
Individual boxplot analyses of the 48 NRs showing comparative expression levels in PTC, FC, HCC, and MNG are presented in Supplementary Figure S2. NRs of particular interest in this comparative analysis include RXR-γ, which shows the highest expression levels in PTC, lesser but still relatively abundant levels in FC, low levels of expression in MNG, and virtually no detectable levels in HCC. RAR-β shows the highest expression levels in MNG, with reduced levels in the malignant groups (decreasing expression is seen in the order FC, PTC, HCC). PPAR-δ was comparatively abundant in MNG and PTC, whereas lower levels were seen in FC with expression further reduced in HCC.
NR expression levels in PTC, FC, HCC, and MNG were compared to a tumor reference panel (Supplementary Fig. S3). Consistent across the thyroid tumor subtypes is significantly increased expression of the mineralocorticoid receptor (MR) and ROR-γ and reduced expression of ROR-β relative to the tumor reference panel. Increased relative expression of RXR-γ is seen in PTC, and analysis by BRAF status again reveals that this increase is predominantly in the BRAF mutation–positive group. Rev-erbα expression is significantly increased only in the BRAF V600E group.
Discussion
In this study, we have systematically determined the expression levels of the 48 NRs in cohorts of PTC, FC, HCC, and MNG. Although there are a limited number of samples in each group, the standard errors for the majority of NR expression results are small, reflecting the relative homogeneity of the cohorts.
Given the potential limitations of using MNG as the benign comparator, the NR profile of this subgroup was compared to the NURSA mouse thyroid data set. Concordance was seen for the majority of abundantly expressed NRs. LXR-β was among the most highly expressed NRs in mouse thyroid and MNG, as well as the three tumor subtypes. IHC localized protein expression to the epithelial cells. In light of these findings, a possible role for LXR-β in thyroid hormone biosynthesis warrants exploration. ROR-γ was abundant in mouse thyroid and MNG, and relatively abundant in PTC and FC, but with lower levels in HCC. The significance of ROR-γ expression in thyroid tissue is uncertain, given its close link to inflammation (29). Discordant expression was seen for three NRs, which likely reflects species differences. However, it is plausible that some disparities are due to differences between normal thyroid and multinodular tissue. Nur77 was highly expressed in MNG, but levels were low in mouse thyroid, which may reflect its known role in regulating cellular proliferation. RXR-α and VDR were abundantly expressed in mouse thyroid but not in MNG. These NRs are also linked to cellular proliferation and/or differentiation, which might possibly account for the differences.
Significant differences in NR expression were seen between all types of thyroid malignancy and benign thyroid tissue. Of particular interest, significant differences were noted between BRAF mutation–positive and wild type BRAF PTC in terms of both upregulation and downregulation of several NRs.
BRAF mutation positivity has been linked to a number of molecular events in PTC, including upregulation of tumor-promoting factors such as VEGF and NF-ĸB, silencing of tumor suppressor genes, and suppression of iodine metabolism (24). Gene expression studies in PTC and FC have noted variability in gene expression according to underlying mutation status (30 –32). In particular, Rusinek et al. (31) reported profound differences in gene expression signatures between BRAF mutation–positive and BRAF mutation–negative PTC. A direct comparison of our results with data from gene array studies is hampered by a number of factors, including the sensitivity of microarrays to detect low abundance genes and issues related to oligonucleotide probe specificity (33,34). However, when added to the previous observations, our findings further support the notion of significant pathobiological differences between PTC that carry and those that lack the BRAF V600E mutation.
PTC
Key findings in PTC were significant upregulation of RXR-γ and Rev-erbα, and downregulation of ERR-γ compared to benign controls. When analyzed by BRAF mutation status, significant differences in expression of these NRs were noted between BRAF mutation–positive and wild type BRAF PTC.
RARs and RXRs
Retinoids are vitamin A derivatives. They play important roles in cell growth and differentiation through RARs and RXRs. Each has three major subtypes (-α, -β, -γ). RXRs appear to function primarily as heterodimer partners with other NRs, including PPAR, TR, and RAR.
Several studies have examined expression levels of RXR and RAR isoforms in thyroid tumors by RT-PCR or IHC. Most but not all studies have reported increased levels of RXR-γ and reduced levels of RAR-β in PTC (17,35 –38). In a microarray study examining genes differentially expressed between PTC and normal tissue, RXR-γ was among the most highly upregulated genes in PTC (39), consistent with our finding of markedly increased expression of RXR-γ in PTC (more than 10-fold) compared to benign controls. We have further shown that expression levels in BRAF mutation–positive PTC are significantly higher than in wild type BRAF PTC. A nonsignificant trend toward reduced RAR-β expression was observed in the PTC group. This reduction in expression was significant, however, when only BRAF mutation–positive PTC were compared to MNG.
RAR-β appears to play an important role in mediating the growth inhibitory effects of retinoids in various cancer cells (40,41). It has been suggested that aberrant expression or loss of RAR-β can contribute to retinoid resistance, implying that it might act as a tumor suppressor (42). A possible mechanistic association between BRAF mutation positivity and reduced RAR-β2 expression has been suggested via methylation-induced gene silencing (43).
The selective upregulation of RXR-γ in PTC is intriguing, although its significance is difficult to determine, since RXRs are promiscuous heterodimer partners, as well as having the ability to form homodimers. A study of RXR-γ knockout mice suggested a role for RXR-γ in regulating thyroid hormone levels and metabolic rate possibly through the hypothalamic–pituitary–thyroid axis (44).
The differential expression profile of retinoid receptors in BRAF mutation–positive compared to wild type BRAF PTC is a significant finding. It may have therapeutic implications, as preclinical studies have highlighted the importance of different receptor isoforms in the cellular response to retinoids (12,17). Whether the observed alteration in expression is mediated by downstream effectors of the MAPK pathway or via cross-talk with other signaling pathways remains to be elucidated.
Rev-erbα
Rev-erbα and β are widely expressed orphan NR. They are part of the network of “clock genes” and are involved in the integration of circadian rhythms and metabolic functions, including lipid and glucose homeostasis (45,46). Rev-erbα is a target gene of PPAR-γ and is involved in adipocyte differentiation via PPAR-γ (47). Rev-erbα has also been shown to play a role in inflammation in vascular smooth muscle cells with overexpression resulting in upregulation of NF-ĸB responsive genes such as IL-6 and COX-2 (48). A recent study identified Rev-erbα and PPAR-γ binding protein (PBP) as important transcriptional regulators in a subset of aggressive (ERBB2-positive) breast tumors (49). Rev-erbα and PBP were shown to upregulate several genes in the de novo fatty acid synthesis network, contributing to abnormal cellular energy metabolism. Inhibition of Rev-erbα and PBP resulted in apoptosis of the breast cancer cells.
In our study, Rev-erbα expression was significantly higher in PTC compared with MNG. Expression levels in FC were low and comparable to MNG, whereas HCC showed slightly higher expression. Particularly noteworthy was significant overexpression of Rev-erbα in BRAF mutation–positive versus wild type BRAF PTC. IHC for Rev-erbα protein demonstrated moderate to strong intensity staining in all but one PTC. A higher percentage of tumors in the BRAF mutation–positive group showed strong staining, and a correlation between mRNA levels and protein expression was observed. However, the difference between the groups was less marked than for gene expression, and interpretation is limited by the semi-quantitative nature of IHC scoring.
Protein expression for both Rev-erbα and LXR-β localized to the epithelial cells across all the thyroid tissues studied with little staining in the intervening stroma. Both nuclear and cytoplasmic staining was observed for both NRs, although cytoplasmic staining was predominant in some of the benign tissues and in the majority of malignant tumors. Subcellular localization of NRs is challenging on a number of accounts. Nucleocytoplasmic shuttling of NRs may be altered by a variety of stimuli in the cellular milieu (50). In addition, it is increasingly recognized that NRs can have multiple isoforms that are structurally very similar. While the NR isoforms may share identical antibody epitopes, these protein variants may have alternate subcellular localization and/or functional properties (51). A tendency toward increased cytoplasmic and reduced nuclear staining in PTC compared with MNG has been previously reported for ER-β (7). Predominant cytoplasmic staining for a number of NRs has also been reported in other malignancies (52 –54), and in some cases, a correlation with prognosis was found, suggesting that tumor-related factors might alter the subcellular localization of the proteins.
Increased expression of Rev-erbα in BRAF V600E PTC may be a consequence of constitutive MAPK pathway activation, as regulation of Rev-erbα by this pathway has been previously demonstrated in pancreatic beta cells (55). Cross-talk between Rev-erbα and the NF-ĸB pathway is also potentially important, as NF-ĸB signaling has been increasingly implicated in the development and progression of malignancy, including thyroid cancer (56).
The fact that markedly increased Rev-erbα expression was seen in a subset of BRAF mutation–positive PTC but not in wild type BRAF PTC suggests that BRAF mutation with consequent MAPK activation may be necessary but not in itself sufficient to drive the overexpression of this NR. Further studies are required to identify other factors that might impact on Rev-erbα expression in thyroid tumors as well as downstream consequences of its overexpression.
FC
The NR profile of FC bears similarities to that of PTC, particularly in relation to the pattern of retinoid receptor expression and the relative downregulation of a number of receptors (such as ERR-γ and GR) compared to MNG. These similarities may reflect the activation of common signaling pathways such as MAPK and possibly shared metabolic changes at the cellular level. Unique to FC, however, was relative downregulation of PPAR-α and PPAR-δ and upregulation of EAR-2 compared to MNG.
PPAR
PPARs are divided into three main subtypes (PPAR-α, -β, and -γ), which are encoded by separate genes with different patterns of expression. They bind ligands such as fatty acids and also act in concert with other NRs and coactivators to regulate gene transcription. PPARs have been implicated in multiple physiological processes, including cellular differentiation and metabolism as well as in tumorogenesis (57).
Zeng et al. (58) reported high expression levels of PPAR-δ by immunohistochemistry in both benign and malignant thyroid tumors, and found a correlation between PPAR-δ expression and the marker of proliferation, Ki-67. Functional studies in primary thyroid cell cultures (58) and in some cancer models (59,60) have suggested a pro-proliferative role for PPAR-δ, whereas other studies have demonstrated antiproliferative effects (61,62). This raises the possibility that the response to PPAR-δ may vary by cell type or depend on other ligands and growth factors in the cellular milieu.
In our NR profiling, PPAR-δ was the predominant PPAR isoform in all tissue types. It was abundantly expressed in MNG and PTC with lower levels in FC and HCC. In contrast to Zeng et al., we did not find significantly increased PPAR-δ expression in malignant tissue versus benign. In fact, along with PPAR-α, PPAR-δ expression levels were significantly lower in FC compared with MNG. This discrepancy may relate to differences in methodology used and/or the number and type of samples studied.
Modulation of PPAR has been investigated in thyroid cancer, primarily in trials of PPAR-γ agonists as therapy for radioiodine resistant tumors. The downregulation of specific PPAR isoforms in FC may have implications for therapy, and a better understanding of the isoform specific roles of the PPARs is needed.
EAR-2
EAR-2 is an orphan nuclear receptor. It is a member of the chicken ovalbumin upstream promoter-transcription factor subfamily. The functions of EAR-2 are not well understood, although it has been shown to coregulate thyroid hormone receptor function negatively (63). Recent publications have identified overexpression of EAR-2 in breast (27) and colon cancer (64). Functional studies in models of colon cancer (64) and leukemia (65) have suggested a role for EAR-2 in enhancing cell survivability and promoting cellular proliferation.
EAR-2 expression was significantly higher in FC compared to MNG. The finding of elevated EAR-2 levels in FC but not PTC underscores the distinct molecular pathogenesis of these two epithelial cancers. It all suggests that, at least in FC, EAR-2 may be a therapeutic target.
HCC
The key finding in HCC was significant downregulation of a wide range of NRs compared to MNG (with levels up to 10-fold lower for some NR). HCC are often considered a subtype of FC and, indeed, a number of the NRs downregulated in HCC were similarly downregulated in FC, including: ERR-γ, GR, PPAR-α, PPAR-δ, and TR-α. However, an additional 14 NRs were uniquely downregulated in HCC, including members of the retinoid family, testicular receptors, NGF1B, COUP-TF2, and LRH-1.
HCC are characterized by mitochondrial alterations, including mitochondrial gene deletions and mutations, which lead to energy production defects in Hürthle cell tumors (66). Mitochondrial proliferation associated with the expression of factors involved in mitochondrial biogenesis may be a compensatory mechanism for such defects. In a recent study examining mutation status, chromosomal copy number, and gene expression (67), HCC were found to have a unique profile that differed significantly from PTC and FTC. A retrospective clinical study involving a large cohort of patients found that HCC was associated with lower overall and disease-specific survival than other forms of differentiated thyroid cancer (68). Taken together, this all supports the notion that HCC are governed by unique tumor biology, and further investigation into the mechanisms for this, including the role of NRs, are needed.
Conclusion
Our study of NR expression in thyroid tumors corroborates and extends previous findings on individual NRs in thyroid cancer. We have shown that the pattern of NR expression varies both by tumor type and, in PTC, by BRAF mutation status. Two of the NRs differentially expressed in BRAF mutation–positive tumors—Rev-erbα and ERR-γ—are increasingly recognized as modulators of metabolism. Recent evidence suggests that a shift to glycolytic metabolism may occur in BRAF mutation–positive thyroid tumors (69,70). The role of the NRs in mediating these and other metabolic changes warrants further investigation.
Our findings also highlight the issue of isoform specificity, particularly in relation to the retinoid receptor family in PTC and PPAR receptor family in FC. Although in vitro studies have suggested a potential therapeutic effect of retinoids and PPAR agonists in thyroid cancer, clinical trials have not, on the whole, demonstrated clinically significant benefit. Important factors influencing the response to these agents may include the differential expression of receptor isoforms as well as ligand specificity. As isoform-specific NR agonists and antagonists are increasingly available, studies involving modulation with these agents may be informative.
The results of our analysis represent the first systematic examination of NR expression in thyroid tumors. They provide a template for further mechanistic studies, as well as highlighting potential therapeutic targets, including novel targets for these malignancies.
Footnotes
Acknowledgments
This work was supported by the Victorian Cancer Agency through a project grant to C.G. and by the National Health and Medical Research Council through a Fellowship to P.J.F. G.E.O.M. is supported by the University of Queensland through a Vice Chancellor's Senior Research Fellowship. M.M. is supported by Monash University though a Monash University Postgraduate Scholarship. Prince Henry's Institute is supported by the Victorian Government's Operational Infrastructure Program. The authors also acknowledge the Victorian Cancer Biobank for assistance with tissue collection. The authors thank Zdenka Prodanovic for assistance with preparation of the tissue microarrays, Zdenka Prodanovic and Dr. Ann Drummond for assistance with immunohistochemistry, and Sue Panckridge for help with the preparation of the manuscript. The authors also thank the Nuclear Receptors in Breast Cancer Research Consortium for their help and support with these studies.
Author Disclosure Statement
No competing financial interests exist.