
Abstract
Background:
The incidence of papillary thyroid carcinoma (PTC) has increased over the past 30 years in Western countries. PTC is usually associated with a good prognosis, but there is a wide range of aggressiveness, and some patients develop distant metastasis and/or resistance to standard treatment. Early identification of these high-risk tumors is a current challenge for appropriate patient management. MUC1 expression has been studied previously in thyroid cancer, but its prognostic value remains controversial. Here, we correlated MUC1 expression in PTC with clinical and pathological features and with the presence of the BRAF V600E mutation.
Methods:
We performed a clinical and morphological analysis of 190 thyroid tumors (95 PTCs and 95 adenomas). MUC1 immunohistochemistry was carried out on a tissue microarray using different antibodies. The presence of the BRAF V600E mutation was investigated by pyrosequencing. MUC1 mRNA levels were assessed by quantitative reverse transcription polymerase chain reaction on a subset of PTC.
Results:
MUC1 expression was observed in 49% of PTCs and was found to correlate with the presence of papillary architecture, a stromal lymphoid infiltrate, aggressive histological subtypes, extrathyroidal extension, lymph node metastasis, nuclear pseudoinclusions, lymphovascular invasion, and the presence of the BRAF V600E mutation (p<0.0001). MUC1 was abundant in nuclear pseudoinclusions. Multivariate analysis showed a strong association of MUC1 expression with the presence of the BRAF V600E mutation and lymph node metastasis (p<0.0001). Lymph node metastasis was the most important risk factor of relapse.
Conclusions:
Our study shows an association between MUC1 expression and the presence of the BRAF V600E mutation in PTC. Analysis of MUC1 expression could improve the risk stratification of PTCs.
Introduction
P
Some features at the time of diagnosis have been linked to worse prognosis: age >45 years, male sex, distant metastasis, extrathyroidal extension, incomplete surgical resection, tumor size, aggressive histological subtypes (columnar cell variant (CCV), diffuse sclerosing variant (DSV), tall cell variant (TCV)), insular carcinoma, vascular invasion, and cervical lymph node metastasis (4 –11).
Recently, molecular studies have provided new information about PTC pathogenesis. Especially, MAPK pathway activation is common and results from activating mutations in the BRAF oncogene with a prevalence of about 45% in PTCs in most studies (12). The predominant BRAF mutation detected in thyroid cancer is a thymine-to-adenine transversion (c.1799T>A) resulting in substitution of valine 600 by glutamic acid (p.V600E) (13). In thyroid malignancies, this mutation is specific to PTC and to some apparently PTC-derived anaplastic or poorly differentiated thyroid cancers (14). BRAF mutations have been associated with aggressive and invasive PTCs (15 –17). Some studies, however, showed inconsistent results (18,19). MAPK activation also results from RAS (N-RAS, H-RAS, K-RAS) mutations in 20–50% of PTCs (20).
MUC1 is a membrane-bound mucin characterized by a central polymorphic tandem repeat region. MUC1 is also known as epithelial membrane antigen (EMA) (21). It provides a protein backbone for numerous O-linked glycans (22). It is involved in cell signaling and in the differentiation and proliferation of epithelial cells, and plays a key role in epithelial tumor progression and metastasis (23,24). Aberrant de novo expression or increased MUC1 expression has been associated with a poor prognosis in non–small cell lung cancer, gastro-intestinal adenocarcinoma, ovarian, endometrial, and pancreatic human carcinomas (25). In the thyroid, MUC1 is expressed at the apical pole of normal follicular cells, but it is detected in the cytoplasm of papillary carcinoma cells, with a diffuse and/or apical expression observed in only a few patients (26). Furthermore, MUC1 has been demonstrated to be an independent marker of PTCs with aggressive behavior, and its overexpression has been linked to gene amplification (11). Yet the relevance of MUC1 as a marker of worse prognosis remains controversial, as studies on larger series have failed to confirm these data (6,27). Moreover, the relationship between BRAF mutation and MUC1 upregulation has never been investigated.
The objectives of our study were thus: (a) to evaluate the performance of the MUC1 expression pattern in distinguishing PTC from follicular adenoma (FA); and (b) to analyze the relationship between MUC1 expression and clinicopathologic and molecular features of PTCs, in order to identify factors associated with MUC1 overexpression in PTC.
Materials and Methods
Patients and thyroid tumors
The study was retrospectively performed on tissue samples obtained from 190 patients surgically treated for a thyroid tumor at Lille University Hospital between 2000 and 2004. This series included 95 PTCs and 95 FAs, diagnosed in our pathology department. All included cases were PTCs (size≥1 cm) diagnosed consecutively from August 2000 to September 2001 and from January 2004 to September 2004, as previously described (28). Selected PTCs were matched for age, sex, and presence or not of thyroiditis with 95 FAs. The available population data were age, sex, clinical course, and histopathologic features. This series included 142 women (75%) and 48 men (25%). The mean age of patients with FA was 43 years (range 12–71 years). The details of the clinicopathologic features of the PTC cases in this study are presented in Table 1. The malignant thyroid tumors were classified with reference to the criteria defined by the World Health Organization classification of malignant tumors (1). In further statistical analyses, DSV, TCV, and CCV were considered aggressive morphological subtypes (1). Of the 95 PTCs, 54 were classified as classic variant (cPTCs), 29 as follicular variant of PTC (FVPTC), and 12 as aggressive subtypes. Most of the cPTCs were infiltrative (n=38). The others were encapsulated cPTCs (n=16), with or without capsule invasion in nine and seven cases respectively. FVPTCs were divided as follows: encapsulated with capsule invasion (n=10), encapsulated without capsule invasion (n=18), and infiltrative (n=1). PTC tumor size was ≥1 cm and distributed as follows: 38 tumors measured <2 cm, 43 measured between 2 and 4 cm, and 14 were ≥4 cm. The thyroid cancers were staged according to the American Joint Committee on Cancer/International Union Against Cancer tumor-node-metastasis staging system for thyroid tumors (29). Accordingly, tumors with minimal extrathyroid extension into the sternothyroid muscle or perithyroidal soft tissues are designated as T3 tumors. “Stromal lymphoid infiltrate” refers to the presence of a widespread heavy lymphocytic infiltrate within the stroma and within the fibroblastic core of papillae as described in previous reports (30,31). Among PTC displaying a stromal lymphoid infiltrate, one tumor was characterized by lymph follicle formation with a germinal center and cytoplasmic eosinophilic changes in tumor cells and diagnosed as a Warthin-like PTC. This case was further considered as a classic PTC because it shares a similar prognosis (32,33). The surveillance for possible recurrence was realized according to the revised American Thyroid Association (ATA) management guidelines for patients with differentiated cancers, 6–12 months after remnant ablation (5). Follow-up of the patient ranges from 50 to 144 months (mean 122 months). Remission was defined according to the ATA guidelines by no clinical and no imaging evidence of tumor, and undetectable serum thyroglobulin levels during TSH suppression and stimulation in the absence of interfering antibodies (5). The presence of one or more of these criteria defined disease recurrence. Patients were informed of the study, in accordance with the regulations of the hospital's Human Ethics Committee.
Mean; median (range).
LN, lymph node.
Histopathologic examination and immunohistochemistry
Specimens were fixed in 10% buffered formalin and paraffin embedded. Five-micrometer sections were stained with hematoxylin and eosin (HE) for examination by light microscopy to assess the percentage of tumor cells. The entire paraffin-embedded blocks were selected and arrayed in triplicate 0.6 mm tissue cores for tissue microarray (TMA) construction (Beecher Instruments®, Silver Springs, MD). Sections were deparaffinized and heat pretreated before incubation with mouse monoclonal antibodies directed against MUC1 and β-catenin. The primary antibodies used in this study and technical information are detailed in Table 2. The specificity of the M8 antibody (provider: M8-LICR-LON-M8) was previously published (34 –36). This antibody is specific for the tandem repeat and glycopeptides of MUC1. Immunohistochemical analysis was performed with a Benchmark XT Ventana instrument and the XT ultraView DAB kit (Ventana Medical Systems, Inc., Tucson, AZ) as previously described (37). Negative controls were performed by omitting the primary antibody and using an irrelevant antibody. The positive controls were carried out by inclusion of normal epithelial tissues known to express MUC1 and β-catenin as kidney and liver on the TMA blocks. A blind semi-quantitative analysis of immunostainings was independently performed by two pathologists (F.R. and E.L.). A consensus was reached by new examination with a multiple-head microscope to resolve discrepancies. The subcellular localization (membranous (apical or circumferential) vs. cytoplasmic) of the staining and the percentage of stained cells were taken into account.
Immunoreactivity was categorized as follows: 0, no reactivity; 1, <20% of cancer cells positive; 2, 20–50% positive; 3, 51–80% positive; 4, 81–100% positive cancer cells. For comparative analysis, specimens showing positive immunostaining in >20% of tumor cells were considered positive in accordance with previous studies (38,39). Moreover, to assess the best cutoff for the diagnosis of malignancy, a receiver operating characteristic (ROC) curve was constructed and analyzed (data not shown). Optimal sensitivity to specificity ratios were observed using the cutoff value of >20% positive cells for malignancy. The intensity of the immunoreactivity was also recorded and estimated as low, moderate, or high. The overall score used for subsequent statistical analysis was the pooled mean for the three spots of the same tumor.
Genomic DNA extraction
Genomic DNA was isolated from 10 μm paraffin-embedded sections, after macrodissection if necessary. When the percentage of tumor cell represented >30% of the cells on the slide, blocks were used intact. When this percentage represented <30% of the cells on the slide, the tumor area was marked on the slide and on the paraffin block. For these paraffin blocks, the selected area was macrodissected away from the adjacent nontumor thyroid tissues, which were discarded to prevent a dilution effect. DNA was extracted according to the manufacturer's protocol for the Qiagen FFPE Tissue DNA extraction kit (Qiagen, Courtaboeuf, France). The DNA content was quantified by measuring the spectrophotometric absorbance (Nanodrop Spectrophotometer, Courtaboeuf, France).
Polymerase chain reaction amplification and pyrosequencing analysis
The DNA obtained was used to detect mutations in BRAF codon 600, KRAS codons 12 and 13, NRAS and HRAS codon 61. Analyses were performed by pyrosequencing. Genomic DNA (50–100 ng) was amplified by polymerase chain reaction (PCR) and sequenced with the PyroMark™ MD instrument (Qiagen) kit according to the manufacturer's instructions. In each series, DNA extracted from normal thyroid tissue and from cell lines previously found to be BRAF and RAS wild type provided negative controls, and DNA extracted from colonic tumors and cell lines previously found to harbor BRAF and RAS mutations provided positive controls.
PCR amplifications were performed in a 50 μL reaction mixture containing 10 mM Tris-HCl pH 8.3, 50 mM KCl, 1.5 mM MgCl2, 0.2 mM dNTP, 5 pmol each of forward primer and 5′-biotinylated reverse primer, 1.5 U AmpliTaq Gold DNA polymerase (Applied Biosystems, Courtaboeuf, France), and 50 ng DNA. The PCR conditions were: initial denaturation at 95°C for 15 min, followed by 45 cycles of 94°C for 60 s, 62°C for 90 s, and 72°C for 90 s, followed by a final extension at 72°C for 10 min. All nucleotide variations were confirmed with a second, independent PCR product.
Pyrosequencing was performed according to the manufacturer's instructions, using the PyroGold kit in conjunction with the PyroMark™ MD instrument. Biotinylated single-stranded DNA was separated by immobilization of the PCR product (5 μL) on streptavidin-coated Sepharose high performance beads (Amersham Biosciences/GE Healthcare Europe GmbH, Saclay, France) followed by denaturation with 0.2 N NaOH. The biotinylated strand was then incubated with 0.5 μM of a nested sequencing primer and subjected to pyrosequencing. PCR and sequencing primers were designed with the PSQ Assay Design Software v1.0.6 (Qiagen). Pyrosequencing primers for PCR amplification and for nucleotide sequencing are detailed in Supplementary Table S1 (Supplementary Data are available online at
Allele-specific single-base primer extension analysis (SNaPshot®)
After purification of the PCR products on BioGel P10 (Bio-Rad, Life Science, Marnes la Coquette, France), genotyping was performed with the ABI PRISM SNaPshot® Multiplex Kit (Applied Biosystems). A SNaPshot® assay was created to analyze the BRAF V600E mutation in exon 15. We designed two primers: 5′-TGG TTA GAT GGG TGA TTT TGG TCT AGC TAC AG-3′ (forward) and 5′-TGG TTA GAT GGG ACC CAC TCC ATC GAG ATT TC-3′ (reverse). The SNaPshot® reaction was performed in a final volume of 50 μL, containing one-fifth of the PCR reaction, 2.5 μL SNaPshot® Ready Reaction mix, 1 μL sequencing buffer from the Big Dye V3.1 Terminator Kit, and SNaPshot® primers at 0.02–0.05 μM concentration. Cycling conditions were: 25 cycles of rapid thermal ramp to 96°C, 96°C for 10 s; rapid thermal ramp to 50°C, 50°C for 5 s; and rapid thermal ramp to 60°C and 60°C for 30 s. SNaPshot products were then treated for 1 h at 37°C with 3 U shrimp alkaline phosphatase (Amersham Biosciences). ABI Prism 3130 DNA sequencer and the data were analyzed with the GeneMapper Analysis Software v4.0 (Applied Biosystems).
MUC1 mRNA quantification by q-PCR
Additional cases of PTC (n=13) were selected from the tumor bank according to the BRAF status: BRAF wild type PTCs (n=5) and BRAF mutated PTCs (n=8). Total RNA was extracted from frozen sections using the NucleoSpin® RNA II kit (Macherey-Nagel, Hoerdt, France). MUC1 mRNA levels were determined by quantitative real-time PCR. MUC1 copy number analysis was performed with MUC1 specific primers as previously described (43).
Statistical methods
First, descriptive analyses were performed in order to check the data. Data are shown as frequencies, means (standard deviation), or medians (range). Continuous data were compared using the Student's t-test for variables with a normal distribution and otherwise with the Mann–Whitney U-test. Ordinal data were compared using the chi-square test or Fisher's exact test as appropriate. Parameters strongly associated with MUC1 expression in the univariate analysis were entered into a stepwise logistic regression analysis. Disease-free survival curves were computed by the Kaplan–Meier estimates and compared by the log-rank test. A Cox model was used to identify parameters strongly associated with relapse further. A p-value of <0.05 was considered as significant. Statistical analyses were performed with SAS v9.3 software (Cary, NC) and SPSS version 15.0 software (SPSS Inc., Chicago, IL).
Results
Expression of MUC1 in PTC and FA
MUC1 (clone M8) protein expression was observed in 46 out of 94 PTCs (49%). One case of carcinoma (FVPTC) for which tissue cores were lacking on the TMA was not analyzed. MUC1 staining in PTCs was either cytoplasmic or both cytoplasmic and apical, with enhancement at the apical membrane. The staining intensity was moderate to high (Fig. 1A). MUC1 staining was absent in the great majority of adenomas (85/95, 89.5%; Fig. 1B).
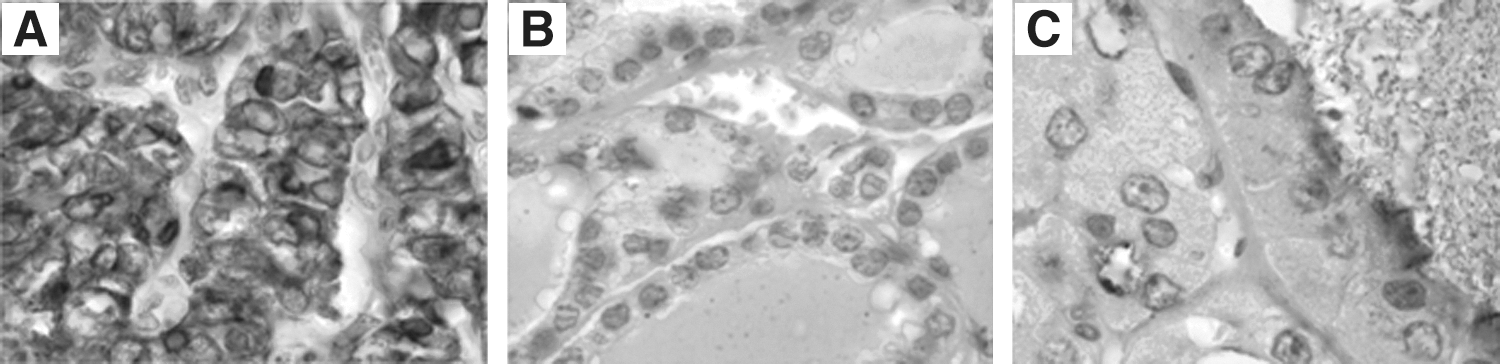
In the 10 MUC1-positive FAs, staining was always cytoplasmic, with, in six cases (60%), enhancement in a thin band at the apical membrane (Fig. 1C). The intensity was low to high. Univariate analysis revealed MUC1 expression to have a sensitivity of 50% and a specificity of 89.5% for the diagnosis of malignancy.
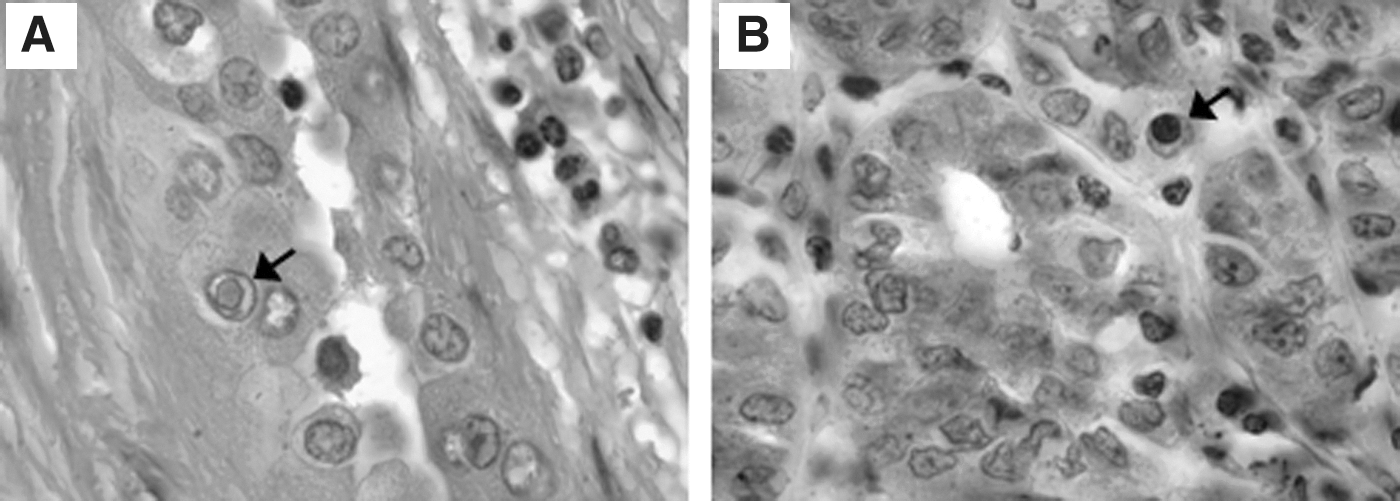
In the majority of PTCs showing cytoplasmic MUC1 staining, we observed high MUC1 expression inside nuclear pseudoinclusions. The intense staining of these pseudoinclusions made it easy to detect them (Fig. 2), as the dark-brown pseudoinclusions contrasted with the blue nuclei surrounded by light-brown cytoplasm. Forty-four out of 46 MUC1-positive tumors (96%) displayed MUC1-positive pseudoinclusions, whereas standard coloration revealed pseudoinclusions in only 34 (77%) of these tumors. All pseudoinclusions detectable by HE were positive for MUC1.
The results of MUC1 expression were quite similar between the different antibodies used in this study. The results showed 33 out of 75 (44%) and 45 out of 89 (51%) MUC1-positive PTCs, and 6 out of 79 (8%) and 11 out of 90 (12%) MUC1-positive FAs, with the VU4H5 and EMA antibodies respectively. The sensitivity and specificity for malignancy were 44% and 92% with VU4H5. The sensitivity and specificity for malignancy were 51% and 88% with EMA. β-catenin was expressed in the vast majority of PTC (81/95) and in all but one FA (94/95). Only two PTCs presented an expression of β-catenin in pseudoinclusions.
Associations between MUC1 expression and clinicopathologic and molecular data in PTCs, as determined by univariate analysis
MUC1 expression in relation to histopathological subtype, papillary architecture, lymphovascular invasion, and pseudoinclusions
As shown in Table 3, MUC1 expression was observed in 11 out of 12 cases (92%) of aggressive subtypes (TCV, DSV, or CCV) as compared to 33 out of 54 cases (61%) of cPTC and 2 out of 28 FVPTC (p<0.0001). In cPTC, MUC1 expression was predominantly observed in infiltrative cPTC (27/38, 71%). MUC1 was detected in four out of nine (44%) encapsulated cPTC with capsule invasion and two out of seven (29%) cPTC encapsulated without capsule invasion. MUC1 expression was significantly associated with infiltrative cPTCs (p=0.02). MUC1 was less frequently detected in PTCs without papillae (FVPTCs) than in PTCs with papillary architecture (classical variant and aggressive subtypes combined; p<0.0001). Only 2 out of 28 FVPTCs (7%) showed MUC1 expression. These cases were encapsulated FVPTCs with capsule invasion. MUC1 was expressed in 16 out of 17 (94%) of the PTCs with lymphovascular invasion and significantly less frequently in PTCs without lymphovascular invasion (30/77, 39%; p<0.0001). MUC1 was detected in 75% (36/48) of the PTCs with pseudoinclusions revealed by HE coloration and in a lower proportion (10/46, 22%) of the cases where HE revealed no pseudoinclusions (p<0.0001).
MUC1 expression in relation to stromal lymphoid infiltrate
MUC1 expression was significantly associated with the presence of stromal lymphoid infiltrate (p<0.0001). All carcinomas displaying a stromal lymphoid infiltrate were found to express MUC1 (13/13), and the proportion of MUC1-positive cells was >80% in 12 out of 13 cases (92%). MUC1 expression was more variable in cases without stromal lymphoid infiltrate, being observed in 33 out of 81 (41%) such cases.
Correlation between MUC1 expression and extrathyroidal extension
Nineteen out of 94 PTCs (20%) displayed extrathyroidal extension. MUC1 expression was significantly associated with the presence of this feature (p<0.0001): 17 out of 19 tumors (89%) showing extrathyroidal extension were MUC1-positive.
MUC1 expression in relation to lymph node metastasis
MUC1 expression was significantly associated with the presence of lymph node metastasis (p<0.0001). Among 30 patients having lymph node metastasis at the time of surgery, 27 (90%) had MUC1-expressing tumors.
MUC1 expression in relation to BRAF and RAS mutation status
Thirty-eight out of 94 PTCs (40%) were positive for the BRAF V600E mutation. MUC1 expression was significantly associated with the presence of a BRAF mutation (p<0.0001), being expressed in 36 out of 38 BRAF-mutated PTCs (95%) and in only 10 out of 56 BRAF-wild type PTCs (18%).
In five PTCs, between 5% and 10% mutant alleles were detected by pyrosequencing. SNaPshot® confirmed the presence of the mutation in all five cases. A second pyrosequencing run on samples enriched in tumor cells also confirmed the presence of a BRAF mutation in all five cases (Supplementary Fig. S1). BRAF mutation analysis was also performed on the 95 follicular adenomas. All found to have the wild type BRAF nucleotide sequence for codon V600. N-, H-, and K-RAS mutations were detected in 27/94 (29%) of PTCs. MUC1 was expressed in 5/27 (19%) of RAS-mutated PTCs. Among the 10 cases of MUC1 positive BRAF wild type PTC, five were RAS mutated (N- and H-RAS). Altogether, 41 of 46 (89%) MUC1 positive PTCs had a mutation on the RAS pathway.
MUC1 upregulation in BRAF-mutated PTCs confirmed by qPCR
Analysis of mRNA expression with qPCR confirmed the presence of MUC1 upregulation in BRAF-mutated PTCs by analysis of RNA from 13 PTC frozen sections. Univariate analysis showed a significant association between MUC1 upregulation and BRAF mutation (p=0.0043).
Clinical evolution of PTC in terms of recurrence, disease-related death, and disease-free survival
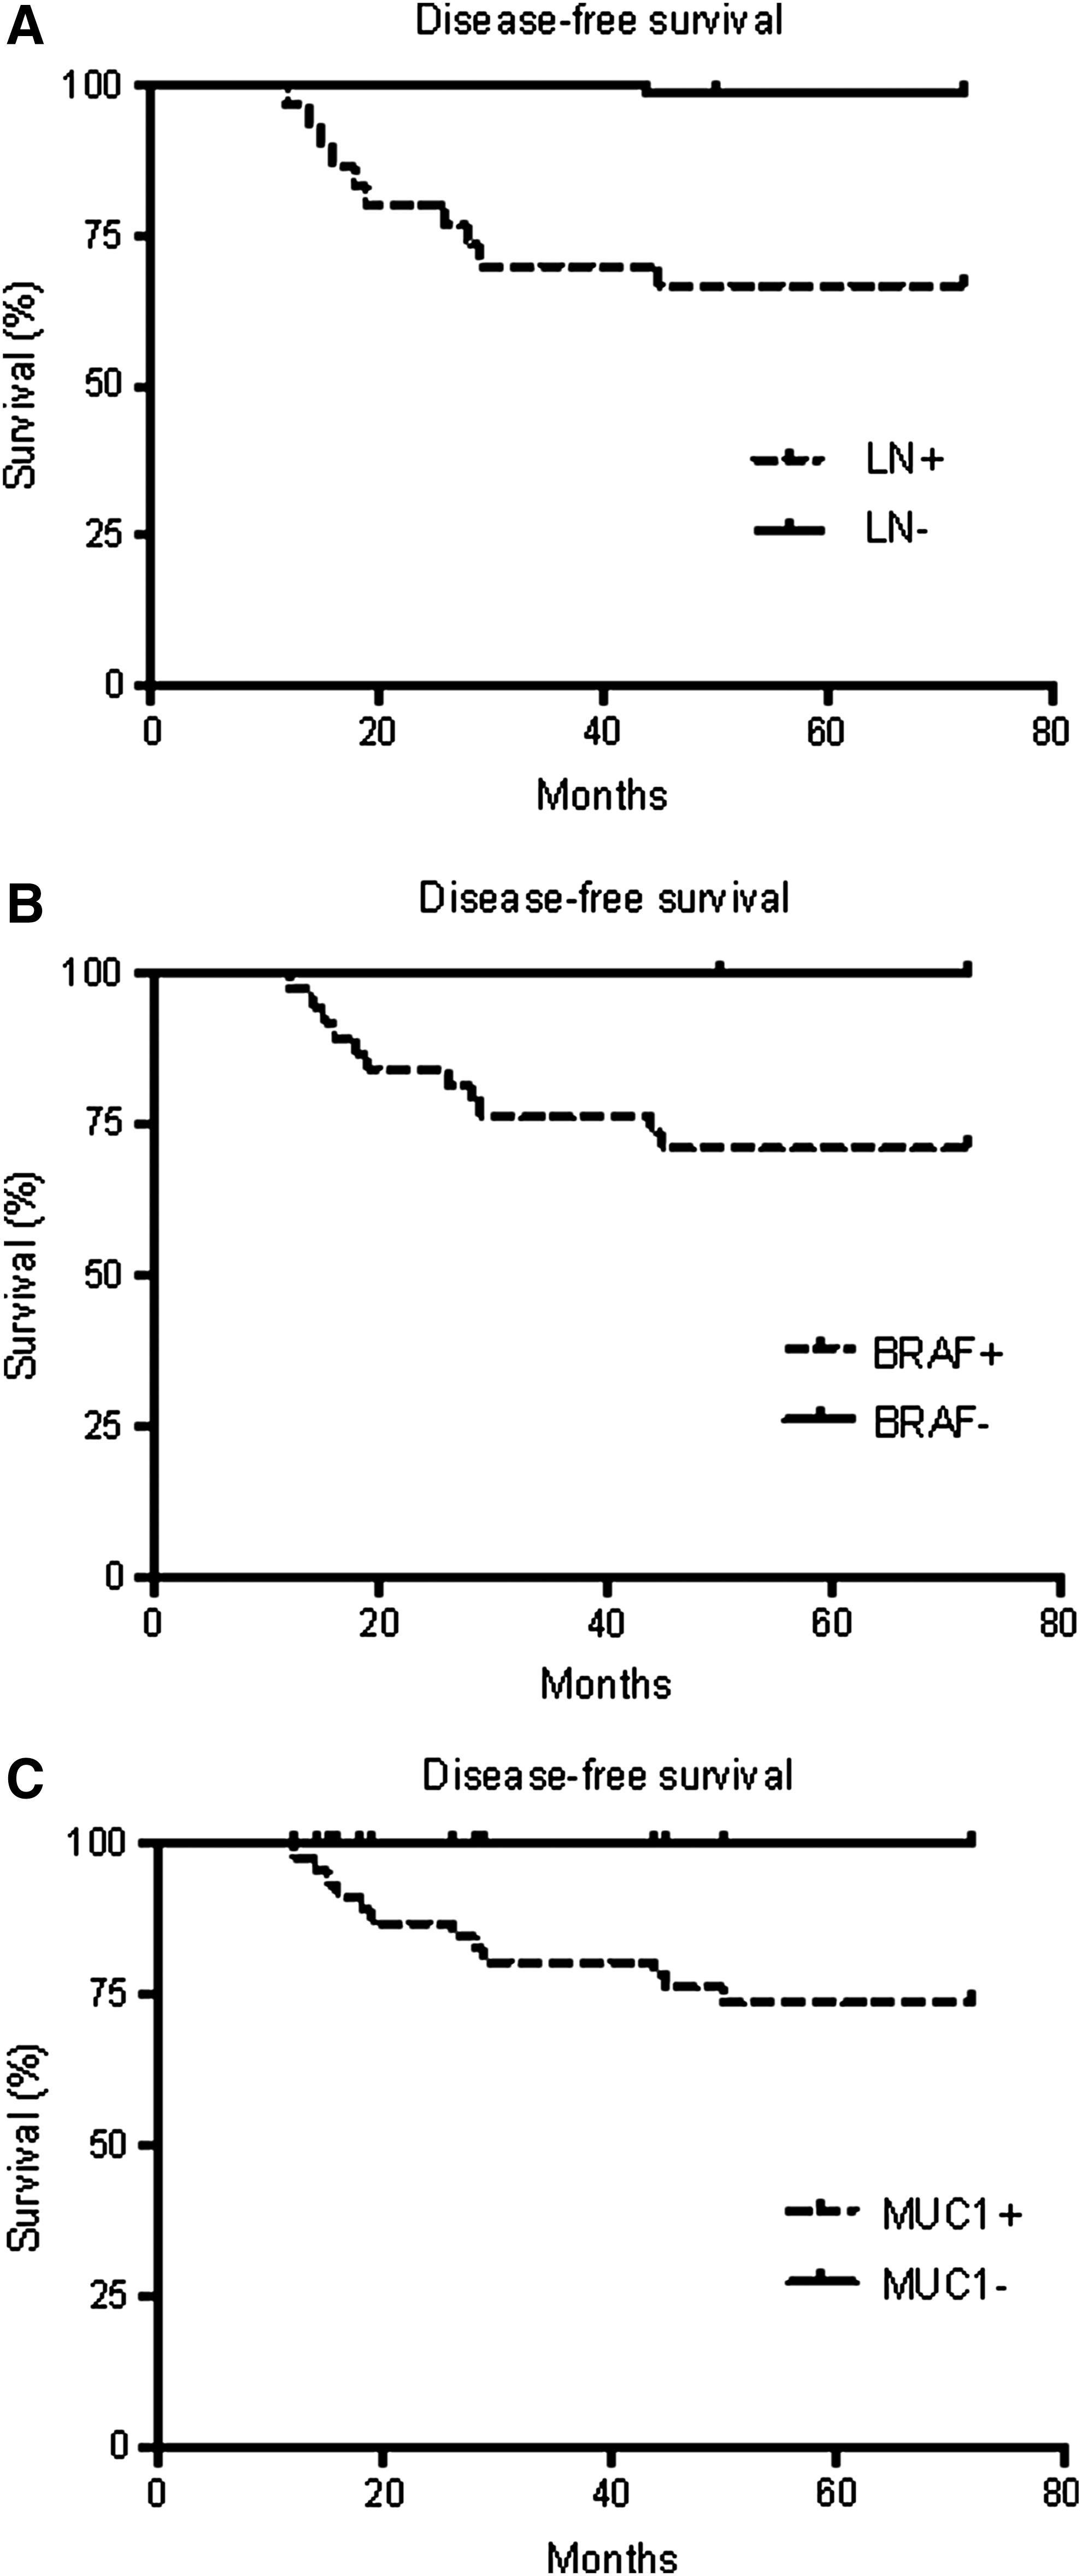
Clinical follow-up revealed a remission for 83 patients (87%), a lymph node recurrence for eight patients (8%), a recurrence in the thyroid bed in one patient (1%), a lung metastasis in one patient (1%), a disease-related death in one patient (1%), and death from another event in one patient (1%). Median time until documented recurrence was 28 months (12–45 months). Disease-free survival for MUC1 positive patients at 45 months was 76% [CI 0.60–0.86], whereas all MUC1 negative patients were disease free at 45 months. Disease-free survival for patients with lymph node metastasis at 45 months was 66% [CI 0.47–0.80], whereas disease-free survival at 45 months for patients without lymph node metastasis was 98% [CI 0.89–0.99]. Disease-free survival for BRAF-mutated patients at 45 months was 71% [CI 0.54–0.83], whereas all BRAF-wild type patients were disease-free at 45 months. The disease-free survival was significantly shorter for patients with lymph node metastasis (p<0.0001), for patients with mutant BRAF tumor (p<0.0001), as for patients with MUC1 positive tumor (p=0.0003) (Fig. 3). By multivariate analysis, the strongest risk factor of relapse was lymph node metastasis, with a hazard ratio of 26 [CI 3.35–205].
Disease-free survival according to
MUC1 expression in relation to histopathologic/clinical data and BRAF mutation status in PTCs, as determined by multivariate analysis
Multivariate analysis showed a highly significant association between MUC1 expression and the presence of the BRAF V600E mutation (OR=23 [CI 4.04–130.61]), between MUC1 expression and the presence of lymph node metastasis (OR=6 [CI 1.08–31.91]), between MUC1 and papillae (OR=3.2 [CI 0.57–18.77]), and between MUC1 and pseudoinclusions (OR=2.5 [CI 0.62–10.28]). Influence of age and sex on MUC1 expression was investigated and was not statistically significant (p=0.55 and p=0.55).
Discussion
Our first objective was to assess the pattern of MUC1 expression in thyroid follicular tumors (PTCs and FAs). In our study, we compared the expression pattern of MUC1 with three antibodies. We showed that this expression was quite similar whatever the clone used. MUC1 thus appeared to be of limited interest in distinguishing PTCs from FAs, as compared to other immunohistochemical markers commonly used in thyroid pathology, such as CK19, HBME1, or Galectin3, as previously described (44). Our results are in line with those of Bièche et al., who found MUC1-positive immunostaining in 45% of the PTCs they examined (26). Somewhat different proportions were found by Abrosimov et al. (61% of the classical PTCs tested) and Wreesmann et al. (35% of the classical PTCs tested) (6,11). In terms of the subcellular localization of the MUC1 stain, in agreement with Bièche et al., we observed a predominant cytoplasmic pattern in PTCs (26).
Moreover, we noticed high MUC1 expression within nuclear pseudoinclusions in the majority of PTCs with cytoplasmic MUC1 staining. Nuclear pseudoinclusions are invaginations of nuclear contours with cytoplasm appearing as circumscribed punched-out holes (45). Here, the nuclear pseudoinclusions appeared more intensely stained than the cytoplasm of individual tumor cells. The composition of pseudoinclusions is not yet known. Recent findings have revealed that various thyroid carcinoma cells express the MUC1 C-terminal peptide (MUC1 C-ter) in mitochondria (46). One might hypothesize that the observed high-intensity staining of MUC1 in nuclear pseudoinclusions is related to a disturbance in apical biosynthetic trafficking and subsequent accumulation of MUC1 in organelles such as mitochondria or lysosomes. Such a blockade in the cellular trafficking of MUC1 with secondary accumulation in lysosomes has previously been described in colon carcinoma cell lines (47). Interestingly, the MUC1 C-ter binding partner β-catenin has also been found inside PTC nuclear pseudoinclusions (48 –51). Such an association was not frequent in our series, as we observed intranuclear pseudoinclusion expression of β-catenin in only two PTCs.
Our second objective was to identify correlations between MUC1 expression and clinical, histopathologic, and molecular data in PTCs. Our univariate analysis has established significant correlations between MUC1 expression and the presence of aggressive histopathologic features. Our multivariate analysis has shown a strong correlation between MUC1 expression and the presence of (a) the BRAF V600E mutation and (b) lymph node metastasis. To our knowledge, this is the first report demonstrating an association between MUC1 expression and the presence of the BRAF V600E mutation. A link between MUC1 and TNF-alpha was previously demonstrated, but currently, MUC1 is not recognized as a target gene of the mitogen-activated protein kinase (MAPK) signaling pathway (52). The absence of a BRAF mutation in some MUC1-expressing PTCs and adenomas suggests that the MUC1 gene might be regulated in other ways in these tumors. Other genetic events, especially RAS mutations, epigenetic modifications (promoter methylation) (53), or gene amplification (11) may be responsible for MUC1 gene activation. This hypothesis is further supported by our results, since 5 out of 10 MUC1 positive/BRAF-wild type PTCs were RAS-mutated.
In line with previous reports (6,11), we have revealed a significant association between MUC1 expression and aggressive clinicopathologic parameters. “Aggressive” subtypes (TCV, DSV, and CCV) appeared to be associated with a higher prevalence of positive staining. In contrast, most of FVPTCs, which are characterized by an excellent clinical course and prognosis (54), appeared MUC1-negative in our series. These results are in line with those of Wreesmann et al., who demonstrated MUC1 upregulation in 97.5% of the TCVs (11). In a multivariate analysis, they also found MUC1 overexpression to be a significant predictor of poorer prognosis, independently of histopathologic category. In our series, the patients who recurred or presented metastasis during the long follow-up where identify among MUC1 positive tumors. The negative predictive value of MUC1 to identify relapse was 100%.
Our observation that MUC1 expression correlated with extrathyroidal extension and with lymph node metastasis is in agreement with the results of several studies (44,26,27), although other studies failed to evidence such an association (6,27,55). In our study, the association between MUC1 and presence of lymph node metastasis was strong as demonstrated by multivariate analysis.
In the literature (including meta-analyses), the BRAF V600E mutation has been linked to a worse prognosis in patients with PTCs (6,11,56 –60). We suggest that the association between BRAF mutation and MUC1 expression demonstrated here may explain why aggressive clinicopathologic features of PTC have been linked to the presence of a BRAF mutation on the one hand and MUC1 expression on the other. Assessment of MUC1 expression could improve the risk stratification of PTCs. Nevertheless, based on our multivariate analysis, among MUC1 expression, BRAF mutation, and lymph node metastasis, the latter is the most important risk factor of relapse. Several investigations in progress are focusing on MUC1 as a tumor antigen in relation to immunomodulation in cancer because this mucin is being viewed as an attractive potential therapeutic target (61). A tripartite vaccine associated with a tumor-specific anti-MUC1 response was recently described in a humanized mouse model of breast cancer (62).
In conclusion, our analysis of MUC1 expression on 190 thyroid tumors revealed several interesting results. First, we observed a high level of MUC1 inside nuclear pseudoinclusions, which could be related to a blockade in MUC1 intracellular trafficking. Second, we have demonstrated for the first time by multivariate analysis a significant and strong association between MUC1 positivity and presence of the BRAF V600E mutation, which raises the question of a mechanistic link between MUC1 expression and the MAPK kinase pathway. Third, MUC1 was associated with lymph node metastasis and a positive BRAF V600E mutation, which are currently considered as poor prognosis factors. Thus, the characterization of MUC1 expression could improve the risk stratification of PTCs and be helpful for the choice of therapeutic strategies.
Footnotes
Acknowledgments
We thank Rose-Mary Siminsky and Marie-Hélène Gevaert (Laboratoire d'Histologie, Faculté de Médecine, Lille) for excellent technical help; Dr. D. Swallow (Imperial Cancer Research, London, United Kingdom) for the kind gift of MUC1 clone M8 antibody; and the Tumor Bank of the Department of Pathology of Lille University Hospital, France.
Author Disclosure Statement
No competing financial interests exist.