
Abstract
Background:
The thyroid hormone triiodothyronine (T3) is known to affect energy balance. Recent evidence points to an action of T3 in the hypothalamus, a key area of the brain involved in energy homeostasis, but the components and mechanisms are far from understood. The aim of this study was to identify components in the hypothalamus that may be involved in the action of T3 on energy balance regulatory mechanisms.
Methods:
Sprague Dawley rats were made hypothyroid by giving 0.025% methimazole (MMI) in their drinking water for 22 days. On day 21, half the MMI-treated rats received a saline injection, whereas the others were injected with T3. Food intake and body weight measurements were taken daily. Body composition was determined by magnetic resonance imaging, gene expression was analyzed by in situ hybridization, and T3-induced gene expression was determined by microarray analysis of MMI-treated compared to MMI-T3-injected hypothalamic RNA.
Results:
Post mortem serum thyroid hormone levels showed that MMI treatment decreased circulating thyroid hormones and increased thyrotropin (TSH). MMI treatment decreased food intake and body weight. Body composition analysis revealed reduced lean and fat mass in thyroidectomized rats from day 14 of the experiment. MMI treatment caused a decrease in circulating triglyceride concentrations, an increase in nonesterified fatty acids, and decreased insulin levels. A glucose tolerance test showed impaired glucose clearance in the thyroidectomized animals. In the brain, in situ hybridization revealed marked changes in gene expression, including genes such as Mct8, a thyroid hormone transporter, and Agrp, a key component in energy balance regulation. Microarray analysis revealed 110 genes to be up- or downregulated with T3 treatment (±1.3-fold change, p<0.05). Three genes chosen from the differentially expressed genes were verified by in situ hybridization to be activated by T3 in cells located at or close to the hypothalamic ventricular ependymal layer and differentially expressed in animal models of long- and short-term body weight regulation.
Conclusion:
This study identified genes regulated by T3 in the hypothalamus, a key area of the brain involved in homeostasis and neuroendocrine functions. These include genes hitherto not known to be regulated by thyroid status.
Introduction
T
Thyroid hormones are produced in the thyroid gland and are released into the circulation from where they are shuttled to the brain via at least two identified highly specific transporters: the organic anion transporting polypeptide 1c1 (OATP1C1) and the monocarboxylate transporter 8 (MCT8) (14 –16). Thyroxine (T4), the precursor of T3, is released by the thyroid gland and is under the tight control of an autoregulatory feedback system involving the paraventricular nucleus of the hypothalamus and the pituitary (17). T3 is predominantly derived from T4 by the action of type II deiodinase (DIO2) and type I deiodinase (DIO1) in any given target tissue.
Three deiodinase enzymes have been identified. However, only two of them are present in the brain where they locally regulate T3 levels: DIO2 activates T4 to T3 by outer ring deiodination, whereas type III deiodinase (DIO3) catalyzes inner ring deiodination of T4 or T3 to the inactive forms of reverse T3 (rT3) or 3,3′-diidothyronine (T2) respectively. Hence, whereas DIO2 increases T3 availability, DIO3 is the enzyme involved in limiting or reducing T3 availability and action (18,19). Within the hypothalamus—the brain area involved in the homeostatic control of energy balance—both deiodinase enzymes are highly expressed in ependymal/tanycyte cells lining the third ventricle (20,21).
In ventricular ependymal/tanycyte cells, deiodinase expression and activity is strongly altered in response to short-term energetic challenges such as fasting or critical illness, but also when long-term shifts in energy balance occur, as in seasonal mammals (20 –26). Importantly, the local changes in thyroid hormone metabolism in ventricular ependymal cells appear to be partially independent of the hypothalamus-pituitary-thyroid (HPT) axis and thyroid hormone status in the periphery (27,28). It is assumed that once locally activated by DIO2 in tanycytes—specialized glial cells of the ependymal layer—T3 can directly act on neuronal pathways within the hypothalamus and thereby centrally influence food intake and energy expenditure (11 –13,22).
Consistent with the functional evidence for T3 involvement in the central regulation of energy balance, knockout mice with defective thyroid hormone receptors show impaired metabolism, body weight, glucose, and lipid handling (29), while several studies using either in situ hybridization or immunocytochemistry have demonstrated an appropriate distribution of thyroid hormone receptor isoforms in energy balance–related nuclei in the hypothalamus of several species, including humans (20,30,31).
Taken together, the available evidence supports thyroid hormone action in the hypothalamus acting on mechanisms that affect energy balance in mammals. However, we know comparatively little about the molecular mechanisms and pathways that are regulated by thyroid hormone in the brain to regulate homeostatic mechanisms.
In this study, we screened for mechanisms of T3 action on appetite and energy balance regulatory mechanisms in the hypothalamus by comparing hypothalamic gene expression by microarray analysis between chemically induced hypothyroid Sprague Dawley rats with and without T3 administration. We then applied the information derived from the microarray studies to the analysis of gene expression in two models of altered short-term or long-term energy balance: the fasted and re-fed rat, and the Siberian hamster under long day and short day photoperiod.
Material and Methods
All research using animals was licensed under the Animals Act of 1986 (Scientific Procedures) and received ethical approval from the Rowett Research Institute ethical review committee.
Male Sprague Dawley rats were purchased from Charles River UK at the age of six weeks. Rats were kept in a 12h:12h light dark cycle at 21±2°C and acclimatized for one week. A standard pelleted diet and water were available ad libitum.
Chemically induced hypothyroidism
Throughout the study, food intake and body weight were monitored daily, and body composition was assessed on all animals at days 0, 7, 14, and 21 using a nuclear magnetic resonance scanner (EchoMRI, Houston, TX). From day 1 of the experiment, two cohorts of rats were made hypothyroid by supplementing their drinking water with 0.025% of the thyroperoxidase inhibitor methimazole (MMI) and 3% saccharin for 22 days (n=48). Water containing MMI and saccharin was freshly prepared and changed every second day. To achieve minimum possible circulating thyroid hormone levels, iopanoic acid (IOP; 100 mg/kg) was injected at days 1, 7, 14, and 21 to inhibit deiodinase activity. On day 21 of the experiment, half the hypothyroid rats received a 25 μg/100 g intraperitoneal (i.p.) T3 injection (group MMI-T3, n=24), whereas the other half were injected with saline (group MMI-sal, n=24).
A third group of rats without MMI treatment received a saline injection on day 21 and served as a naïve control group (control, n=20). Twenty-four hours after T3 or saline injection (day 22), animals were anaesthetized using isoflurane inhalation and then decapitated. Trunk blood was collected for serum preparation, and the brains were removed and frozen on dry ice. Serum and brains were stored at −70°C until required.
A second identical experiment investigated glucose tolerance in the chemically induced hypothyroid animals. A glucose tolerance test was performed in control animals (n=6) and MMI-treated animals (n=12) on day 20 of the experiment. Glucose at 1 g/kg body weight was injected i.p., and blood samples were taken from the tail vein at 0, 7, 15, 30, 90, and 120 min after injection. Serum was stored at −70°C until further analysis.
Serum analysis
Serum levels of T3, T4, and thyrotropin (TSH) were determined by in-house radioimmunoassays (32,33). Glucose, NEFAs, and triglycerides were assayed using the Konelab 30 clinical chemistry analyzer, and serum insulin concentrations using a rat insulin enzyme-linked immunosorbent assay (ELISA; Mercodia, Uppsala, Sweden).
Microarray analysis
Hypothalamic blocks spanning the ARC (Bregma −2.12 mm to −4.52 mm) were cut from frozen brains, and total RNA was extracted from individual blocks by homogenization in Trizol. RNA was treated with DNase to eliminate any contaminating DNA and purified using Qiagen RNAeasy spin columns. RNA integrity was assessed using the Agilent Bioanalyzer Lab-On-a-Chip analysis system (Agilent Technologies, Santa Clara, CA). RNA was amplified in two steps to cRNA, incorporating Cy-3 and Cy-5 dyes, and was purified with RNeasy mini spin columns. Labeled RNA from individual hypothalamic blocks was applied in MMI-T3 (n=4) versus MMI-sal (n=4) pairs to Agilent rat whole genome microarrays. Gene expression microarrays (4x44K) were manufactured and supplied by Agilent Technologies, and contained 60-mer probes with approximately 30,000 Entrez Gene RNAs represented. Labeled cRNA was hybridized to each array rotating at 65°C for 17 h. After washing, the arrays were scanned using a SureScan High Resolution Scanner (Agilent Technologies).
The statistical programming language R (v3.0.2) was used to analyze the raw expression data. Gene expression values were analyzed on log2 scale, and Loess normalization was conducted to remove an overall intensity depending dye effect using the Bioconductor library limma (v3.18.9). Values of spots that were represented by identical oligos were averaged across duplicates. The limma package was also used to detect the most significant gene expression changes using a linear model with the factors dye (Cy3, Cy5) and treatment (saline, T3). The p-values for the treatment effect were adjusted for multiple testing by using the Benjamini–Hochberg method, and probes with an adjusted p-value below 0.25 were deemed significant (corresponding to a false discovery rate of 25%). In order not to overlook biologically relevant large but not quite so statistically significant changes, probes that displayed a change of twofold or more in either direction and had a p-value of <0.01 were also added this list. Log2 ratios of treatment effects were back transformed to obtain fold changes. The data discussed in this publication have been deposited in NCBI's Gene Expression Omnibus (34) and are accessible through GEO Series accession number GSE55803 (
Fasted and re-fed rats
To investigate expression changes of candidate genes in additional animal models of energy balance, two further experiments were carried out. First, a rat model of short-term energy deficit (fasting) with subsequent re-feeding was studied. Male Sprague Dawley rats were purchased from Charles River UK at the age of eight weeks. They were kept in a 12h:12h light dark cycle at 21±2°C and acclimatized for one week. A standard pelleted diet and water were available ad libitum. One group (n=8 per group) of rats was then fasted for 48 h. A second group was fasted for 48 h and then re-fed for 24 h, and a third group was fed ad libitum throughout as control. Animals were killed at ZT3 (3 h after lights on). Their brains were dissected, frozen on dry ice, and maintained at −70°C until further use.
Long day and short day acclimatized Siberian hamsters
Siberian hamsters were drawn from a colony at the Rowett Institute for Nutrition and Health, University of Aberdeen, bred and raised under long day (LD; 16:8 h light:dark) conditions. At the age of three months, hamsters were either exposed to LD (n=6) or short day (SD; 8:16 h light:dark, n=7) conditions. Animals were housed individually, food (standard pellet diet) and water were available ad libitum throughout the entire experiment, and ambient temperature was maintained at 22°C. Body weight was monitored weekly. After 14 weeks, hamsters were killed at ZT3 by cervical dislocation. Brains were dissected, frozen on dry ice, and stored at −70°C until required.
Cloning of riboprobes and in situ hybridization
Messenger RNA levels and distribution of selected genes regulated by T3 were analyzed in coronal hypothalamic sections by in situ hybridization. Twenty micron–thick sections of the hypothalamus were cut and mounted onto poly-L-lysine coated slides. Every tenth section was mounted onto a slide to generate 10 slide sets (two slides per rat) with representative sections spanning the hypothalamic region containing the arcuate nucleus (Bregma −1.72 mm to −4.08 mm) or the paraventricular nucleus (Bregma −0.24 mm to −1.78 mm, Paxinos and Watson, The rat brain). Riboprobes were generated from cloned polymerase chain reaction (PCR)-generated fragments for Dio2, Dio3, Mct8, Trh, Npy, Pomc, Agrp, as previously described (25, 26, 35 –37). Probes for Hairless, Sned1, and Plunc were cloned using rat hypothalamic cDNA with the following primers: for Hairless, primers were based on Genbank sequence (NM_024364), forward primer 5′-CAC TGG GCT CCG GGC ACT CAA G-3′ (bases 1667–1688), reverse primer 5′-TGC CTG GGC TGT CCT CTG TCA T-3′ (bases 2223–2202); Sned1 primers based on Genbank sequence (AF439716), forward primer 5′-AGC CTG CGC ACC TCT ACA TCA TCA-3′ (bases 2214–2233); reverse primer 5′-GGG CGG GGC ACT TTT TCA CAG-3′ (bases 2702–2681). Plunc primers were based on Genbank sequence (NM_172031) forward primer 5′-GGG GCC TGC TTG GAA AAC TGA C (bases 367–388); reverse primer 5′-GTG ACA TCC AAA CCG CTG AGA ATC (bases 802–779).
In situ hybridization was carried out as previously described (21). Briefly, sections were fixed in 4% paraformaldehyde in 0.1 M phosphate buffer (PB), washed in 0.1 M PB, acetylated in 0.25% acetic anhydrate in 0.1 M triethanolamine, and washed again in PB. After dehydration in graded ethanol, radioactive probes were applied to the slides in 70 μL hybridization mixture (0.3 M NaCl, 10 mM Tris-HCL (pH 8), 1 mM EDTA, 0.05% transfer RNA, 10 mM dithiothreitol, 0.02% Ficoll, 0.02% polyvinylpyrrolidone, 0.02% BSA, and 10% dextran sulphate) and hybridized overnight at 58°C. The next day, slides were rinsed in 4× SSC (1× SSC is 0.15 M sodium chloride, 15 mM trisodium citrate pH 7.0), and treated with ribonuclease A (20 μg/μL) at 37°C for 30 min before being washed in decreasing concentrations of SSC with a final wash in 0.1% SSC at 60°C and dehydration using graded ethanol. Finally, slides were dried and apposed to Kodak Biomax MR film.
After exposure, autoradiographic films were scanned on an Epson scanner and analyzed with Image-Pro PLUS v4.1.0.0 analysis software (Media Cybernetics, Rockville, MD). Integrated optical density was obtained by reference to a 14C microscale. We measured Dio2, Dio3, Mct8, Hairless, Plunc, and Sned1 mRNA expression in four sections spanning the ependymal layer of the third ventricle. Dio3 mRNA expression was also analyzed bilaterally in three sections containing the amygdala, Sned1 mRNA bilaterally in three sections containing the VMH, Trh mRNA expression bilaterally in three sections containing the PVN, and Pomc, Npy, and Agrp mRNA expression measured bilaterally in three sections containing the ARC. Values were averaged for each animal, and the relative mRNA abundance values were calculated by assigning a 100% expression value for the untreated control group (thyroidectomy rat study), ad lib–fed group (fasting–refeeding rat study), or LD-exposed hamsters.
Statistical analysis of nonmicroarray data
Data were analyzed by t-test, one-way analysis of variance (ANOVA), or two-way repeated measures ANOVA followed by Tukey post hoc, as appropriate. If data were not normally distributed, a one-way ANOVA on ranks (Kruskal–Wallis) combined with Dunn's test was performed. SigmaPlot v11.0 software (Jandel, San Rafael, CA) was used for analysis. The results are presented as mean±standard error of the mean (SEM), and differences were considered significant at p<0.05.
Results
Food intake, body weight, and body composition
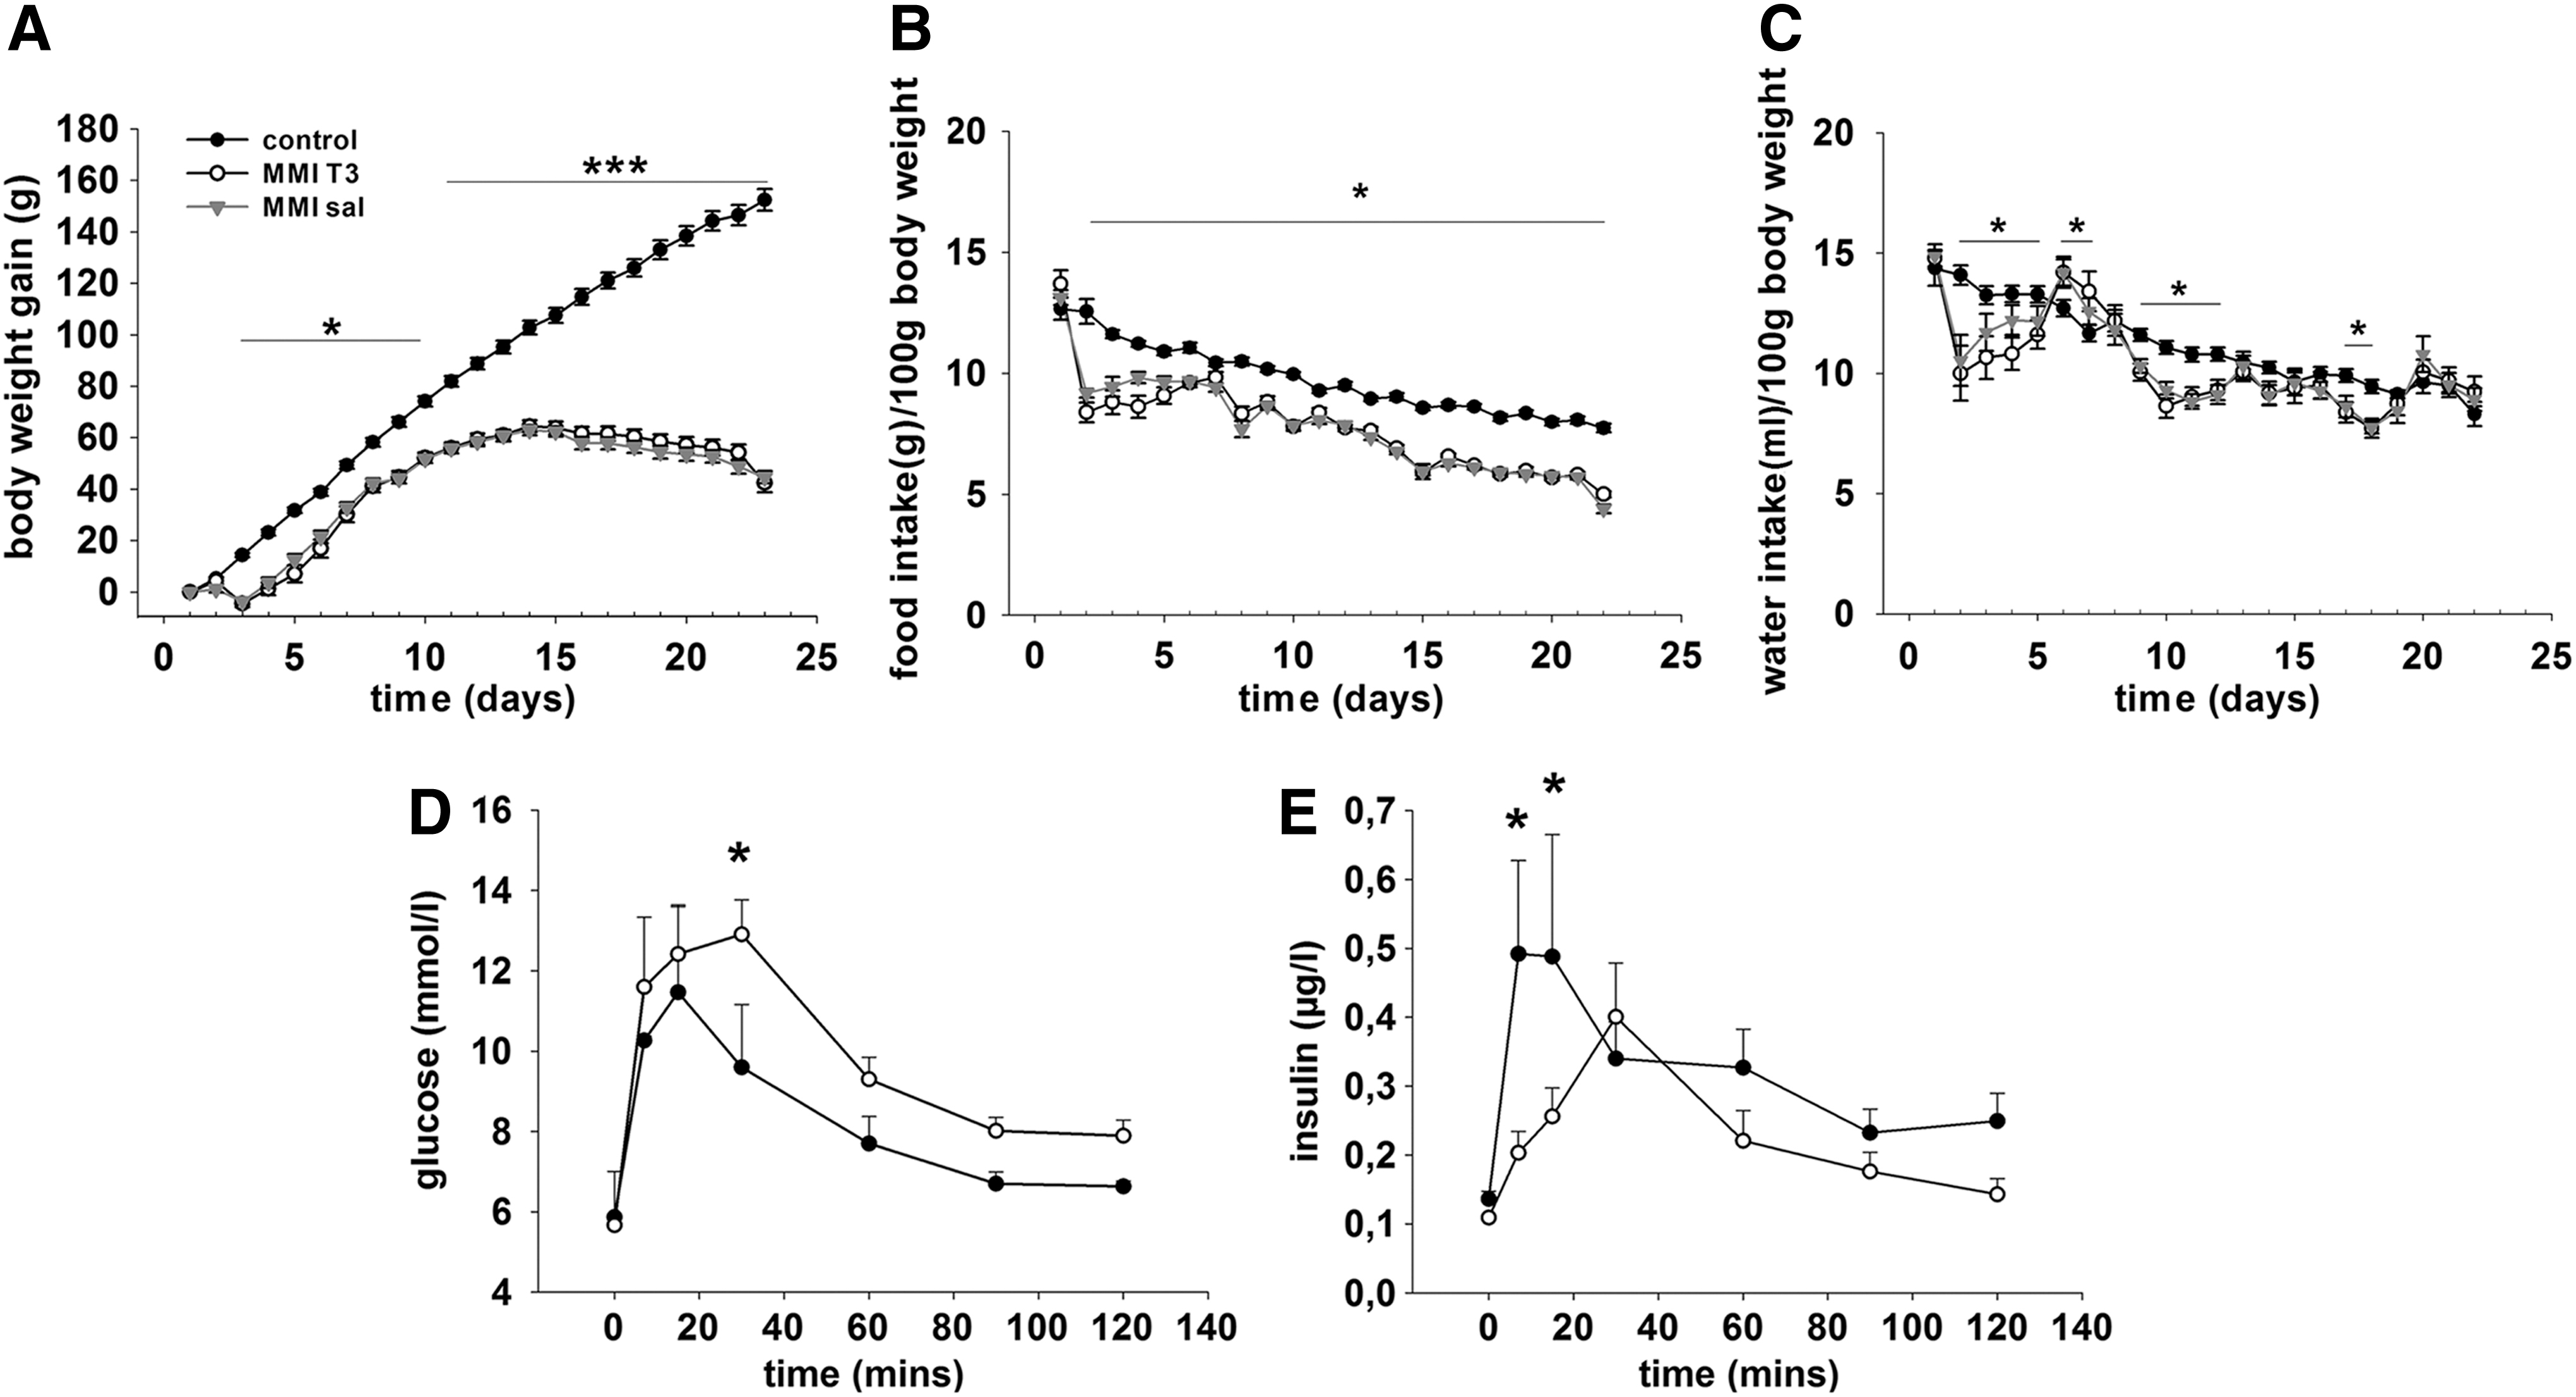
To assess the effect of chemically induced hypothyroidism on energy balance, body weight and food intake were measured daily. Analysis of body weight revealed a significant interaction between treatment and time (F=209.048, p<0.001). Within the MMI-treated groups, weight gain paralleled the control group until day 11 before body weight plateaued before decreasing slightly by day 22. In the control animals, body weight increased significantly throughout the entire study. Body weight was lower in the MMI-treated rats relative to the control group from day 3 of the experiment (p<0.05) and became significantly different from day 11 onwards (p<0.001; Fig. 1A).
(
Within the control and the MMI-treated groups, food intake (g/100 g body weight) decreased over the course of the experiment (control day 1 vs. day 22: p<0.001; MMI day 1 vs. day 22: p<0.001; Fig. 1B). Food intake (g/100 g body weight) was significantly lower in the MMI-treated groups compared with the control group from day 1 of MMI treatment (p<0.009 at all days), and there was no effect on food intake over the 24 hour period after i.p. administration of T3.
Water intake (mL/100 body weight) varied on a daily basis in MMI-treated rats compared with control rats on several days during the study (decreased days 2–5, days 9–12, day 17, and day 18, p<0.05; increased days 6 and 7, p<0.05, Fig. 1C). However, average daily water intake over the entire study was not significantly different (MMI: 10.4 mL/100 g body weight vs. control: 11.2 mL/100 g body weight).
Body fat mass was analyzed by magnetic resonance imaging (MRI) showed significantly less fat gain in MMI groups (day 21; fat mass gain MMI rats 6.5 g vs. control rats 11.7 g, p<0.001). Furthermore, lean mass gain was significantly lower in the MMI-treated animals (day 21, lean mass gain MMI rats 37.6 g, control rats 117.5 g, p<0.001).
Serum analysis
To assess the effectiveness of the MMI treatment and T3 injection, T3, T4, and TSH were analyzed in the serum post mortem (Table 1). Compared to the control group, post mortem serum levels of T3 were reduced by 50% in MMI-treated animals injected with saline (p<0.05). After T3 administration to MMI-treated rats, T3 concentrations were more than 30-fold higher after 24 h compared with control animals (p<0.05). Serum T4 levels were decreased by up to 80% in both MMI-sal and MMI-T3 groups relative to the control group (p<0.05). TSH serum levels were low in control animals and increased 12-fold in the MMI-sal group (p<0.05). In MMI-T3-treated rats, TSH serum concentrations were not different from levels of the control animals.
MMI, methimazole; T3, triiodothyronine; T4, thyroxine; TSH, thyrotropin; n.s., not significant.
NEFAs were increased by up to 90% in MMI-treated rats (p<0.05), whereas triglycerides were decreased by 60% in all MMI-treated rats when compared with control rats (p<0.05). T3 injection did not influence NEFA or triglyceride concentrations 24 h after administration (NEFAs p<0.05; tryglicerides p<0.05). Glucose levels were similar in all groups, whereas terminal insulin levels decreased by 50% in both MMI-sal groups compared with controls (Table 1).
To assess whether changes in terminal insulin levels affected the glucose tolerance of MMI-treated rats, we carried out a further study on 16 rats. In these animals, an i.p. glucose tolerance test (i.p. injections of 1 g/kg body weight glucose) was performed on day 20, which revealed impaired glucose clearance (at 30 min after injection, p=0.029; area under the curve 1177.9±61 MMI treatment vs. 976.9±54.4 Con, p=0.027) and decreased insulin secretion (7 min after injection and 15 min after injection, p=0.001 and p=0.008 respectively) in the hypothyroid rats (Fig. 1D and E).
Effects of chemically induced hypothyroidism and T3 administration on the hypothalamic thyroid hormone system
In situ hybridization of components involved in the regulation of hypothalamic thyroid hormone metabolism and transport revealed marked differences between the experimental groups. Relative to controls, Dio2 expression in tanycytes showed intermediate levels in the control group and was increased by 75% in MMI-sal rats (p<0.001), whereas in the MMI-T3 group, Dio2 expression, although lower, was not statistically different compared with the control group (p=0.06; Fig. 2A). In the ependymal layer and the amygdala, Dio3 was weakly expressed in the control and MMI-sal groups, but was significantly upregulated in MMI-T3 rats (p<0.05; Fig. 2B and C). Thyroid hormone transporter Mct8 mRNA was highly expressed in the ependymal layer of control animals and decreased by 60% in MMI-sal rats (p<0.001). In the MMI-T3 group, Mct8 mRNA levels were comparable to control levels (Fig. 2D), demonstrating that Mct8 can be directly regulated by T3. Trh mRNA expression in the PVN was low in the control animals and increased 4.5-fold in the MMI-sal group (p<0.001). In MMI-T3 animals, Trh mRNA levels were decreased relative to MMI-sal animals by 50% (p<0.001) but were still 150% higher than in the control group (p=0.003, Fig. 2E).

Autoradiographs and analysis of (
Effects of chemically induced hypothyroidism and T3 injection on hypothalamic systems of energy balance regulation
No differences between the experimental groups were found for orexigenic Npy (Fig. 3A) or anorexigenic Pomc mRNA expression (Fig. 3C) in the arcuate nucleus, but expression of orexigenic Agrp mRNA was significantly decreased by 50% in MMI-sal rats relative to control and MMI-T3 rats (p<0.001; Fig. 3B).
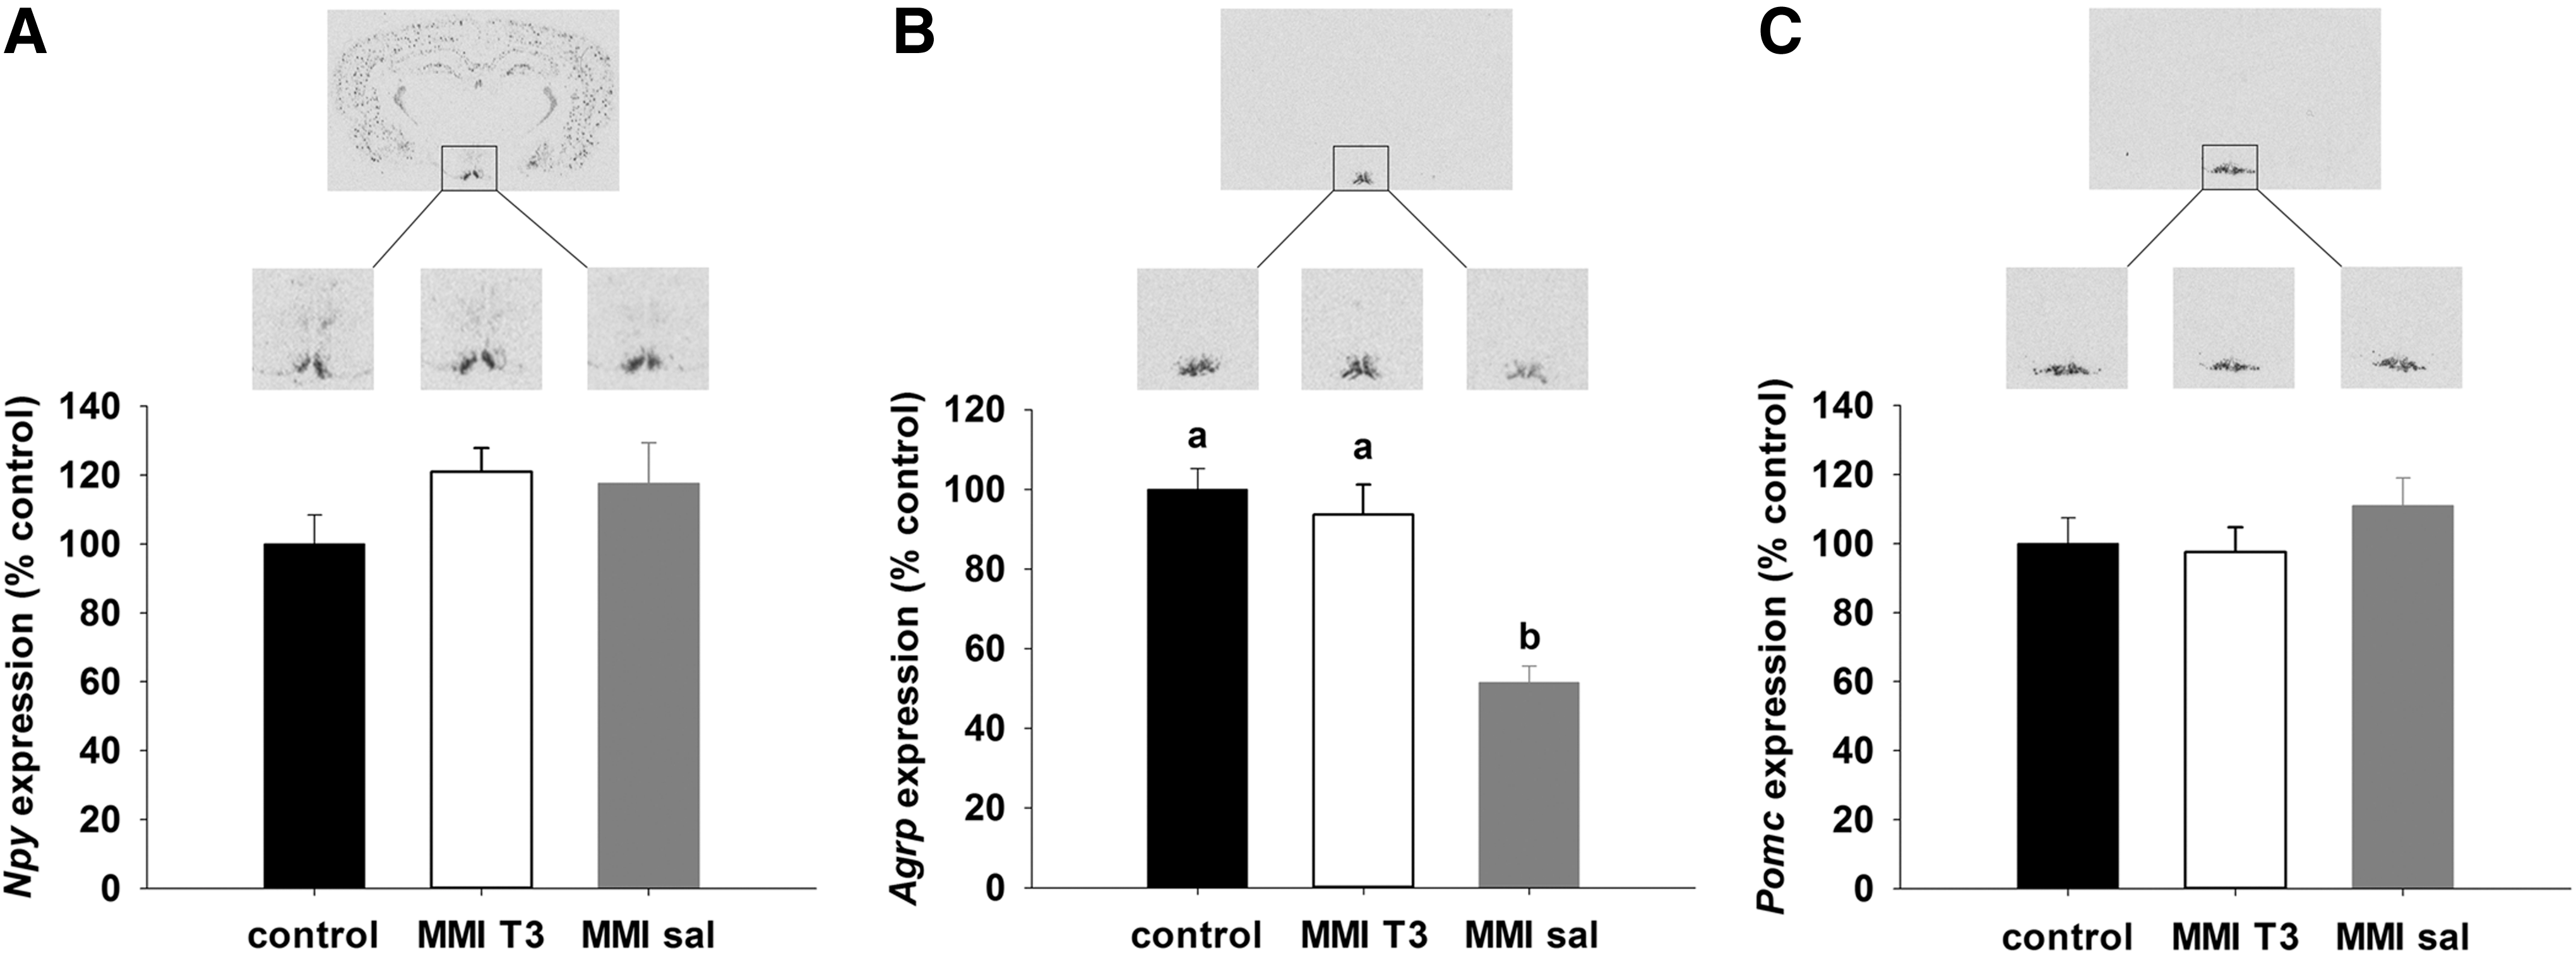
Representative film images and quantification of (
Microarray analysis of hypothalamic RNA from hypothyroid versus hypothyroid-T3-injected Sprague Dawley rats
To screen for novel mechanisms driven by T3 in the brain, mRNA extracted from hypothalamic blocks spanning the volume of the arcuate nucleus were analyzed using Agilent whole genome microarrays. This analysis revealed that 85 genes were upregulated by T3 treatment compared with MMI-Sal-treated rats, whereas 25 were downregulated with a greater than 1.3-fold change (at a false discovery rate threshold of 0.25; Tables 2 and 3).
Analysis of expression of differentially expressed genes in the hypothalamus of animal models of body weight regulation
To verify the microarray data, three candidate genes were chosen on the basis of possible involvement in energy balance or neurogenesis, based on either description or preliminary in situ hybridization data. The first candidate gene was the insulin responsive element binding protein 1 (SNED1) gene, which encodes a transcription factor that may be involved in insulin-regulated gene expression (38 –41). In situ hybridization revealed that Sned1 expression in the hypothalamus was restricted to the ependymal layer of the third ventricle and the ventromedial nucleus (VMN). Quantification of the signal in the ependymal layer demonstrated an increase of Sned1 in MMI-T3 rats relative to control and MMI-sal groups (130% and 160% respectively; p<0.001; Fig. 4A). No regulation of Sned1 was observed in the ependymal layer of rats that were food deprived for 48 h and then re-fed (Fig. 4B). In the ependymal layer of Siberian hamsters, Sned1 was 80% higher in LD compared to SD hamsters (p<0.001; Fig. 4C). In the VMN, Sned1 was increased by T3 administration to hypothyroid rats by 13-fold compared to the euthyroid control group, and it was mostly undetectable in hypothyroid rats treated with saline (p<0.001; Fig. 4D). There was no effect of fasting or re-feeding on Sned1 mRNA expression, and Sned1 mRNA expression was not detectable in the VMN of the Siberian hamster (data not shown).
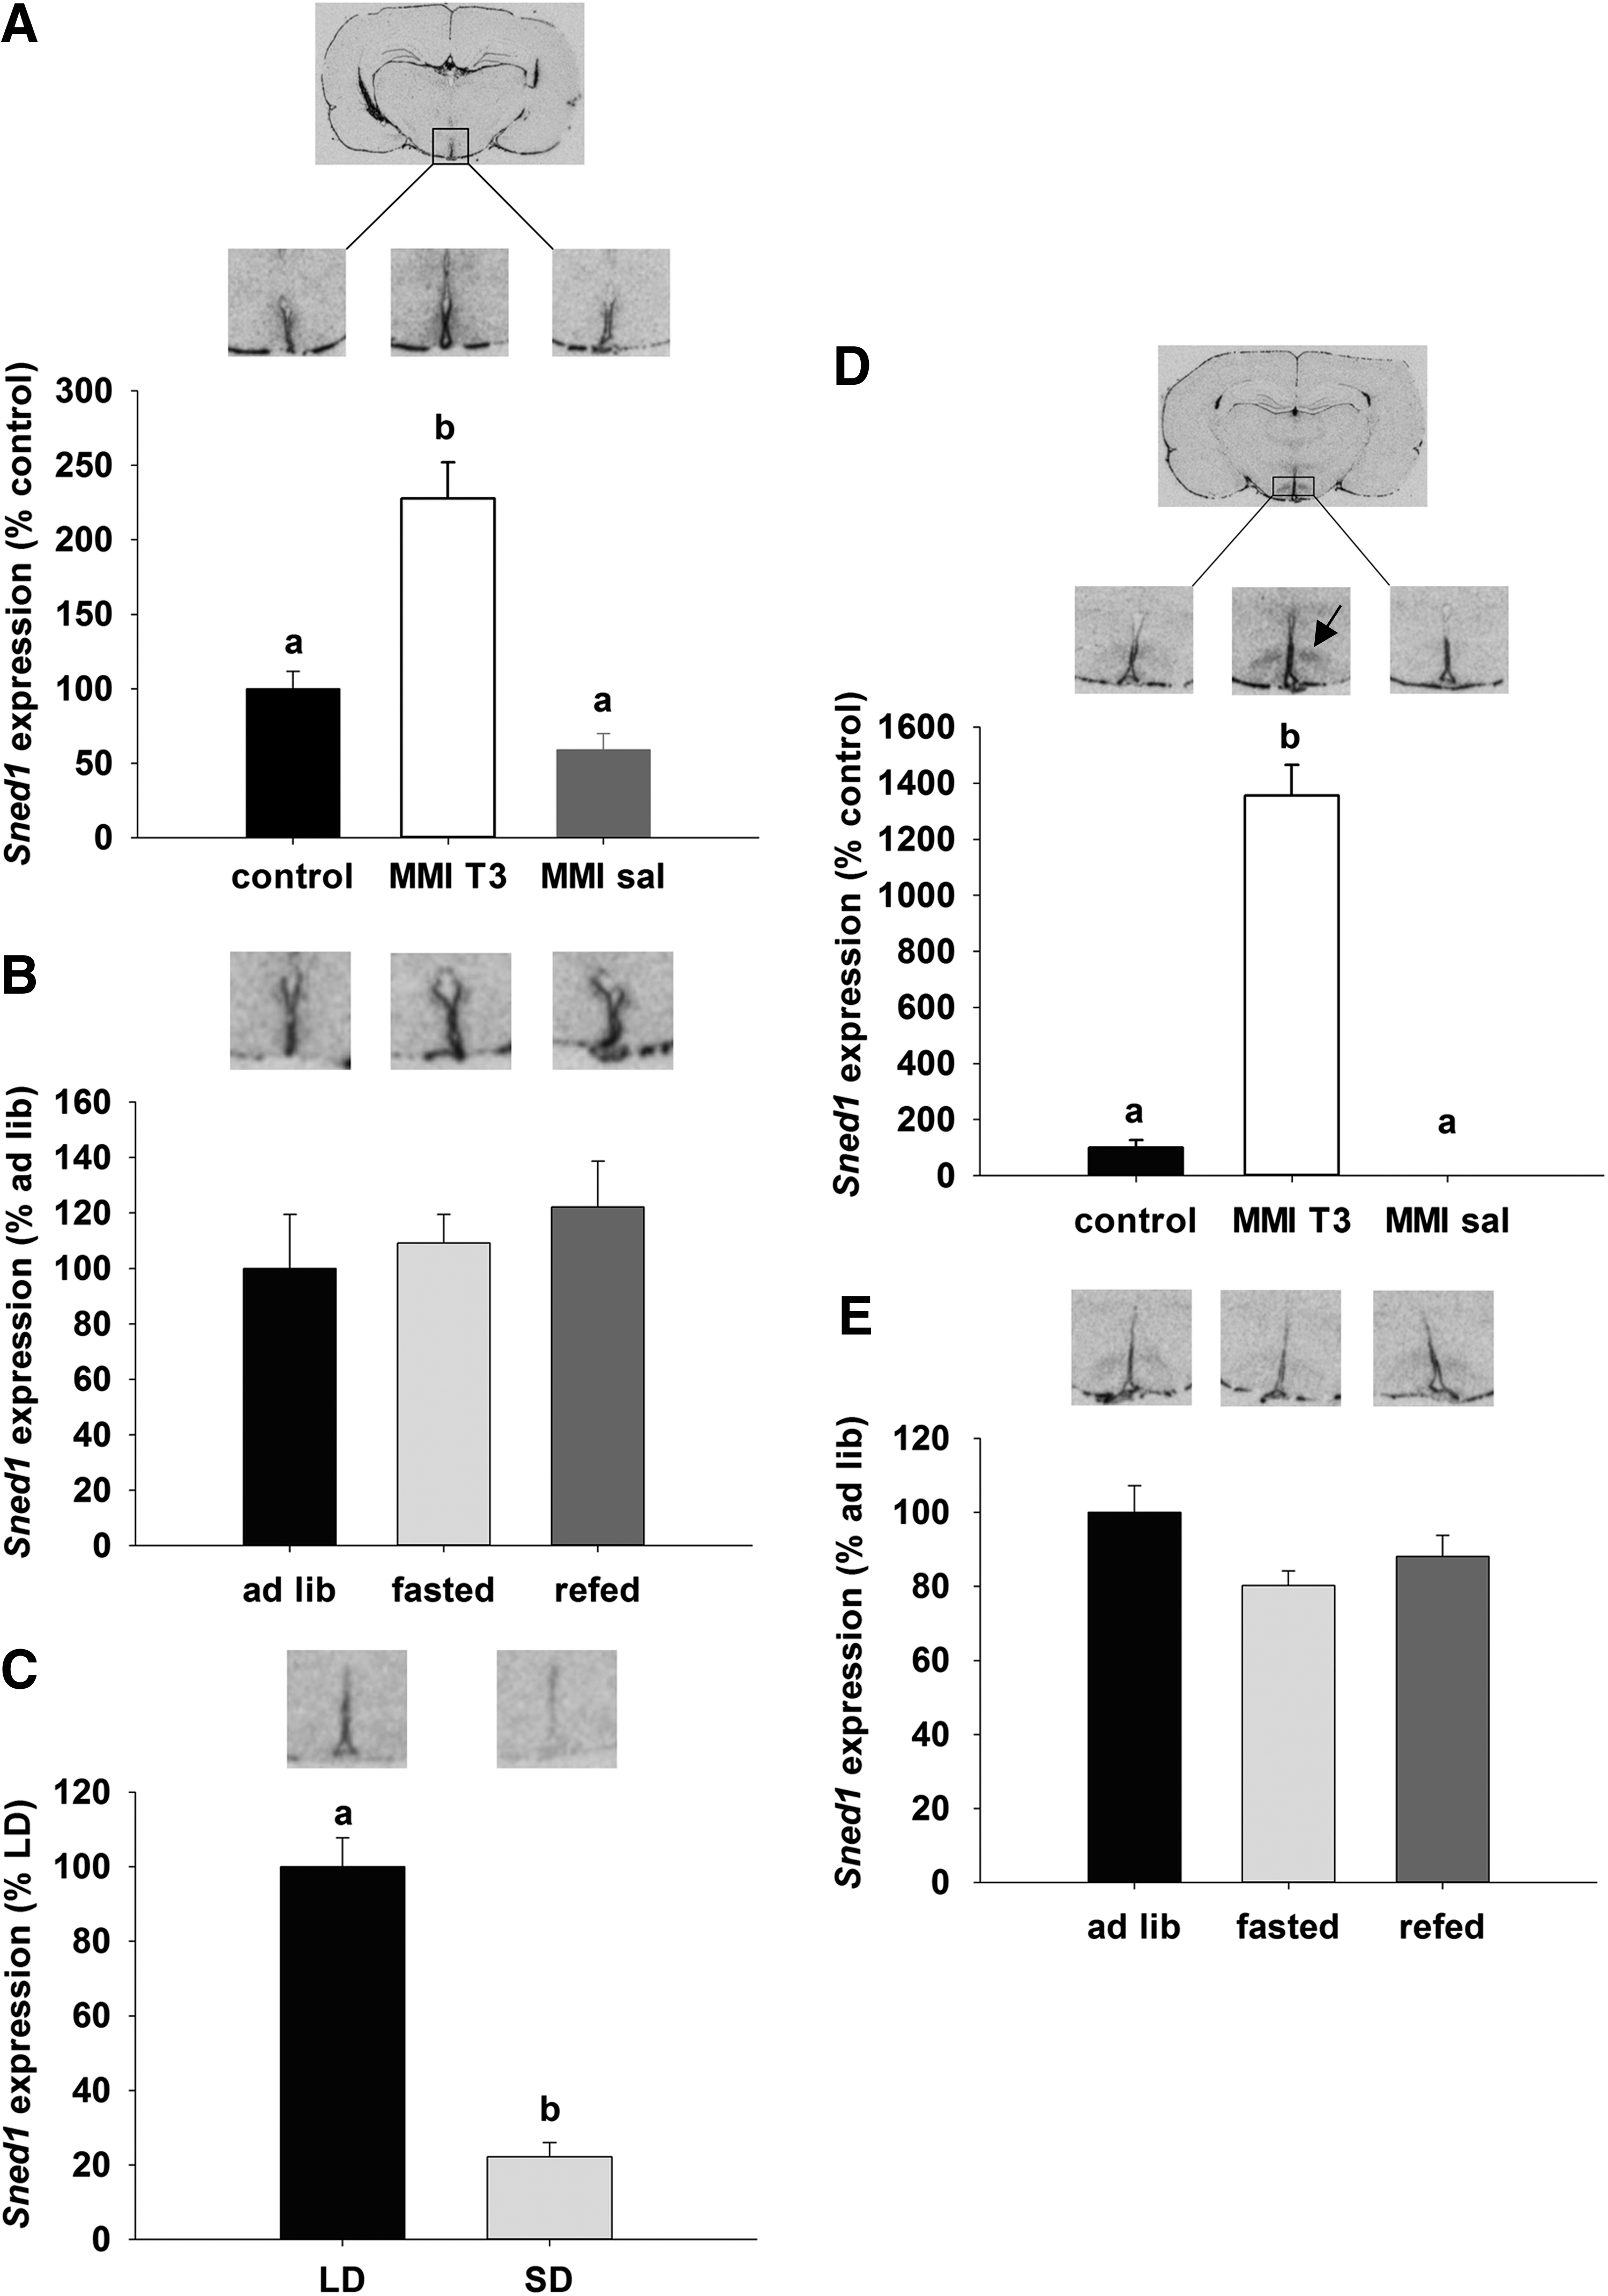
Autoradiographs and quantification of Sned1 gene expression by in situ hybridization. Gene expression of Sned 1 was analyzed in the ependymal layer of the third ventricle (
Among the other candidate genes identified were members of the Wnt signaling pathway. These play a role in axon guidance and stem cell proliferation, including Hairless, which is expressed in the ependymal layer of the third ventricle and ARC. In both the ARC and ependymal cells, Hairless mRNA was increased by sixfold in MMI-T3 animals compared with control (p<0.05) and was undetectable in the MMI-Sal group (Fig. 5A). Hairless mRNA expression in the ependymal layer was not affected by fasting and re-feeding in Sprague Dawley rats (Fig. 5B). In Siberian hamsters, Hairless mRNA expression was restricted to the ependymal layer, where it was 60% higher in the LD compared to the SD state (p<0.001; Fig. 5C).
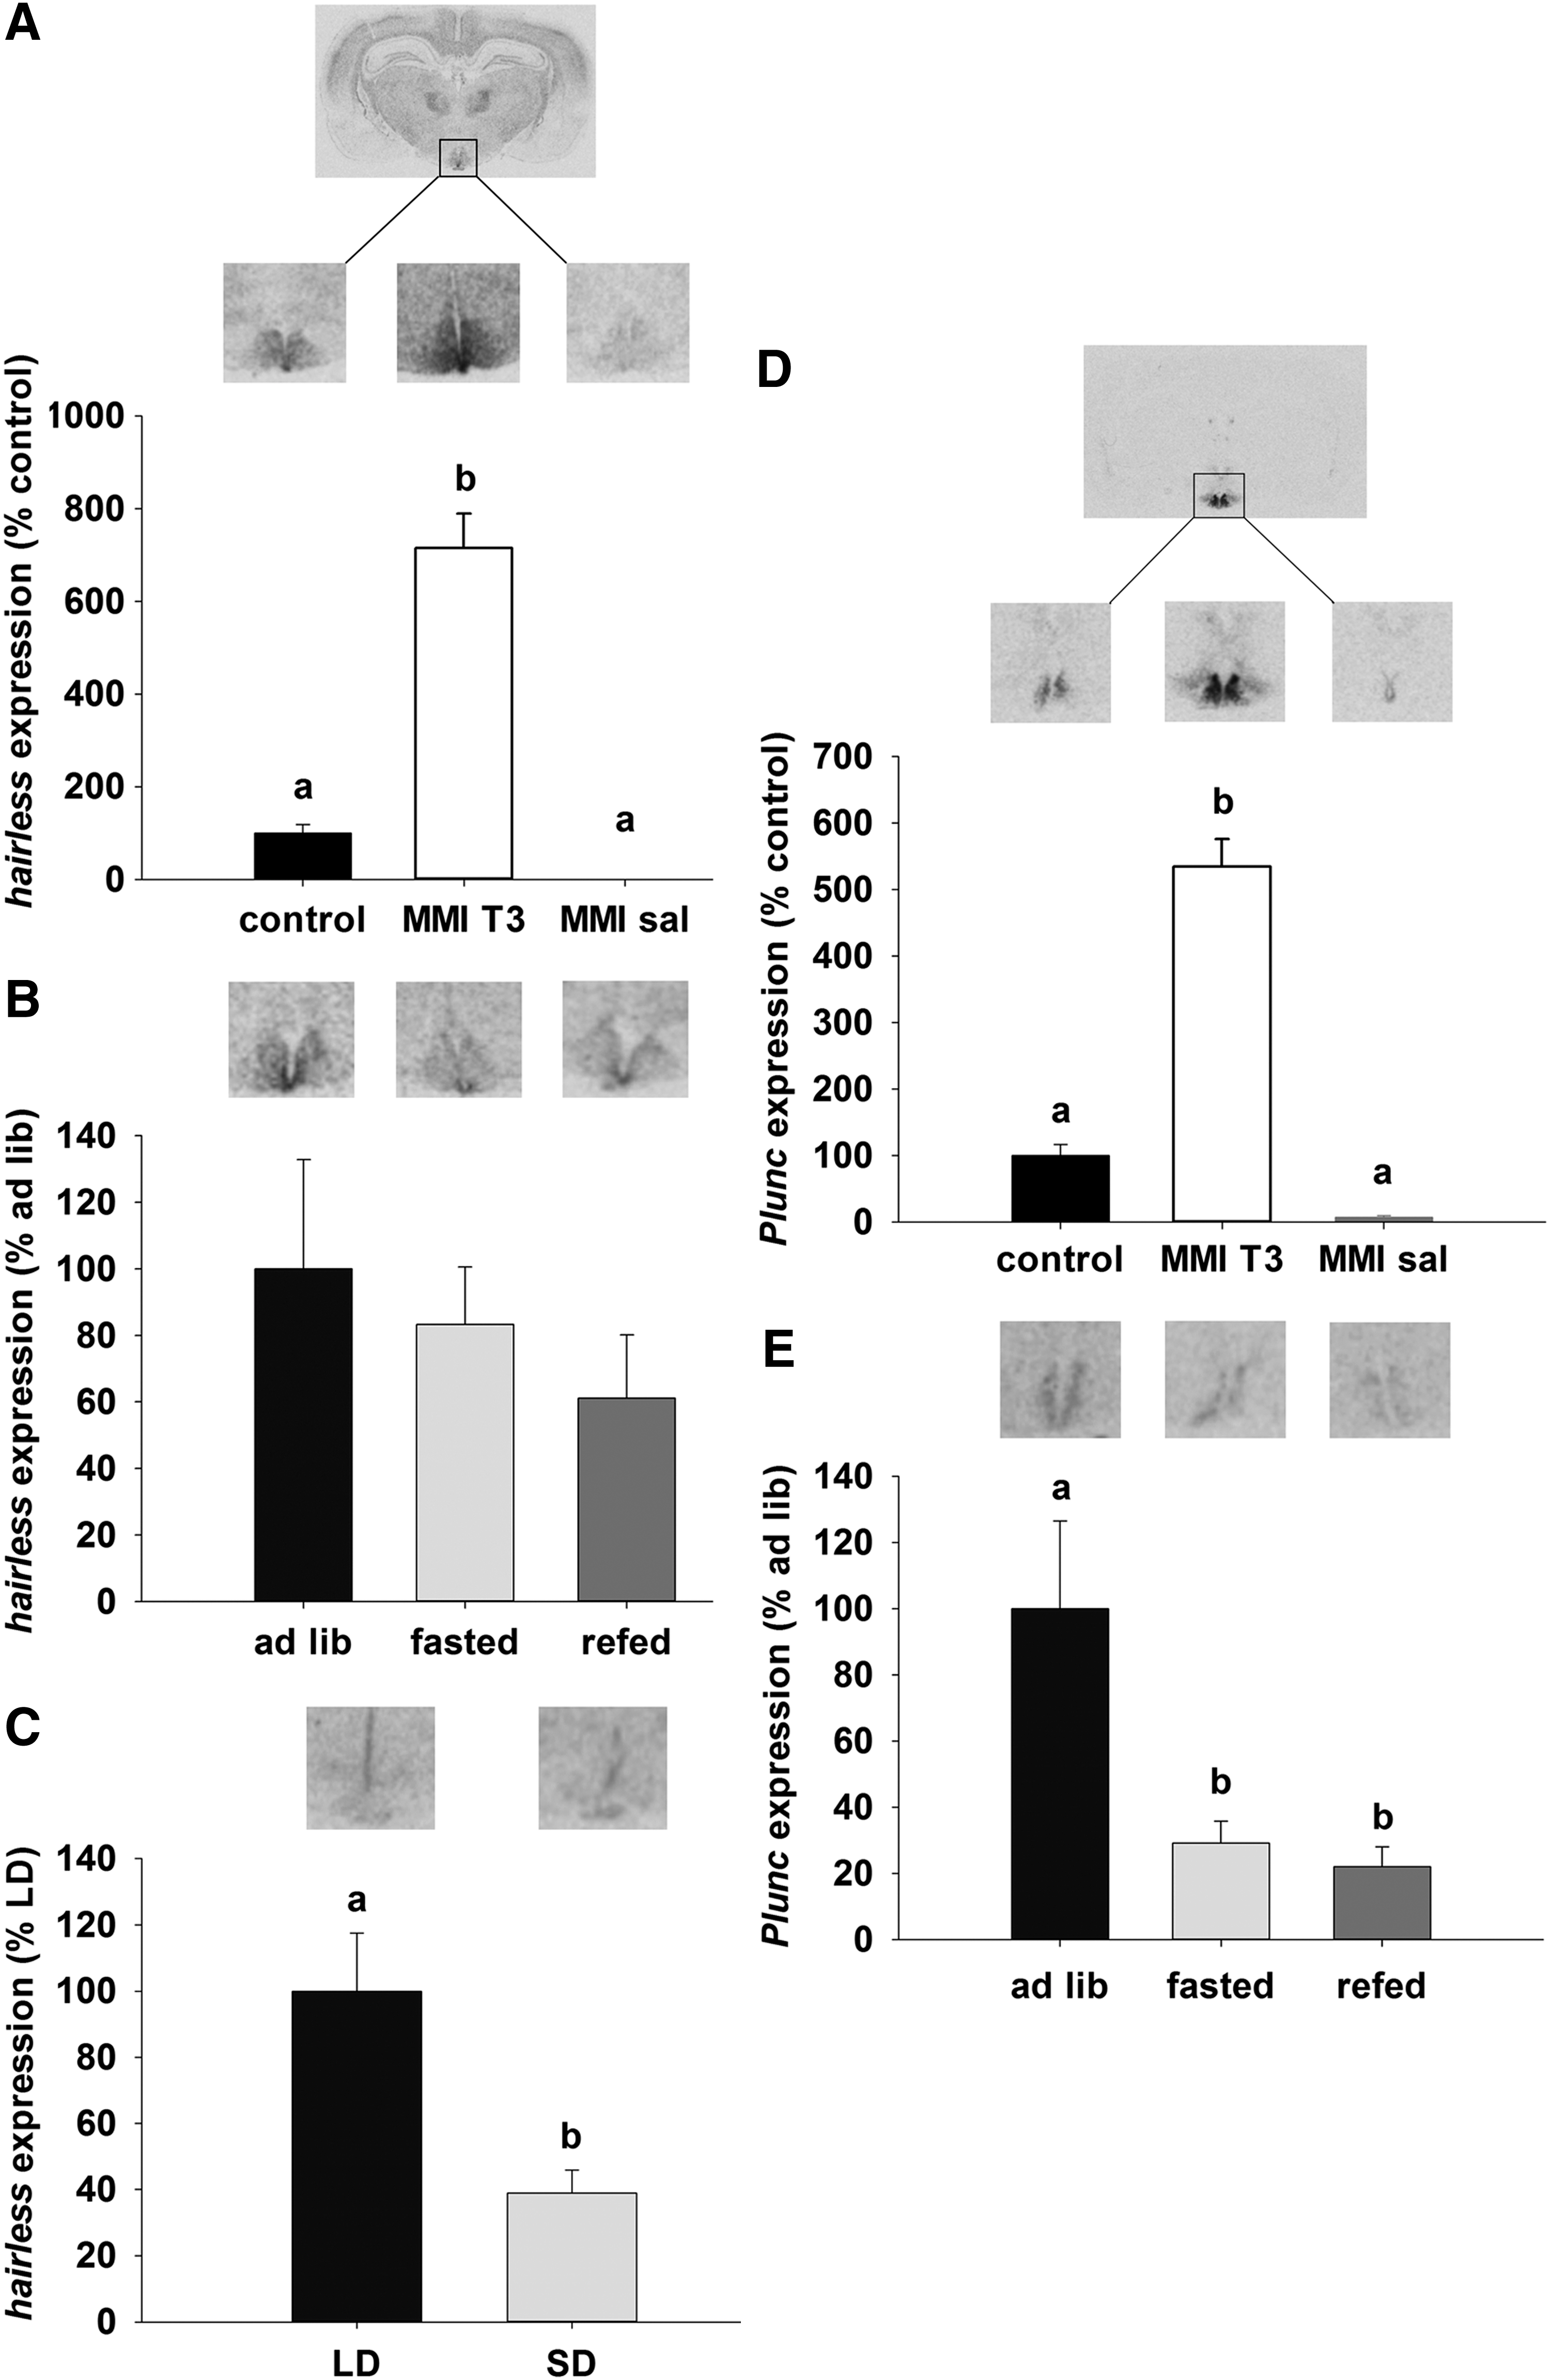
Representative sections and analysis of (
Expression of the Plunc mRNA in the hypothalamus was restricted to the ependymal walls of the third ventricle and the adjacent ARC in rats. Plunc mRNA levels were increased by 4.5-fold after injection of T3 in the MMI-T3 group relative to control (p<0.05) and MMI-sal-treated rats (p<0.05; Fig. 5D) animals. Relative to ad libitum fed rats, fasting decreased Plunc expression by 70% (p<0.05), and mRNA levels remained low (decreased by 80%) even after 24 h re-feeding (p<0.05; Fig. 5E). No Plunc expression was detected in the hypothalamus of Siberian hamsters (data not shown).
Discussion
Many studies have shown that circulating thyroid hormones are involved in the regulation of energy balance and body weight in mammals (7 –9). Over the past decade, evidence has arisen that thyroid hormones not only act in the periphery but may also act in the brain in areas such as the hypothalamus to regulate food intake and energy expenditure (10,28). Although T3 is known to have significant effects on brain development, little is known about its role in the adult brain, particularly within the hypothalamic nuclei where many of the homeostatic control neurons regulating reproduction, food intake, energy expenditure, glucose homeostasis, and thermoregulation are located. Using microarray analysis of gene expression comparing hypothyroid and hyperthyroid states, we have identified potential targets of thyroid hormone action in the adult rat hypothalamus.
MMI decreased food intake and body weight and altered body composition of adult Sprague Dawley rats
Over the course of 22 days, MMI treatment was effective at inducing hypothyroidism, resulting in a 50% decrease in circulating T3, an approximately 80% decrease in circulating T4 concentrations, and substantially elevated circulating TSH levels. Intraperitoneal administration of T3, a model in which elevated T3 levels were measurable 24 hours after injection, had no effect on circulating T4 but corrected circulating TSH concentrations, as anticipated for the regulatory feedback mechanism of thyroid hormone homeostasis (7). Food and water intake (g/100 g and mL/100 g body weight respectively) showed a decline over time, but only food intake was significantly different throughout the treatment, whereas water intake was variable and overall not significantly different by the end of the treatment period. Body weight was profoundly affected by hypothyroidism induced by MMI, consistent with other studies on hypothyroidism in rats (12,42,43). Reduced body weight gain of MMI-treated rats was accompanied by reductions in both lean and fat tissue.
Circulating NEFAs were increased, while triglycerides were decreased, indicative of utilization of lipid as energy substrate. Nonfasted glucose levels at termination were not different between control and treatments, but basal insulin levels were reduced in MMI-treated rats compared with controls, and were not restored within 24 hours after T3 administration.
The reduction in circulating insulin indicates a possible perturbation of glucose homeostasis, and an i.p glucose tolerance test showed impaired glucose clearance. Insulin secretion was also impaired, with the primary effect appearing to be exerted on the first-phase insulin secretion, which occurs within the first 20 min following glucose administration, whereas the secondary phase of insulin secretion, which occurs beyond 20 minutes after glucose administration, was largely unaffected; these responses are features of a diabetic state (44).
MMI treatment and T3 injections affect gene expression in the hypothalamus
The thyroid hormone system in the hypothalamus was affected by the thyroid hormone status of MMI-treated animals, indicative of low central thyroid hormone levels. Dio2 mRNA expression in the tanycytes of the third ventricle was increased in MMI-treated rats by the lower circulating thyroid hormone levels, an effect that can be observed with propylthiouracil (PTU) administration (22). The MMI-induced increase in Dio2 mRNA expression was reversed by T3 administration within 24 hours. The most parsimonious explanation for increased Dio2 mRNA expression is a compensatory response endeavoring to maintain T3 in the hypothalamus and other brain regions at levels required for optimal function. Reduced thyroid hormone levels induced a compensatory response of Trh mRNA expression in the PVN, which was significantly reduced by T3 administration within 24 hours. However, Trh mRNA levels were still significantly elevated relative to euthyroid control rats. One possible reason for this delay in the adjustment of Trh mRNA levels is an insufficient exposure of PVN neurons to circulating T3. This may have arisen because of a possible reduction of T3/T4 transport due to iopanoic acid. Iopanoic acid was used to enhance the state of hypothyroidism by inhibiting deidodinase enzymes. However, it is known that iopanoic acid reduces T4 transport by Oatp1c1, a high affinity T4 transporter (45,46). Whether there is any impact on transport by other primary or secondary T3/T4 transporters is unknown (47). However, Dio3 mRNA expression in the amygdala was elevated in response to exogenous T3, indicating a widespread penetration of T3 in the brain following administration. Another possible explanation is that Dio2 mRNA expression, which was lower (but not to significance), and the high levels of Dio3 mRNA expression in ependymal cells lead to a localized depletion of T3 at the PVN in a hardwired feedback loop between tanycytes and PVN neurons (48). This response, however, serves to illustrate that not all changes in gene expression may have been detected by our approach, and other genes with similar delays in responsiveness to T3 administration may have gone undetected. Dio3 mRNA expression in the ventricular ependymal cells and amygdala was low in euthyroid and MMI-treated rats, but highly elevated in response to T3 administration, consistent with the known activation by T3 (19). Expression of the thyroid hormone transporter Mct8 in the ventricular ependymal cells was decreased, but like Dio2, Mct8 mRNA expression was reversed within 24 hours following T3 administration. These data demonstrate for the first time that T3 regulates the expression of the MCT8 transporter in ependymal cells. This is contrary to the increase observed in the hippocampus of postnatal rat pups in response to T3 depletion by MMI and PTU (49). This also contrasts with the photoperiodic regulation of Mct8 mRNA in the ependymal layer of the third ventricle of the seasonal Siberian hamster where Mct8 mRNA expression increased in the short photoperiod when hypothalamic levels of T3 are decreased (21).
The profound effect of thyroid hormone on body weight and food intake raises the question of whether thyroid hormone levels directly regulate genes that are involved in energy balance. Here, we investigated the expression of principal orexigenic and anorexigenic genes in the arcuate nucleus (ARC); POMC mediates an anorexigenic effect and increased energy expenditure (50 –52), while in contrast NPY-AgRP co-expressing neurons are located in the medial population of ARC neurons and mediate an orexigenic effect and decrease energy expenditure (53 –55).
Previously Diano et al. (22) have shown that Dio2 and hypothalamic T3 levels increased by fasting and are involved in activating Npy mRNA gene expression involving a mechanism that requires mitochondrial UCP2. In our study, no effect of MMI treatment was observed on basal levels of Npy expression. This is consistent with the aforementioned study where Npy mRNA was unchanged in a Dio2 knockout mouse (22). No difference in Pomc mRNA expression was observed, suggesting that the anorexigenic drive in the hypothalamus may be unchanged. MMI treatment did, however, result in decreased Agrp mRNA expression, which was reversed by T3 injection within 24 hours. AgRP acts as an antagonist of the melanocortin MC4 and MC3 receptors and, when administered i.c.v. or overexpressed, it increases food intake leading to obesity (54 –56), while selective ablation in the adult mouse brain confers inappetence (57). Therefore downregulation of Agrp mRNA expression in our experiments, together with unchanged Pomc mRNA expression, could contribute to the body weight phenotype and the reduction observed in food intake of the MMI-treated rats. These are the first data to show a direct effect of T3 on Agrp mRNA expression in a rodent model, and they are consistent with a stimulatory effect of T3 on Agrp expression observed in chickens (58). T3 regulation of Agrp has also been inferred in a reduced growth response to SD photoperiod in F344 rats (59). Thus, the reduction in Agrp mRNA and discoordinated regulation relative to Npy mRNA expression in the hypothyroid rat parallels the reduced Agrp mRNA expression seen in SD photoperiod exposed F344 rat. Consequently, it is possible that a reduction in the drive of the growth hormone axis may be involved in the context of hypothyroidism leading to reduced lean and fat mass.
Genes regulated by thyroid hormone in the adult brain
To screen for novel mechanisms in the brain involving by T3, we analyzed gene expression of hypothalamic tissue using Agilent whole genome microarrays. This approach yielded 85 genes that were upregulated and 25 genes that were downregulated by T3 administration to hypothyroid rats. With the exception of Dio3, we noted that gene expression changes for Dio2, Mct8, Trh, and Agrp were not observed on the array. The reason for this is unclear, and there may be a number of explanations such as T3 replacement does not necessarily substitute for T3 converted from T4 locally within cells, which in our experiments was not restored after T3 administration (60), or that the microarray approach was only sufficiently sensitive to detect changes in the expression of genes with larger differences between the hypothyroid and hyperthyroid states, or that tissues were not taken at an optimal time relative to T3 administration. Nevertheless, several candidate genes, such as those involved in insulin signaling and neurogenesis, were chosen for further investigation based on description, preliminary in situ hybridization data, and recent developments on the potential regulation of tanycytes in hypothalamic regulation of food intake.
Sned1
Sned1 encodes an insulin responsive transcription factor, which activates insulin responsive genes downstream of the PI3K-AKT pathway. In vivo overexpression of Sned1 in peripheral tissues can ameliorate hyperglycemia in diabetes or reproduce diabetes, depending on the tissue in which overexpression is engineered (38 –41). In accordance with the microarray analysis, in situ hybridization revealed an increase of Sned1 after T3 injection in thyroidectomized rats in the ependymal layer. These cells in the ependymal layer will include the specialized glial cells known as tanycytes. In addition to a presence in the ependymal layer, Sned1 is also expressed the ventromedial nucleus where it is also increased by T3 administration. This is the first time that the localization of Sned1 has been described in the brain, and it is interesting to note that the identified areas of the hypothalamus are responsive to insulin or involved in glucose sensing (61,62). This finding may have important implications for the mechanism of glucose sensing and implications for thyroid hormone involvement in glucose homeostasis.
In the Siberian hamster, a model of long-term photoperiodic body weight regulation, Sned1 was expressed in the ependymal layer and found to be higher in LD compared to SD hamsters, when hypothalamic T3 levels are elevated (20), but it was undetectable in the VMN of this species, possibly indicating a species difference in this region. Food deprivation has been shown to upregulate T3 levels in the hypothalamus in rats (22,25). However, no regulation of Sned1 was observed in 48 hour food-deprived and re-fed rats. This might indicate that short-term regulation of mechanisms involved in food intake and energy homeostasis might engage different mechanisms than for longer-term regulation.
Hairless
Hairless encodes for a transcriptional regulator associated with thyroid hormone receptors and involved in the Wnt signaling pathway, playing a role in axon guidance and stem cell proliferation. Hairless has been described to be directly regulated by thyroid hormone in the developing brain of neonatal rats (63) and has been shown to increase Wnt signaling and thereby cell proliferation, by repressing Wise, an inhibitor of the Wnt pathway (64). A recent study has identified HAIRLESS as a histone demethylase whose target genes include those involved in transcription regulation, the cell cycle, and neural activity (65). The potential role in neurogenesis is relevant to energy balance in the context of the recent discovery for neuronal progenitor role of hypothalamic tanycytes, which proceed to differentiate to neurons expressing appetite regulatory peptides (66,67). In our experiment, Hairless was strongly upregulated after T3 injection in the ependymal layer of the third ventricle. In Siberian hamsters, Hairless expression was increased in the LD state, when T3 synthesis by ependymal cells of the hypothalamus is highest and therefore could relate to possible plastic changes in the hypothalamus, including cell proliferation and adult neurogenesis across the seasons (68). However, Hairless mRNA expression was not affected by fasting and re-feeding in Sprague Dawley rats, a difference that may reflect long- and short-term regulation of energy balance or hypothalamic plasticity.
Plunc
Palate, lung, and nasal epithelium carcinoma associated protein (PLUNC) encodes a secretory protein that has been described in the epithelia of the conducting airways in humans and mammals (69). The PLUNC proteins are part of the lipid transfer/lipopolysaccharide binding protein (LT/LBP) family, whose members PLTP, CETP, BPI, LBP, and PLUNC bind a variety of lipid substrates. Expression of Plunc mRNA was found within the neuropil of the ARC when expression was induced by T3. Plunc mRNA expression decreased in the subependymal layer upon fasting. This appears counter-intuitive, given that fasting induces a rise in hypothalamic T3 levels (22,25) and Plunc mRNA expression did not recover within 24 hours of re-feeding. This suggests a regulatory mechanism other than T3 is likely to be involved in the response of this gene to fasting. The role of PLUNC remains unidentified, but as a secreted protein with surfactant activity (68), expressed in the subependymal layer, a possible role for PLUNC in the hypothalamus may be related to the location of expression next to the third ventricle with access to cerebrospinal fluid. No Plunc mRNA expression was found in the Siberian hamster, which reveals either a species difference in the requirement for this protein or the function of PLUNC may be assumed by an alternative protein.
In conclusion, we have shown that hypothyroidism has a profound effect on growth. In addition to the impact on the thyroid hormone sensing mechanisms via changes in thyroid hormone deiodinases and TRH, we also found that mRNA expression for the thyroid hormone transporter Mct8 is subject to regulation by T3 in rodents. In addition, for the first time in rodents, we show that expression of Agrp, a key component of the recognized hypothalamic energy balance homeostatic mechanism, can be regulated by T3. Microarray analysis of RNA extracted from the hypothalamus of hypothyroid versus hyperthyroid-T3-treated rats revealed hypothalamic genes that are regulated by T3. These genes require further investigation to understand their role at the interface between the input pathway of T3 and output pathways via the central nervous system, neuroendocrine axes, or other aspects of neurophysiology. Three genes identified and assessed in this study—Sned1, Hairless, and Plunc—were found to be altered by T3 in the hypothalamus and in in vivo models where the neuroendocrine axis is challenged by fasting or the environmental parameter of photoperiod exposure.
Footnotes
Acknowledgments
This work was supported by PIEF-GA-2009-235106 Marie Curie individual fellowship and HE 6383/1-1 Emmy-Noether fellowship to Annika Herwig and further funding from the Scottish Government Rural and Environment Science and Analytical Services Division. We thank Jenny Morris and Pete Hedley of the Genome Technology group, James Hutton Institute, Dundee, for help in scanning the Agilent arrays, Dana Wilson for laboratory assistance, and Vivian Buchan and Donna Henderson for analysis of serum concentrations of glucose, NEFAs, and triglycerides.
Author Disclosure Statement
The authors have nothing to declare.