
Abstract
Background:
Risk stratification in medullary thyroid cancer (MTC) has traditionally relied on standardized anatomic staging systems that, despite providing valuable prognostic information, do not adequately predict the risk of persistent or recurrent disease. As dynamic risk stratification has been demonstrated to be clinically valuable in nonmedullary thyroid cancer, we adapted our response to therapy definitions in order to apply them to MTC. In this study, we evaluate and compare the clinical utility of our previously proposed MTC response to therapy stratification with a traditional standardized anatomic staging system.
Methods:
Both the Tumor, Node, Metastasis/American Joint Cancer Committee (TNM/AJCC) staging system and our previously proposed response to initial therapy staging system was evaluated in 287 MTC patients followed for a median of five years.
Results:
The TNM/AJCC staging system provided adequate risk stratification with regard to disease-specific mortality and the likelihood of having no evidence of disease at final follow-up, but did not adequately stratify patients with regard to the likelihood of having structural persistent disease, biochemical persistent disease, or recurrence. However, the response to initial therapy risk stratification system provided clinically useful risk stratification with regard to disease-specific mortality, the likelihood of having no evidence of disease at final follow-up, the likelihood of having a biochemical persistent disease at final follow-up, and the likelihood of having structural persistent disease at final follow-up. Furthermore, the response to therapy risk stratification system demonstrated a higher proportion of variance explained (54.3%) than the TNM/AJCC system (23.9%).
Conclusion:
Our data demonstrate that a dynamic risk stratification system that uses response to therapy variables to adjust risk estimates over time provides more useful clinical prognostic information than static initial anatomic staging in MTC thyroid cancer.
Introduction
R
Multiple studies have now demonstrated that these initial risk estimates can be substantially modified when calcitonin and carcinoembyronic antigen (CEA) doubling times are used as response to therapy endpoints, which either increase or decrease the initial static risk estimates (3 –8). Furthermore, clinicopathologic features such as the preoperative calcitonin and CEA levels (9 –14), the presence of vascular invasion, and the extent of lymph node involvement can provide valuable estimates of persistent/recurrent disease (11 –13,15 –24). For these reasons, the American Thyroid Association and National Comprehensive Cancer Network guidelines recommend augmenting initial anatomic staging with postoperative calcitonin and CEA levels as response to therapy variables to guide clinical management and ongoing risk stratification (25,26).
In differentiated nonmedullary thyroid cancer (NMTC), risk stratification has evolved to an active, ongoing process whereby clinical data accumulated during follow-up are used to modify initial risk estimates (27 –31). When risk is estimated as a dynamic ongoing process, the proportion of variance explained by the staging systems is as high as 62–84%, indicating that the risk predictions are much more likely to be accurate and reliable than when using static initial anatomic staging systems (27,30). Since response to therapy can be assessed as early as six months postoperatively, this risk stratification system provides valuable prognostic information even before the calcitonin and CEA doubling time can be reliably calculated.
To facilitate accurate, effective communication of clinical status (response to therapy) during follow-up, we proposed and validated a nomenclature to describe response to therapy in NMTC (32). At each follow-up visit, patients can be characterized as either (a) excellent response/remission when they have no biochemical or structural evidence of disease, (b) indeterminate response when there are nonspecific imaging or biochemical findings, (c) biochemical incomplete response when they have abnormal tumor markers in the absence of structural disease, or (d) structural incomplete response when they have structurally identifiable disease regardless of the status of their tumor markers. These clinical outcomes are used to modify initial risk estimates and guide ongoing management. Furthermore, these categories are not static, as individual patients may change response to therapy category as new data is accumulated during follow-up (31).
In order to make the response to therapy evaluations applicable to MTC, we modified the specific definitions for excellent, biochemical incomplete, and structural incomplete response to therapy to accommodate calcitonin and CEA (rather than thyroglobulin [Tg] as was used in the nonmedullary response to therapy definitions) (1). As demonstrated in Table 1, our review of the literature suggested that an early response to therapy assessment within the first postoperative year would provide valuable insights into likely clinical outcomes. Unlike NMTC, a substantial number of deaths were seen in long-term follow-up of excellent and biochemical incomplete response patients (nearly always associated with rapid calcitonin and CEA doubling times) (1).
Data from Tuttle and Ganly 2013 (1).
Recurrence was defined as new evidence of disease after a period of no evidence of disease. Patients with an incomplete response are classified as having persistent disease and not “recurrence.”
CEA, carcinoembyronic antigen.
In this study, we evaluate and compare the clinical utility of our previously proposed MTC initial response to therapy stratification with a traditional standardized anatomic staging system in a cohort of patients with MTC evaluated and treated at our medical center.
Materials and Methods
Patients
After obtaining institutional review board approval, we retrospectively reviewed the electronic medical records of 360 patients with MTC evaluated at the Memorial Sloan–Kettering Cancer Center (MSKCC) between July 1973 and July 2013. Patients were included if all of the following conditions were met: (a) pathologically confirmed MTC; (b) adequate clinicopathologic information for risk stratification; and (c) minimum of one year of follow-up after the initial treatment (unless one of the clinical endpoints was reached before such point). In total, 287 patients with confirmed MTC and adequate data with respect to initial staging and follow-up were included in the study.
Laboratory studies
Calcitonin and CEA values were measured with a wide variety of assays over the years the patients were evaluated. For response to therapy stratification, calcitonin values were considered as undetectable based in functional sensitivities of 2 pg/mL in 41% of the cases, 5 pg/mL in 12.5%, and 16 pg/mL in 17.5% of the cases.
Risk stratification
Patients were first stratified according to the Tumor, Node, Metastasis/ American Joint Cancer Committee (TNM/AJCC) staging system for MTC (7th edition) (33) as summarized below: • Stage I: intrathyroidal tumor ≤2 cm; • Stage II: intrathyroidal tumor >2 cm, or any size with minor extrathyroidal extension; • Stage III: tumor of any size with metastases in pretracheal, paratracheal, prelaryngeal, or Delphian nodes (N1a) without invasion of major structures in the neck (T4a and T4b excluded); • Stage IVa: local invasion into subcutaneous soft tissues, larynx, trachea, esophagus, or recurrent laryngeal nerve, or any size tumor with lateral neck (N1b) or superior mediastinal node metastases; • Stage IVb: very advanced local disease invading prevertebral fascia or encasing carotid artery or mediastinal vessels; • Stage IVc: distant metastases present.
All cases were then stratified regarding response to therapy, as previously described (1) and as shown in Table 1. For such stratification, the nadir calcitonin and CEA measured within the first year after the initial treatment were used as the best response to initial therapy.
Follow-up
Patients received the standard of care therapy following the usual MSKCC risk-adapted management approach. Calcitonin and CEA levels were measured at each visit (usually every 6–12 months). Imaging studies such as neck ultrasound (US); contrast-enhanced computed tomography of the neck, chest, and abdomen (with a liver protocol); magnetic resonance imaging of the abdomen and the axial skeleton; and positron emission tomography–computed tomography (PET-CT) were performed based on risk stratification, changes in tumor markers, and preference of the attending physicians. Image-guided biopsy was performed whenever necessary to confirm metastases or to rule out other primary malignancies when there was discrepancy between biochemical and imaging findings.
Definition of final outcome
At final follow-up, patients were considered to have no evidence of disease (NED) if they had an undetectable calcitonin, CEA within the reference range, and no structural evidence of disease. Those with detectable calcitonin or CEA above the reference range without structurally identifiable disease were considered as biochemical persistent disease. If cross-sectional imaging or functional studies identified any structural disease, patients were classified as structural persistent disease. Recurrence was defined as new biochemical or structural evidence of disease after a period of NED. Patients dying with large volume or rapidly progressive MTC were considered to have died from disease.
Statistical analysis
Data are presented as means and standard deviations with median values. Analysis was performed using SPSS Statistics for Windows v19.0 (IBM Corp., Armonk, NY). For the proportion of variance explained (PVE) analysis, a receiver operating characteristic curve was used to categorize the groups, then a univariate regression was performed to calculate the parameters for the analysis, which was done using the Omega Squared formula. The McNemar test was also used to assess differences between the risk stratification systems. Survival curves and the log-rank test were generated using the Kaplan–Meier method. A p-value of <0.05 was considered as significant.
Results
The demographics, clinicopathologic features, stratification, and final outcomes of the 287 MTC patients followed for a median of five years (range <1 to 33 years) included in this study are summarized in Table 2. As would be expected in a cancer center cohort of MTC, the median age at diagnosis was 52 years, 80% were sporadic, more than 50% had locoregional lymph node metastases at presentation, and 18% had distant metastases identified within six months of diagnosis. Given the large percentage of patients with N1 and M1 disease, it is not surprising that an excellent response to initial therapy was seen in only 27%, while 35% had biochemical evidence of persistent disease without a structural correlate and 38% had structural persistent disease identified in the first postoperative year. At final follow-up, 26% of the cohort had died of thyroid cancer with only 21% alive without evidence of disease.
SD, standard deviation; MTC, medullary thyroid carcinoma; AJCC, American Joint Cancer Committee.
Consistent with previous studies, the AJCC staging system provided important risk stratification with regard to disease-specific mortality and the likelihood of being NED at final follow-up (see Table 3). Disease-specific mortality ranged from 2% in Stage I to 40% in Stage IV, while the likelihood of being NED at final follow-up fell from 71% in Stage I to 3% in Stage IV. However, the AJCC system did not adequately risk stratify with regard to the likelihood of having biochemical persistent disease or structural/biochemical recurrence.
Eight patients who could not be classified by the AJCC system due to incomplete information were not included.
The AJCC staging system also provided important risk stratification information with regard to the best response to initial therapy (see Table 4). AJCC Stage I patients had the highest likelihood of achieving an excellent response to initial therapy (80%) and lowest likelihood of having a structural incomplete response to initial therapy (2%). Conversely, patients with AJCC Stage III or Stage IV disease were far less likely to achieve an excellent response to initial therapy (10% and 6% respectively) and far more likely to have a structural incomplete response to therapy (32% Stage III, 61% Stage IV).
Eight patients who could not be classified by the AJCC system due to incomplete information were not included.
The best response to initial therapy categories also provided important clinical prognostic information (see Table 5). Patients demonstrating an excellent response to initial therapy are very likely to remain NED (78%), but may experience a biochemical (15%) or structural (4%) recurrence during follow-up, rarely (3%) leading to death from disease. Conversely, patients with a structural incomplete response have a disease-specific mortality of 56% over a median of five years of follow-up, with the surviving patients demonstrating either biochemical only (8%) or structural and biochemical (36%) evidence of persistent disease. The biochemical incomplete response is associated with an intermediate risk of death (11%) and usually persistent biochemical evidence of disease without structural correlate (51%) or persistent structural disease (37%). Only one patient (1%) with biochemical incomplete response was classified as NED at final follow-up.
Because we were surprised by the higher than expected disease-specific mortality rate in the biochemical incomplete response cohort (11/102 patients), we further evaluated the additional risk factors associated with each case (see Table 6). The majority of patients were AJCC Stage III or IV with nadir calcitonin values that were quite high, suggesting that they probably had structural disease that was not identified using the imaging modalities employed or available at the time of their evaluation. Calcitonin doubling times were available in six patients and were less than two years in patients 1, 5, 10, and 11 and more than two years in patients 7 and 8. Patients 10 and 11 appear to represent the unusual cases of very aggressive MTC that demonstrated rapid structural progression within months of initial diagnosis despite being initially classified as AJCC Stage I or II.
NA, not available.
Kaplan–Meier survival curves generated for both staging systems are presented in Figure 1. As confirmed by the log-rank test, the response to therapy curves differ significantly (p<0.0001), and the patients classified as structural incomplete response had much lower survival rates. Disease-specific survival rates at 5, 10, and 20 years were 100%, 95%, and 87.1% for the excellent response group, respectively; for the biochemical incomplete, they were 96.3%, 94.7%, and 82.6%; and for the structural incomplete group, survival rates were 51% at five years, 36.4% at 10 years, and 8.1% at 20 years.
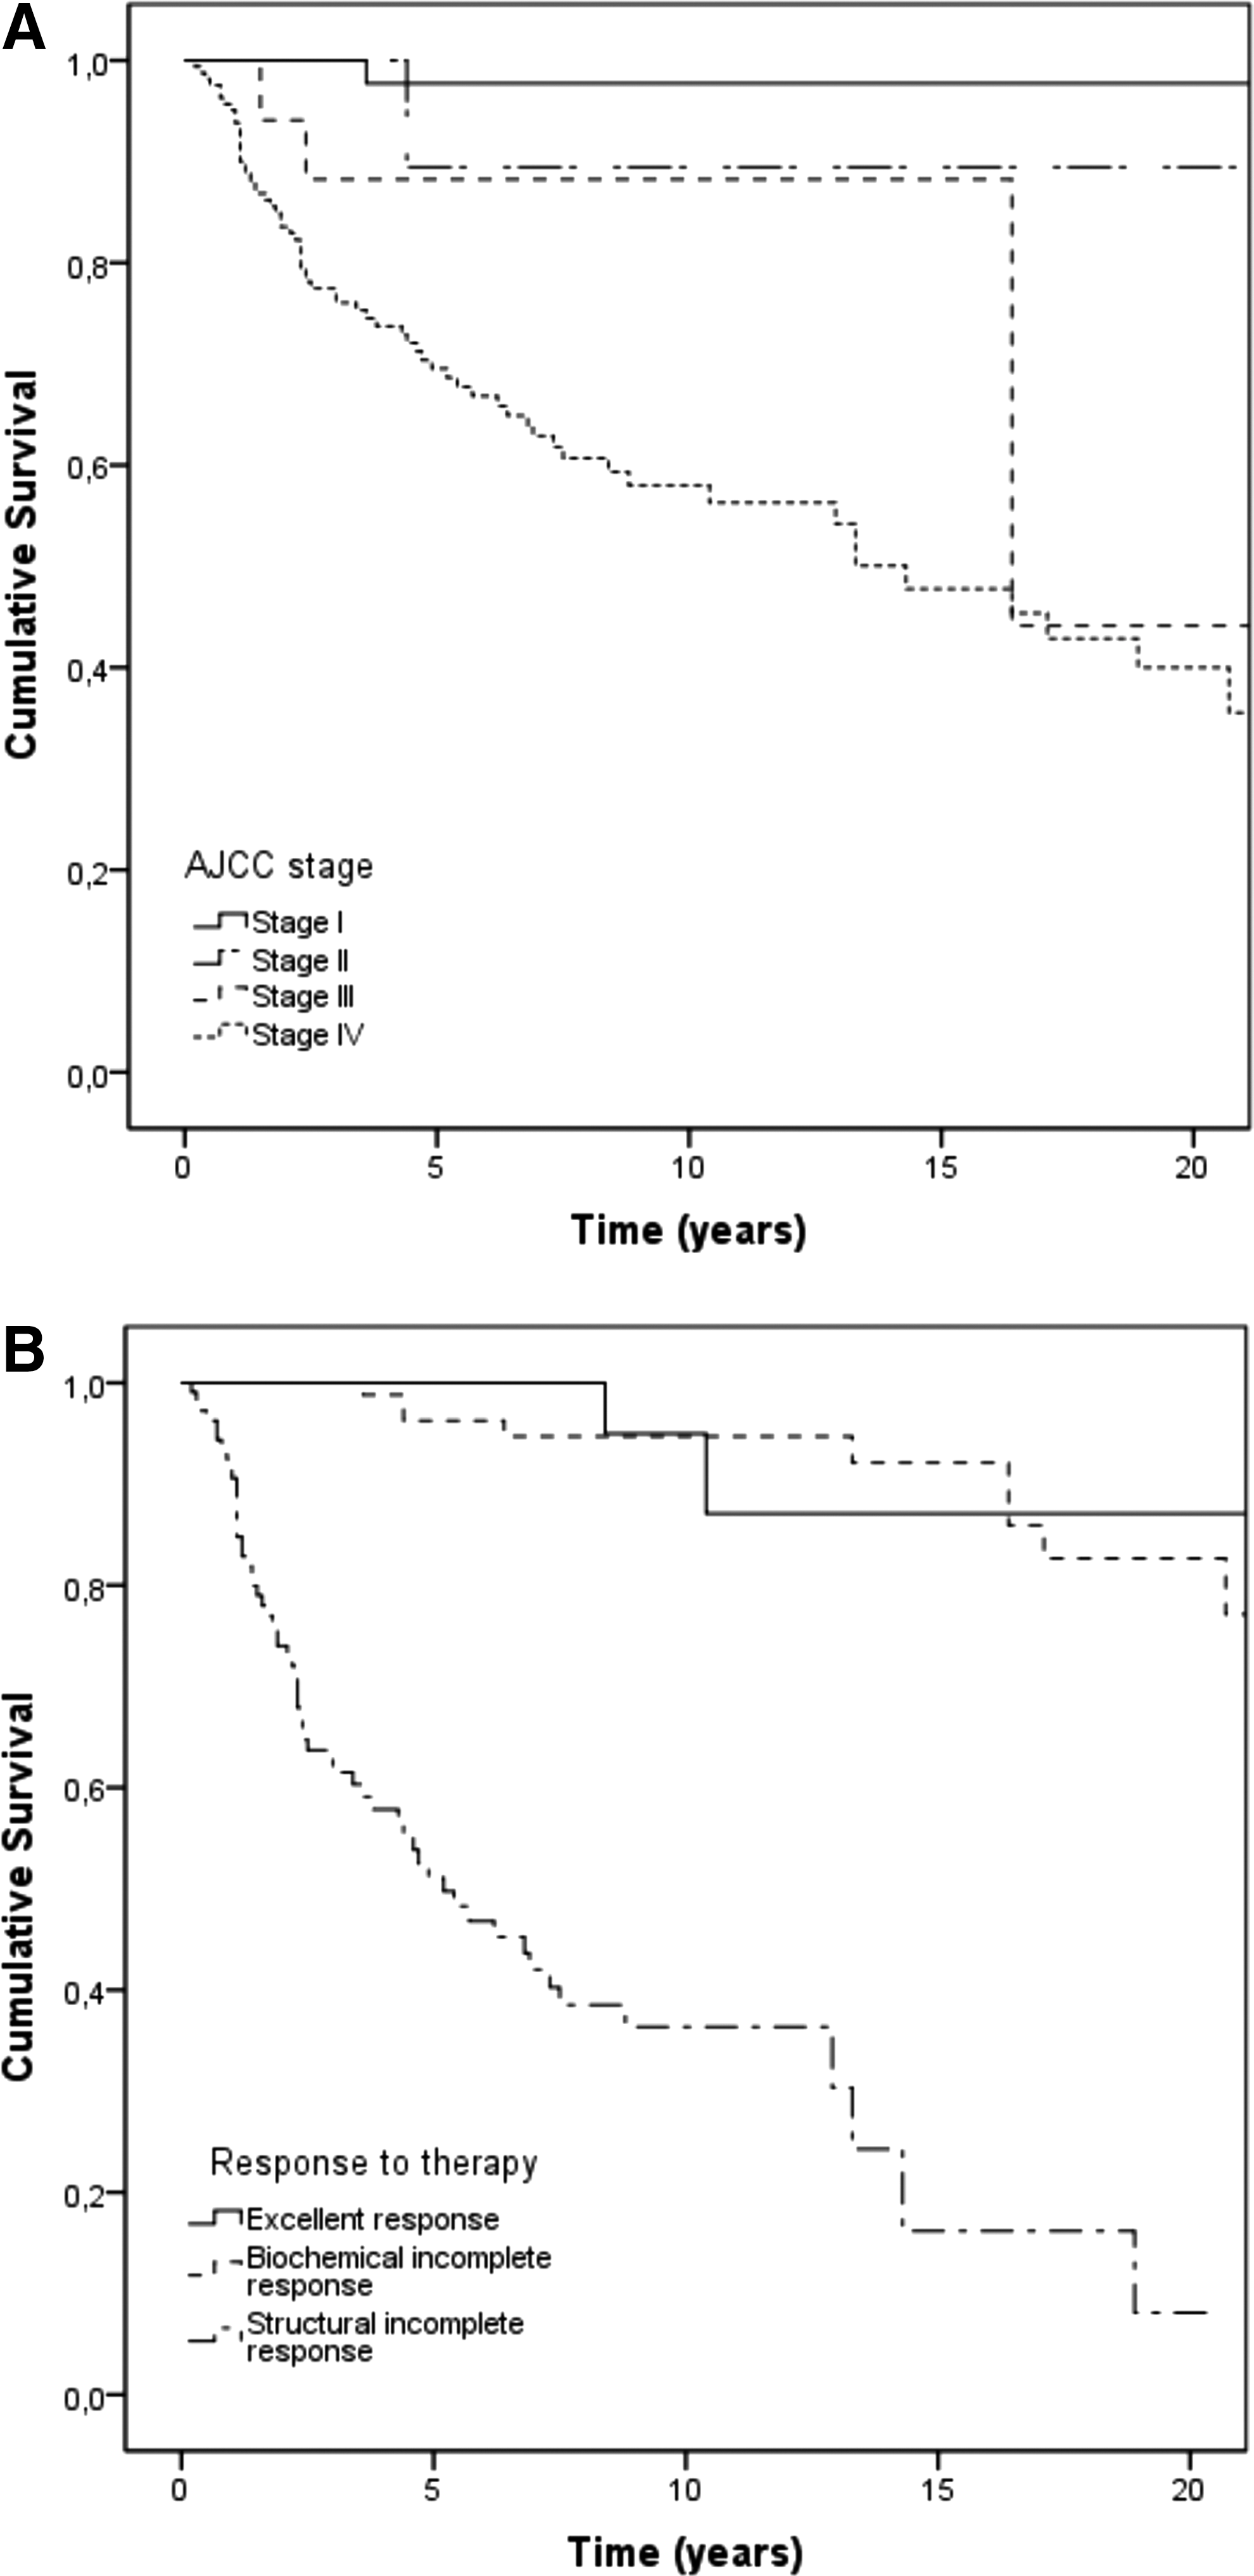
Kaplan–Meier survival curves for (
The ability of both the AJCC system and the response to therapy re-stratification system to predict the clinical outcome (NED vs. recurrent/persistent disease) was also assessed by determining the PVE, which was 23.9% for the AJCC and 54.3% for the response to therapy system. In addition, a comparison of the stratification by both systems confirmed they are statistically different (p=0.004).
Discussion
Consistent with our findings in NMTC, a dynamic risk stratification system that uses response to therapy variables to adjust risk estimates over time provides more useful clinical prognostic information than static anatomic staging. In our study, the response to therapy system showed a greater PVE in predicting important clinical outcomes than the AJCC system (54.3% vs. 23.9%). We demonstrate that cross-sectional imaging studies and serum calcitonin/CEA values obtained within the first year of initial therapy can be used to modify the initial risk estimates provided by anatomic staging. We expect that additional adjustments of risk will be required as follow-up continues, utilizing primarily calcitonin and CEA doubling times to modify risk estimates in the early years of follow-up further.
Furthermore, the nomenclature (excellent, biochemical incomplete, or structural incomplete response) that has been successfully used to characterize response to therapy and predict clinical outcomes in NMTC also proves to be valuable in MTC. While we had planned for an indeterminate response to therapy category as we had used in NMTC, we were able to classify all the patients confidently in this series as excellent, biochemical incomplete, or structural incomplete. However, we will continue to keep this category in our staging system, as it seems likely that an occasional patient may have findings that do not discretely fit into the other three categories. Additionally, in NMTC, low-level stimulated Tg values were classified as indeterminate. Since we did not have stimulated calcitonin values on any of our patients, none of the patients was classified as indeterminate on biochemical grounds.
It is important to acknowledge that the best response to initial therapy will be dependent not only on whether the patient has developed distant metastases prior to initial surgery and the biological behavior of the tumor, but also on the completeness of the surgical resection when the disease is confined to the neck. This will be dependent both on proper, risk-adapted preoperative anatomical imaging and on the experience and skill of the surgeon to identify and remove all gross disease appropriately. We can reasonably expect that the lowest rates of structural incomplete response and highest rates of biochemical incomplete and excellent response would be seen in patients evaluated and treated by an experienced management team.
Limitations of this study include the use of different calcitonin assays over time, with different sensitivities, and the use of imaging studies that evolved during the past years. As structural and functional imaging became more sensitive over time, it is likely that some patients previously thought to have biochemical persistent disease would now be classified as having a structural incomplete response.
However, some interesting and important differences in clinical outcomes are seen in the excellent and biochemical incomplete response outcomes when comparing MTC with NMTC. In the NMTC setting, there were no disease-specific deaths over more than 10 years of follow-up in patients classified as having an excellent or biochemical incomplete response to therapy (27,28,32). Conversely, in MTC, a disease-specific mortality of 3% was seen in the excellent responders and, consistent with previous studies (1,15,34,35), a biochemical incomplete response to therapy was associated with a low, but significant, 11% disease-specific mortality rate. The differences in the mortality rates between MTC and NMTC patients classified as having either excellent or incomplete response to therapy probably reflects both differences in the sensitivity of the tumor markers for disease detection and the sensitivity of imaging studies to detect structural disease, which differ markedly between MTC and NMTC. Furthermore, differences in outcomes could also be related to the underlying biology and natural history of the disease in which MTC often behaves in a more aggressive fashion than NMTC. In NMTC, serum Tg assays with functional sensitivities of 0.2 ng/mL coupled with the relative ease of identifying metastatic disease (neck US, radioactive iodine scans, chest cross-sectional imaging, FDG PET scanning) result in a relatively high rate of detection of low-level disease, making it less likely that a patient classified as having either an excellent or biochemical incomplete response would be harboring a significant volume of undetected metastatic disease. As a consequence, determination of when a patient has an excellent or biochemical incomplete response to therapy is more prone to error in MTC than in NMTC cancers. Therefore, we would expected higher “recurrence” rates in MTC excellent responders and possibly high mortality rates in the biochemical incomplete responders who were inappropriately classified as not having biochemical or structural evidence of disease, respectively, on the basis of our current tools that have suboptimal sensitivity and specificity for disease detection.
Since we view risk stratification as an ongoing process, the response to therapy classification of patients can change over time. For example, the few excellent responders that subsequently died of their disease were reclassified as biochemical/structural incomplete responders during follow-up. Moreover, all of the biochemical incomplete responders that eventually died of disease were reclassified during follow-up as structural incomplete responders. It is important to remember that nearly all patients with a structural incomplete response will have abnormal calcitonin and CEA values and therefore could also be considered to have a biochemical incomplete response as well. But by convention, we have restricted the term “biochemical incomplete response” to refer only to those patients demonstrating abnormal calcitonin and/or CEA without structurally identifiable disease. Therefore, we see the initial response to therapy assessment as just the “next step” in risk stratification that builds on the initial anatomic staging and is likely to be further modified as additional tests are obtained in the future.
In patients that achieved an excellent response to therapy, the rate of disease recurrence in our series (4%) is consistent with structural recurrence rates in previous studies, which usually range from <1% to 8.5% (17,35 –39). This is probably a reflection of relatively small sample sizes and the selection bias of more aggressive cases to be referred to cancer centers such as ours. While the relatively poor functional sensitivity of the calcitonin assay may contribute to the higher than expected recurrence rate in patients that went into remission (excellent response), the recurrence risk is still about 5% even if an undetectable pentagastrin stimulated calcitonin value is used as the definition of remission (15). In addition to the 4% of patients who had structural disease recurrence, an additional 15% of excellent responders develop measurable calcitonin levels at some point during follow-up and could contribute to more structurally identifiable disease over longer periods of follow-up.
Among the patients with a structural incomplete response to initial therapy, all had persistent disease at the time of final follow-up (8% with only biochemical evidence of disease and 92% with structural evidence of disease). These data suggest that if a patient does not have a complete response to appropriate initial therapy, there is a lower expectation that (s)he will be cured by other additional treatments performed throughout the follow-up. This does not mean that such a patient should not undergo further therapy for locoregional control or symptom relief, but that whenever considering any treatment, potential benefits should be cautiously weighed against the morbidity that could be caused by an intervention. In line with this, Kebebew et al. previously published that locoregional reoperation in patients with residual MTC rarely results in biochemical cure, although it can limit MTC progression in selected patients (40).
From a practical standpoint, when evaluating a new patient with MTC, we first stratify with the traditional anatomic staging system TNM/AJCC or a simplified anatomic approach (intrathyroidal, regional metastases, or distant metastases). Also, we attempt to estimate the likelihood that the planned surgical approach will result in an excellent response to therapy based on variables known to be associated to prognosis, such as preoperative calcitonin and CEA levels, primary tumor size and extension, lymph node involvement, and stage of disease (1,11 –13,15,19,35,41). This initial approach can guide initial management and expectations. In the first year of follow-up, we carefully assess the response to initial therapy, and use that information to modify and individualize the risk estimates and therefore plan the frequency of medical visits, lab testing, and the need for additional imaging studies. As follow-up continues, we continue to integrate the accumulated clinical data (particularly the calcitonin and CEA levels and doubling-times) into revised risk estimates that are used to plan long-term follow-up (3,5 –7).
Footnotes
Acknowledgments
We thank Cléber P. Camacho for help with the statistical analysis. S.C.L. holds a PhD fellowship from São Paulo State Research Foundation—FAPESP (09/50575-4).
Author Disclosure Statement
The authors have nothing to disclose.