
Abstract
Background:
Differentiation of orbital fibroblasts into mature adipocytes and subsequent accumulation of adipose tissue has been shown in the progression of Graves' orbitopathy (GO). Autophagy is involved in adipogenesis, but little is known about the role of autophagy in the initiation and progression of GO. The aim of this study is to investigate the role of autophagy in the pathogenesis of GO.
Methods:
Orbital adipose/connective tissue explants from patients with GO and from normal subjects, as well as isolated orbital fibroblasts, were analyzed. Adipogenesis was induced using differentiating medium with or without hydrogen peroxide, and autophagy was manipulated using bafilomycin A1 and Atg5-targeted short hairpin RNA (shRNA). Autophagosomes were identified by electron microscopy. Expression of autophagy-related genes and adipogenesis-related transcription factors were analyzed by real time reverse transcription-polymerase chain reaction and/or Western blot analysis. Lipid droplet accumulation was examined by Oil Red O staining.
Results:
Autophagic vacuoles were more abundant in GO cells than in non-GO cells (p<0.05). Expression of autophagy-related genes was significantly higher in GO tissues and cells than in their non-GO counterparts, respectively. Interleukin-1β increased LC3-II, p62, and Atg7 protein in GO cells. Autophagosome accumulation was shown at day 4 of adipogenesis and decreased by day 10, along with lipid droplet formation. Expression of LC3 and p62 proteins increased within 48 hours of differentiation and diminished gradually from day 4 to 10. Bafilomycin A1 treatment and Atg5 knockdown by shRNA inhibited lipid droplet accumulation and suppressed expression of adipogenic markers.
Conclusions:
Autophagy was increased in GO tissue and cells compared to non-GO tissue and cells, suggesting that autophagy plays a role in GO pathogenesis. Autophagy manipulation may be a therapeutic target for GO.
Introduction
G
Autophagy is a major cellular degradation process (6 –8) initiated by the emergence of a double-membrane structure in the cytoplasm that expands to engulf and sequester a portion of the cytoplasm, resulting in the formation of the hallmark double-membrane autophagosome. Fully mature autophagosomes translocate toward and fuse with lysosomes, where the autophagosome cargo is released and degraded. A morphologic analysis using electron microscopy shows an increased level of autophagosomes during 3T3-L1 cell differentiation (9). Subsequent research has elucidated the autophagy machinery at the molecular level, and various genetic mouse models have been developed to study the functional role of autophagy genes in adipogenesis (10 –12). Atg5, which conjugates with Atg12, is specifically required for the maturation of the autophagic membrane (10), and Atg5 deletion blocks normal adipocyte differentiation, suggesting a critical role of autophagy in adipogenesis (11).
However, no study has investigated the association between autophagy and GO pathogenesis. In this study, we investigated whether autophagy is activated in the pathogenesis of GO in an in vitro adipogenesis model. We analyzed differentiating orbital fibroblasts morphologically using electron microscopy (EM) with and without an autophagy flux inhibitor. The autophagy machinery was elucidated at the molecular level during the adipogenesis of GO orbital fibroblasts. We also inhibited autophagy using Atg5-specific short hairpin RNA (shRNA) transfection to investigate the impact of autophagy inhibition on GO pathogenesis.
Materials and Methods
Reagents
Oil Red O was purchased from Sigma-Aldrich, Inc. (St. Louis, MO). Dulbecco's modified Eagle's medium (DMEM), fetal bovine serum (FBS), penicillin, gentamycin were purchased from Hyclone Laboratories, Inc. (Logan, UT). Bafilomycin A1 was purchased from Sigma-Aldrich. An anti-p62 antibody was obtained from BD Biosciences (San Jose, CA). Anti-LC3B-I/II, anti-beclin-1 and Atg7 antibodies were obtained from Cell Signalling Technology (Boston, MA), and anti-Atg12-Atg5 conjugate antibodies were obtained from Novus Biologicals (Littleton, CO). Anti-peroxisome proliferator activator gamma (PPARγ), anti-CCAAT enhancer-binding protein (C/EBP)-α, anti-C/EBPβ, and anti-β-actin antibodies were all obtained from Santa Cruz Biotechnology (Santa Cruz, CA).
Tissue culture and Oil Red O staining
Orbital tissue explants were obtained from seven patients with GO undergoing surgical decompression for severe proptosis and from six control individuals with no history of GO or autoimmune thyroid disease. Explants were primarily cultured as previously reported (13). The protocol for obtaining orbital adipose/connective tissue was approved by the Institutional Review Board of Severance Hospital, and written informed consent was obtained from all patients. Cultures were maintained in DMEM with 10% FBS, penicillin (100 U/mL), and gentamycin (20 μg/mL). Cells were observed under an Axiovert light microscope and photographed with an Olympus BX60 light microscope. Procedures for adipocyte differentiation and lipid droplet examination were performed as described previously (13,14).
Western blotting
Western blotting was carried out according to a standard protocol (13). Cells were lysed in a buffer containing 20 mM HEPES, 10% (v/v) glycerol, 10 mM Na3VO4, 50 mM NaF, 1 mM phenylmethylsulfonyl fluoride, 0.1 mM dithiothreitol, 1 μg/mL leupeptin, 1 μg/mL pepstatin, and 1% (v/v) Triton X-100 (Sigma-Aldrich) on ice for 30 minutes and then centrifuged for 10 min at 12,000g. The samples were subjected to sodium dodecyl sulfate-polyacrylamide gel electrophoresis (SDS–PAGE), transferred to polyvinylidened difluoride membranes, and probed with the indicated antibodies. The proteins were visualized using an enhanced chemiluminescence kit and exposed to x-ray film (Amersham Pharmacia Biotech, Piscataway, NJ). The intensity of each band was quantified by densitometry using the Image J software.
Orbital adipose tissue mRNA expression for autophagy marker genes
Total RNA (1 μg) was isolated and reverse-transcribed into complementary DNA (cDNA) according to the manufacturer's instructions. The resulting cDNA was amplified on the ABI 7300 real-time polymerase chain reaction (PCR) thermocycler (Applied Biosystems, Carlsbad, CA) using TaqMan universal PCR master mix and PCR conditions recommended for assessing gene transcript levels quantitatively in tissue samples. All PCR were performed in triplicate. The catalog numbers of primers were Hs00797944_s1 for MAPILC3B, Hs01076567_g1 for MAPILC3A, Hs00169468_m1 for Atg5, Hs01061917_g1 for p62/SQSTM1 mRNA expression, and H299999905_m1 for glyceraldehyde-3-phosphate dehydrogenase. All samples were normalized to the values of glyceraldehyde-3-phosphate dehydrogenase. Results were expressed as threshold cycle (Ct) fold change relative to the control group using the 2-ΔΔCt method (15). Data were only analyzed if the Ct was less than 35. Results from five GO samples were compared with the mean results from the three normal samples.
Autophagosome imaging and quantification by EM
The preadipocyte or differentiating cells were fixed with a solution of 2.5% glutaraldehyde at indicated differentiation time points, followed by incubation with 0.5% glutaraldehyde buffered with 0.1 M sodium phosphate (pH 7.4) for 24 hours at 4°C. The cells were then dehydrated with ethanol at 4°C, immersed in a 1:1 mixture of propylene oxide and Epon, and embedded in Epon by polymerization at 60°C for 48 hours. Ultra-thin sections were collected on EM grids and observed using a JEOL 1200EX transmission electron microscope.
For EM quantification, the volume fraction, the fraction of the cellular volume occupied by the autophagic compartments was estimated by stereology (10,11,16,17). The cellular volume fraction of autophagic vacuoles was estimated on pellet profiles within randomly selected grid squares using point counting with square lattice grids. Point counts over cells were obtained using a grid with 1.68 mm spacing on photographic negatives taken at a 400×magnification, covering the whole grid squares. All autophagic vacuoles found in this area were photographed at a 12,000×magnification, and point counts obtained using a grid with 2.5 mm spacing. A minimum of 20 cells profiles, from 3 to 5 grid squares for each sample was included in the analysis. Volume ratio of autophagosomes to cytosol was measured in each five different GO and non-GO samples. Statistical significance was estimated using Student's t test.
Autophagic flux inhibition and Atg5 knockdown
During autophagosome formation, the LC3-I isoform is converted into LC3-II, which is the only known protein that specifically associates with autophagosomes and not with other vesicles and is thus correlated with the number of autophagosomes. P62 is a common autophagosome cargo protein, and its degradation reflects the degree of autophagy flux. We used bafilomycin A1, an inhibitor of autophagosome-lysosome fusion (18), to inhibit autophagy flux in our cells. Early passages of GO and non-GO preadipocyte orbital fibroblasts were seeded into six-well plates, and the cells were treated with 10 nM bafilomycin A1 for various durations. The experiments were performed in four GO cells and three non-GO cells isolated from different patient samples, and the samples were assayed in duplicate.
To determine the impact of autophagic flux inhibition on adipogenic differentiation, GO fibroblasts were treated in adipocyte differentiation medium containing 10 nM bafilomycin A1 for an initial 48 hours before switching to maintenance medium. Adipogenic differentiation was assessed using Oil Red O staining and protein contents of autophagic and adipogenic markers were measured. The experiments were performed in three GO cells isolated from different patient samples (n=3).
Autophagy was inhibited by shRNA-mediated knockdown of Atg5, which is required for LC3-II formation (19) (sc-41445-V; Santa Cruz Biotechnology). Cells were placed in a 12-well plate and were approximately 50% confluent on the day of infection. Media was replaced with 1 mL of 5 μg/mL of Polybrene®(sc-134220, Santa Cruz Biotechnology), and cells were infected with Atg5-targeted shRNA lentiviral particles. Nonspecific shRNA was applied as a control according to the instructions of the manufacturer (sc-108080, Santa Cruz Biotechnology). On day 3, culture medium was removed and replaced with 1 mL complete medium without Polybrene, and cells were incubated overnight. To select stable clones expressing the shRNA, cells were split into 1:3, incubated an additional 24 hours, and selected using Puromycin dihydrochloride (sc-108071, Santa Cruz Biotechnology). Lentiviral particles with up to five distinct expression constructs were utilized for transduction. Transduction efficiency at the end of puromycin selection exceeded 96%, as determined by the number of GFP-positive cells. Stable shRNA knockdown of Atg5 was verified by Western blotting. The experiments were performed in three GO cells isolated from different patient samples (n=3), and the samples were assayed in duplicate.
Following infection, cells were exposed to a differentiation protocol for 10 days and lysed. Total protein was collected at days 0, 4, 7, and 10. To confirm Atg5 protein knockdown and autophagy inhibition, Western blotting was done for Atg5 and LC3-I/II proteins, respectively. Oil Red O stains and Western blotting of PPARγ and C/EBPα proteins were also performed.
Statistical analysis
All experiments were performed in at least three cells isolated from different GO or non-GO patient samples, and the samples were assayed in duplicate. Means and standard deviations were calculated from the normalized values for each mRNA and protein measured in at least three samples harvested from different individuals. Comparisons of data between cell groups or within cell groups at different times were analyzed with a t-test or analysis of variance (ANOVA) using SPSS software package for Windows, version 12.0.1 (SPSS Inc., Chicago, IL). A p value of <0.05 was considered significant.
Results
Autophagy increased in GO orbital tissue and cells
Relative mRNA expression of LC3B, Atg5, and p62 were higher in GO (n=5) than in non-GO tissues (n=5; Table 1). The mean values of 2-ΔΔCt values from real-time PCR data of all genes in GO tissues were significantly higher than those in non-GO tissues (p=0.016 for LC3B, p=0.035 for Atg5, and p<0.001 for p62). All gene levels were constantly low in all non-GO tissues. Of the 5 GO tissues, sample number 5 showed relatively low expression of all autophagy genes probably due to a moderate severity and low clinical activity score (Table 1). The exophthalmos value was 18 mm in both eyes and the clinical activity score was 0 at the time of decompression in the patient of tissue sample number 5. The other four patients showed an exophthalmos of more than 21 mm and the clinical activity was 2–3. The variability of gene expression levels is probably a reflection of the clinical activity of the disease.
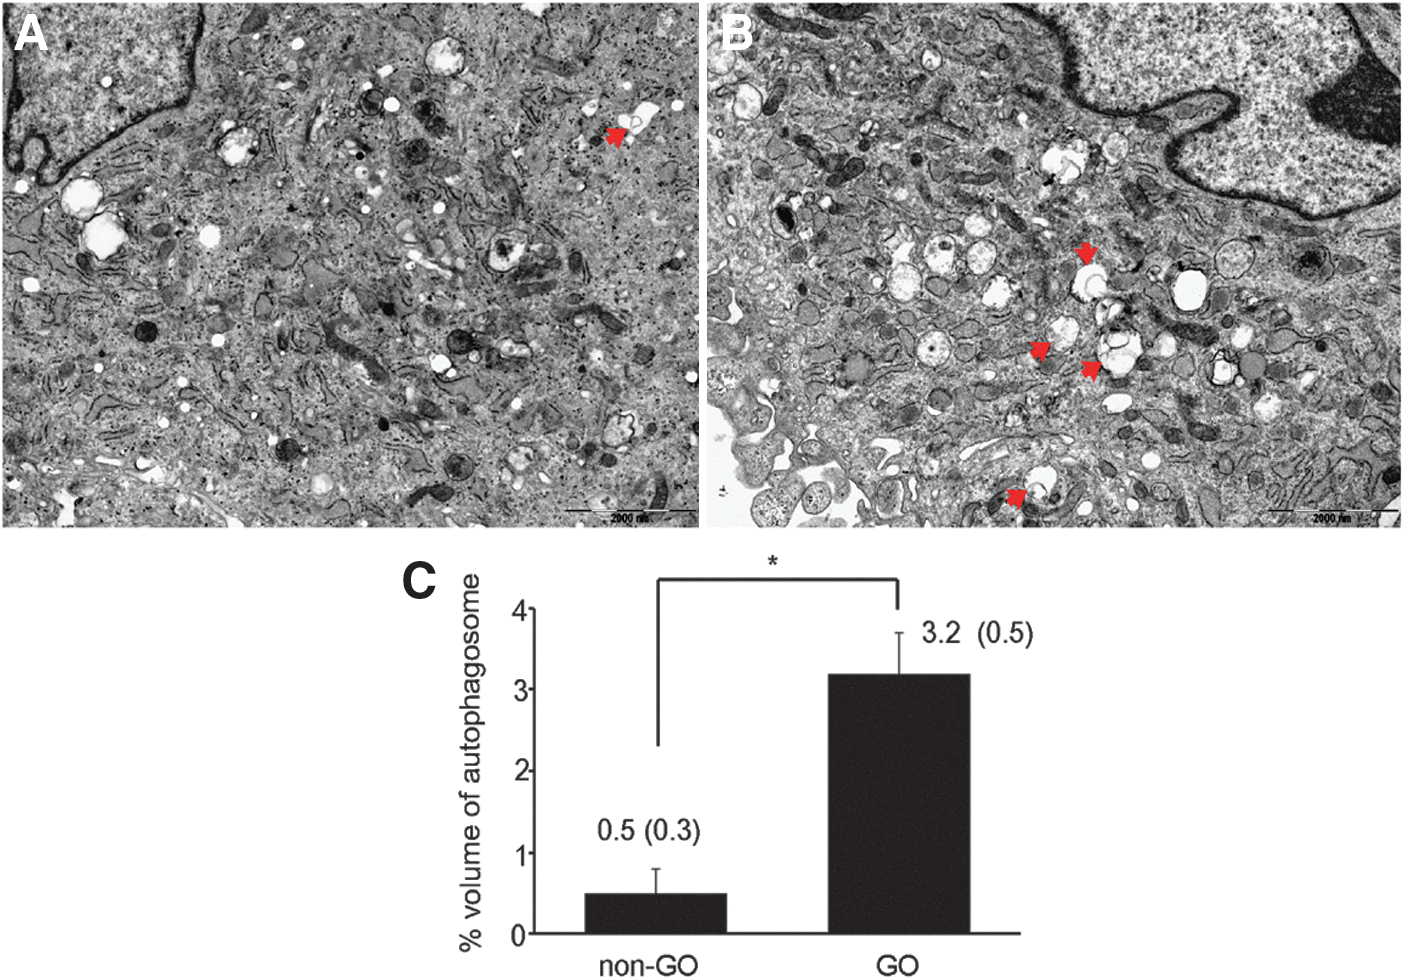
We analyzed autophagosome formation using EM in semi-confluent GO (n=5) and non-GO cells (n=5) at passage 3 without adipogenic stimuli. The degree of autophagy was assessed using unbiased stereological techniques that estimate the fraction of the cell volume occupied by autophagic vacuoles. Double membrane structured autophagic vacuoles were more evident in GO cells than in non-GO cells (Fig. 1A). The fraction of the cellular volume occupied by the autophagic compartments was measured in each five different GO and non-GO samples. The volume fraction of autophagosome was significantly higher in GO cells (3.2±0.5%) than in non-GO cells (0.5±0.3%; Fig. 1B).
Morphologic
Bafilomycin A1 significantly increased the expression of LC3-II, p62, and Atg12-Atg5 conjugate protein in a time-dependent manner in both GO and non-GO cells, but did not change expression of beclin-1 and Atg7 (Fig. 2). Quantification by densitometry, normalized to the level of β-actin is shown in Figure 2B and 2C.

Expression of autophagy-related proteins after bafilomycin A1 treatment. Semi-confluent GO and non-GO cells at passage 3 were treated with bafilomycin A1 (10 nM) for the indicated durations (0, 3, 6, and 24 hours). LC3-I, LC3-II, p62, Atg12-Atg5 conjugate, beclin-1, and Atg7 were assayed by Western blot analysis in four GO and three non-GO cell cultures isolated from different patient samples, and the samples were assayed in duplicate. Representative blots
Interleukin-1β–activated autophagy in GO cells
Interleukin (IL)-1β increases production of hyaluronan and proinflammatory cytokines, and stimulates adipogenesis in orbital fibroblasts of Graves' patients (13,14,20 –22). We have previously demonstrated that protein and mRNA levels of IL-1β were all significantly expressed at a higher level in GO tissues than non-GO tissues (22). We examined whether IL-1β was involved in the initiation of autophagy in GO cells and non-GO cells. IL-1β (10 ng/mL) increased protein expression of LC3-II, p62, and Atg7 in GO cells and LC3-II and p62 in non-GO cells in a time-dependent manner (Fig. 3). The experiments were performed in four GO cell cultures and three non-GO cell cultures isolated from different patient samples, and the samples were assayed in duplicate. Quantification of LC3-II, p62, Atg7 in GO cells and LC3-II, p62 in non-GO cells normalized to the level of β-actin was performed by densitometric analysis (Fig. 3B and 3C).
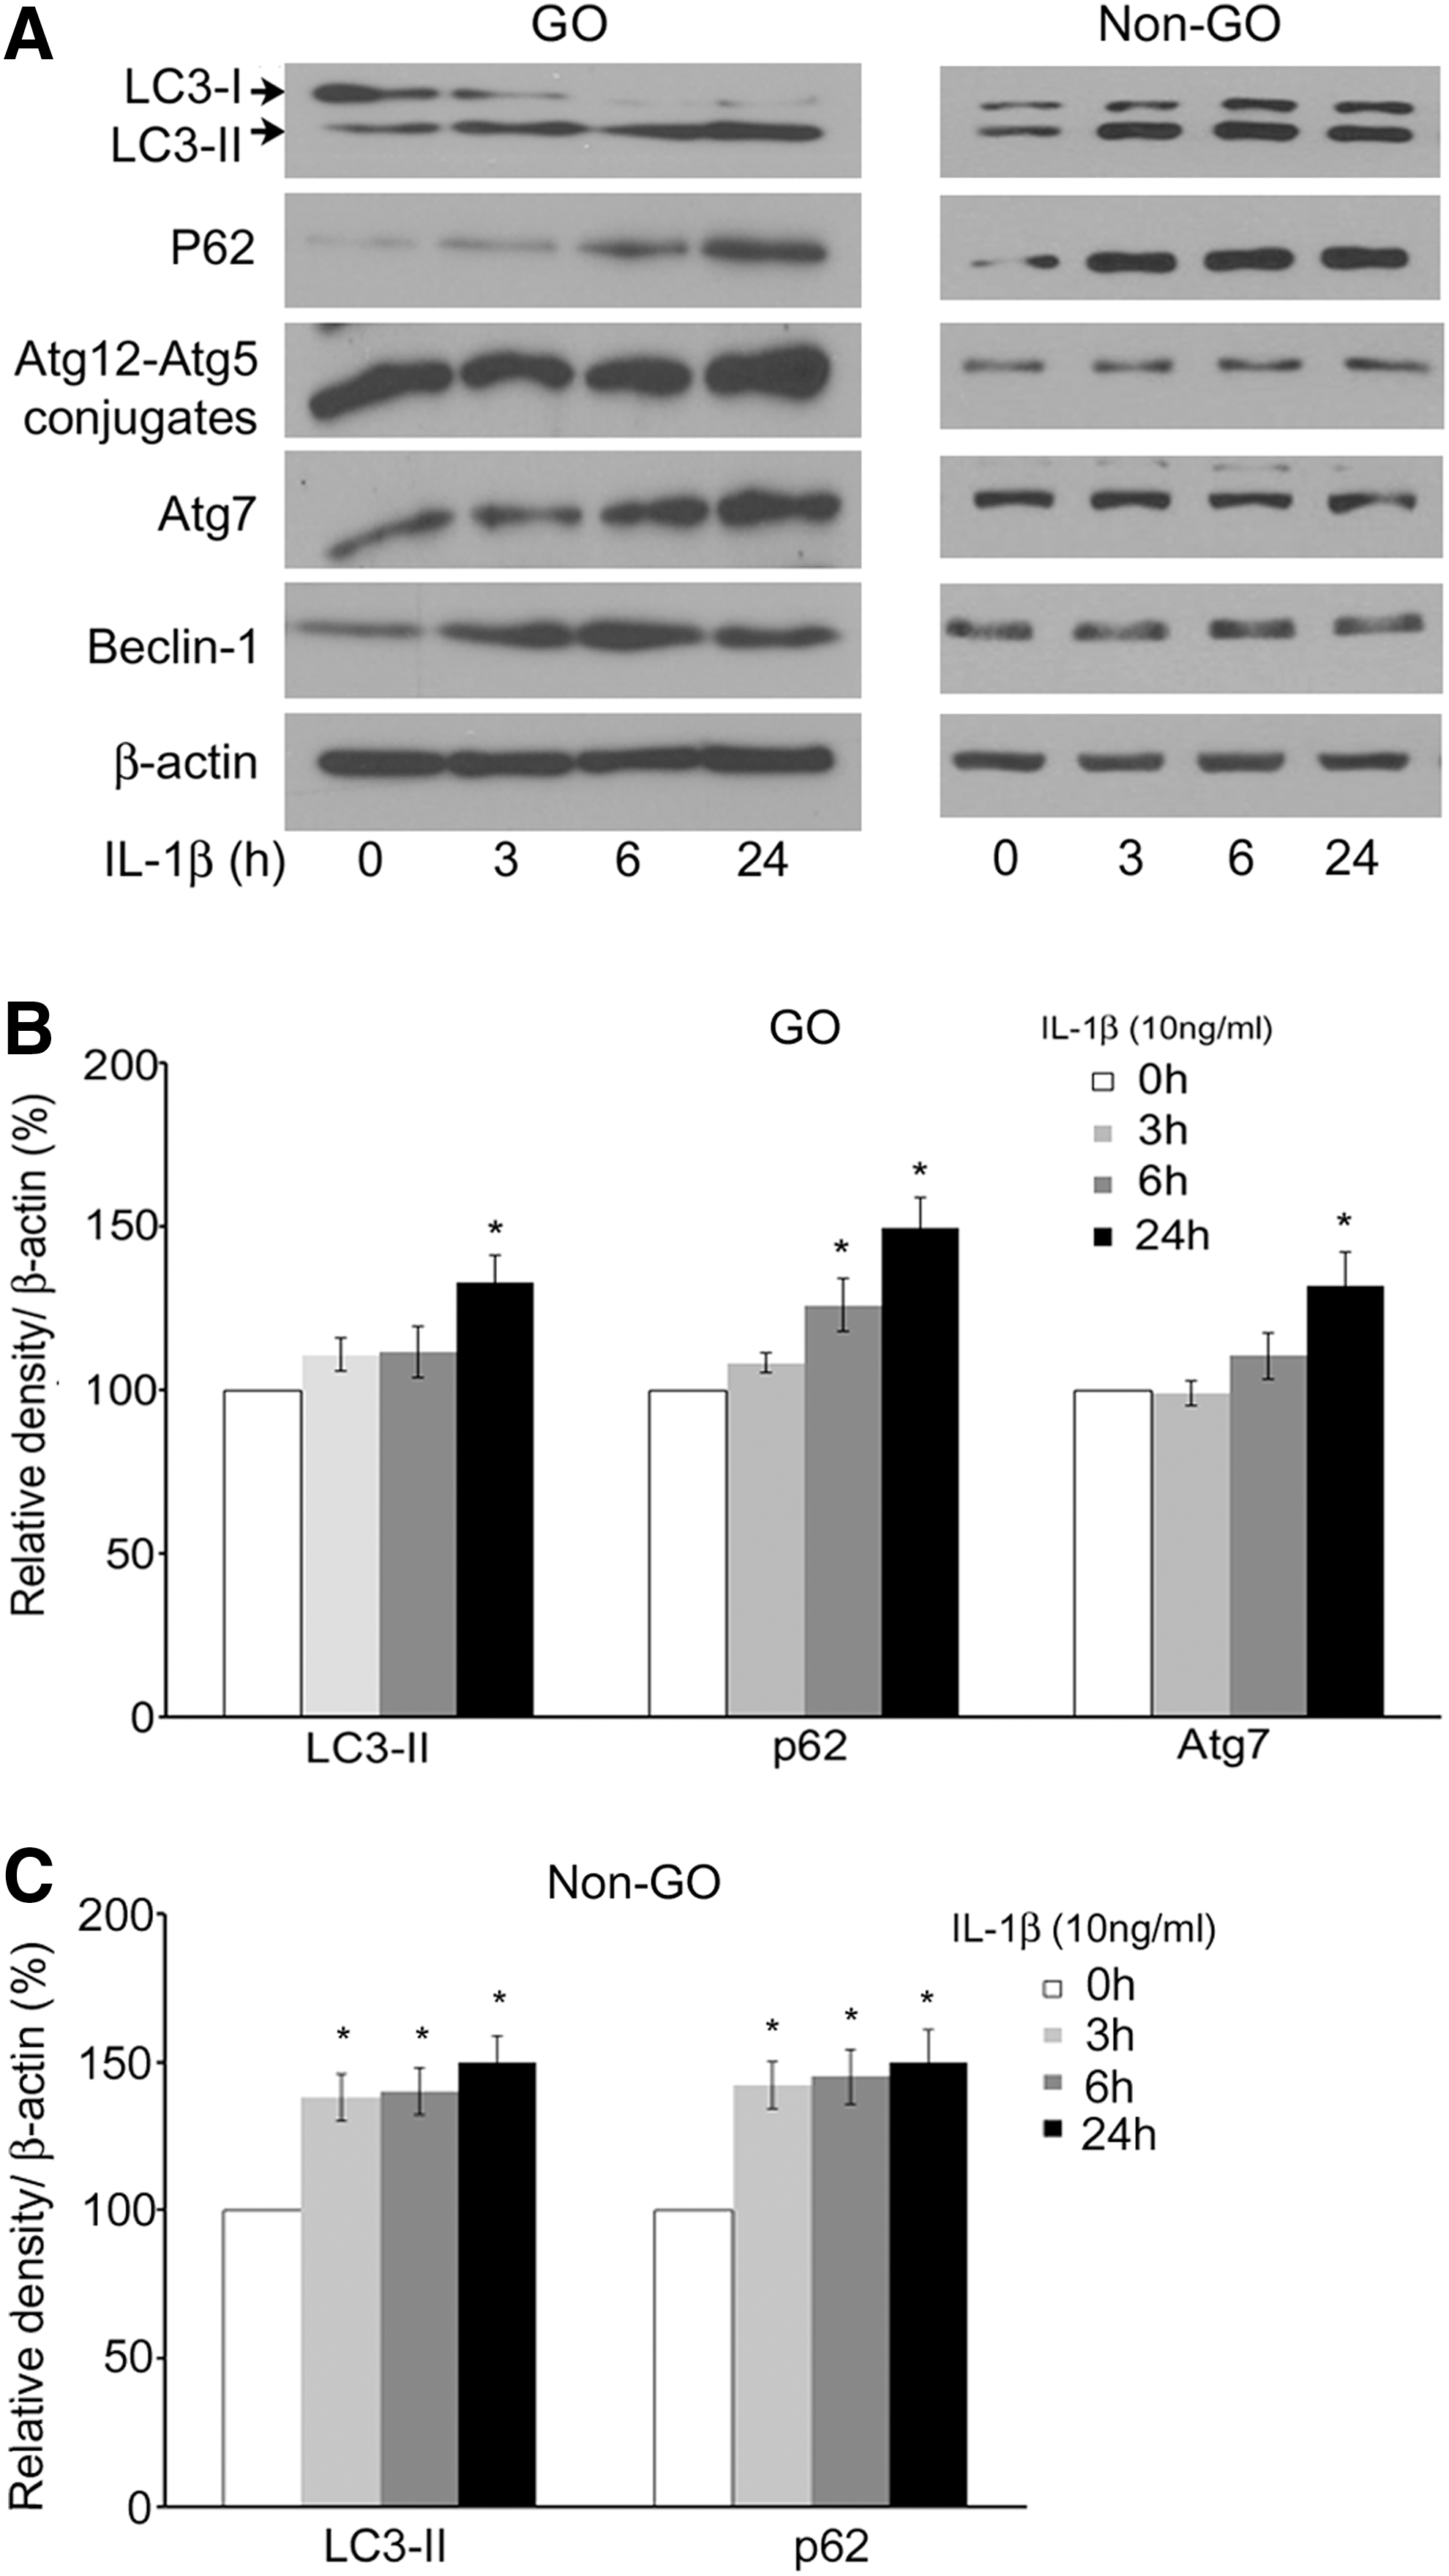
Expression of autophagy-related proteins after IL-1β stimulation. Semi-confluent GO and non-GO cells at passage 3 were treated with IL-1β (10 ng/mL) for the indicated times (0, 3, 6, and 24 hours). LC3-I, LC3-II, p62, Atg12-Atg5 conjugate, Atg7, and beclin-1 were assayed by Western blot analysis in four GO and three non-GO cells isolated from different patient samples, and the samples were assayed in duplicate. Representative blots
Adipogenesis stimulated autophagosome formation and activated flux was blocked by an autophagic flux inhibitor
We analyzed the activation of autophagy in GO orbital fibroblasts during adipogenesis using EM and autophagy-specific markers. This experiment was performed three times using GO cells from different patient samples, and the samples were assayed in duplicate. GO orbital fibroblasts were grown to confluence for 7 days and adipogenic media was added to induce adipogenesis. Day 0 represented the day when the cells became confluent. Differentiation medium was added every 2–3 days until day 10. Bafilomycin A1 (10 nM) was added for the first 2 days to inhibit autophagy/lysosomal fusion and degradation. We performed EM in differentiating cells on days 0, 4, and 10. Autophagosomes accumulated more in differentiating cells compared to undifferentiated orbital fibroblasts. On day 4 of adipogenesis, both early and late forms of autophagosomes further occupied the cell cytoplasm. However on day 10, cells became spheroid in shape, lipid droplets were occupied, and the early form of the autophagosome was less abundant. Inhibiting autophagic flux with bafilomycin A1 led to a visible accumulation of autophagic vacuoles containing electron-dense, nondegraded, polymorphous contents resembling late mature autophagosomes by day 4. On day 10 of differentiation, cells displayed reduced lipid droplet formation and similarly abundant electron-dense polymorphous cytoplasmic vacuoles (Fig. 4A). Conversion of LC3-I to LC3-II and strong expression of p62 was observed within the first 48 hours of adipogenesis but the expression of LC3 and p62 proteins gradually decreased from day 4 to day 10. Because LC3 on the inner membrane is actively degraded by lyososomal enzymes, very low LC3 content in the autolysosome might paradoxically represent an active autophagic flux. Bafilomycin A1 treatment during the first 2 days of adipogenesis led to an increased accumulation of LC3 and p62 during adipogenesis compared to untreated cells (Fig. 4B). The protein expression of PPARγ as well as C/EBPα and C/EBPβ significantly increased during adipogenesis, whereas bafilomycin A1 treatment suppressed expression of these proteins (Fig. 4C) and the abundance of Oil Red O-stained lipid droplets (Fig. 4D). The experiments were performed in three GO cells isolated from different patient samples (n=3), and the samples were assayed in duplicate. Representative images are shown in Figure 4. Quantification of autophagy-related proteins including LC3-I, LC3-II, Atg12-Atg5 conjugates, p62, and adipogenesis-related proteins including PPARγ, C/EBPα, C/EBPβ was performed by densitometric analysis, normalized to the β-actin levels (Supplementary Fig. S1; Supplementary Data are available online at
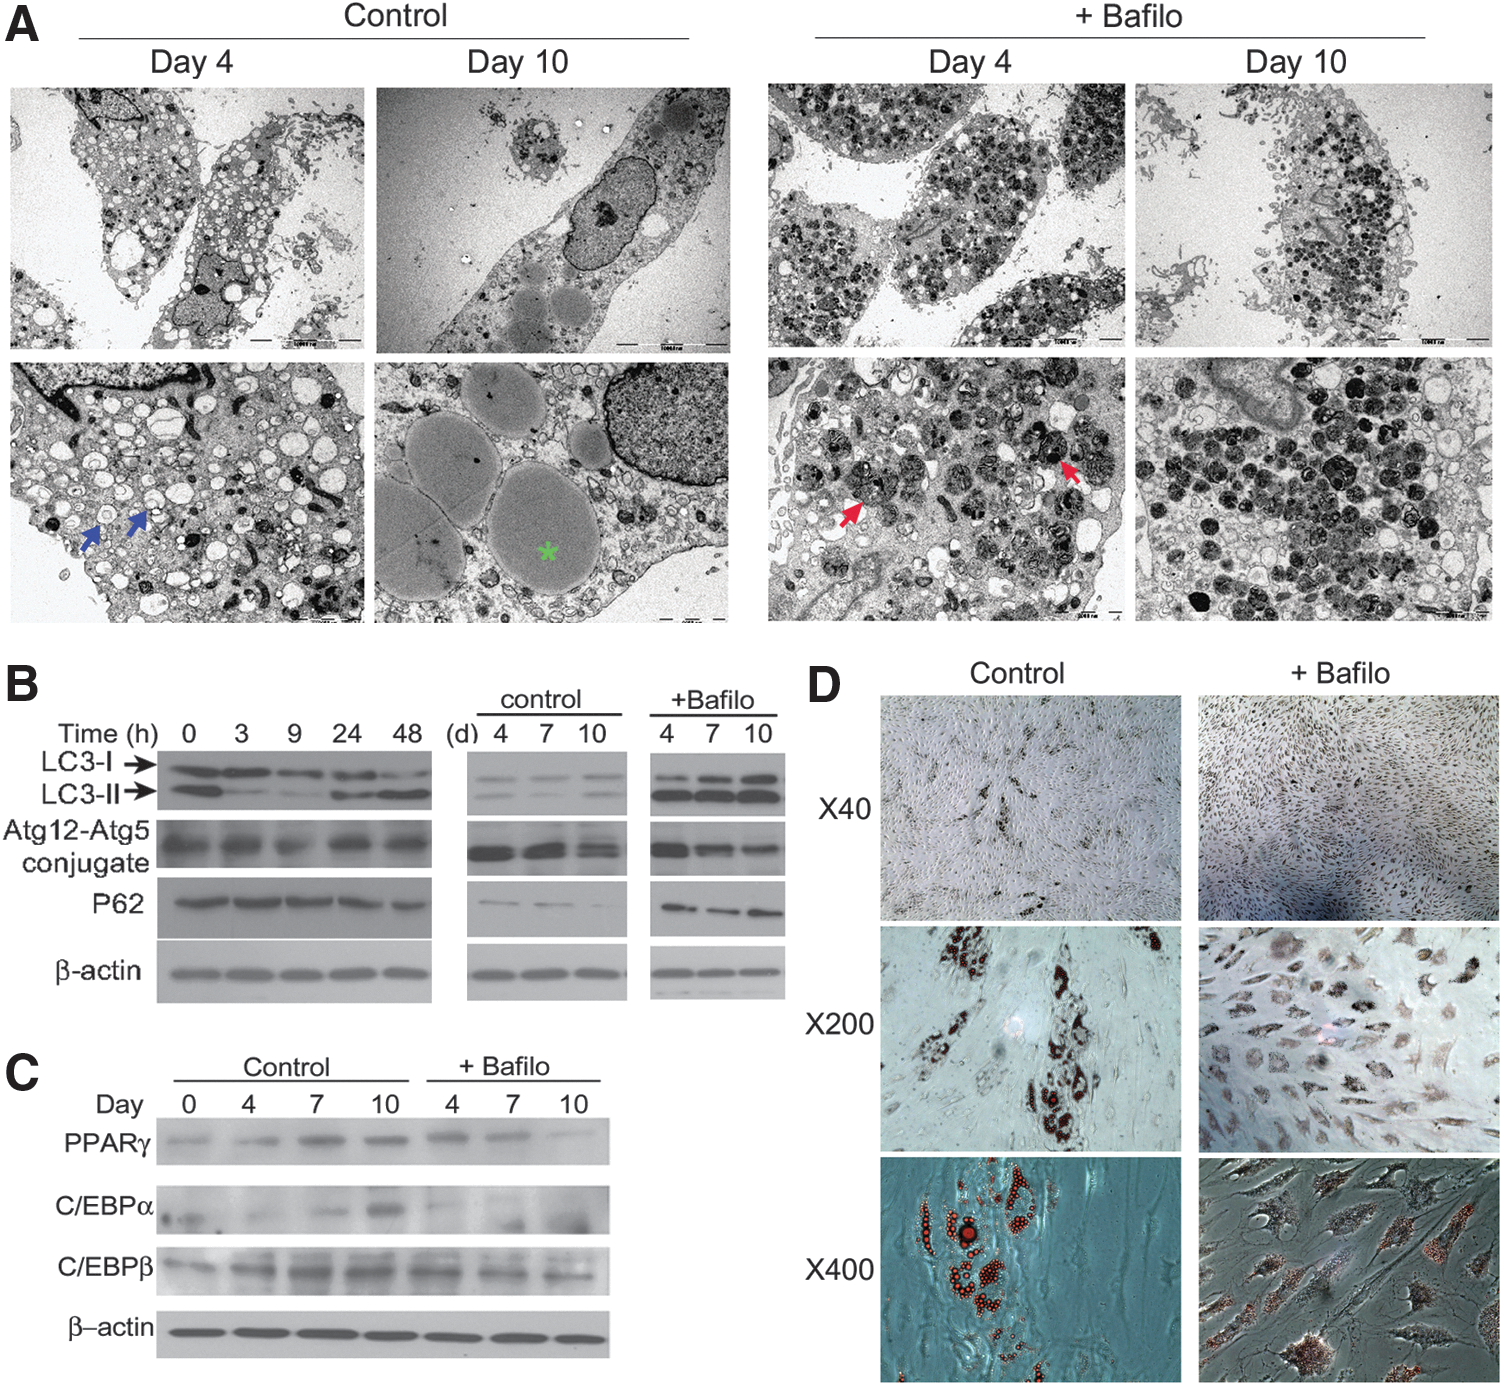
Changes in the autophagy machinery during adipogenesis of GO orbital fibroblasts. GO orbital fibroblasts were first grown to confluence for 7 days and adipogenic media were added to induce adipogenesis. The point at which the cells became confluent was recorded as day 0, and differentiation medium was added every 2–3 days until day 10. Bafilomycin A1 (10 nM) was added for the first 2 days to inhibit autophagy/lysosomal fusion and degradation. Oil Red O staining, Western blot analysis, and electron microscopic analysis were performed.
To investigate the effect of hydrogen peroxide, another stimulator of adipogenesis (14), on autophagic marker protein expression during differentiation, we added hydrogen peroxide for 48 hours during the early phase of adipogenesis. Hydrogen peroxide-treated cells showed a more active formation of autophagosomes and greater intracytoplasmic lipid droplet formation compared to untreated cells. Cotreatment with bafilomycin A1 induced extensive accumulation of late-form autophagolysosomes containing electron-dense nondegraded materials and suppressed lipid droplet formation (Supplementary Fig. S2A). Similarly, a gradual reduction in LC3 and p62 protein content was observed during differentiation of H2O2-stimulated cells (Supplementary Fig. S2B), whereas bafilomycin A1-treated GO cells showed an elevated expression of these proteins that was maintained until day 10. Similar to control adipogenesis shown in Figure 4C, hydrogen peroxide increased expression of PPARγ as well as C/EBPα and C/EBPβ proteins, and expression of these proteins was suppressed by bafilomycin A1 (Supplementary Fig. S2C). Oil Red O staining revealed a greater accumulation of lipid droplets in hydrogen peroxide-treated GO cells, whereas Oil Red O-stained cells were sparser in bafilomycin A1-treated GO cells (Supplementary Fig. S2D).
Autophagy inhibition by Atg5 knockdown suppressed adipogenesis
Because Atg5 is an essential autophagy protein, we investigated the effect of Atg5 knockdown on adipogenesis by using Atg5-specific shRNA. The experiments were performed in three GO cell cultures isolated from different patient samples (n=3), and the samples were assayed in duplicate. Atg5-specific shRNA transfection suppressed Atg12-Atg5 conjugate expression and completely inhibited LC3-II formation throughout the differentiation period (Fig. 5A and 5C). Expression of PPARγ and C/EBPα proteins was significantly reduced at day 7 and 10 of adipogenesis in Atg5-shRNA transfected cells, whereas expression increased in control transfections (Fig. 5A and 5C). Oil Red O staining revealed that intracytoplastmic lipid droplets were less formed in Atg5-shRNA transfected GO cells than in control-shRNA transfected cells (Fig. 5B). The lipid droplets were smaller in size and fewer in number in the Atg5 knockdown transfected cells than in control. Quantification of LC3-I, LC3-II, Atg12-Atg5 conjugates, C/EBPα and PPARγ proteins was performed by densitometric analysis (Fig. 5C).
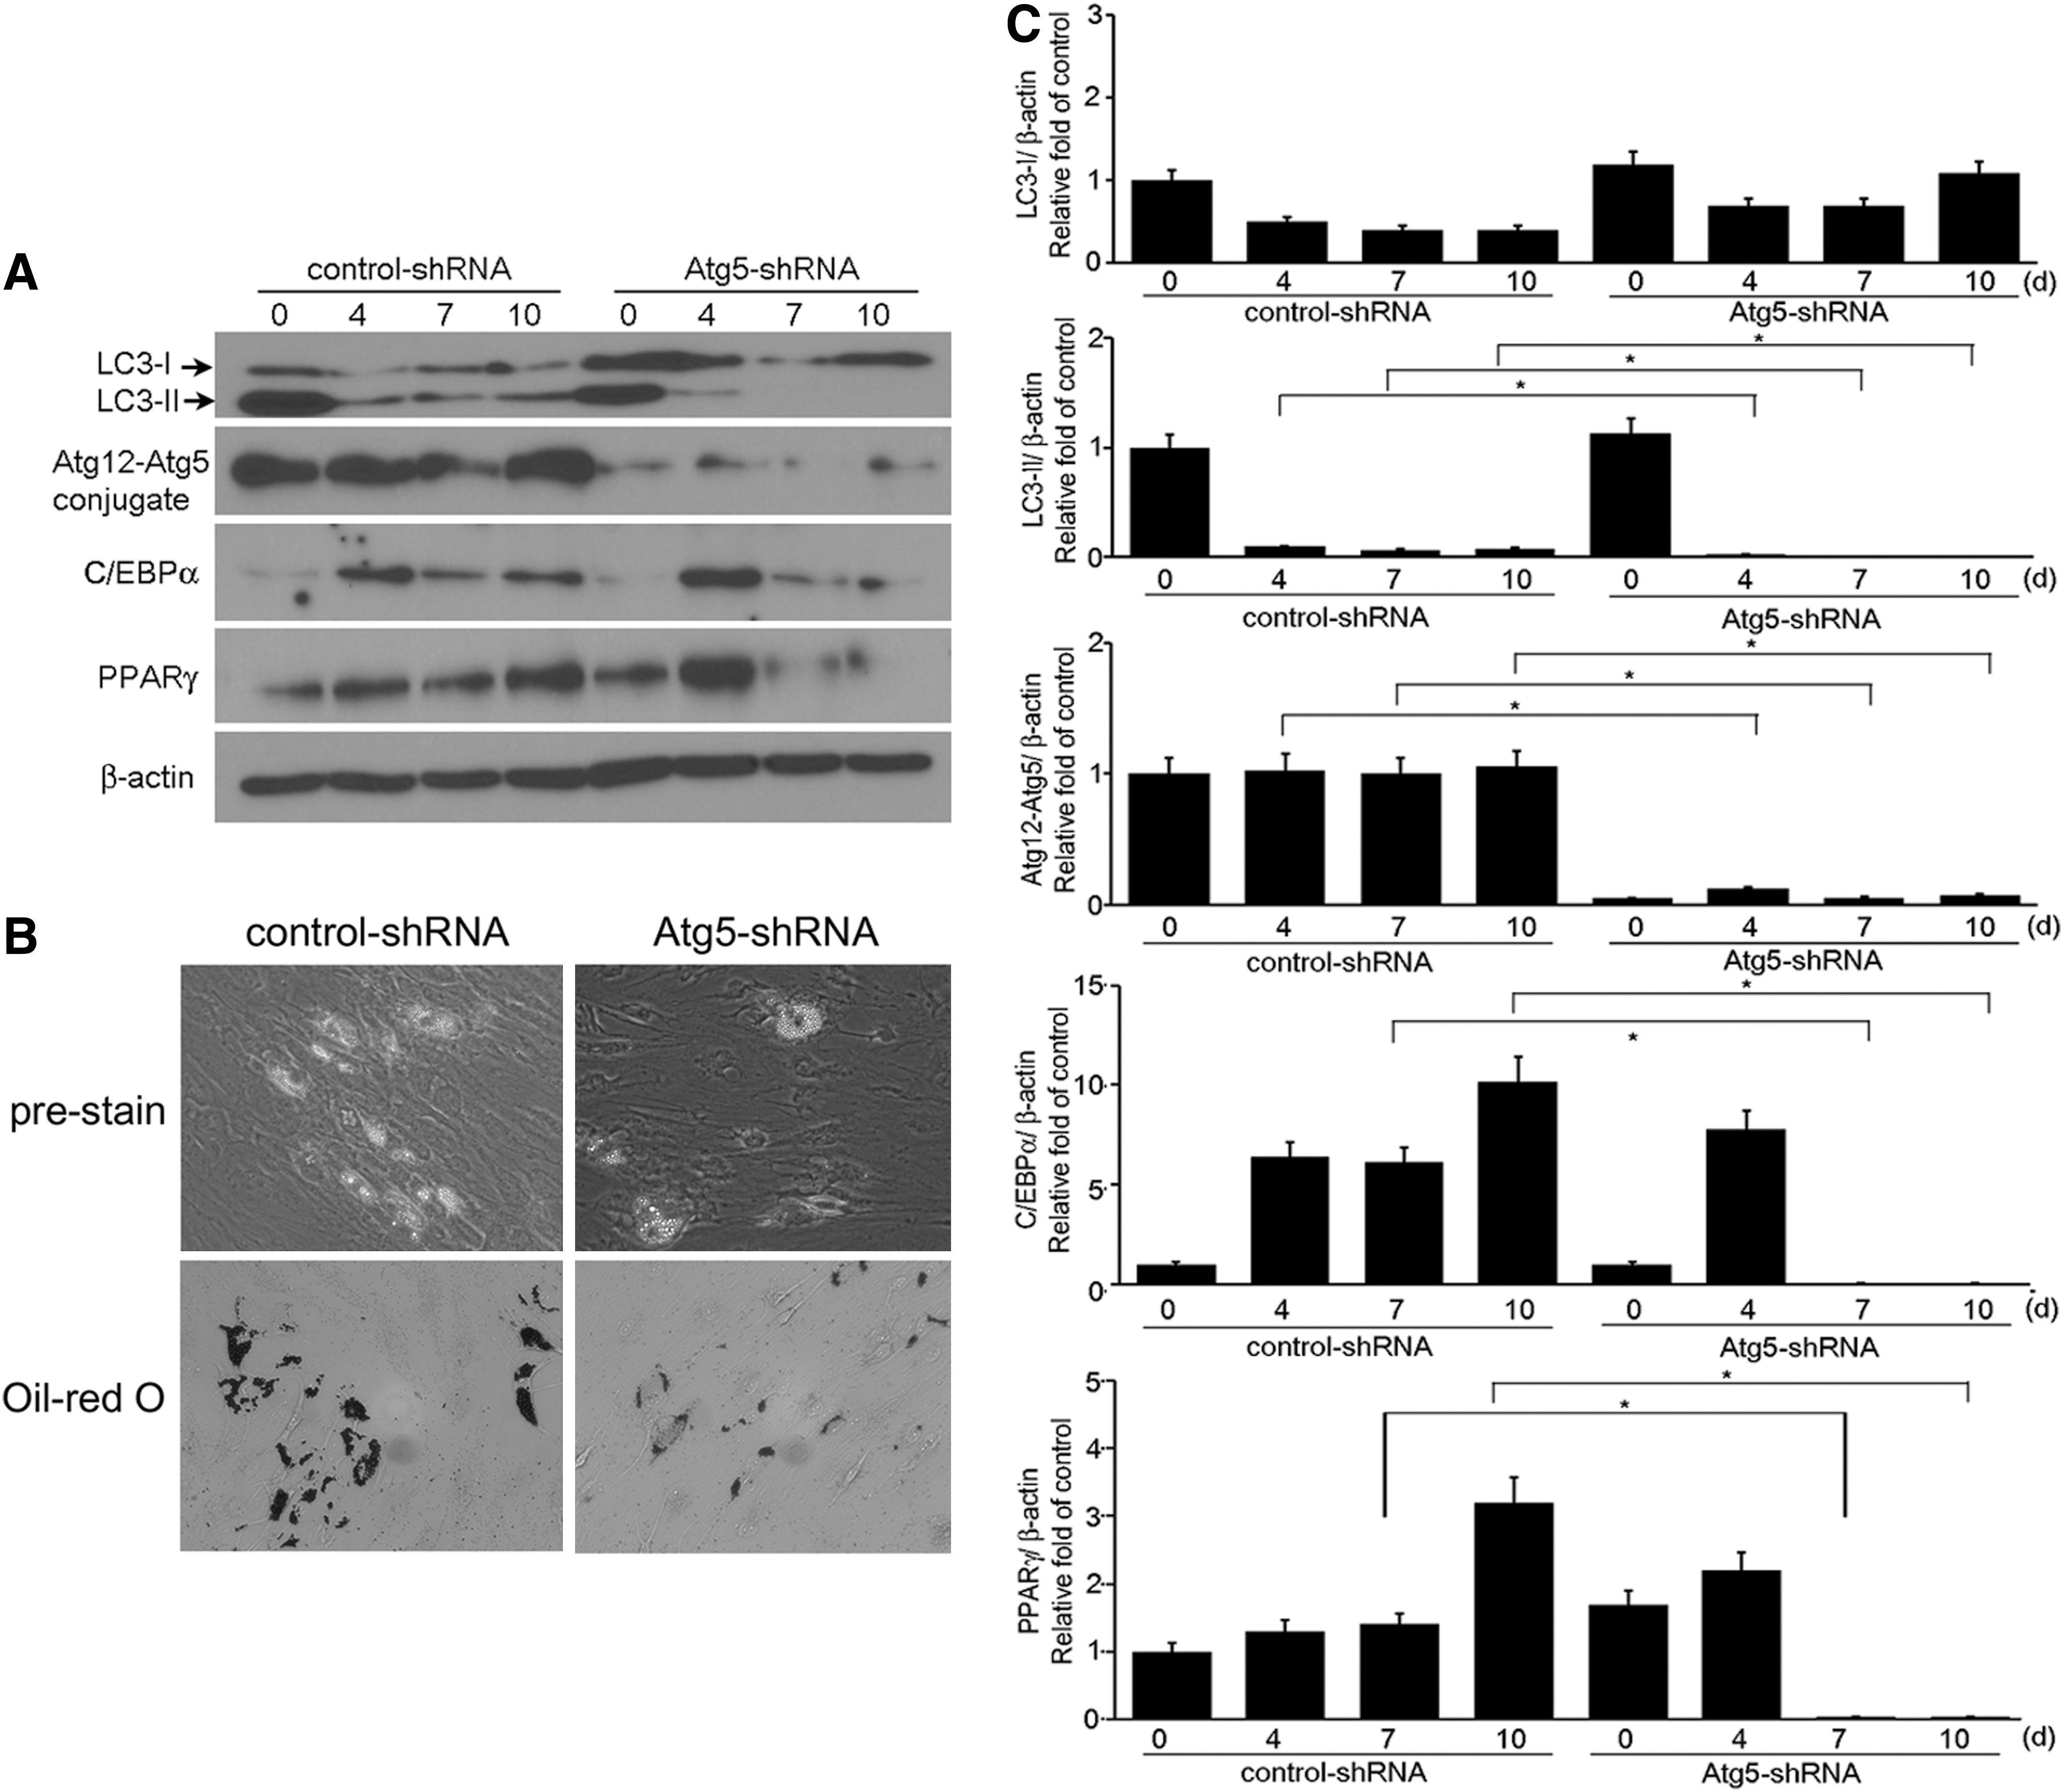
Effect of Atg5 knockdown on adipogenesis. Semi-confluent cells were transfected with either control or Atg5-specific shRNA, and adipocyte differentiation was induced for 10 days. Representative data of Western blot analysis are shown.
Discussion
In this study, we demonstrate that expression of autophagy-related genes was higher in GO orbital tissue explants and isolated GO orbital fibroblasts compared to their non-GO counterparts, and the number of autophagosomes was higher in undifferentiated GO orbital fibroblasts than in non-GO fibroblasts. IL-1β increased protein expression of LC3-II, p62 in GO and non-GO cells in a time-dependent manner. EM revealed active formation of autophagosomes containing variable densities of cytoplasmic materials in the early and intermediate phases of differentiation, but the autophagosome eventually disappeared, cells became spheroid in shape, and lipid droplets formed within the cytoplasm during the late phase of differentiation. Autophagic flux was in the active state during adipogenesis, as shown by the ability of autophagy/lysosomal inhibitor bafilomycin A1 to significantly suppress adipogenesis in GO cells. In addition, autophagy inhibition by Atg5 knockdown significantly suppressed adipogenic transcription factor protein expression and formation of lipid droplets. These molecular and morphologic data all indicate active autophagosome formation during the early adipogenesis period and lysosomal degradation of the autophagosome and cell structure change into a spheroid shape during the later period.
Autophagy is a lysosomal degradation process for cytoplasmic materials (23), and autophagy activity is extremely high during adipogenesis (10,11). Because the autophagosome is an intermediate structure in a dynamic pathway, the cellular autophagic activity is difficult to interpret at any specific time point. Therefore, we analyzed autophagy from day 0 to 10 of differentiation. Inhibiting autophagosome-lysosome fusion with bafilomycin A1 drastically increased LC3 and p62 protein throughout adipogenic differentiation and reduced the lipid droplets formation. Bafilomycin A1 also produced electron-dense non-degraded polymorphous vacuoles resembling late mature autophagosomes, possibly due to the defective digestion of inner limiting membrane and degradation of cytoplasmic contents by bafilomycin A1 (24,25). Although bafilomycin A1 has been shown to inhibit autophagosome-lysosome fusion (18), a recent study suggested that it primarily affects intralysosomal degradation by inhibiting acidification under certain conditions (26). Bafilomycin A1 neutralizes acidic organelles including lysosomes, late endosomes, and autophagic vacuoles, effectively blocking all degradation that depends on an acidic pH. Therefore, the reduced adipogenesis associated with bafilomycin in our data suggests that autophagy is essential for adipogenesis of GO orbital fibroblasts.
Although we detected a high rate of flux even in undifferentiated condition, our protein expression data indicate that differentiating GO cells were actively undergoing autophagy. In the early period of adipogenesis within 48 hours, the conversion of LC3-I to LC3-II was found, but LC3 and p62 protein diminished gradually from day 4 to 10. Paradoxically, the disappearance of total LC3 during adipogenesis may be a good indicator of autophagic flux, as the amount of LC3-II, which increases transiently upon induction of autophagy, is decreased after longer periods (e.g., more than 2 hours of starvation) of autophagy activation (27). Nascent LC3 becomes LC3-I, which subsequently conjugates with phosphatidylethanolamine to become LC3-II through an ubiquitination-like enzymatic reaction (25). LC3-II associates with both the outer and inner membranes of the autophagosome. LC3 on the inner membrane is degraded by lyososomal enzymes, resulting in a low LC3 content in the autolysosome (25,27,28). We also observed a significant difference in LC3 protein content in the presence of lysosomal inhibitors during adipogenesis, representing the amount of LC3 delivered to lysosomes for degradation.
Autophagy inhibition by Atg5 knockdown significantly reduced adipogenesis, as well as PPARγ and C/EBPα protein content, suggesting that Atg5 protein plays an important role in adipogenesis of orbital fibroblasts. The Atg5 gene encodes an acceptor protein, Atg5, for the ubiquitin-like protein Atg12. Atg5 conjugates with Atg12, forming a multimetric structure that is specifically required for the maturation of the autophagic membrane. Recent in vivo studies show that Atg5 and Atg 7 gene deletion interferes with normal adipocyte differentiation (11,12). An ultrastructural study by Baerga et al. (11) showed through EM analyses that more than 5% of the differentiating cell cytoplasmic volume cells is an autophagosome at day 6 of differentiation, and that autophagy is activated when adipocyte differentiation is induced in wild-type primary mouse embryonic fibroblasts. Interestingly, the autophagy-deficient primary Atg5-/- mouse embryonic fibroblasts exhibit a dramatically lower adipogenesis efficiency compared to their wild-type counterparts and chloroquine, a functional inhibitor of autophagy, inhibits adipogenesis (11). Recently, Zhang et al. (29) reported that chloroquine treatment, shRNA-mediated knockdown, or genetic engineering-induced deletion of Atg5 promotes proteasome-dependent PPARγ2 degradation and attenuates adipogenesis, suggesting that inhibition of autophagy may prevent high-fat diet-induced obesity.
Orbital fibroblasts from GO patients are extremely reactive to inflammatory stimuli, and can also differentiate into adipocytes, in response to an inflammatory cytokine milieu. Treating Graves' orbital fibroblasts with stimulating thyrotropin receptor antibodies leads to enhanced adipogenesis, and upon differentiation into mature adipocytes, these cells further increase the expression of the thyrotropin receptor at levels that are higher in Graves' orbital fibroblasts than controls (30 –32). In our study, autophagy was required for adipocyte differentiation of Graves' orbital fibroblasts, however, the event that initiates the process is still unclear. Autophagy may be enhanced either by a homeostatic autoimmune response to inflammation and oxidative stress that is necessary for cell survival, or by a primary pathogenic event that induces autoimmune pathogenesis. There is still much controversy about the organelle from which the membrane originate—the endoplasmic reticulum, mitochondria, and plasma membrane. We still do not understand which signaling pathway is linked to the autophagic process in GO, which should be further delineated by future research. The kinase mammalian target of rapamycin (mTOR) is a major regulator of the autophagic process and is regulated by starvation, growth factors, and cellular stressors (32,33). Upstream of mTOR, the survival PI3K/AKT pathway modulates mTOR activity. LY294002 and PI103 (PI3K1A/mTORC1 inhibitor) significantly decreased hyaluron synthase (HAS)2 transcripts and adipogenesis in Graves' orbital fibroblasts (34). Rapamycin, a mTORC1 inhibitor, suppressed adipogenesis in GO cells but had no effect on HAS2 transcripts. We have found upregulation of the p-Akt/Akt signal protein and p-mTOR/mTOR protein by stimulation of GO cells with autophagic flux inhibitor, bafilomycin and the main key proinflammatory cytokine, IL-1β (Supplementary Fig. S3). More detailed experiments are necessary to analyze the interplay between the PI3K/AKT/mTOR pathway and the autophagic process of GO.
The finding of a suppressed adipogenesis in GO cells through autophagy inhibition in our study suggests that autophagy may be a target for GO treatment. However, autophagy is a dynamic process regulated by various factors that are only partially understood. Further studies clarifying the interrelationship between autophagy and the development of GO inflammatory and autoimmune responses will help verifying the treatment effect of autophagy inhibitors in GO.
Footnotes
Acknowledgments
This study was supported by a faculty research grant from Yonsei University, College of Medicine (grant number: 6-2012-0138 to J.S.Y), and by Bio & Medical Technology Development Program (grant number: 2014M3A9B6069341 to E.J.L).
Author Disclosure Statement
No competing financial interests exist.