
Abstract
Background:
Several single nucleotide polymorphisms (SNP) have been identified to be associated with the risk for differentiated thyroid cancer in populations of distinct ethnic background. The relationship of these genetic markers to a benign tumor of the thyroid, follicular adenoma (FA), is not well established.
Methods:
In a multicenter retrospective case-control study, five thyroid cancer-related SNPs—rs966513 (9q22.33, FOXE1), rs944289 (14q13.3, PTCSC3), rs2439302 (8p12, NRG1), rs1867277 (9q22.23, FOXE1), and rs6983267 (8q24, POU5F1B)—were genotyped in 959 cases of histologically verified FA, 535 papillary thyroid carcinomas (PTC), and 2766 population controls.
Results:
A significant association was found between FA and rs944289 (p=0.002; OR 1.176 [CI 1.064–1.316]), and suggestively with rs2439302 (p=0.033; OR 1.149 [CI 1.010–1.315]). In PTC, significant associations were confirmed for rs965513 (p=4.21E-04; OR 1.587 [CI 1.235–2.000]) and rs944289 (p=0.003; OR 1.234 [CI 1.075–1.408]), newly found for rs2439302 (p=0.003; OR 1.266 [CI 1.087–1.493]) and rs1867277 (p=1.17E-04; OR 1.492 [CI 1.235–1.818]), and was not replicated for rs6983267 (p=0.082; OR 1.136 [CI 0.980–1.316]) in this series. A significant correlation between rs2439302 genotype and relative expression of NRG1 was detected in normal and tumor counterparts of PTC (about 10% decrease per each risk allele). NRG1 expression also significantly correlated with that of PTCSC3.
Conclusions:
Association of rs944289, which was previously known to confer risk for thyroid cancer, with FA, and the correlation between PTCSC3 and NRG1 expression demonstrates that predisposing genetic factors are partly common for benign and malignant thyroid tumors, and imply broader roles of the pathways they underlie in thyroid tumorigenesis, not limited to carcinogenesis.
Introduction
F
FA displays morphological similarities (as well as dissimilarities) with differentiated thyroid cancers displaying a follicular growth pattern, especially with FTC and the encapsulated follicular variant of PTC with minimal nuclear changes. Genetic alterations described in both FA and malignant thyroid tumors include mostly RAS mutations (4 –7) and PAX8/PPARG rearrangements (8). The commonality of certain morphological and molecular features between FA and well-differentiated thyroid cancer prompts the question whether inherited genetic markers, namely single nucleotide polymorphisms (SNP) conferring risk for thyroid malignancy, may also be associated with benign thyroid tumors.
Three genome-wide association studies performed in populations of European ancestry reported an association of rs966513 on chromosome 9q22.33 (upstream FOXE1, Forkhead box E1 (9,10)), rs944289 on 14q13.3 (NKX2-1, NK2 homeobox 1 neighborhood (9), later determined to regulate PTCSC3, PTC susceptibility candidate 3 (11)), and rs2439302 on 8p12 (NRG1, Neuregulin 1 (12)) with well-differentiated thyroid cancer. Independently, rs1867277 at 9q22.23 in FOXE1 5′UTR (13,14) as well as rs6983267 on 8q24 (upstream POU5F1B, POU class 5 homeobox 1B) conferring risk for several cancers were found to be associated with PTC using a target gene approach (15 –17). Two SNPs, rs965513 and rs944289, have been replicated in the Japanese population (18). However, until recently it was unknown whether any of these SNPs were associated with FA. The only study performed so far claimed a significant association between rs944289 and “benign thyroid tumor” (FA and hyperplastic nodules combined) in the Han Chinese population (19). Of note, whether genetic and pathogenic mechanisms underlying FA (a tumor) and a hyperplastic nodule (thyroid hyperplasia) are identical is not well understood, and these two types of lesions are histopathologically distinct entities.
The primary goal of this work was to determine whether SNPs previously reported to confer risk for thyroid malignancy may also associate with FA. For this purpose, 959 Japanese patients with morphologically verified FA and 2766 population controls for the five SNPs were genotyped. To make a comparison with thyroid cancer, genotypes of 535 Japanese patients with PTC were analyzed, expanding a previous study (18). In addition, to understand the relationship of rs944289 and rs2439302 to the regulation of NKX2-1 and/or PTCSC3, and NRG1 expression, respectively, matched normal thyroid and tumor tissues from 81 patients with PTC were analyzed.
Material and Methods
Patients and a control cohort
A total of 1162 formalin-fixed paraffin-embedded tissues from patients subjected to thyroid surgery between 1963 and 2011 for whom the diagnosis of FA was identified in the Nagasaki Tumor Registry files were collected from Nagasaki city hospitals and the National hospital organization Nagasaki Medical Center (Omura city). Other participating centers were Kuma hospital (Kobe city) and Ishigaki clinic (Hamamatsu city).
Morphological diagnosis of FA was verified by experienced pathologists (A.B., M.N., M.I., T.H., and T.B.) to exclude concomitant thyroid cancer and/or other types of thyroid nodules or nodular hyperplasia. Most slides (816/1162, 70.2%) were reviewed by at least two independent pathologists, and all slides were reexamined at least twice. After histological verification, 959 tissue specimens were confirmed as FA according to the World Health Organization classification (20). A control population was sampled in Kyoto University (2766 blood specimens). Thirty-eight samples obtained from patients with PTC operated between 2010 and 2013 in Nagasaki University Hospital were added to our previous series of 507 samples (18). A summary of patients and controls is presented in Table 1.
Age at diagnosis.
Age at sampling.
FA, follicular adenoma; PTC, papillary thyroid carcinoma.
The protocol of the study was approved by the ethical committees of all participating institutions.
DNA extraction
Genomic DNA was extracted from five 10 μm sections using a QIAamp DNA mini kit (Qiagen, Valencia, CA) according to the manufacturer's protocol. All sections were taken from the blocks containing both FA tumor and normal thyroid tissue to ensure unbiased genotyping (21). DNA of sufficient quality and quantity (as measured with a Nanodrop ND-100 spectrophotometer) was obtained from all 959 FA samples. DNA samples that displayed poor polymerase chain reaction (PCR) amplification and/or ambiguous base call signal on direct genotyping (presumably due to chemical modifications caused by extensive fixation in formalin, and long sample storage/age) were treated with borate-NaOH buffer (pH 11.0) as described previously (22). Genomic DNA from frozen PTC samples was extracted using the Proteinase K/Phenol-Chloroform method.
SNP genotyping
Genotyping was performed with predesigned custom ABI TaqMan SNP assays (functionally tested primer/probe sets are listed in Supplementary Table S1; Supplementary Data are available online at
The control set included 2764 genotypes for rs965513 and 2766 for rs944289, which were extracted from the genome scans obtained previously with Illumina Human610-Quad BeadChip arrays (18). For rs2439302, rs1867277, and rs6983267, 2766, 2724, and 2759 genotypes, respectively, were imputed using genotypes of the International HapMap Project as reference.
RNA extraction, cDNA synthesis, and quantitative real-time PCR
Total RNA was isolated from frozen tissues of normal and tumor counterparts of 81 PTC cases with Isogen (Nippon Gene, Toyama, Japan). Twenty-five μg of isolated RNA was treated with RNase-free DNase I (Qiagen) for 20 min at room temperature, and cleaned up and concentrated using a RNeasy Micro Kit (Qiagen). Five μg of DNA-free RNA was reverse-transcribed using MuLV Reverse Transcriptase, random hexamers, and RNase Inhibitor (all reagents from Applied Biosystems, Foster City, CA) in a total reaction volume of 50 μL. Incubation was performed at 41°C for 60 min followed by heat inactivation at 95°C for 5 min.
An aliquot of 2 μL of cDNA was used in 25 μL PCR reactions containing 12.5 μL of 2×Sybr Premix Ex Taq II (Takara, Otsu, Japan) and 400 pM of each primer for the target or reference gene (POLR2A, polymerase (RNA) II (DNA directed) polypeptide A). All primers were designed using Primer Express 3.0 software (Applied Biosystems); see Supplementary Table S2.
The quantitative real-time PCR (qRT-PCR) amplifications for each gene were performed in duplicates in a Thermal Cycler Dice Real Time System II (Takara). All samples were run under the same PCR cycling conditions: 95°C for 30 sec, then 40 cycles (95°C for 5 sec and 59°C for 30 sec) followed by dissociation curve analysis to ensure the signal from target amplicon. The average of the relative quantity of replicates was calculated by the ΔΔCt method with built-in software.
Statistical analysis
Differences between case-control groups for each SNP were examined using logistic regression analysis in the multiplicative model of inheritance adjusted for age and sex. The associations for each SNP were evaluated in terms of p-value, odds ratio (OR), and its corresponding confidence interval. Heterogeneity of the OR between FA and PTC was estimated with Breslow–Day test using the FREQ procedure with the CMH option in the SAS system (v9.2; SAS Institute, Cary, NC). Relationships between gene expression levels in the grouped samples were assessed with Wilcoxon signed rank or Kruskal–Wallis tests as appropriate. Multivariate linear regression analysis was applied to examine a correlation between NRG1 expression level and rs2439302 genotype, and NKX2-1 and PTCSC3 expression levels and rs944289 genotype.
Unless otherwise specified, all calculations were performed using SPSS v17.0 statistical software package (SPSS, Inc., Chicago, IL). p-Values<0.05 were regarded as indicating statistical significance in all statistical tests.
Results
Association analysis of FA and PTC
The number of samples that passed quality control, depending on the SNP and method used, were 901–933 (of 959) in the FA series, 486–535 (of 545) of the PTC, and 2759–2766 (of 2766) in the population controls. Corresponding genotype call rates per SNP ranged between 0.940 and 0.973 in FA, 0.892 and 0.982 in PTC, and 0.997 and 1.0 in the controls (Supplementary Table S1).
In FA, two of five SNPs—rs944289 (p=0.002; OR 1.176 [CI 1.064–1.316]) and rs2439302 (p=0.033; OR 1.149 [CI 1.010–1.315]) displayed associations (Table 2). The latter, however, did not survive correction for multiple testing. Therefore, its association with benign tumor should be considered suggestive.
The reference (Ref) and variant (Var) alleles according to NCBI Build 37.5; the risk allele is indicated with an asterisk.
Odds ratio (OR) was calculated for the risk allele along with a confidence interval.
p=0.082 after correction for multiple testing (FDR).
Heterogeneity of the OR between FA and PTC, the Breslow–Day test.
SNP, single nucleotide polymorphisms.
In PTC, four SNPs were significant. Genotypes determined in the current study were pooled with those from a previous investigation (18), yielding association signals for rs965513 (p=4.21E-04; OR 1.587 [CI 1.325–2.000]) and rs944289 (p=0.003; OR 1.234 [CI 1.075–1.408]; Table 2). The significance of associations for both SNPs became stronger as compared to the earlier report, likely due to the larger sample size (6.59E-5 vs. 1.27E-4 for rs965513, and 8.82E-4 vs. 1.21E-2 for rs944289 if trend exact test is applied as in ref. 18). The newly assessed rs2439302 (p=0.003; OR 1.266 [CI 1.087–1.493]) and rs1867277 (p=1.17E-04; OR 1.492 [CI 1.235–1.818]) were also significant. This is the first report in the Japanese population. In contrast, association of rs6982367 could not be confirmed (p=0.082; OR 1.136 [CI 0.980–1.316]).
Comparison of a SNP's effect sizes in FA and PTC demonstrated that rs944289 and, likely, rs2439302 associated with both FA and PTC (p het=0.646 and 0.324, respectively), while rs965513 and rs1867277 in the FOXE1 region associated with PTC (p het<0.03; Table 2).
Correlation between rs944289 genotype and relative expression of NKX2-1 and PTCSC3
rs944289 localizes 336 kb centromeric and downstream to NKX2-1, which after the discovery of an association of rs944289 with thyroid cancer has been initially proposed as a gene that this SNP may tag (9). The link between NKX2-1 and rs944289 has never been explored before. Later, rs944289 was shown to correlate with PTCSC3 expression localized 3.2 kb downstream of this SNP (11). The relationship of rs944289 with expression of the two genes in the available tissues from patients with PTC was examined.
NKX2-1 expression levels correlated significantly between paired normal and tumor counterparts (Spearman's r=0.419, p=1.513E-4), but did not differ significantly between them (p=0.509; Fig. 1A). PTCSC3 expression also correlated between normal and tumor tissue (Spearman's r=0.331, p=0.003). Yet, in contrast to NKX2-1, it was significantly lower in the latter (p=3.494E-5; Fig. 1C).
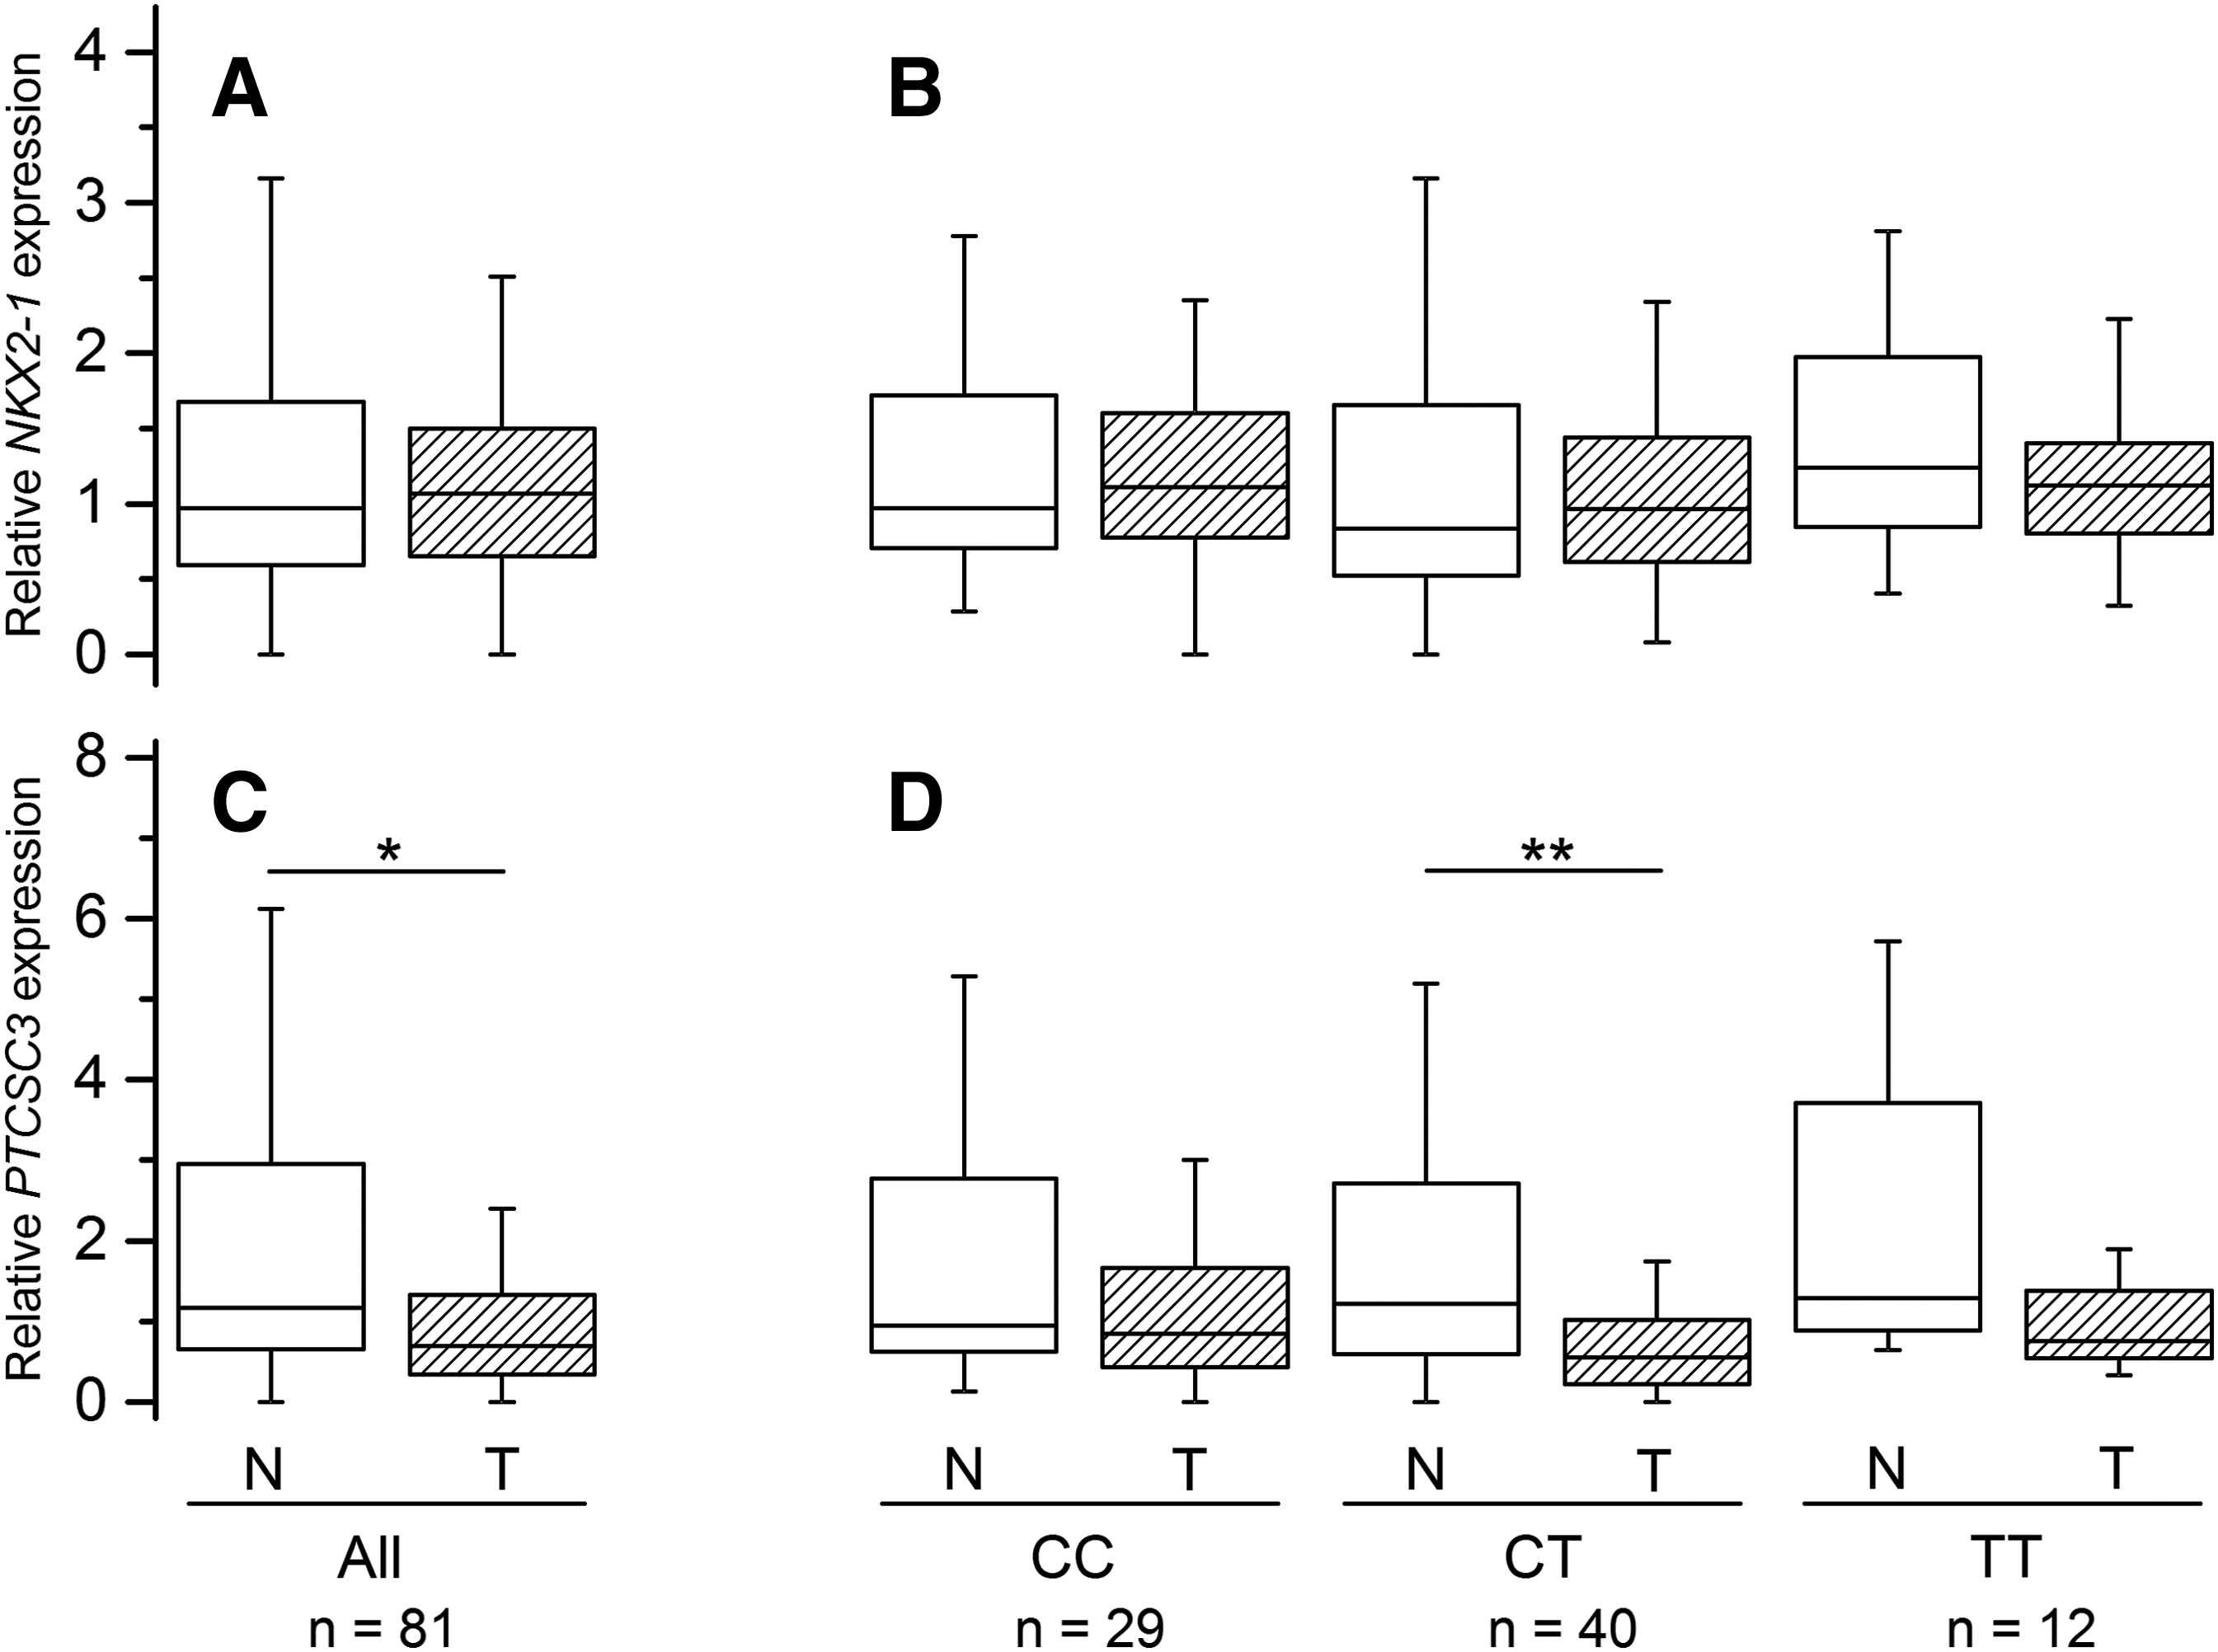
Relative NKX2-1 and PTCSC3 expression in normal thyroid (open boxes) and papillary thyroid carcinoma (PTC) tumor (hatched boxes) tissues.
NKX2-1 expression did not associate with the rs944289 genotype in subgroup analysis (Fig. 1B) and in the regression model (Table 3). For PTCSC3, a statistically significant decrease in the expression level in tumor tissue was found only in heterozygous patients (p<0.01), likely due to the larger sample size of this subgroup (hence, statistical power), although lower median levels were consistently observed for all genotypes (Fig. 1D). In the regression model, PTCSC3 expression did not correlate significantly with the rs944289 genotype (Table 3).
Multivariate linear regression analysis, the additive model adjusted for age and sex.
B coefficient in the model.
Confidence interval for B.
Correlation between rs2439302 genotype and relative expression of NRG1 in PTC
NRG1 expression levels weakly but significantly correlated between the paired tissue specimens (Spearman's r=0.308, p=0.005), and the level was significantly higher in normal thyroid as compared to PTC tumor tissue (p=0.037; Fig. 2A).
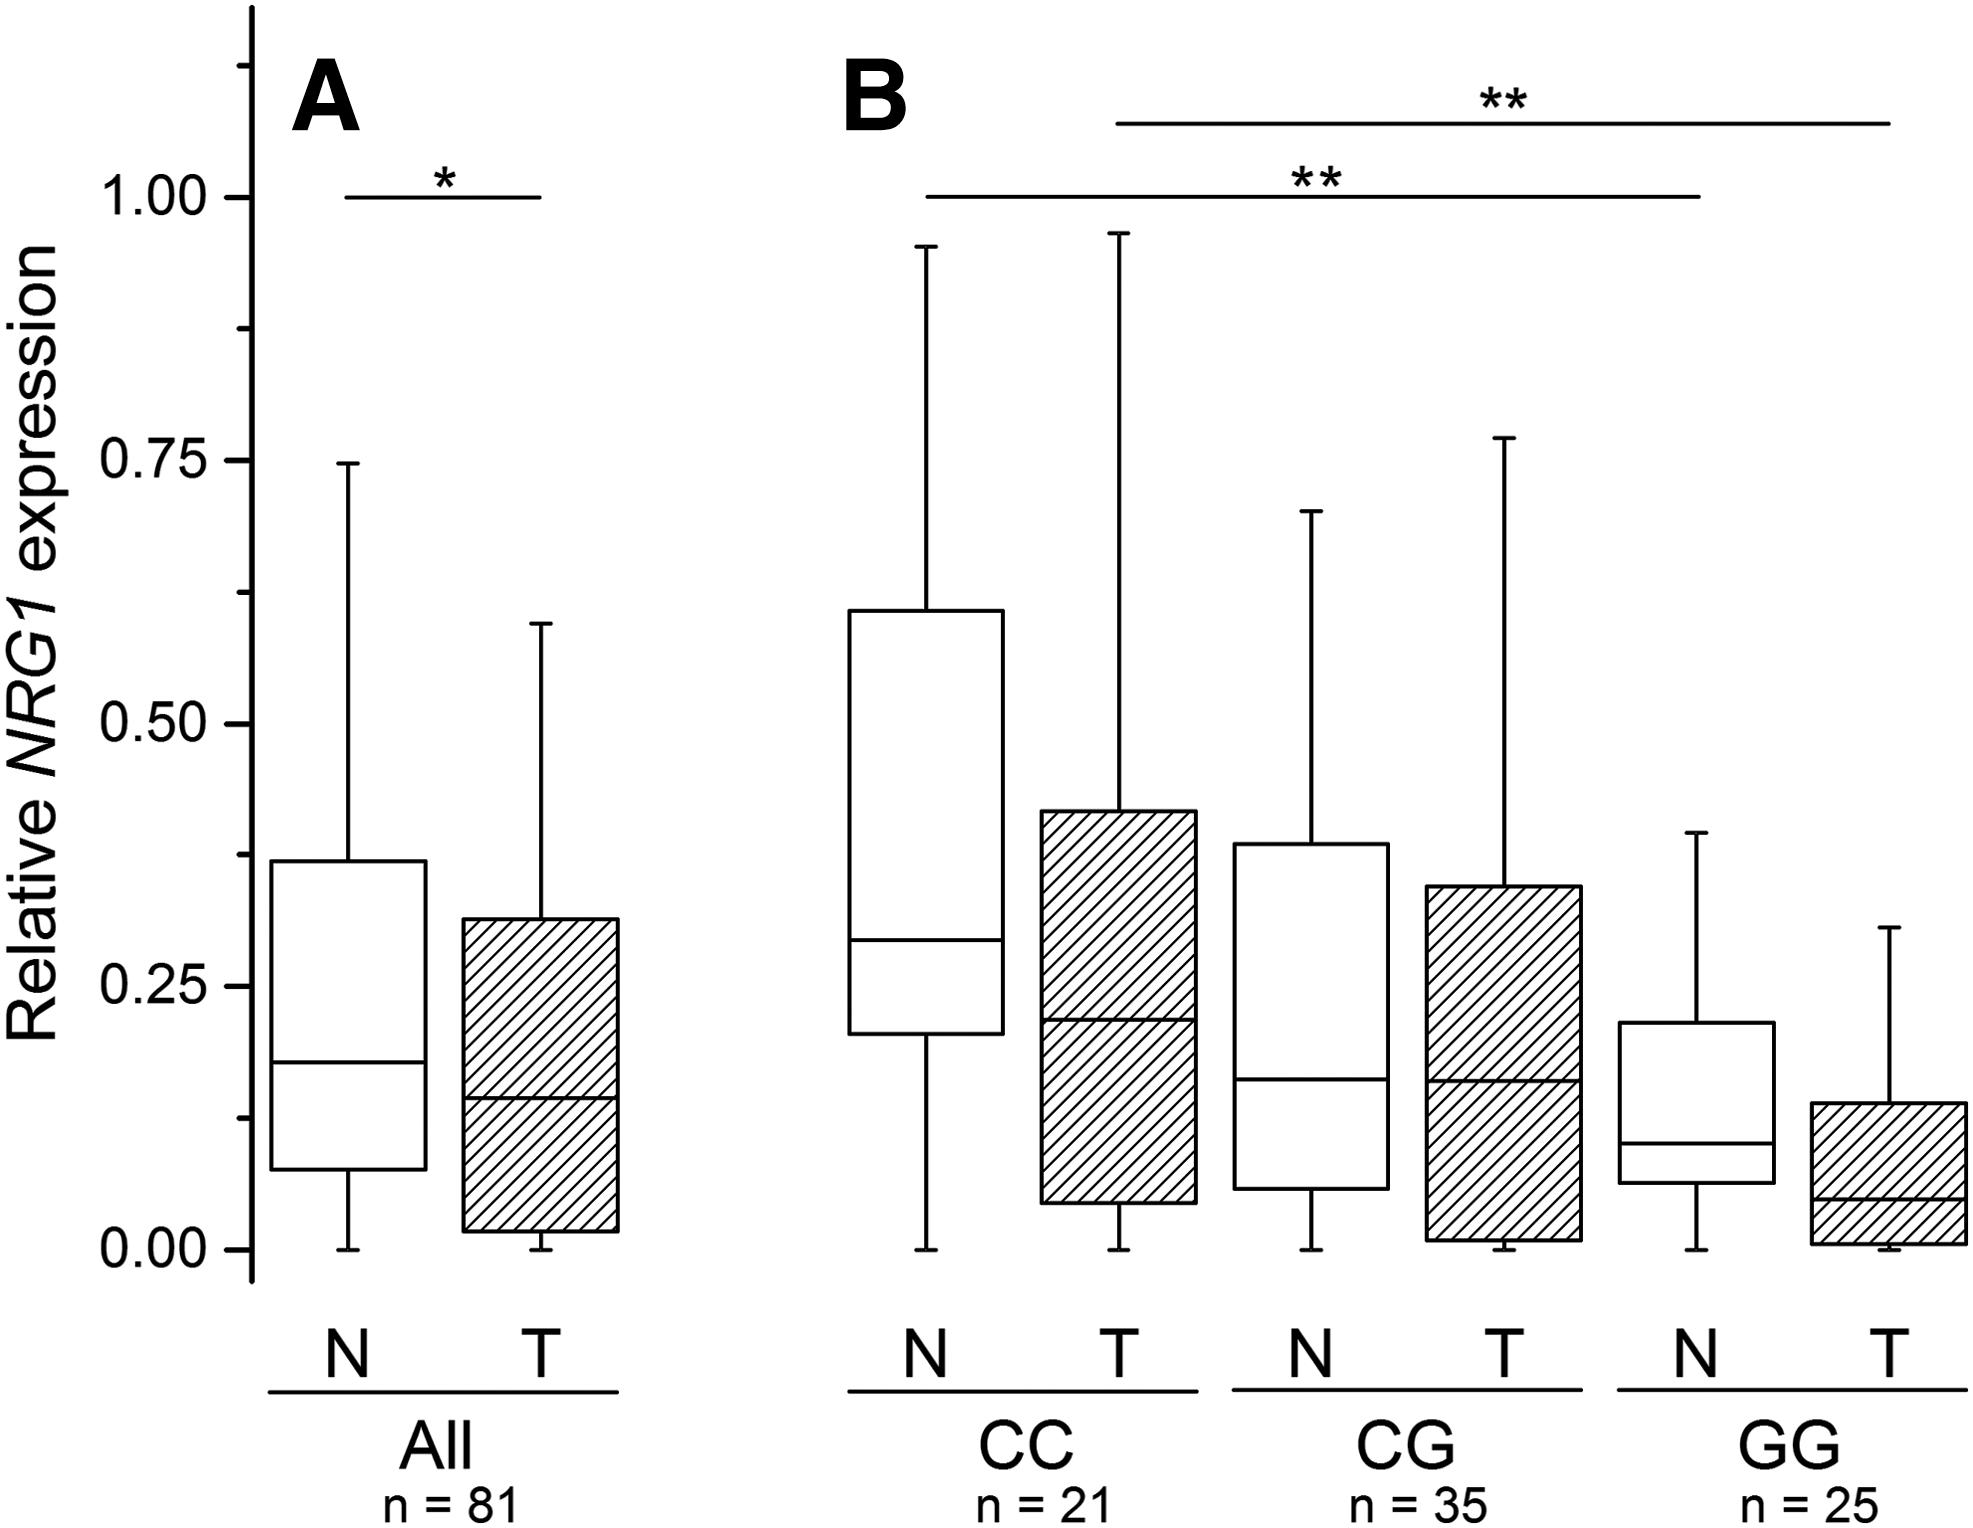
Relative NRG1 expression in normal thyroid (open boxes) and PTC tumor (hatched boxes) tissues.
rs2439302 is located in intron 1 of NRG1, and may be expected to influence its expression. Indeed, homozygous carriers of the rs2439302 risk allele G displayed a significantly lower NRG1 level in both normal thyroid and tumor tissues as compared to patients homozygous for the common allele C (p<0.05, Fig. 2B). Furthermore, multivariate linear regression analysis detected a significant correlation between NRG1 expression and rs2439302 genotype indicating about 10% decrease in the relative NRG1 expression per each risk allele in both tumor and normal thyroid tissues (Table 3).
Relationship between relative expression of PTCSC3 and NRG1, and combination effect of rs944289 and rs2439302 variants
Ectopic overexpression of PTCSC3 in thyroid cancer cell lines has been reported to affect several canonical pathways, and neuregulin signaling was the third among top five (p=9.54E-4) (11). In this PTC series, a concordant decrease of PTCSC3 and NRG1 levels were observed in tumor tissue compared to normal thyroid. The correlation between PTCSC3 and NRG1 expression were therefore examined, and it was found that in both types of tissues, the levels were directly proportional and correlated highly significantly (Spearman's r=0.692, p=8.266E-13 for normal thyroid, and r=0.336, p=0.002 for PTC tumor tissue; see Supplementary Fig. S1).
It was further assessed whether there is an interaction between rs944289 and rs2439302. No evidence of an epistatic effect was obtained in regression analysis (p=0.521 for FA and p=0.343 for PTC). However, there were additive effects of the two SNPs, suggesting that carriers of two or more of risk alleles are at greater risk for both FA and PTC than individuals with one risk allele (Fig. 3). The additive effect of rs944289 and rs2439302 was also supported by a consistent increase in effect size observed in the subgroups with increasing number of risk alleles (Supplementary Table S3).
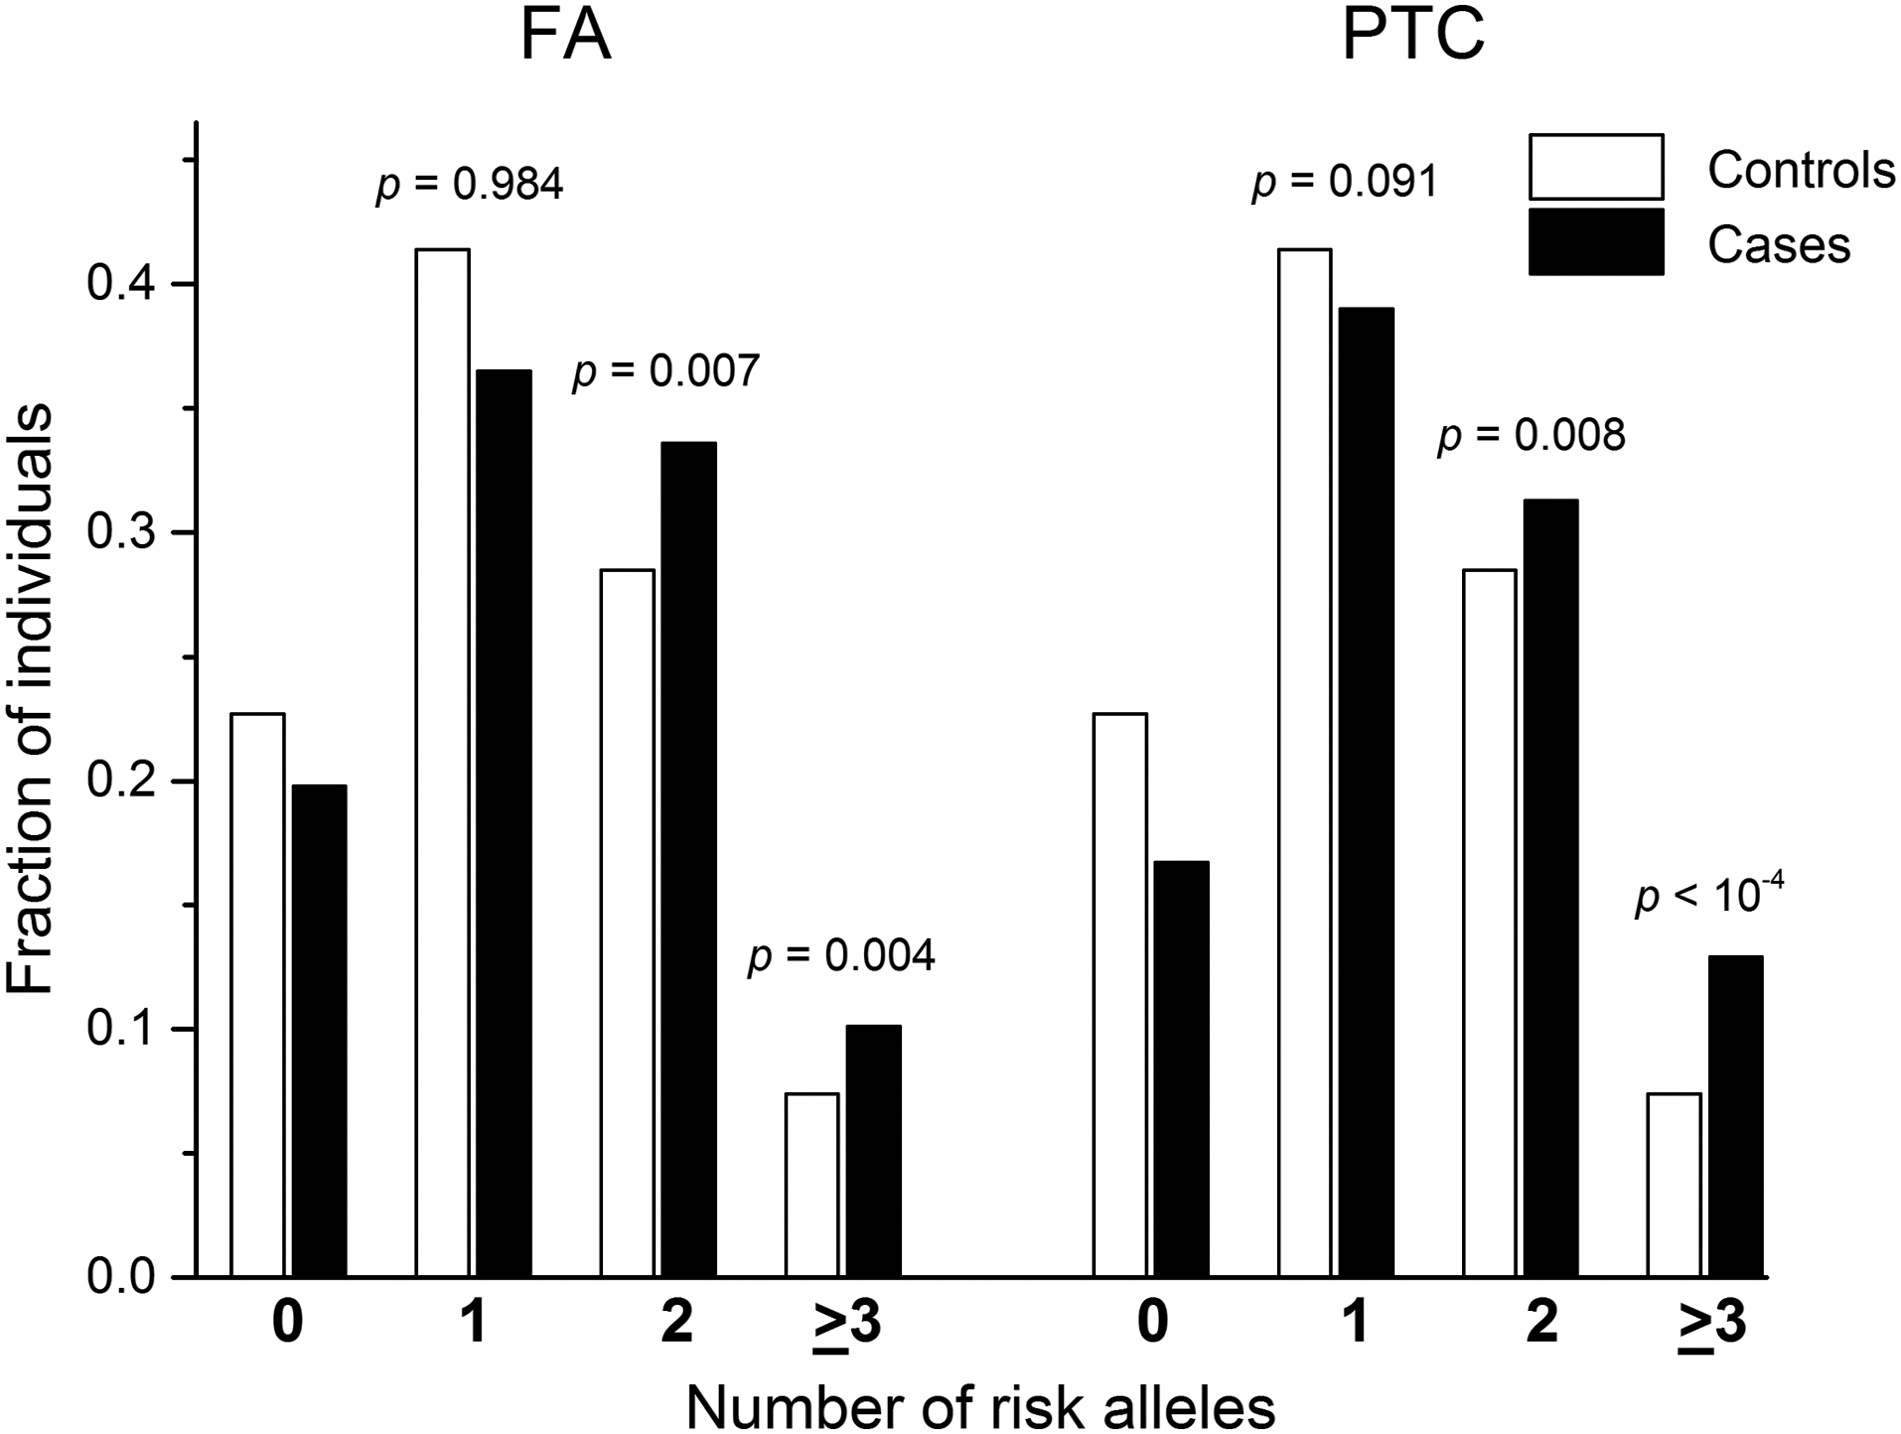
Joint effect of risk alleles of rs944289 (PTCSC3) and rs2439302 (NRG1). Distributions of risk alleles were analyzed with the chi-square test in patients with follicular adenoma (FA) or PTC and in the control individuals with known genotypes for both single nucleotide polymorphisms. The differences in allele counts between patients and controls in the subgroups with two or more risk alleles are shown in comparison with corresponding subgroups with zero risk alleles.
Discussion
Rapid progress in the identification of genetic markers of susceptibility to thyroid cancer prompted the investigation of their association with not only thyroid malignancy but also with a benign thyroid tumor, and an examination of the relationship between rs944289 and rs2439302 with expression levels of the genes they may point at: NKX2-1 and/or PTCSC3, and NRG1, respectively.
It was found that rs944289 was associated with both FA and PTC. This SNP is localized in the intergenic region of chromosome 14q13.3, and was initially proposed possibly to tag the thyroid-associated NKX2-1 gene (9). NKX2-1 encodes thyroid transcription factor 1 (TTF1), a key regulator of thyroid, lung, and brain morphogenesis (23). A relationship between reduced expression of Nkx2-1 and thyroid tumors was established in Nkx2-1 thyroid-conditional-hypomorphic mice treated with a nitrosamine-based carcinogen followed by sulfadimethoxine as a promoter, in which an increased incidence of FA was observed (24). In humans, our analysis showed no evidence of a correlation between rs944289 and NKX2-1, and of differential expression of the gene in normal and PTC tissues, indicating that this SNP is unlikely to point at NKX2-1 as at a risk factor for thyroid tumorigenesis.
In an independent functional study, rs944289 was shown to regulate expression of PTCSC3, a lincRNA gene with tumor suppressor properties in thyroid cancer cell lines (11). PTCSC3 expression was significantly downregulated in PTC compared to normal thyroid in the series, in line with the mentioned study. Restoration of PTCSC3 expression in cell lines inhibited cell growth and affected the expression of genes corresponding to three networks: (a) DNA replication, recombination and repair, gene expression, and amino acid metabolism; (b) cellular movement, tumor morphology, and cell death, and (c) cellular assembly and organization, cellular function and tissue morphology (11). Of note, all these ontological categories, except for cell motility, are well applicable to both malignant and benign tumors.
The risk allele of rs944289 [T] was shown to disrupt the C/EBPα and C/EBPβ transcription factors' binding site in the PTCSC3 promoter, and a significant difference in PTCSC3 expression was found between [TT] homozygotes and heterozygous [CT] patients (11). In the present work, a correlation could not be detected between rs944289 genotype and PTCSC3 expression. A possible explanation could be that rs944289 is not the only regulatory element of PTCSC3; there may be another SNP or a polymorphism of a different type in linkage disequilibrium with rs944289 that affects PTCSC3 expression.
A significant association of rs2439302 located in the NRG1 intron and risk for PTC and, likely, with FA was a novel finding in the Japanese population. After the initial report in thyroid cancers (12), replication studies have been performed in patients with PTC from Poland and the United States (25), and in a Chinese cohort (19). All studies were concordant in confirming an association of rs2439302 with PTC. However, no signs of association were found with benign thyroid nodules in the Chinese study (p=0.7779) (19). The reasons for the discrepancy between the latter and the present work could be that rs2439302 may associate with FA but not with hyperplastic nodule, or it may stem from ethnic differences in the genetic predisposition between the two populations.
The relative expression of NRG1 was found to be decreased by approximately 10% per each allele [G] of rs2439302 in both normal and tumor counterparts of PTC. In tumor tissue, NRG1 expression was significantly lower than in normal thyroid in the examined PTC series; this tendency was seen for all rs2439302 genotypes. Mechanistically, this could be explained by the fact that rs2439302 localizes within the CTCF (CCCTC-binding factor, a transcription factor) binding region as observed in several cell lines of nonthyroid origin (19). CTCF expression is decreased in thyroid cancer tissues, which may cause corresponding downregulation of NRG1. Alternatively, the in silico analysis suggested that NRG1 suppression in PTC may be the result of RXR/VDR (Retinoid X receptor/Vitamin D receptor) biding to negative vitamin D response elements (nVDREs) modulated by both rs2439302 and excessive RXRG and VDR levels in tumor tissues (Supplementary Fig. S2). However, additional experiments are needed to test this hypothesis.
Interestingly enough, the PTSC3 and NRG1 pathways appear to be interrelated, at least in PTC (FA tissues of appropriate quality were not available for the study). In agreement with the previous work (11), a significant positive correlation was observed between the two genes. The mechanism by which PTCSC3 modulates NRG1 expression remains unknown. NRG1 is a HER3 ligand; it can activate proliferative and survival MAPK and AKT signaling pathways under conditions causing HER2/HER3 dimer induction in thyroid cancer cells (26). The definite association of PTCSC3 and suggestive association of NRG1 with FA obtained in the present investigation imply that the pathways affected by PTCSC3 derangement are functioning not only in cancer but may also play certain role in the development of benign thyroid tumors.
In contrast to rs944289 and rs2439302 (PTCSC3 and NRG1, respectively), which associated with both PTC and FA, the two SNPs in the FOXE1 locus on chromosome 9q22.33, rs965513 and rs1867277, associated with a risk for PTC. The relationship of FOXE1 to thyroid cancer may additionally be illustrated by immunohistochemical studies of FOXE1 expression in thyroid tumors (27 –29). There has been a profound difference between staining patterns in different types of neoplastic tissues. Cytoplasmic FOXE1 staining was the strongest in medullary thyroid carcinoma, followed by PTC, then FTC and the weakest in FA. Thus, cytoplasmic translocation of FOXE1 appears to be a phenotypic hallmark of thyroid cancer.
An association between rs6983267 located on chromosome 8q24 (upstream of POU5FB1) and FA was not detected. An association with PTC in the Japanese population could also not be replicated. Yet, the effect direction (OR 1.136) was the same as in individuals of European ancestry (15,17), and an association signal of borderline significance (p=0.082) was noted. A plausible reason for the negative finding could be insufficient statistical power achievable with the available PTC series. The results, therefore, do not rule out the possibility of an association of rs6983267 with thyroid cancer in the Japanese population and need to be reexamined in a larger sample. It is also worth noting that despite no significant associations with FA being detected for rs965513 and rs1867277 (FOXE1), and rs6983267 (POU5FB1), their effects (in terms of ORs) were generally consistent between FA and PTC (Table 2), suggesting that these SNPs might also affect predisposition to FA to some extent, but their contribution is weaker compared to that seen in thyroid cancer.
In conclusion, this study demonstrates that a common genetic variant, rs944289 (PTCSC3), previously reported to be associated with thyroid cancer, also associates with FA. rs2439302 (NRG1) displayed a suggestive association with FA, and its expression level correlated with that of PTCSC3. This indicates that the mechanisms mediated by PTCSC3 and NRG1 are likely to play roles not only in carcinogenesis but more broadly in thyroid tumorigenesis. SNPs in the FOXE1 locus (rs965513, and rs1867277, the latter was newly genotyped in the Japanese population) are definitely associated with the risk for thyroid cancer.
Footnotes
Acknowledgments
This work was supported in part by research grants 24591369, 24406031, and 25257508 from the Japan Society for the Promotion of Science (JSPS).
Author Disclosure Statement
No competing financial interests exist.