
Abstract
Background:
Recent clinical studies have demonstrated the suppressive effect of selenium (Se) treatment on serum thyroid-specific antibody titers in patients with autoimmune thyroiditis (AIT), but the mechanism underlying this process is not clear. The aim of the present study was to investigate the effects of selenium on the incidence and severity of AIT, titers of thyroid autoantibodies, and selenoprotein expression in thyroid in a spontaneous autoimmune thyroiditis (SAT) model.
Methods:
NOD.H-2h4 mice at four weeks of age were randomly divided into control, iodine supplement (SAT), and selenium supplement groups (SAT+Se). Mice were given 0.005% sodium iodide water for eight weeks to induce SAT and then 0.3 mg/L sodium selenite in drinking water for 8 weeks and 16 weeks. The severity of lymphocytic infiltration in the thyroid, serum thyroglobulin antibody (TgAb) titers, serum selenium concentration, expression of glutathione peroxidase-1 (GPx1), thioredoxin reductase-1 (Txnrd1), and peroxiredoxin 5 were measured.
Results:
Serum selenium concentration significantly increased after selenium supplementation. Serum TgAb levels were significantly lower in the selenium group compared with the SAT group (p<0.05). The prevalence of thyroiditis and the degree of infiltration of lymphocytes decreased gradually over time in the group provided with selenium supplementation. The expression of GPx1 and Txnrd1 by Western blotting were found to be significantly higher in the SAT+Se group than in other groups (p<0.05).
Conclusions:
These results indicate that selenium treatment can increase the function of antioxidation by upregulating the expression of selenoproteins in the thyroid and have an inhibitory effect on TgAb titers, which may have an impact on AIT.
Introduction
T
NOD-H2h4 mice, which express I-Ak, H-2Kk, and Dd in the NOD background, develop spontaneous autoimmune thyroiditis (SAT) when given excessive iodide in drinking water. These mice are a prototype mouse model of AIT in humans (17,18). The aim of the present study was to investigate the effect of selenium on the incidence and severity of AIT, titers of thyroid autoantibodies, and selenoprotein expression in thyroid in NOD.H-2h4 mice with SAT.
Materials and Methods
Animals and experimental protocol
NOD.H-2h4 mice were purchased from the Jackson Laboratory (Bar Harbor, ME). They were bred and raised under specific pathogen-free conditions in 12 h light/12 h dark cycles in the animal facility at China Medical University. All animal care and experimental procedures were performed in accordance with the Guideline for Animal Experimentation with the approval of the Animal Ethics Committee of China Medical University (protocol number [2008]29). The mean contents of iodine and selenium in the animal chow were 460 μg/kg and 100 μg/kg, respectively.
The mice were used in experiments at four weeks of age and had a mean weight of 20 g. The 108 male NOD.H-2h4 mice were randomly divided into three groups. Those in the control group (18 mice, 6 per time point) were given sterile water. Those in the SAT group (60 mice, 20 per time point) were given 0.005% (50 mg/L) sodium iodide (NaI) in their drinking water (100 times normal iodine intake) during the study period. Those in the SAT+Se group (40 mice, 20 per time point) were given 50 mg/L NaI for eight weeks first and then 0.3 mg/L sodium selenite (three times normal selenium intake) in their drinking water for 8 weeks and 16 weeks. Mice from each group were weighed, anesthetized, and euthanized at 0 weeks, 8 weeks, and 16 weeks after the beginning of selenium supplementation (Fig. 1). Thyroid tissues were removed and then washed with cold normal saline. Then they were dried on a pad of filter paper and weighed on an electronic balance (BS210S; Sartorius, Göttingen, Germany).
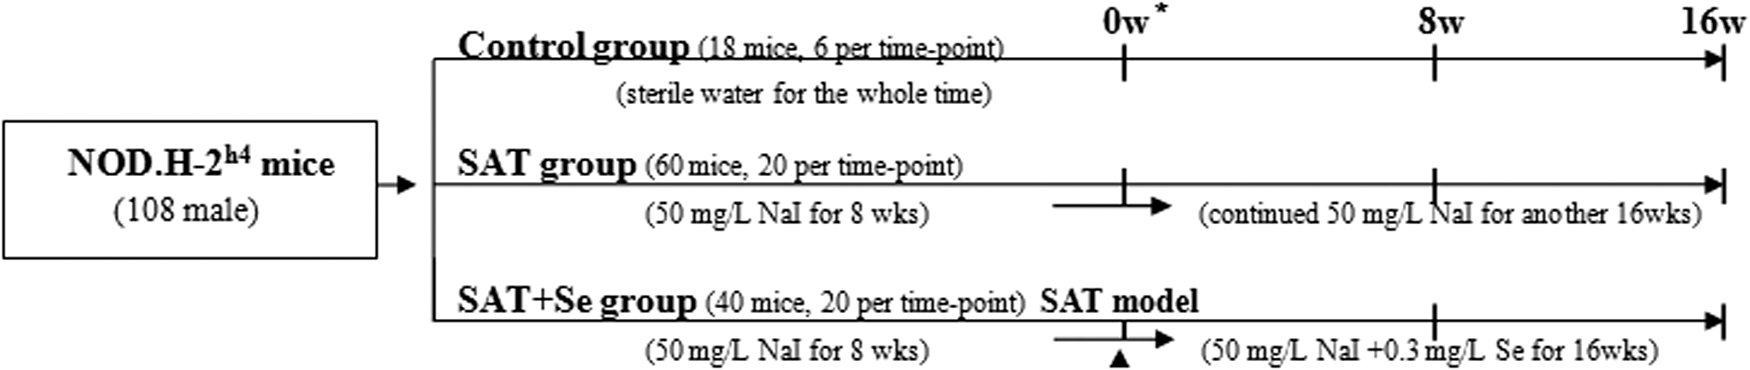
Flow chart of animal groups and procedures. *The time point (“0w”) indicates sodium iodide (NaI) supplementation for 8 weeks; “8w” and “16w” indicate selenium supplementation for 8 weeks and 16 weeks based on the iodine supplementation. ▲, SAT+Se group was given 50 mg/L NaI for 8 weeks and then 0.3 mg/L sodium selenite in drinking water for 8 weeks and 16 weeks. Mice from each group were killed at 0 weeks, 8 weeks, and 16 weeks after the beginning of selenium supplementation.
Assessment of AIT
One thyroid lobe from each mouse was fixed in 10% paraformaldehyde for at least 24 h and embedded in paraffin. Sections of 5 μm were prepared and stained with hematoxylin and eosin (H&E). Histological changes in the thyroid tissue were observed under light microscopy (BX51/BX52; Olympus, Tokyo, Japan). The extent of lymphocytic infiltration was assessed as previously described (18). Briefly, H&E-stained thyroid sections were graded on the following scale according to the approximate area of lymphocytic infiltration: 0, normal; 1+, at least 125 lymphocytic infiltration in one or several foci; 2+, up to 25% of the gland; 3+, 25–50% of the gland; 4+, more than 50% of the gland. The thyroiditis scores were expressed as means of at least three noncontiguous sections from each thyroid gland.
Serum thyroglobulin antibody measurements by enzyme-linked immunosorbent assay
Blood was collected from the heart and incubated at room temperature for at least 2 h. Serum was separated by centrifugation at 1449 g for 20 min and stored at −70°C until use.
Thyroid gland tissues were homogenized and centrifuged. Mouse Tg (MTg) was obtained from the supernatant by salting out. It was then purified by repeated gel filtration on Sephadex G-20 (Pharmacia, Kalamazoo, MI). Samples were stored at −70°C until analysis (19).
Levels of thyroglobulin antibody (TgAb) were assessed in duplicate by indirect enzyme-linked immunosorbent assay using serum from individual mice (20). Briefly, 96-well EIA/RIA Plates (Corning Inc.), were coated with 0.1 ml MTg/well overnight at 4°C. Plates were then washed and blocked with 1% bovine serum albumin (BSA). The serum sample (0.1 mL), diluted 1:100 with phosphate-buffered saline (PBS), was added to each well and incubated at 37°C for 2 h. Plates were washed and blocked with 1% BSA for 10 min. Peroxidase-labeled goat antimouse immunoglobulin G (0.1 mL; Sigma, St Louis, MO) was diluted 1:250 with PBS, added to each well, and incubated at 37°C for 30 min. After washing, 0.1 mL tetramethylbenzidine was added to each well, and the plates were incubated at room temperature for 10 min. The positive control well turned blue, and 0.1 mL 2 N hydrochloric acid was added to stop the reaction. The values of optical density (ODs) at 450 nm were measured using a microtiter plate reader (Bio-Rad 680; Bio-Rad, Hercules, CA).
Electron microscope studies
Three mice were randomly selected from each group, and one lobe of the thyroid was harvested from these mice and fixed with 2.5% glutaraldehyde at 4°C. Then, 1 mm3 of thyroid tissue was removed and fixed overnight with 1% osmic acid. The samples were dehydrated, infiltrated, and embedded with epoxy resin. They were cut into very thin (50 nm) sections, doubly stained with uranyl acetate and lead citrate, and examined under a transmission electron microscope (1200-EX; Jeol, Tokyo, Japan).
Serum selenium determination
Serum selenium concentrations were measured in duplicate using an inductively coupled plasma mass spectrometry (ICP-MS, Perkin-Elmer SCIEX ELAN 6000; Perkin-Elmer, Waltham, MA). Blood serum was diluted 40-fold with an acidic solution consisting of nitric acid (1%), X-triton (0.1%), and 1-butanol (0.8%). A calibration curve was established for 1–400 μg/L (r 2>0.99). The limit of detection was 0.5 μg/L. The between-run coefficient of variation (CV) was 6.59% and the within-run CV was <2%.
Protein determination and Western blotting
Five animals from each group were used for protein detection by Western blotting. After dissection, thyroid lobes were quickly frozen in liquid nitrogen and stored at −80°C. Frozen lobes were homogenized in PBS (pH 7.4) supplemented with 0.05% Triton X-100 and protease inhibitor cocktail (Sigma). The protein concentration was determined using the Bradford method using BSA as standard. SDS-PAGE was performed using 30% acrylamide (Sigma). After electrophoresis, gels were equilibrated for 20 min in transfer buffer (25 mM Tris, 190 mM glycine, and 20% methanol). Proteins were transferred onto polyvinylidene difluoride membranes (0.5 h, 30 V), which were then incubated with a blocking solution (5% dried skim milk in 100 mM Tris [pH 7.5] with 140 mM NaCl and 0.01% Tween 20) for a minimum of 1.5 h. The blots were then incubated overnight at 4°C with a mouse monoclonal anti-Prdx5 antibody (1:800; Abcam, Cambridge, United Kingdom), a polyclonal rabbit anti-GPX1 antibody (1:800; Abcam), a polyclonal rabbit anti-Txnrd1 antibody (1:100; Santa Cruz, Dallas, TX), or a polyclonal rabbit anti-β-actin (1:1000) on the same membrane. After washing three times with the blocking solution, the blots were incubated with diluted horseradish peroxidase-conjugated secondary antibodies (1:1000; Bio-Rad) for 1.0 h at room temperature. Blots were washed extensively and developed using an enhanced chemiluminescence kit (Amersham Pharmacia Biotech, Piscataway, NJ). Western immunoblot bands were quantified by means of a Bio-Rad calibrated densitometer (GS-800) using the vendor's software. β-actin served as an internal control in all analyses.
Statistical analysis
Data were analyzed using SPSS for Window v16.0 (SPSS, Inc., Chicago, IL). All results are expressed as the mean value±standard deviation (SD). Two-way analysis of variance (ANOVA) was used to compare the effect of selenium and the time of treatment. One-way ANOVA was used to compare multiple groups. Bonferroni test was applied for pairwise comparisons. p-Values <0.05 were considered statistically significant.
Results
Weight of thyroid
As shown in Table 1, there was no significant difference in the weights of the thyroids within the control group at any of the examined time points. The weights of the thyroids in the SAT group increased gradually as iodine supplementation continued, becoming significantly higher than in the control group (p<0.01). The enlarged thyroids appeared slightly peachy in color and were firm in texture. The weights of the thyroids in the SAT+Se group became significantly lower than in the SAT group (p<0.05). Although the body weight of mice increased gradually with age, no significant differences were observed in these three groups. The relative weights of the thyroids (mg/100 g body weight) in the selenium-treated group were decreased compared with the SAT group (p<0.05).
The number of animals (n) is in parentheses. Values are expressed as the mean±SD. Two-way analysis of variance (ANOVA) revealed significant differences of thyroid weights between all the groups (p<0.05). One-way ANOVA was used to compare multiple groups at the same time point.
p<0.05 vs. control at the same time point.
p<0.05 vs. SAT at the same time point.
Serum TgAb titers
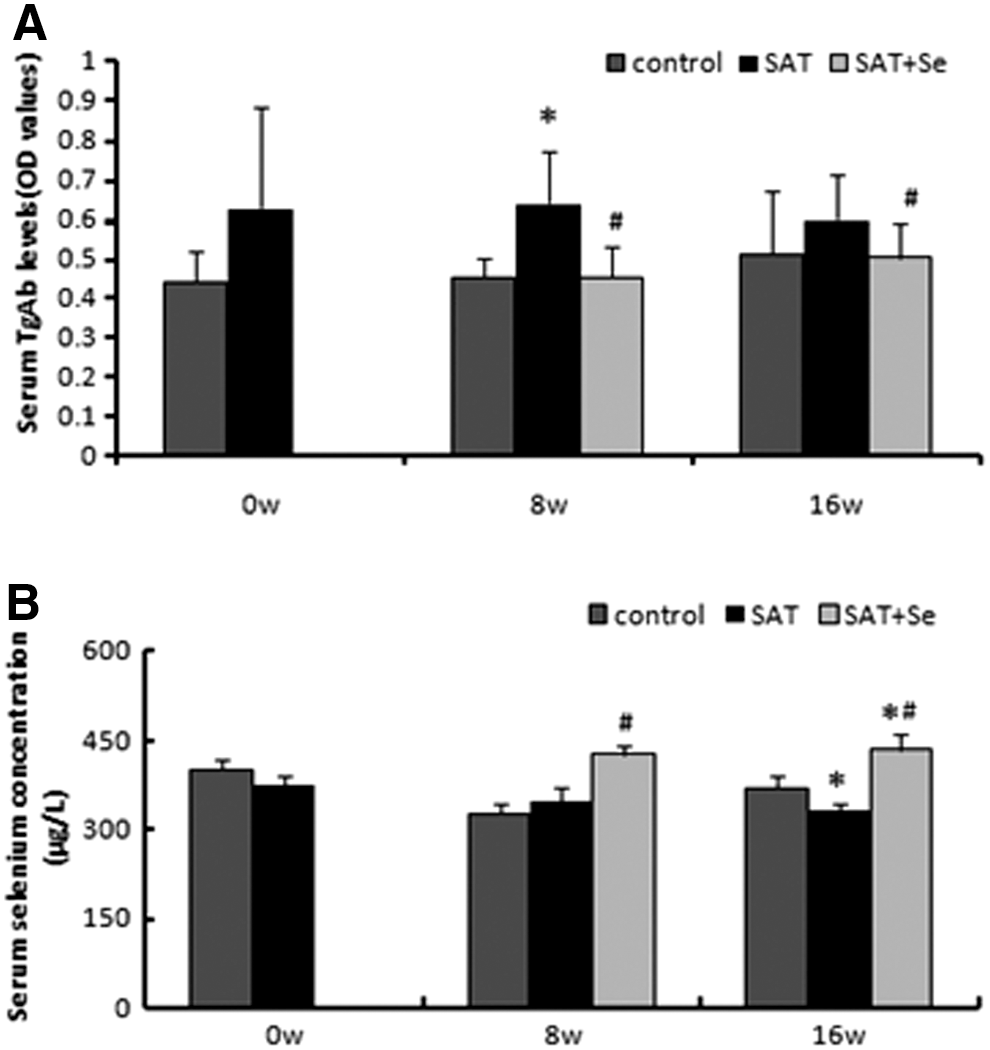
Serum TgAb titers in the control group remained relatively stable at the examined time points (Fig. 2A). At eight weeks, serum TgAb titers were significantly higher in the SAT group than in the control group (p<0.05). At 16 weeks, serum TgAb titers in the SAT group remained high (0.66±0.13). However, there was a significant decrease in serum TgAb concentrations after eight weeks of selenium treatment (p<0.01). Another more profound decrease was observed after 16 weeks of selenium treatment compared with the SAT group (p=0.037). There was no significant difference in TgAb titers between the control group and the SAT+Se group at any point in time.
(
Serum selenium concentration
The serum selenium level was higher than baseline after eight weeks of selenium treatment (425.1±13.9 μg/L vs. 372.0±15.6 μg/L, respectively; p<0.05; Fig. 2B). The concentration of selenium in the serum was significantly higher in the selenium supplementation group than in the control and SAT groups at every evaluated time point (425.1±13.9 μg/L, 324.5±17.6 μg/L, and 345.6±23.4 μg/L, respectively, at 8 weeks, p<0.05; 432.6±26.6 μg/L, 368.8±21.1 μg/L, and 331.4±11.4 μg/L, respectively, at 16 weeks, p<0.01).
Histomorphology of thyroid under light microscopy
Prevalence of thyroiditis
The incidence of thyroiditis ranged from 16.7% to 50% in the control group during the experiment. In the SAT group, lymphocytic infiltration was observed in the thyroid in about 80% of NOD.H-2h4 mice after 8 weeks and 90% after 16 weeks of iodine supplementation. In the SAT+Se group, there was less lymphocytic infiltration in the thyroid than in the SAT group at both 8 and 16 weeks into selenium treatment. The prevalence of thyroiditis was about 50% during selenium supplementation (Table 2).
Results are the percent (case numbers/total numbers) in each group.
Morphologic features of thyroid tissue and the thyroiditis scores under light microscopy
In the control group, thyroid follicles were relatively uniform and moderately sized in the center and larger in the periphery. Moderate amounts of pink colloid were observed in the follicular cavities. Follicular epithelial cells looked like cubes or tall cylinders and formed a monolayer with round or elliptical nuclei in the centers of the cells (Fig. 3, control). The thyroiditis scores ranged from 0 to 1+ in the control group (Table 3). In the SAT group, the follicular cavities were found to be enlarged and large amounts of colloid were in the cavities. The follicular epithelial cells and their nuclei were flat in shape (Fig. 3, SAT). The scores of thyroiditis ranged from 1+ to 3+. Lymphocytic infiltration became more severe (2+ to 4+) as iodine treatment continued. The average score of thyroiditis was 1.4 at 8 weeks and 1.95 at 16 weeks (Table 3). In the SAT+Se group, follicular cavities were smaller, and there was less pink colloid material (Fig. 3, SAT+Se). The thyroiditis scores ranged from 1+ to 3+, and the average score was 0.85 with selenium treatment. At 16 weeks, the average scores of thyroiditis in the SAT+Se group and control group were significantly lower than in the SAT group (p<0.05).

Representative histographs of hematoxylin and eosin (H&E)-stained thyroid sections from different groups at 8 weeks and 16 weeks of selenium supplementation (H&E×200). Control mouse, severity score=0. SAT mouse, 3+ severity score. Lymphocytic infiltration (see the arrows) is accompanied by enlargement and destruction of thyroid follicular cells. SAT mouse treated with Se, 1+ severity score. Thyroid follicles are restored as compared to SAT mice of the same age.
0 1+2+3+4+5+shows the thyroiditis scores; the number in each group is the case number. A shows the average scores.
p<0.05 vs. SAT at the same time point.
Ultrastructure of the thyroid under electron microscopy
In the control group, the ultrastructure of the thyroid was complete, and only slight mitochondrial swelling and dilatation of the endoplasm reticulum was observed in the epithelial cells with growth and age (Fig. 4). Compared with the control group, the SAT group had more secondary lysosomes, and peroxisomes increased in the epithelial cells. The endoplasmic reticula were hypertrophied with dilated cisternae, the mitochondria were swollen, and microvilli were less developed than in follicular cells of control thyroids. Nuclei were irregular. Lymphocytic infiltration was observed. After 24 weeks of iodine supplementation, the rough endoplasmic reticulum was notably dilated, there was an increase in swollen mitochondria, mitochondrial cristae were blurred or vacuolated, and giant mitochondria were present. Condensation of nuclear chromatin, karyopyknosis, karyolysis, and karyorrhexis were also observed. In the SAT+Se group, the nucleus was relatively intact, and the endoplasmic reticulum appeared in the form of thin strips. The thyroid ultrastructure showed less damage. The severity of ultrastructural changes of the thyroid under electron microscopy in different groups was shown in Table 4.

Representative ultramicrostructure of electron microscope sections of thyroid cells from the different treatment groups at 8 weeks (
Expression of antioxidant enzymes under Western blotting
GPx1 expression increased gradually as selenium supplementation continued (Fig. 5A and B). The expression of GPx1 was significant higher in the SAT+Se group than in the SAT group at 8 and 16 weeks (8 weeks, p=0.012; 16 weeks, p=0.017). There was no significant difference between the SAT+Se group and the control group.
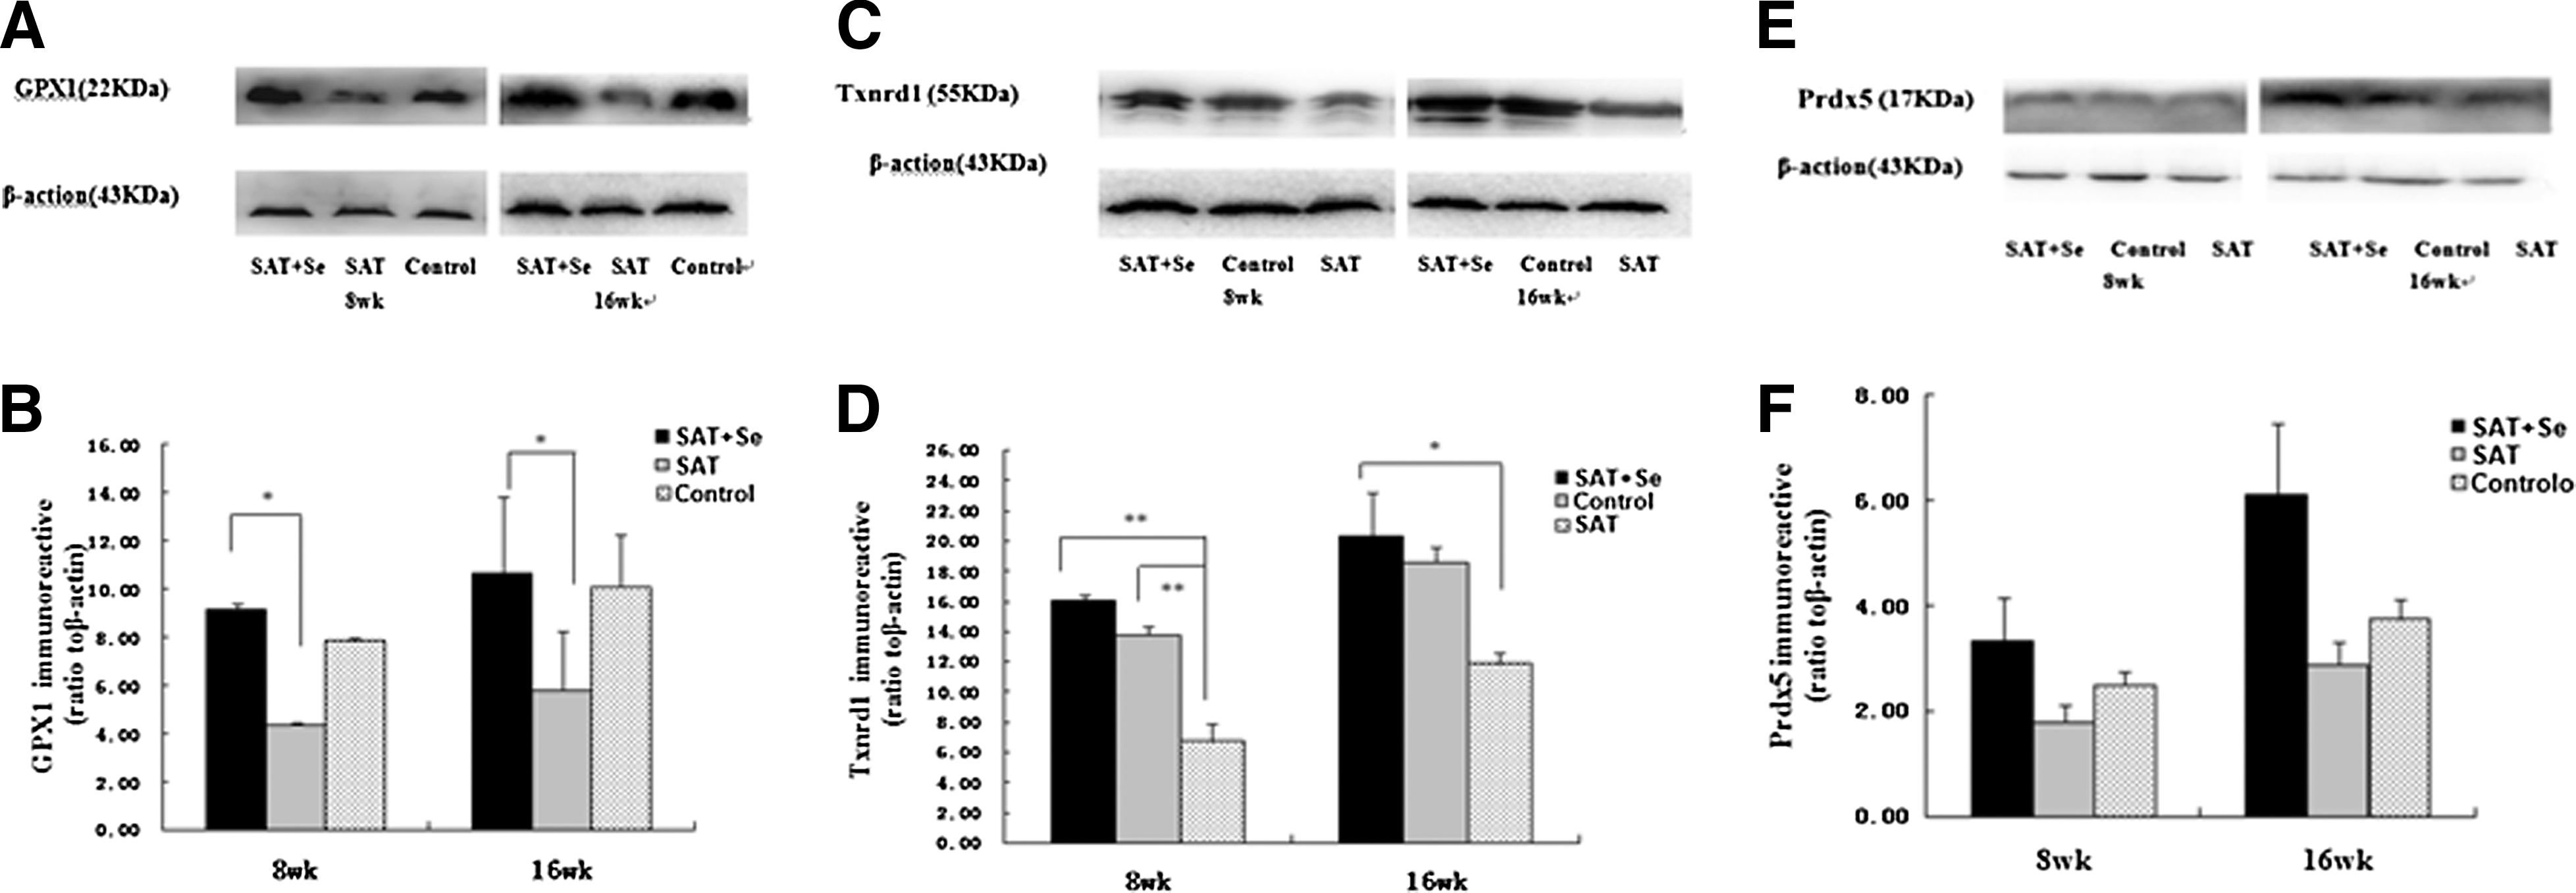
The expression of antioxidant enzymes analyzed by Western blotting. (
Txnrd1 expression increased gradually as selenium supplementation continued (Fig. 5C and D). After eight weeks of selenium supplementation, the expression of Txnrd1 in the SAT+Se and control groups was significantly higher than in the SAT group (8 weeks, p=0.001l 16 weeks, p=0.026 in the SAT+Se group; 8 weeks, p=0.003 in the control group).
The expression of peroxiredoxin 5 (Prdx5) also increased after selenium supplementation, but there was no statistically significant difference between the three experimental groups (Fig. 5E and F).
Discussion
Recent interventional studies have suggested that selenium combined with levothyroxine (LT4) may be an effective means of treating patients with AIT (9 –16). It is still unclear whether the effects of selenium in AIT are achieved by altering the expression of selenoproteins in interstitial cells, endothelial cells, or the immune cells that infiltrate the thyroid. Because there has been no investigation of the potential mechanisms of selenium supplementation in animal models of AIT, an investigation of NOD-H2h4 was performed in mice. This is a model susceptible to the development of SAT. It was used to investigate whether supplementation with selenium would have any effect on the incidence or severity of AIT, titers of thyroid autoantibodies, selenoprotein expression, or the status of reduction-oxidation, and to characterize potential mechanisms of selenium supplementation in thyroid tissue of NOD.H-2h4 mice with SAT.
Although NOD.H-2h4 mice are well-known as a suitable AIT model, the exact mechanism inducing thyroiditis in this model remains unknown. In the present study, SAT was induced in NOD.H-2h4 mice by exposure to NaI in their drinking water, as described previously (17). The vast majority of these mice (80%) had lymphocytic infiltration of the thyroid with severity scores of 1+ to 3+ and higher thyroid weight and serum TgAb titers than control mice. The ultrastructural changes caused by excessive iodine included dilatation of the rough endoplasmic reticulum, mitochondrial swelling and cavitation, increases in the number of peroxisomes and secondary lysosomes, and apoptosis and necrosis of epithelial cells. Many et al. (21) observed the same phenomenon and pointed out that the nature of the ultrastructural alterations is consistent with a mechanism of toxicity involving a free radical attack and lipid peroxidation as observed in other tissues. Vitale et al. also found that excess iodide, generated by oxidation of ionic iodine by endogenous peroxidases, induces apoptosis in thyroid cells through a mechanism involving generation of free radicals (22). The authors have previously speculated that iodine directly damages the structure of thyroid epithelial cells and causes the release of free radicals and chemokines (17). This presumably attracts inflammatory cells, including dendritic cells, macrophages, T cells, and B cells.
Selenium, an essential trace element, acts on endocrine systems. Because the concentration of selenium is higher in the thyroid than in other organs (2), selenium influences thyroid function and thyroid hormone homeostasis through selenoproteins, especially three well-characterized selenoprotein families: glutathione peroxidases, thioredoxin reductases, and iodothyronine deiodinases. These selenium-dependent enzymes act as antioxidants and modify redox status and thyroid hormone metabolism. They may protect the thyroid gland from peroxidative damage. Thyrocytes produce hydrogen peroxide (H2O2), which is essential for thyroid peroxidase (TPO) activity and iodide oxidation. But when large amounts of H2O2 are generated, the gland is exposed to radical oxygen species (ROS) damage (23). This situation needs an efficient antioxidative response against excessive H2O2 formed by the dual oxidases. These peroxidases defend the follicular cells from H2O2 and other ROS (24 –27). Supplemental selenium can increase the activity of these selenoproteins and antioxidative enzymes and correct the unbalanced oxidative/antioxidative system (28). Chiu-Ugalde et al. concluded that selenoproteins protect thyrocytes from oxidative damage and modulate thyroid hormone biosynthesis but are not essential to thyrocyte survival (29). In the current study, treatment with selenium via drinking water increased the expression of serum selenium and selenoproteins, which included GPx1, Txnrd1, and Prdx5.
The increased oxidative stress in all inflamed tissues increases NF-kB translocation, leading to an enhanced chemokine mRNA expression. Selenium brings into play its immune-modulating effect by reducing NF-kB translocation and thereby preventing an excessive immune response (27,30,31). Vunta et al. found that selenium supplementation increases the production of 15d-PGJ2 as an adaptive response to protect cells against oxidative stress-induced pro-inflammatory gene expression (32). In this way, Se-dependent enzymes are implicated in both antioxidative response by their catalytic activities and anti-inflammatory effects indirectly by modulating redox-dependent transcription. In clinical trials, 200 μg selenium per day suppressed anti-TPO antibody (TPOAb) levels in patients with AIT. Similar results were produced in the current study. In a clinical study performed by the authors' group (33), TPOAb levels showed an overall decrease of 4.3% at three months and of 12.6% at six months (p<0.05) post-supplementation in subclinical AIT patients. The present results are consistent with these previous clinical studies. In mice, selenium treatment decreased TgAb titers significantly (34). The concentration of selenium in the serum was significantly higher after selenium supplementation. The expression of antioxidant enzymes such as GPx1, Txnrd1, and Prdx5 increased significantly as selenium supplementation continued. The present study also shows a decrease in the severity of lymphocytic infiltration in thyroids after selenium treatment. Ultrastructural alterations associated with selenium supplementation include the fact that the nucleus was relatively intact, the endoplasmic reticulum was visible in the form of thin strips, and the ultrastructure of the thyroid showed less damage. These results suggest that the antioxidant capacity has been enhanced after selenium supplementation. These combined effects are elicited maybe because the antioxidant enzymes can reduce hydrogen peroxides, lipid and phospholipd hydroperoxides, and thereby impede the formation of free radicals and ROS. Lower hydroperoxide tissue concentrations diminish the production of inflammatory factors. These mechanisms might contribute to a reduced inflammatory activity in organ-specific autoimmune response and explain the improvement of the inflammatory activity in model with SAT and patients with AIT under selenium treatment (27). The exact molecular mechanism of selenium on the modulation of AIT is still unknown, and further study is required to clarify it.
In conclusion, in the NOD.H-2h4 mouse model of SAT, selenium supplementation had a suppressive effect on TgAb titers and a therapeutic effect on AIT. The benefit of selenium treatment may be due to the increase of antioxidation by upregulating the expression of selenoproteins in the thyroid.
Footnotes
Acknowledgments
The authors would like to thank Professor Fuhui Zhang (Laboratory of Electron Microscopy Center, China Medical University) for his continual support. This work was supported by grants from the National High Technology Research and Development Program of China (863 Program, No. 2007AA02Z4Z1), Special Research Fund for Doctor Discipline Unit of the Ministry of Education (No. 20070159007), Key Laboratory Project of Liaoning Province (No. 2008S225), and Science and Technology Program of Shenyang (No.F11-262-9-23).
Author Disclosure Statement
We hereby confirm that this manuscript has not been published and is not being considered for publication elsewhere. By signing this letter, each of us acknowledges that he or she participated sufficiently in the work to take public responsibility for its content. We state that we have no potential conflict of interest.