
Abstract
Background:
The association of BRAFV600E with the clinical manifestations of papillary thyroid carcinoma (PTC) remains controversial. Recent studies have shown that the BRAF pseudogene can activate the MAPK pathway and induce tumorigenesis. This study investigated the association of BRAFV600E , the BRAF pseudogene, and their mRNA levels with clinical features and thyroid-specific gene expression in conventional PTCs.
Materials and Methods:
A total of 78 specimens were collected from patients with conventional PTCs. RNA was isolated, and quantitative polymerase chain reaction was used to measure the mRNA levels of BRAF, the BRAF pseudogene, and thyroid-specific and tumor-related genes. Immunohistochemical (IHC) staining of BRAF, ERK, sodium–iodide symporter (NIS), thyrotropin receptor, glucose transporter 1, and Ki67 was also performed.
Results:
BRAFV600E and the BRAF pseudogene were detected in 73.0% (57/78) and 91.7% (44/48), respectively, of the conventional PTCs. The presence of BRAFV600E was not associated with the multiple clinical features assessed or the recurrence rate during 76.9 ± 47.2 months of follow-up. Neither was it associated with IHC staining or tumor-related/thyroid-specific gene expression, except for decreased NIS gene expression. The BRAF pseudogene was not associated with clinical characteristics or thyroid-specific gene expression, except for decreased decoy receptor 3 (DCR3) expression. High BRAF mRNA levels were associated with bilateral and multifocal lesions, and BRAF-pseudogene mRNA levels were positively correlated with BRAF mRNA levels (r = 0.415, p = 0.009).
Conclusion:
These results do not support the use of the BRAFV600E mutation as a prognostic marker of conventional PTC. However, the association of high BRAF mRNA levels with more advanced clinical features suggests that BRAF mRNA levels might be a more useful clinical marker of PTCs, independent of the BRAFV600E mutation status. The correlation between BRAF-pseudogene mRNA levels and BRAF mRNA levels in PTCs is in agreement with the hypothesis that the BRAF pseudogene regulates BRAF expression during tumorigenesis by acting as competitive noncoding RNA. However, additional studies with larger sample sizes are required to confirm these findings.
Introduction
P
Thyroglobulin (TG), thyroid peroxidase (TPO), thyrotropin receptor (TSHR), and sodium-iodide symporter (NIS) genes are crucial for thyroid hormone synthesis and can be used as markers of differentiated thyroid cell function (2). Some studies have observed decreased expression of these genes in PTCs harboring the BRAFV600E mutation, suggesting that PTCs carrying this mutation are susceptible to dedifferentiation (13 –15). Glucose-transporter 1 (GLUT1), a gene associated with increased glucose metabolism in various cancers, is overexpressed in PTCs with the BRAFV600E mutation (2,15). Matrix metalloproteinases (MMPs) are genes associated with tissue remodeling and metastasis (16). Rajoria et al. suggested that MMP-2 and MMP-9 play roles in the metastasis and aggressiveness of thyroid cancer (17). Decoy receptor 3 (DCR3), a soluble factor in the tumor necrosis factor (TNF) superfamily, prevents FasL-induced cell apoptosis (18). Some studies have demonstrated that DCR3 is overexpressed in various malignancies, including lung, gastric, and pancreatic cancers, and is regarded as a tumorigenic factor (18,19). Ki67 is a nuclear protein associated with cell proliferation. It is expressed during all active phases of the cell cycle but not in resting cells, and Ki67 therefore represents an excellent marker for determining the growth fraction of a given cell population. The Ki67 labeling index is correlated with the clinical course of some cancers (20,21). Currently, information on the associations of DCR3, MMPs, and Ki67 in PTCs with the BRAFV600E mutation is limited.
Thus far, two BRAF genes have been identified. One is the well-known BRAF gene, which is located in the chromosomal region 7q34 and encodes a functional 94-kDa BRAF protein. The other is the BRAF pseudogene, which is located in the chromosomal region Xq13 and has a sequence similar to that of BRAF (93% homology); this gene is not translated into a functional protein (22). Zou et al. first reported that the BRAF pseudogene may act as a potent stimulator of the MAPK pathway and can induce tumorigenesis (23). Recently, Karreth et al. further established that the BRAF pseudogene functions as competitive endogenous RNA for BRAF (24). In that study, the sequestration of microRNAs resulted in increased BRAF gene expression and lymphoma formation in mice (24). Both aforementioned studies suggest that the BRAF pseudogene plays a crucial role in tumorigenesis.
Most studies to date have included various aggressive subtypes of PTC, which might have created statistical biases that led to the conflicting results. To understand the role of the BRAFV600E mutation in clinical manifestations of PTC and thyroid-specific gene expression, this study recruited 78 patients with conventional PTCs to determine differences in clinical presentation and specific gene/protein expression between PTCs with or without the BRAFV600E mutation. The relationships among BRAF mRNA levels, BRAF pseudogene transcripts, and clinical/specific gene expression were also investigated.
Materials and Methods
Patients and tissue preparation
Seventy-eight specimens of patients with conventional PTCs were collected during surgery at the Department of General Surgery, Taipei Veterans General Hospital, from April 1999 to December 2009. To prevent the contamination of tumor tissues with normal thyroid tissues, all tumors were incised, and only the cores of the tumor samples were retrieved by the surgeon. Among the 78 patients studied, paired normal tissues of 48 patients were available for comparative analysis. Normal tissues were obtained from the normal contralateral lobe in unilateral PTCs or the distal margin of tumor-free areas in bilateral or multifocal PTCs. All tissues were stored in liquid nitrogen at the Tissue Bank of the Department of Medical Research and Education and as paraffin blocks at the Department of Pathology until the experiments were conducted. Excised tumors were routinely examined by pathologists at the Taipei Veterans General Hospital, and all tumors were determined to be conventional PTCs. Tumor staging was conducted according to the 2002 TNM system of the American Joint Committee on Cancer (25). All patients were euthyroid with normal serum thyrotropin (TSH) levels at the time of surgery. The study protocol was approved by the hospital's Institutional Review Board, and written informed consent was obtained from all patients before their participation.
The patients were regularly followed up according to the 2009 American Thyroid Association thyroid cancer management guidelines (26). Briefly, patients were administered 30–100 mCi 131I for ablation two months after a total or near-total thyroidectomy. A post-ablation whole-body scan (WBS) was performed five to eight days after radioiodine administration at the author's hospital or an affiliate institution. Subsequently, all patients were administered levothyroxine (T4) for TSH suppression. Serum TG levels of patients who were negative for TG antibodies were regularly measured. After T4 withdrawal or human recombinant TSH stimulation, a WBS was performed for all patients 6–12 months after the initial PTC treatment and for those suspected of having recurrent disease. Recurrent disease was defined as follows: TG levels >2 ng/mL, tumor detected by imaging studies (including WBS, neck ultrasound, computed tomography, or magnetic resonance imaging), and/or confirmation by cytological or pathological examination. Patients were followed up for 76.9 ± 47.2 months, and clinical data were collected for analysis.
Purified RNA and first-strand cDNA preparation
Total RNA was isolated from tissues by using RNAzol B (Biotex Laboratories, Houston, TX), as previously described (27). RNA was dissolved in 30 μL of diethylpyrocarbonate (DEPC)-treated water at 65°C and mixed with 2 μL each of 10× DNase buffer and DNase at 37°C for 10 min. Subsequently, 4 μL of the stopping reagent was added at room temperature, and the solution was left for 5 min. After centrifugation at 1000 g at 4°C for 4 min, the supernatant containing the purified RNA was collected and stored at −80°C until further analysis. The first-strand cDNA of the purified RNA was prepared using a first-strand cDNA synthesis kit (Amersham Pharmacia Biotech, Piscataway, NJ). Briefly, 5 μg of the purified total RNA was mixed with 45 mM of Tris (pH 8.3), 68 mM of KCl, 15 mM of dithiothreitol (DTT), 9 mM of MgCl2, 0.08 mg/dL of bovine serum albumin (BSA), 1.8 mM of dNTP, murine reverse transcriptase, and random hexadeoxynucletide primers. Reverse transcription was performed at 37°C for 60 min and stopped by heating the mixture to 95°C for 5 min. The first-strand cDNA was stored at −20°C until the experiments were conducted.
Polymerase chain reaction
BRAFV600E
, the BRAF pseudogene, and RET/PTC1 were polymerase chain reaction (PCR) amplified, as previously described (23,28). Briefly, the templates were mixed with 5 μL of 10× PCR buffer, 3 μL of MgCl2 (1.5 mM), 0.5 μL of dNTP (0.2 mM), 1 μL of the primers, and 0.3 μL of Taq DNA polymerase (1.5 IU/50 μL; Fermentas, Lithuania). The PCR conditions for BRAFV600E
, the BRAF pseudogene, and RET/PTC1 were as follows: denaturation at 94°C for 30 sec, annealing at 55°C for 30 sec, extension at 72°C for 30 sec for 30 cycles, and a final extension at 72°C for 7 min. The PCR products were purified using a gel extraction kit (Qiagen, Hilden, Germany), and the purified products were sequenced using the BigDye terminator kit (Applied Biosystems, Foster City, CA). The sequencing conditions were as follows: initial denaturation at 96°C for 2 min, followed by 25 cycles of denaturation at 96°C for 10 sec, annealing at 50°C for 5 sec, and an extension at 60°C for 4 min. The products were then analyzed using an automated sequencer (Prism 7370; Applied Biosystems). The sequence data of BRAFV600E
and BRAFWT
are shown in Supplementary Figure S1 (panel A and panel B, respectively; Supplementary Data are available online at
Quantitative real-time PCR
For the quantitative real-time PCR (Q-PCR) of NIS, TPO, TSHR, MMP-2, MMP-9, GLUT1, BRAF, the BRAF pseudogene, and glyceraldehyde 3-phosphate dehydrogenase (GAPDH), 200 ng of cDNA was added to 12 μL of a buffer containing 10 μL of SYBR green reagent (Roche 04913914001) and 1 μL each of the forward and reverse primers (6 μM) to obtain a total volume of 20 μL. The mixtures were amplified in the real-time PCR instrument (Roche LC480) under the following conditions: initial step at 50°C for 2 min, followed by 95°C for 15 min and 45 cycles of melting at 95°C for 15 sec, annealing at 55°C for 1 min, and extension at 72°C for 30 sec. For the Q-PCR of DCR3 and GAPDH, 10 μL of Taqman (ABI 4304437) was added to 1 μL each of the primers and probes of DCR3 (Hs00187070_m1; Applied Biosystems) and GAPDH (Hs9999905_m1; Applied Biosystems). In each experiment, a standard curve was used to estimate the PCR efficiency, and dissociation curves were performed to check the absence of nonspecific amplification and primer–dimer formation. The quantity of each product was measured using the formula 2−ΔΔCt, where ΔΔCt = ΔCt (unknown) – ΔCt (calibrator).
DNA extraction from paraffin-embedded tissues
Genomic DNA was extracted from paraffin-embedded tissues by using a previously described heating protocol (29). Briefly, 500 μL of 0.1 M NaOH was added to two 10 μm tumor sections and heated at 100°C for 20 min. After cooling for 5 min, 500 μL of phenol:chloroform:isopropanol alcohol (25:24:1; Invitrogen Life Technologies, Carlsbad, CA) was added and mixed. The upper layer of the supernatant was collected after centrifugation, and the same volume of chloroform was added. After mixing and centrifuging, the upper layer of the supernatant was collected, and 0.1 volume of 3 M sodium acetate was added. Subsequently, one volume of isopropanol was added, and the sample was incubated at −20°C overnight. The DNA pellet was collected and washed with 75% ethanol.
Immunohistochemistry
Immunohistochemical (IHC) staining of the PTC tissue was performed using labeled streptavidin–biotin (LSAB 2 kit; DAKO, Carpinteria, CA), as previously described (30,31). Briefly, 2 μm paraffin sections were prepared on silane-coated microslides and deparaffinized in xylene solution (Paraclear; Earth Safe Industries, Inc., Belle Mead, NJ) for 15 min. After rehydration in a graded (95%, 80%, and 50%) alcohol series, the sections were microwaved in 0.01 M of sodium citrate buffer for 15 min. The sections were then immersed in 3% H2O2 for 30 min, followed by 0.025% Triton for 10 min. The sections were blocked using 10% normal goat serum containing 1% BSA for 2 h and then incubated at 4°C overnight with the following primary antibodies: BRAF, 1:200 dilution (SC-9002; Santa Cruz Biotechnology, Dallas, TX); total ERK1 (tERK1), 1:100 dilution (SC-93; Santa Cruz Biotechnology); NIS, 1:200 dilution (#442; a gift from Prof. Sissy M. Jhiang, Ohio State University, Columbus, OH); GLUT1, 1:200 dilution (RB-9052; Thermo Scientific, Waltham, MA); TSHR, 1:100 dilution (Abcam, Cambridge, MA); and Ki67, 1:100 dilution (GTC16667; GeneTex, Irvine, CA). After washing, the sections were incubated with an anti-goat IgG–biotin conjugate (Santa Cruz Biotechnology) for 12 min, followed by strepavidin–horseradish peroxidase (HRP; EnVision DAB kit; DAKO) for 12 min. The sections were then immersed in buffered saline at 95°C for 5 min and incubated with strepavidin–HRP at room temperature for 15 min. The sections were washed thoroughly between incubations. For peroxidase activity determination, the sections were incubated with 3,3-diaminobenzidine (DAB; DAKO) for 25 min in the dark. Finally, the sections were counterstained with hematoxylin and eosin for histological examination. The IHC results were quantified according to previously described scoring systems (13,28,32). The BRAF and ERK1 scores were assigned as follows: 0, no staining; 1+, focal 1–9% staining; 2+, intermediate staining between 1+ and 3+; and 3+, diffuse staining (>50%) (28). The TSHR scores were assigned as follows: 0, no staining; 1+, focal 1–20% staining; 2+, intermediate staining between 1+ and 3+; and 3+, diffuse staining (>50%) (33). The NIS scores were assigned as follows: 0, negative; 1, absent or not interpretable; 2, weakly positive; and 3, strongly positive; a positive staining of the cell membranes of >10% of the cells indicated the presence of intracellular staining, with the score being considered strongly positive (13). The GLUT1 scores were assigned as follows: 0, no staining; 1+, weak staining; 2+, moderate staining; and 3+, intense staining (32). Ki67 staining was defined as positive if >1% of the cells showed nuclear staining.
Statistical analyses
Statistical analysis was performed using SPSS v13.0 for Windows software (SPSS, Inc., Chicago, IL). The values calculated are expressed as mean ± standard deviation (SD) or the median (range). Chi-square or Fisher's exact tests were used to analyze the relationship of BRAFV600E or the BRAF pseudogene with the clinical parameters and IHC results. Furthermore, PTC tissues were arbitrary divided into the following groups based on BRAF and BRAF-pseudogene mRNA levels: low and high BRAF mRNA groups and low and high BRAF-pseudogene mRNA groups, respectively. These groups were compared with various clinical parameters. Independent t-tests were used to determine differences in continuous data between BRAFV600E and wild-type BRAF (BRAFWT ), between the high and low BRAF mRNA groups, and between the high and low BRAF-pseudogene mRNA groups. The nonparametric test was used to assess differences in gene expression and clinical features between tumors with and without the BRAF pseudogene (BRAF pseudogene-positive and negative tumors, respectively). The Kaplan–Meier method was used to analyze time-dependent variables. A two-sided p < 0.05 was considered statistically significant.
Results
Relationship between BRAFV600E mutation and clinical features at the time of surgery
The 78 patients (62 women; 79.5%) had a mean age of 46.6 ± 12.4 years (range 18–80 years), with a mean tumor size of 2.2 ± 1.2 cm (range 0.4–6.0 cm). Mutational studies showed that the PTCs of 57/78 (73.0%) patients harbored BRAFV600E and that the PTCs of only three patients harbored a RET/PTC1 mutation (two patients were BRAFWT and one was BRAFV600E ). When comparing the relationships between the BRAFV600E mutation and the clinical characteristics/staging of the 78 patients (Table 1), no statistically significant differences were observed in age, sex, tumor size, extrathyroidal extension, multicentricity, lymph node metastases, distant metastasis, clinical staging, or risk category at the time of surgery between patients carrying BRAFWT and BRAFV600E .
PTC, papillary thyroid carcinoma; LN, lymph node.
Relationship between BRAFV600E and recurrence rate
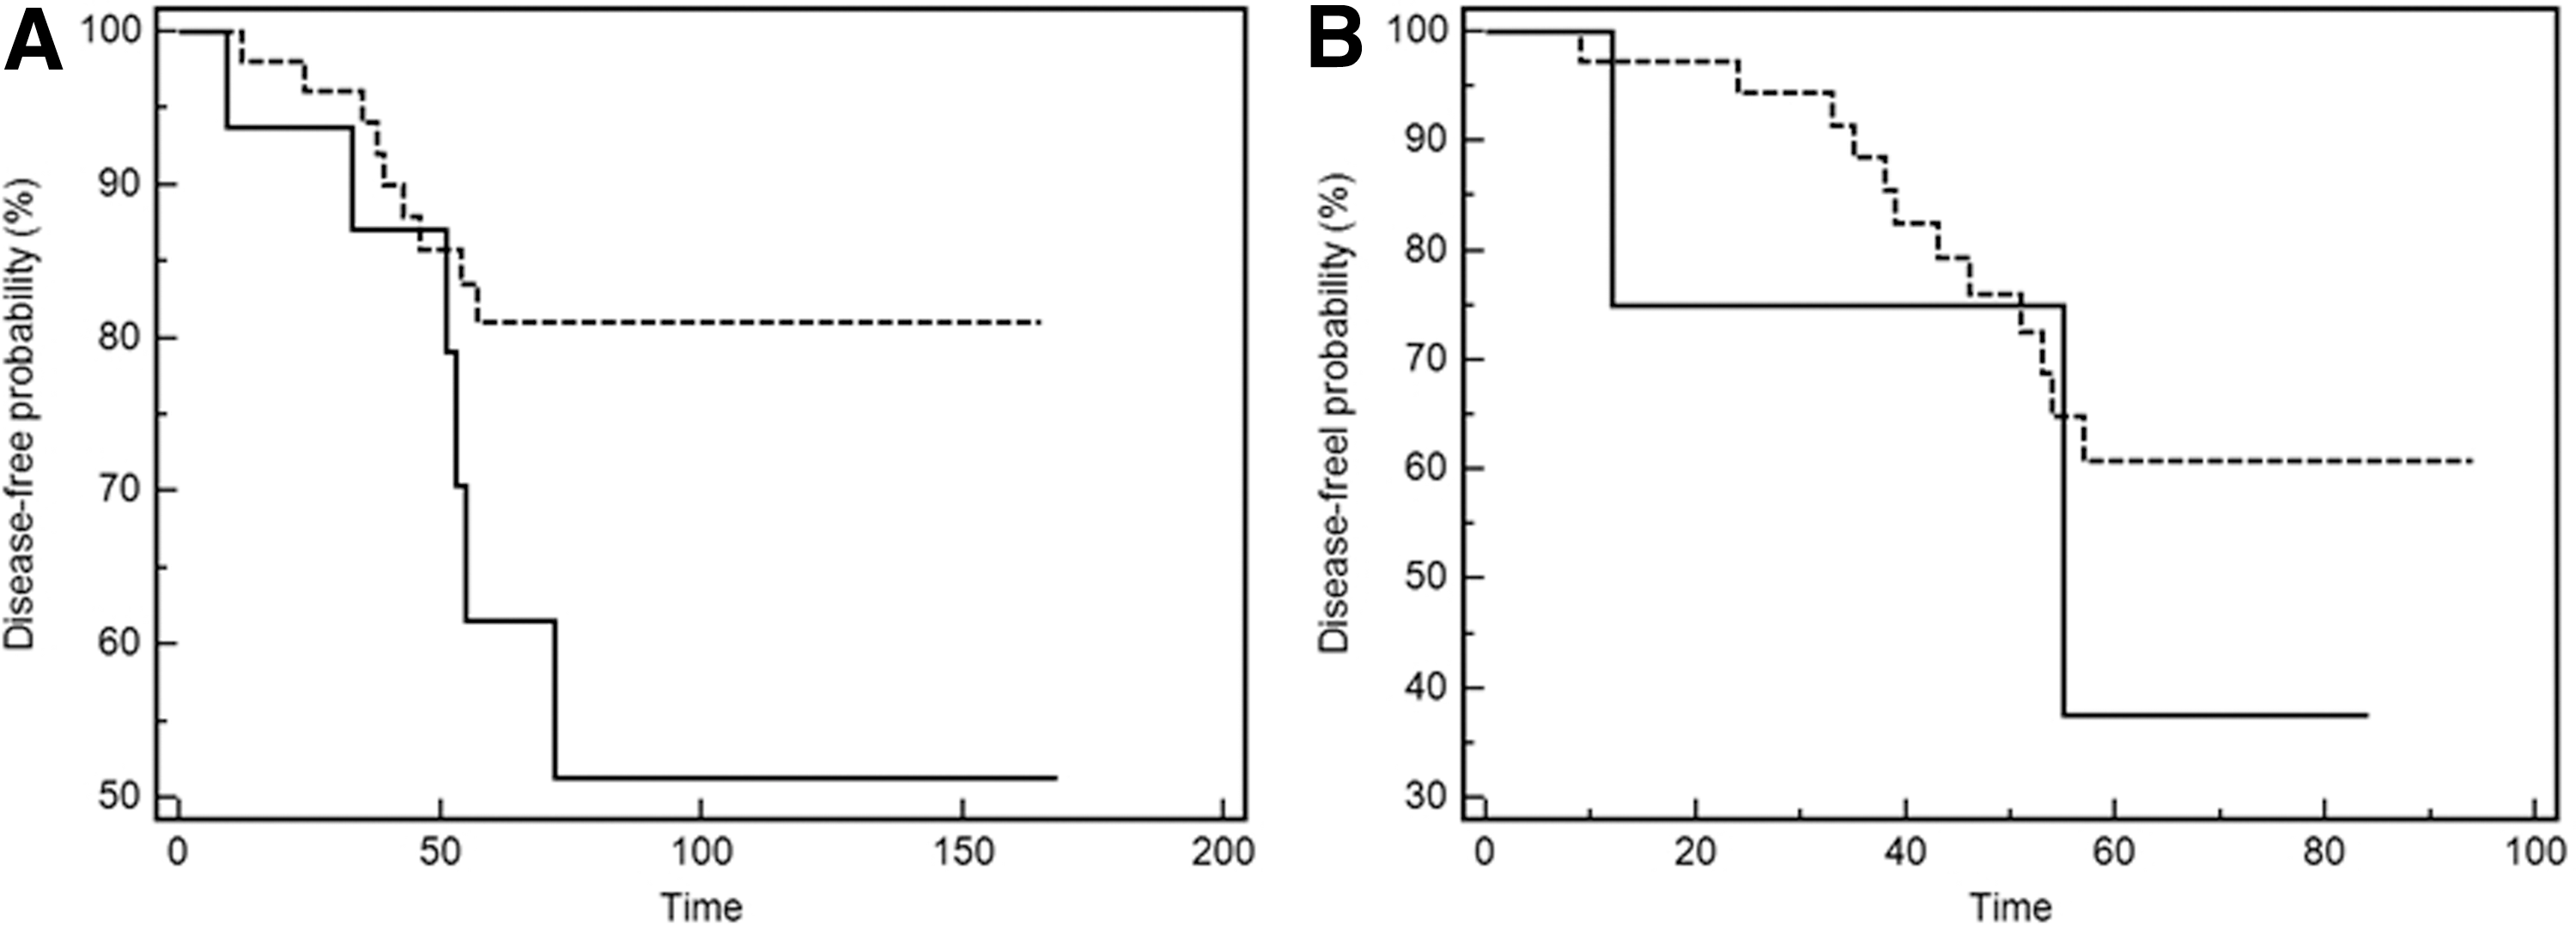
Among the 78 patients, 70 were followed up at Taipei Veterans General Hospital after surgery and radioiodine ablation therapy. The mean follow-up period was 76.9 ± 47.2 months (range 8–168 months). Among the 70 patients, 42 (60%) had a follow-up period of more than five years, and 15 (21.4%) had tumor recurrence; no patient died from PTC during the follow-up period. The mean disease-free duration after surgery was approximately 41.4 ± 17.2 months. Among patients with recurrence, three exhibited persistently high TG levels during T4 suppression, three exhibited a positive WBS, eight had both high TG levels and a positive imaging study (including two WBSs, one positron emission tomography scan, one neck computed tomography scan, and four neck ultrasounds), and one exhibited a positive neck sonogram, the findings of which were subsequently confirmed through postoperative pathology. Among the 15 patients with recurrence (six carrying BRAFWT and nine carrying BRAFV600E ), only five were diagnosed with advanced tumor stages (stages III and IV). No significant association (p = 0.065) was observed between BRAFV600E and the probability of remaining disease-free in this study (Fig. 1A).
(
BRAF, ERK1, GLUT1, Ki67, TSHR, or NIS protein expression levels in patients with BRAFV600E and BRAFWT tumors
The cytoplasm and nucleus of normal thyroid and nodular goiter (NG) follicular cells exhibited negative IHC staining for BRAF and ERK1 (Fig. 2A). Only one PTC tissue sample showed focal cytoplasmic immunostaining (1+) for the BRAF protein, and the BRAF protein was overexpressed in the cytoplasm of all other PTC tissues, with a score of 2+ (Table 2). The cytoplasm of all tissues exhibited intermediate to diffuse staining for ERK1 (score 2+; Fig. 2B). In addition, 77.8% of the BRAFV600E and 77% of the BRAFWT tumors exhibited nuclear ERK1 staining (score 2+). No significant difference was observed in cytoplasmic or nuclear BRAF and ERK1 protein expression levels between the BRAFV600E and BRAFWT tumors (Table 2). Phosphorylated BRAF (pBRAF), tERK, and phosphorylated ERK (pERK) protein expression was also assessed in 10 conventional PTC samples (seven carrying BRAFV600E and three carrying BRAFWT ) by using Western blotting. No significant difference was observed in the pERK/tERK, pERK/pBRAF, or tERK/pBRAF ratios between the BRAFV600E and BRAFWT tumors (Supplementary Fig. S2).

BRAF, ERK, sodium–iodide symporter (NIS), glucose transporter 1 (GLUT1), and thyrotropin receptor (TSHR) protein expression levels in various thyroid tissues. (
See text for scoring system.
IHC, immunohistochemical; NIS, sodium–iodide symporter; TSHR, thyrotropin receptor; GLUT1, glucose transporter 1.
As shown in Figure 2C and D, the cytoplasm and plasma membrane of normal follicular cells exhibited various degrees of positive NIS and TSHR staining. All PTCs with BRAFWT showed positive NIS staining (38.5% scored 1+, 38.5% scored 2+, and 23% scored 3+), and only 91.7% of the PTCs with BRAFV600E expressed the NIS protein (Table 2). Regarding TSHR staining, 37/46 (80.4%) of PTC tissues expressed the TSHR protein (nine with BRAFWT and 28 with BRAFV600E ). No significant difference was observed in NIS or TSHR protein expression levels between the BRAFV600E and BRAFWT tumors (Table 2; p = 0.833 and 0.566, respectively). Kim et al. reported TSHR protein was overexpressed in PTCs with BRAFV600E (34). To verify their finding, 46 normal-paired tissues were IHC stained for TSHR. It was found that 35/46 (76.1%) normal-paired tissues showed focal TSHR protein staining (23.9% scored 0, 26.1% scored 1+, and 50% scored 2+), and 69.5% (32/46, score 2–3) of the PTCs showed higher TSHR protein expression than that of their paired normal tissues (32/46, score 0–2).
Follicular cells of normal thyroid and NG tissues showed no obvious immunostaining of GLUT1 and Ki67. As shown in Figure 2E, PTC tissues showed variable GLUT1 protein expression. Among them, 30.8% of the BRAFWT tumors and 22.9% of the BRAFV600E tumors showed negative GLUT1 staining (Table 2). Regarding Ki67 staining (Supplementary Fig. S3), 26.1% (12/46) of the PTC samples exhibited positive Ki67 staining (>1% tumor cells). However, no significant difference was observed in GLUT1 or Ki67 expression levels between the BRAFV600E and BRAFWT tumors (p = 0.254).
Thyroid-specific and tumor-associated gene expression levels in patients with BRAFV600E and BRAFWT tumors
To evaluate thyroid-specific and tumor-associated gene expression levels in BRAFV600E and BRAFWT conventional PTCs, mRNA from 48 tumor specimens and paired normal tissues was analyzed using real-time PCR (Figs. 3 and 4, respectively). NIS, TSHR, and TPO mRNA levels were lower in the PTCs than in the normal-paired tissues (Fig. 3A, B, and C), whereas MMP-9 and GLUT1 mRNA levels were higher in the PTCs than in the normal tissues (Fig. 3E and F). No difference was observed in MMP-2 and DCR3 levels between the PTCs and normal tissues (Fig. 3D and G). When the gene expression levels between PTCs with BRAFV600E and BRAFWT were compared, NIS gene expression was lower in the PTCs with BRAFV600E than in those with BRAFWT (p = 0.039; Fig. 4A). However, no significant difference was observed in TPO, TSHR, MMP-2, MMP-9, GLUT1, or DCR3 mRNA levels between the BRAFV600E and BRAFWT tumors (Fig. 4).
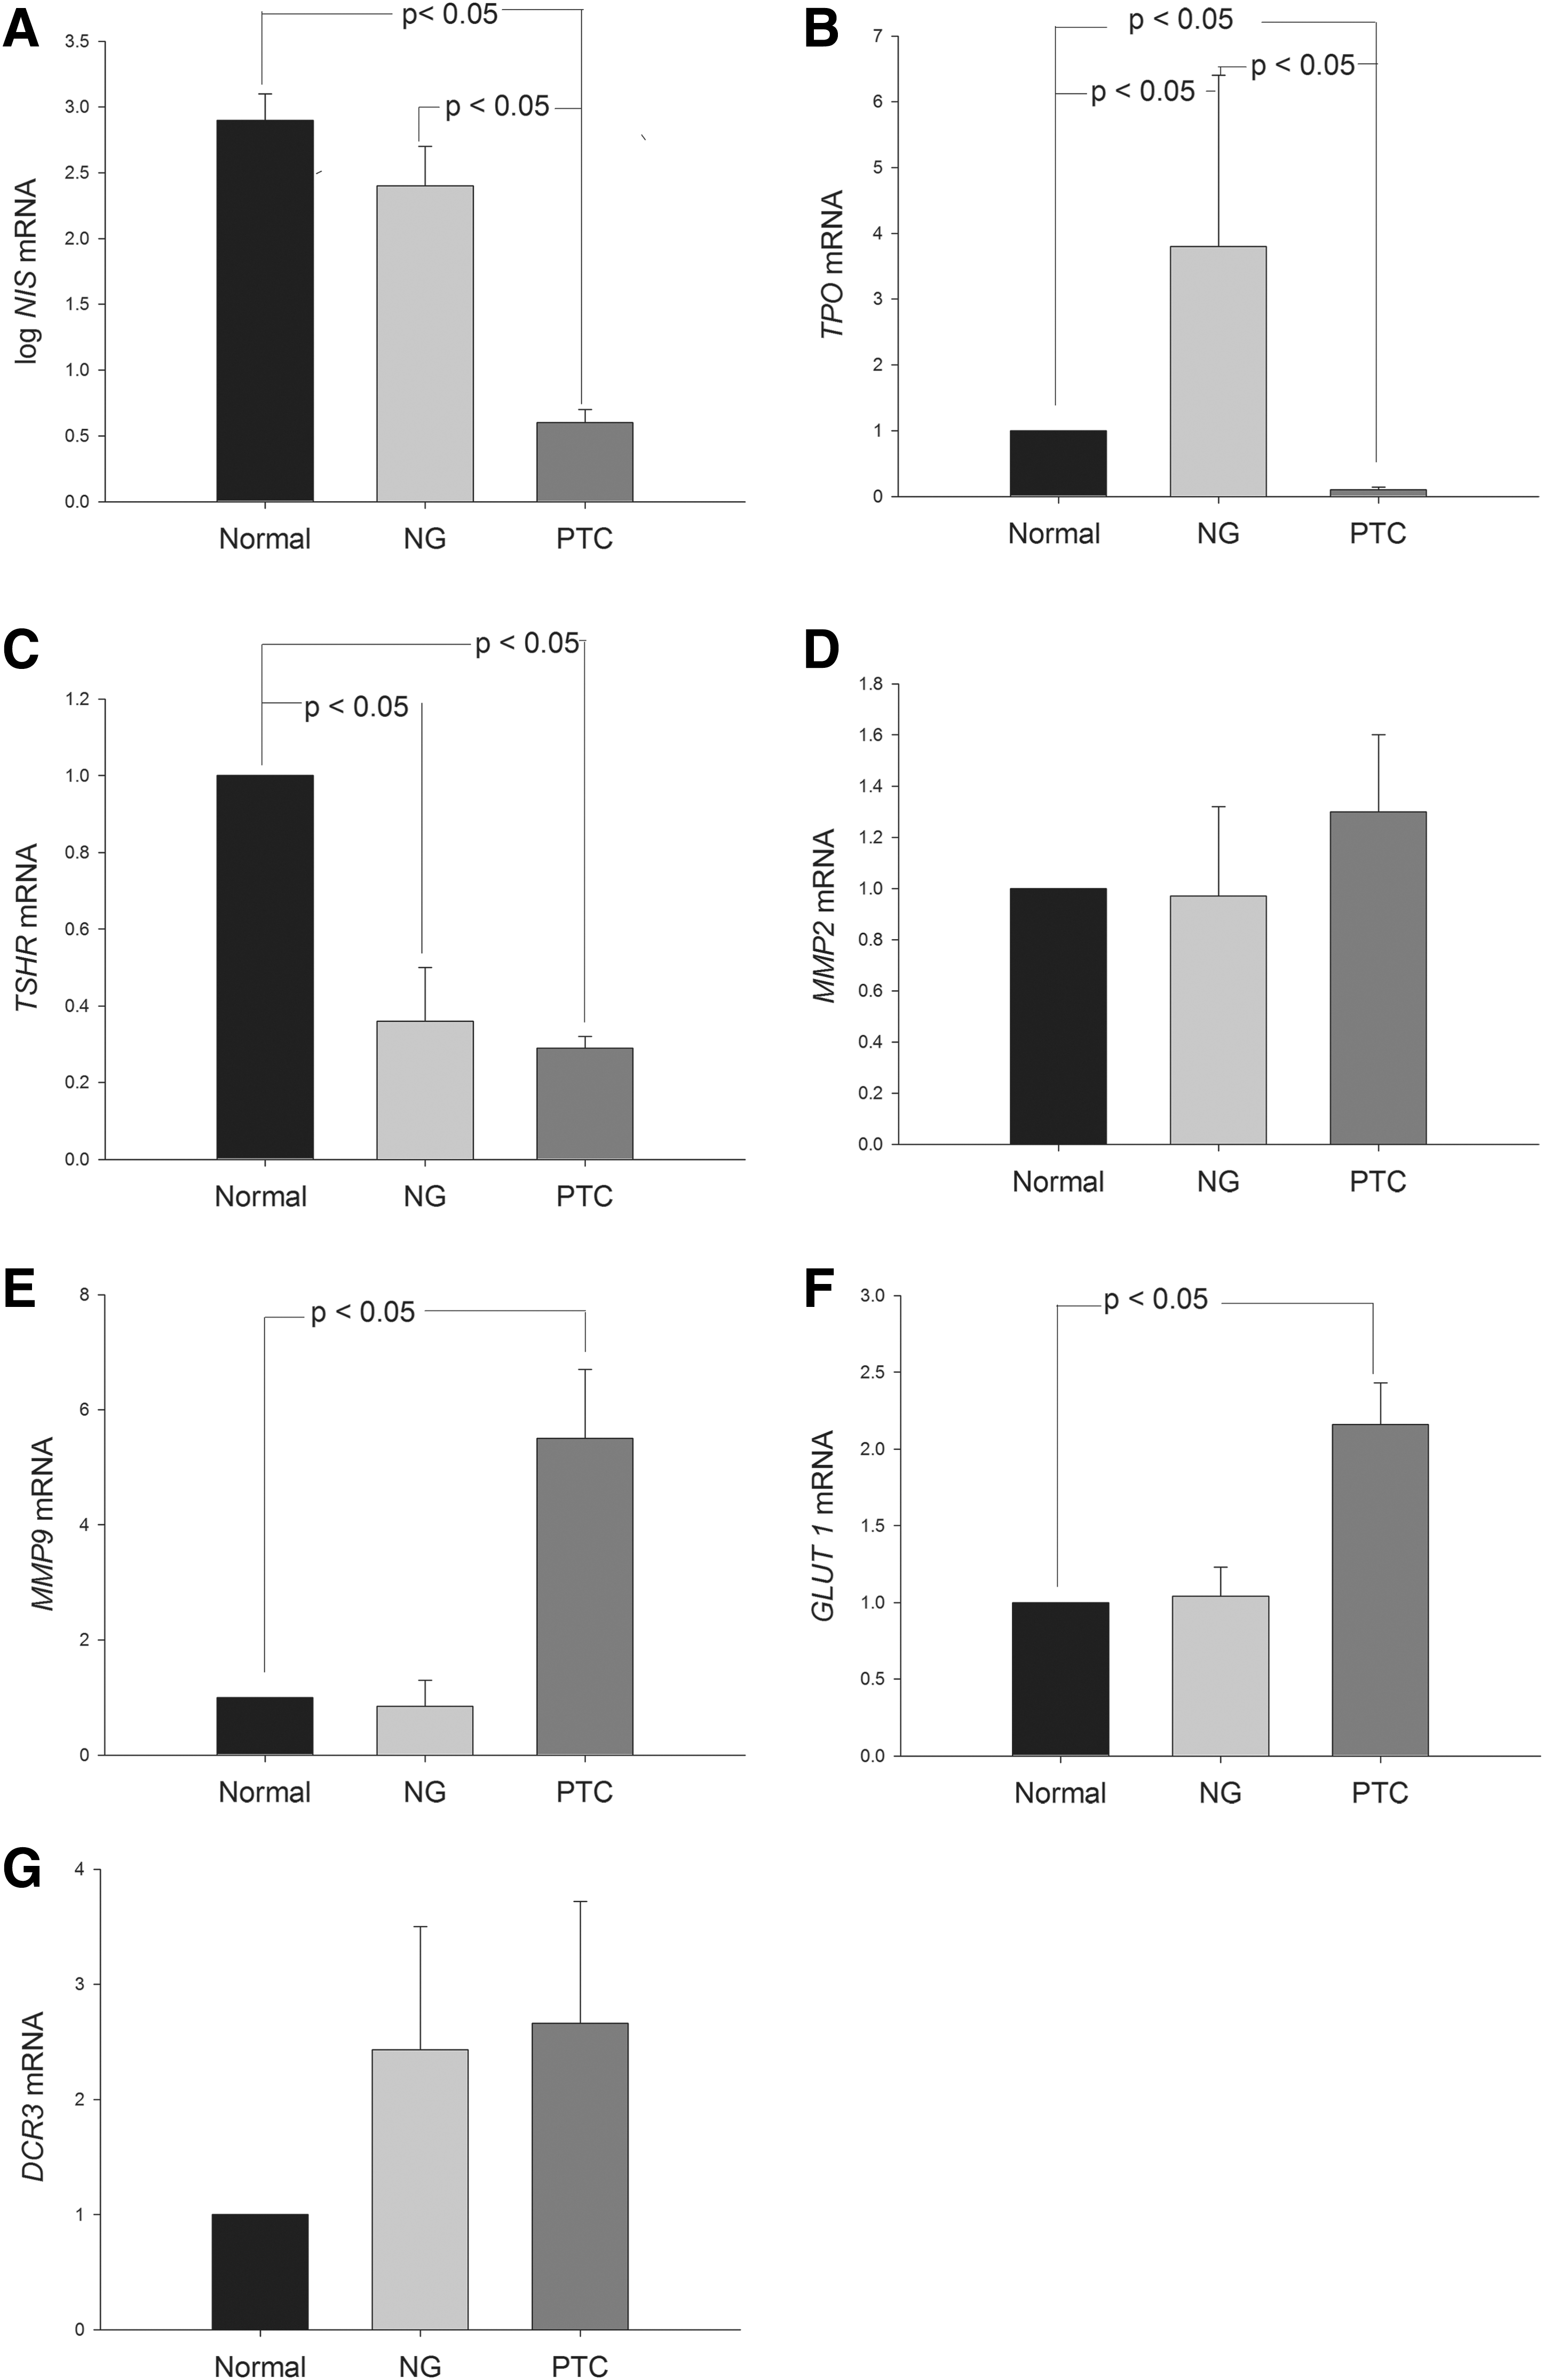
Difference in the expression of thyroid-specific genes, matrix metalloproteinases (MMPs), glucose transporter 1 (GLUT1), and decoy receptor 3 (DCR3) among PTCs, their paired normal tissues, and nodular goiter (NG). Each bar represents mean and standard error.
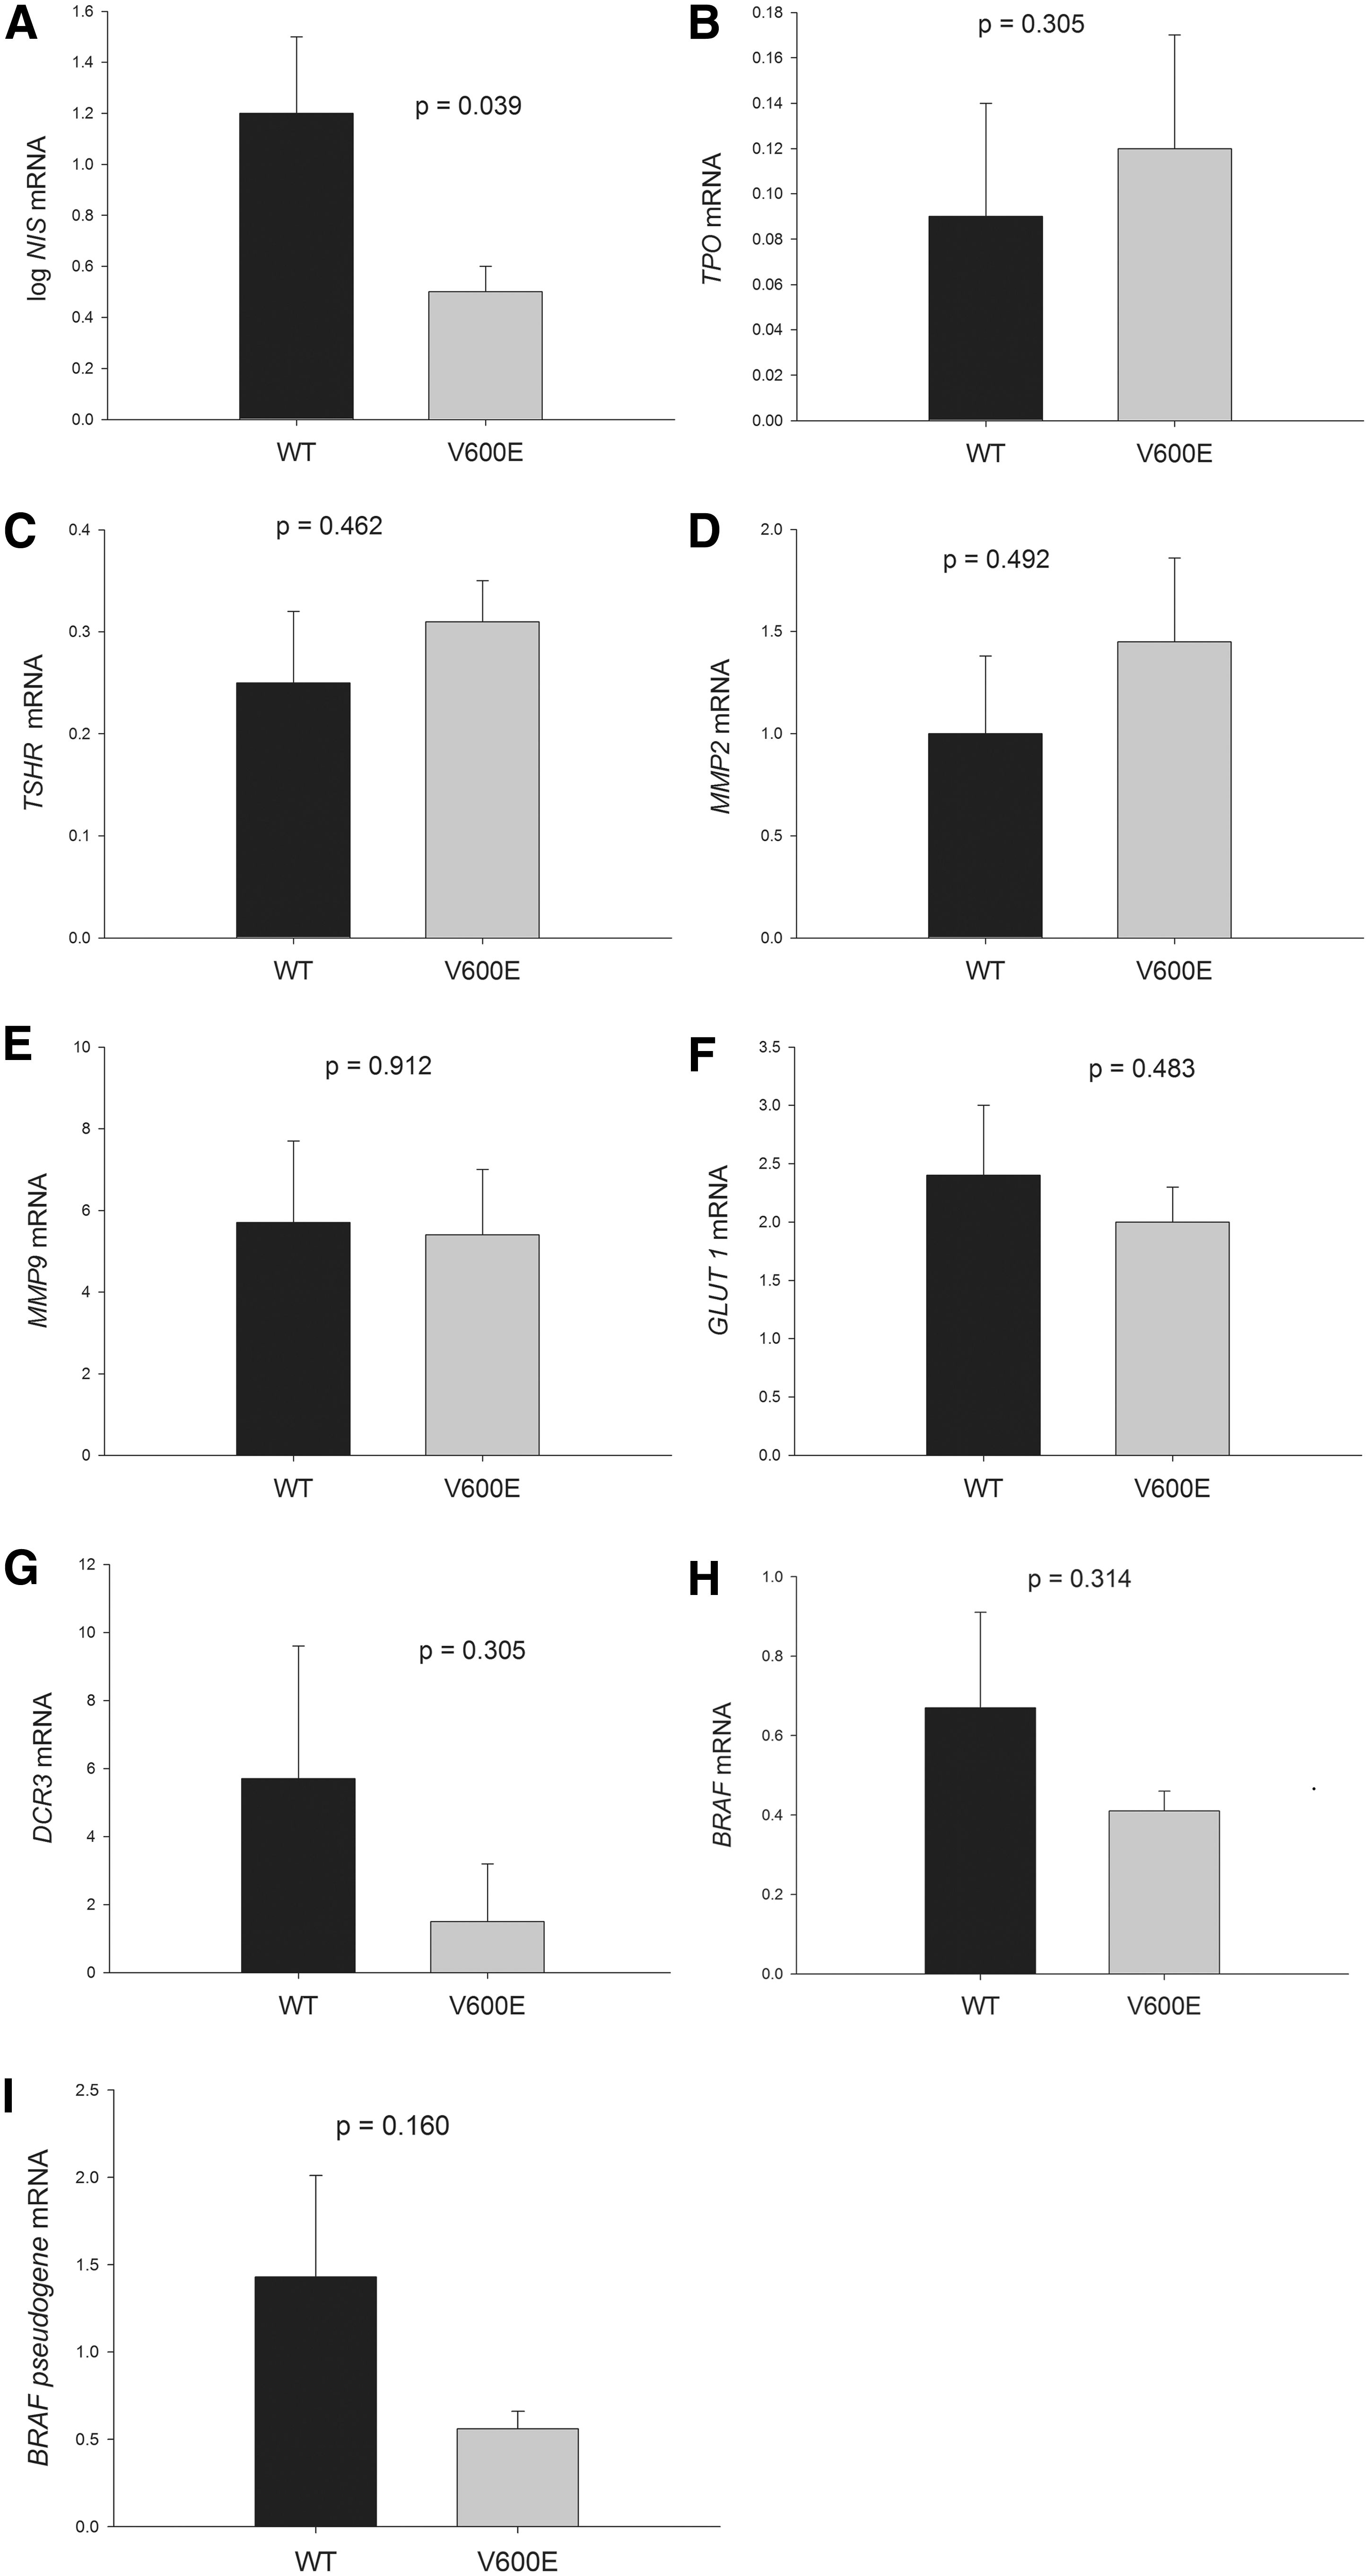
Difference in the expression of thyroid-specific genes, MMPs, GLUT1, DCR3, BRAF, and BRAF pseudogene transcripts between BRAFWT and BRAFV600E tumors. Each bar represents mean and standard error. WT, wild-type; V600E, BRAFV600E .
Detection of the BRAF pseudogene and its association with clinical features and specific gene expression
BRAF-pseudogene expression was analyzed in 48 PTCs and paired normal tissues (Supplementary Fig. S4). The expression was detected in 44/48 PTC tissues (91.7%) and in 46/48 normal-paired tissues (95.8%). The relationship between the BRAF pseudogene and clinical characteristics was assessed. No significant association was observed in age, sex, tumor size, extrathyroidal invasion, lymph node metastasis, distant metastasis, clinical staging, or recurrence rate in PTC tissues with the BRAF pseudogene. In addition, no significant association was observed between the BRAF pseudogene and the probability of remaining disease free (Fig. 1B; p = 0.819). Furthermore, this study determined whether the BRAF pseudogene was associated with the clinical parameters and probability of remaining disease-free in the BRAFWT and BRAFV600E PTCs. No association between the BRAF pseudogene and any of these parameters was found in the BRAFWT and BRAFV600E PTCs.
As shown in Figure 5, PTCs with the BRAF pseudogene showed lower DCR3 mRNA expression than those without the BRAF pseudogene (p = 0.037). In addition, no significant difference was observed in TPO, TSHR, GLUT1, MMP-2, MMP-9, or NIS gene expression levels between PTCs with the BRAF pseudogene and those without the pseudogene.
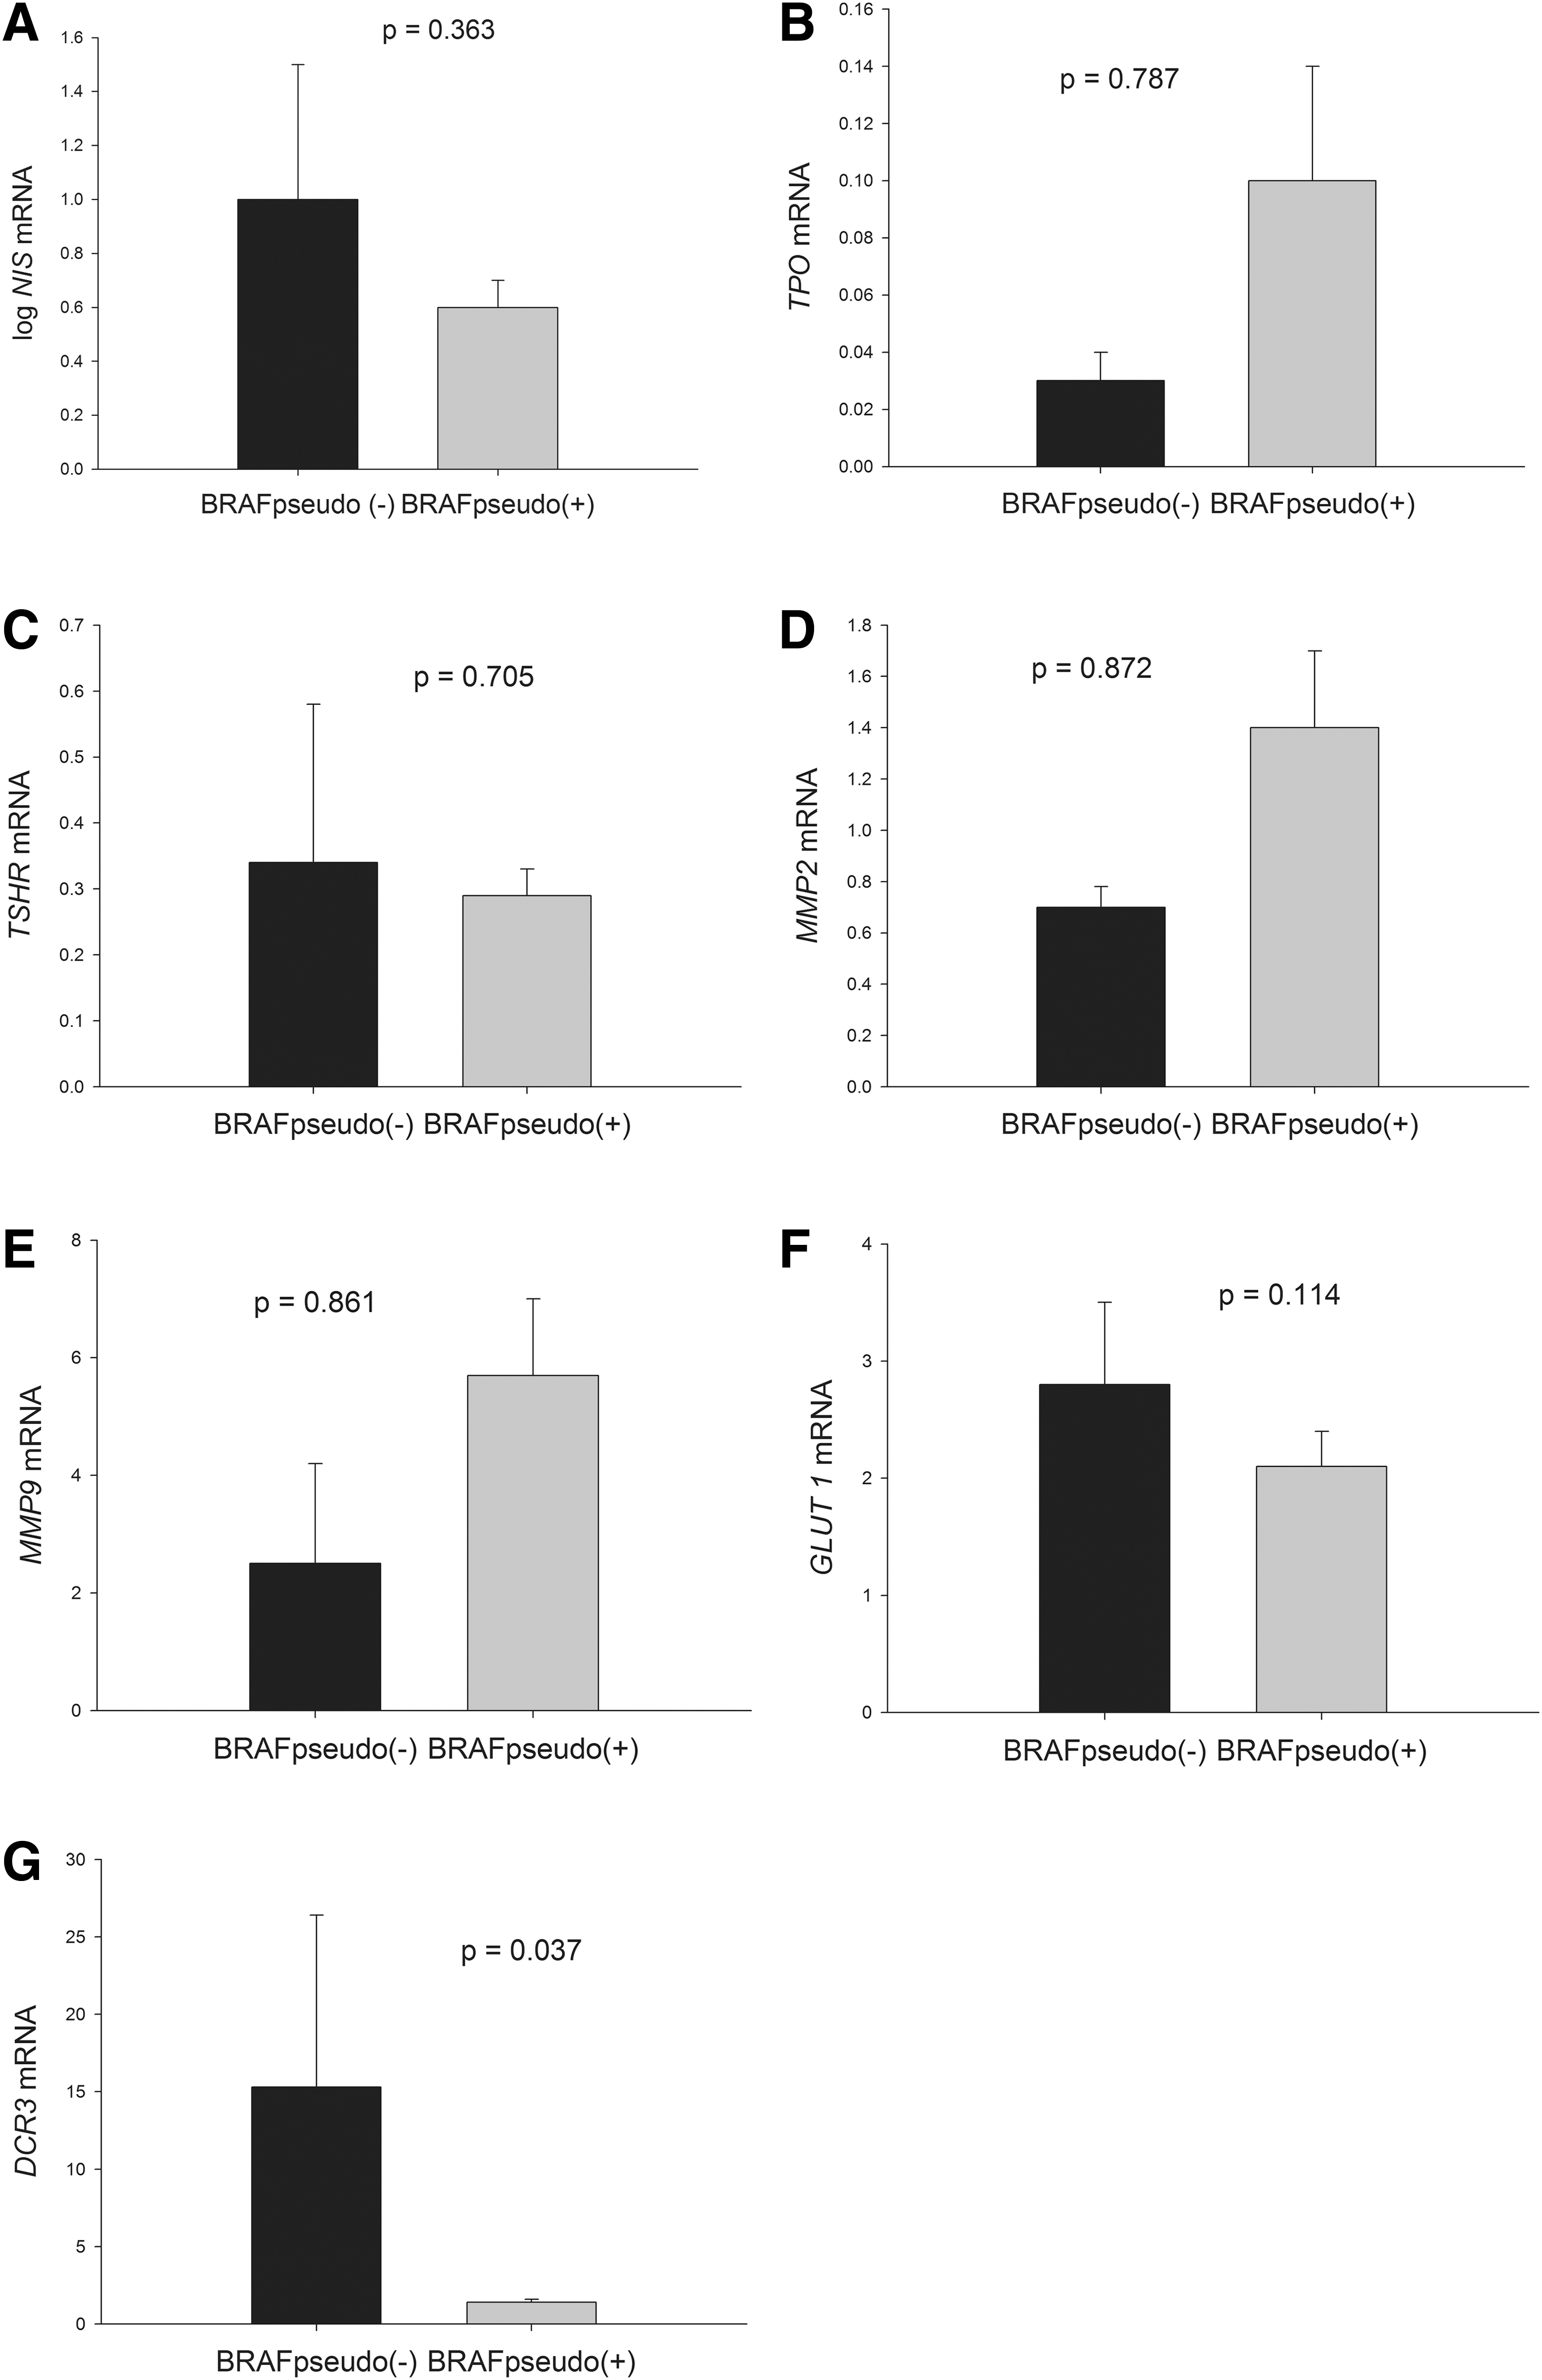
Association of the BRAF pseudogene with the expression of thyroid-specific genes, MMPs, GLUT1, and DCR3. Each bar represents mean and standard error.
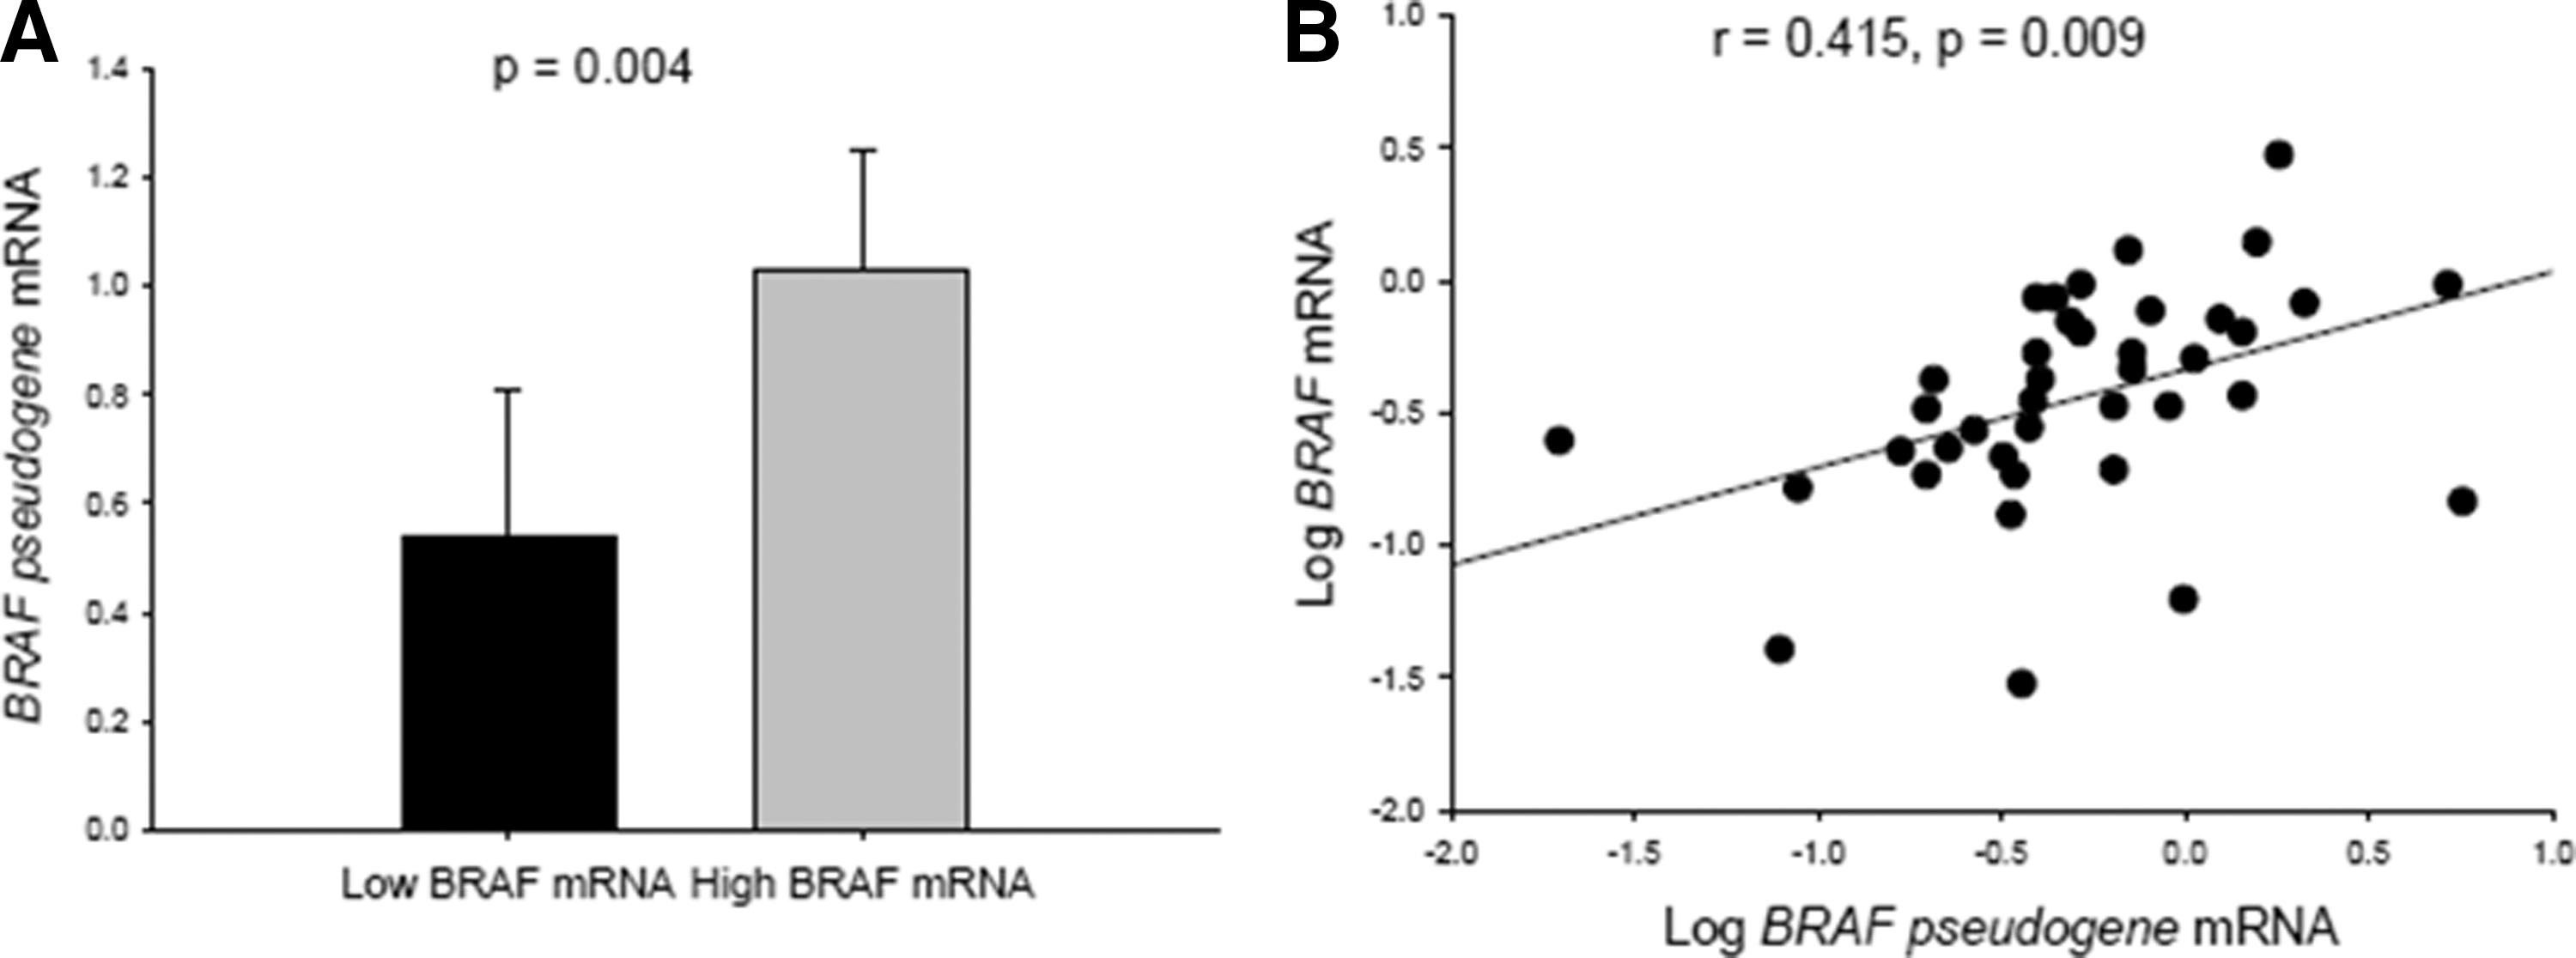
Relationship among BRAF mRNA, BRAF-pseudogene mRNA, clinical parameters, and gene expression
To evaluate the effects of BRAF and BRAF-pseudogene transcripts on the clinical features and gene expression of PTCs further, the mRNA levels of BRAF and the BRAF pseudogene were measured in both BRAFWT and BRAFV600E tumor samples. No differences were observed in BRAF and BRAF-pseudogene mRNA levels between PTCs with BRAFWT and BRAFV600E (Fig. 4H and I). BRAF-pseudogene mRNA levels were higher in PTCs with high BRAF mRNA levels than in those with low BRAF mRNA levels (Fig. 6A; p = 0.004; BRAF = BRAFWT and BRAFV600E ). It was also found that BRAF-pseudogene mRNA levels were positively correlated with BRAF mRNA levels (Fig. 6B; r = 0.415, p = 0.009). High BRAF transcript levels were associated with bilateral PTC and multifocal PTC (p = 0.016 and 0.013, respectively; data not shown). However, no difference was observed in any clinical parameter between PTCs with high and low BRAF-pseudogene transcript levels. Relationships among BRAF mRNA levels, BRAF-pseudogene mRNA levels, and the ratio of BRAF/BRAF-pseudogene mRNA levels for each clinical stage are shown in Figure 7A and B. No significant differences were observed in these parameters for any clinical stage (p = 0.671, 0.135, and 0.985, respectively) or for the low-risk (stages I and II) or high-risk (stages III and IV) groups (p = 0.751, 0.141, and 0.550, respectively). The BRAF-pseudogene levels seemed to be higher in the stage IV (n = 2) and the high-risk (n = 9) groups. However, with the small sample sizes, no statistical difference was observed between the BRAF-pseudogene levels of these groups. Moreover, no significant difference was observed in the expression level of any thyroid-specific or tumor-related gene within the high or low BRAF mRNA groups or within the BRAF-pseudogene mRNA group (data not shown).
(

(
Discussion
This study observed a high prevalence rate (73%) of the BRAFV600E mutation in conventional PTCs. This rate was higher than those of previous studies (approximately 60%) and that of southern Taiwan (52%) but similar to that reported in Korea (>70%). These findings suggest that the BRAFV600E mutation is a common genetic alteration in conventional PTCs, particularly in Taiwan and Korea (11,35). Notably, the observed prevalence of the BRAFV600E mutation in this study was different from that reported by Liu et al. This might be attributed to the different population characteristics of the two cohorts. In the present study, which was performed at Taipei Veterans General Hospital in northern Taiwan, most patients were veterans (who moved from mainland China to Taiwan in 1949 during the civil war) and their relatives. Liu et al. mostly recruited southern Taiwanese patients. Guan et al. showed that cohorts from China with a high iodine intake had a higher incidence of BRAFV600E than those with a normal iodine intake (69% vs. 53%), suggesting that a high iodine intake is a risk factor for acquiring a BRAFV600E mutation (36). However, the higher prevalence of the BRAFV600E mutation in the Taiwanese population in the present study cannot be attributed the iodine intake, as the iodine intake is borderline adequate (37). Although earlier studies have reported that the presence of BRAFV600E is associated with advanced stages and aggressive phenotypes, many of these studies included aggressive variants, which may be a confounding factor leading to a statistical bias (8,38).
BRAFV600E is the most common mutation in conventional PTCs. The 40-year survival rate of PTC is 94% (39), suggesting an overall favorable prognosis for patients with PTC despite a high prevalence of the BRAFV600E mutation. In this study, the bias resulting from the strong association of aggressive subtypes with BRAFV600E was eliminated by including only patients with conventional PTCs. In a study conducted by Liu et al., in which conventional PTCs accounted for 72% of the PTCs harboring the BRAFV600E mutation, no association was observed between clinical characteristics and the mutation in southern Taiwanese patients (11). Similarly, no correlation was found of the BRAFV600E mutation with clinical manifestations in northern Taiwanese patients during the follow-up duration of 76.9 ± 47.2 months. Moreover, other studies including patients of various ethnicities and from various geographic areas did not identify any association between the BRAFV600E mutation and aggressive clinicopathologic features (9 –12). Hence, the role of the BRAFV600E mutation in PTC remains controversial. These conflicting results may be attributed to differences in study populations in terms of size, age at diagnosis, histological subtypes, genetic factors, environmental factors, disease stages at the time of initial diagnosis, and the methods or criteria used (2). Analysis of BRAFV600E in conventional PTCs does not provide any additional information for determining the risk status compared with the current staging system, at least in Taiwan.
Aberrant activation of the MAPK pathway has been found in >70% of PTCs, indicating that the MAPK signaling pathway may play a crucial role in the pathogenesis of PTC. In this study, the BRAF protein was overexpressed in almost all PTC tissues, irrespective of the BRAF status, which is consistent with the findings of Kahn et al. (40). BRAF protein overexpression may be due to the aberrant activation of tyrosine kinase receptors (such as the RET/PTC rearrangement) or the action of transacting factors on the BRAF promoter. However, the RET/PTC rearrangement and RAS mutation only account for a minority of PTC genetic alterations, and BRAF protein overexpression is independent of the BRAFV600E mutation status. It seems that some unknown tumorigenic factors play a role in the aberrant activation of the BRAF promoter, leading to BRAF overexpression and tumorigenesis. Some in vitro studies have shown that the BRAFV600E mutation induces a 2–4.6-fold increase in ERK activity compared with that of BRAFWT , possibly leading to more invasive clinicopathologic features (2,41,42). However, in this and another study no significant difference was observed in cytoplasmic or nuclear ERK protein expression between BRAFV600E and BRAFWT tumors (43). The reason for the inconsistent results between in vitro and in vivo studies remains unclear, although some feedback inhibition mechanisms of the MAPK signaling pathway that prevent cell cycle arrest and senescence because of the hyperactivation of the ERK pathway may be sensitive to BRAFV600E (2).
Several studies have demonstrated that BRAFV600E is associated with decreased expression of several thyroid-specific genes including NIS, TG, TSHR, and TPO (13,14). Riesco-Eizaguirre et al. reported that BRAFV600E was associated with decreased amount of the NIS protein targeting the follicular cell membrane. The defect in NIS expression and the trafficking in PTCs harboring BRAFV600E reduced the efficacy of radioiodine therapy, resulting in an increased recurrence rate and poor prognoses (13). In this study, NIS gene expression was decreased in tumors harboring BRAFV600E compared with those harboring BRAFWT . However, no difference was observed in NIS protein expression or translocation to the membrane between BRAFV600E and BRAFWT tumors. Zhang et al. demonstrated that BRAFV600E could inhibit NIS expression through the deacetylation of a histone at the NIS promoter in vitro, suggesting a possible epigenetic mechanism (44). However, Liu et al. found that the specific knockdown of BRAFV600E by using small interfering RNA failed to restore NIS protein expression in a PTC-derived cell line (45). By using a mitogen-activated protein kinase (MEK) inhibitor, Riesco-Eizaguirre et al. observed a partial reinduction but no relocalization of the NIS protein to the membrane (13). These findings suggest that BRAFV600E plays a limited role in NIS expression. Although BRAFV600E seems to be associated with decreased NIS expression, radioiodine resistance was clinically observed in only 10–15% of the patients with PTC (46). This percentage is substantially lower than the prevalence of the BRAFV600E mutation in PTCs. No significant association of decreased NIS expression with the clinical features and recurrence rate in PTCs with the BRAFV600E mutation was observed. Kim et al. reported that BRAFV600E -mutated PTCs were associated with increased TSHR protein expression compared with normal tissue and that increased TSH signaling might overcome the oncogene-induced senescence mechanism in PTCs (34). The present study found that the TSHR protein was overexpressed in most PTC tissues compared with normal thyroid tissues, irrespective of the BRAFV600E mutation status, which is consistent with the findings of Kim et al. (34). However, this study showed decreased TSHR mRNA levels in PTCs. The reason for this discordance is unknown, but it might be due to decreased TSH protein catabolism and TSHR mRNA synthesis in PTCs, thus leading to TSHR protein accumulation in tumor cells. Nevertheless, additional studies are required to clarify this issue. Upregulated GLUT1 gene expression has been reported for PTCs, particularly in tumors with BRAFV600E compared with those with BRAFWT (2,15). However, in this and another study, no difference in GLUT1 gene expression or correlation between NIS and GLUT1 gene expression levels was observed between BRAFV600E and BRAFWT tumors (47). MMPs, DCR3, and Ki67 are tumor-related genes with specific roles in tumorigenesis, such as metastasis, anti-apoptosis, and proliferation (17 –20). In this study, no significant difference was observed in MMP-2, MMP-9, DCR3, or Ki67 expression levels between BRAFV600E and BRAFWT tumors.
Zou et al. reported that the BRAF pseudogene could activate the MAPK pathway in vitro and stimulate tumorigenesis in nude mice (23). They also observed a decreased prevalence rate of BRAF-pseudogene transcripts in advanced PTCs, suggesting that the BRAF pseudogene initiates thyroid carcinogenesis. Recently, Karreth et al. confirmed that the BRAF pseudogene is an oncogene that increases BRAF protein expression by acting as competitive noncoding RNA, inducing lymphomas in vivo. This finding suggests that the BRAF pseudogene plays a crucial role in regulating BRAF expression (24). In the present study, the BRAF pseudogene was detected in almost all conventional PTCs (91.7%), but the BRAF pseudogene was not associated with clinical features or the recurrence rate. Moreover, no inverse correlation was observed between the prevalence of BRAF-pseudogene transcripts and BRAFV600E , except that lower DCR3 gene expression levels were observed in BRAF pseudogene-positive PTCs. However, only four BRAF pseudogene-negative PTC tumors were identified in this study, which might have resulted in a statistical bias. The mean BRAF-pseudogene mRNA levels were threefold higher in BRAFWT tumors than in BRAFV600E tumors. This finding is similar to that of Zou et al., who showed that the BRAF pseudogene was detected more frequently in BRAFWT than in BRAFV600E tumors (74.4% vs. 25.9%) (23). However, no statistically significant difference was observed between the two tumors. Therefore, additional studies with larger sample sizes than used in the present study should be conducted to clarify these issues. In this study, high BRAF transcript levels in both BRAFWT and BRAFV600E PTCs were associated with bilateral and multifocal PTCs. These findings suggest that BRAF overexpression increases the incidence of bilateral and multifocal PTCs, independent of the BRAFV600E mutation status. Therefore, the number of BRAF transcripts might be a more useful tool for determining the clinical risk of PTC. It has been reported that the BRAF pseudogene regulates BRAF expression during tumorigenesis by acting as competitive noncoding RNA (24). The finding of a positive correlation of BRAF-pseudogene mRNA with BRAF mRNA levels is in agreement with the aforementioned observations. However, no association was found between BRAF-pseudogene mRNA levels and the clinical parameters, staging, or expression of thyroid-specific and tumor-related genes. The reason for this is currently unknown, but it might be due to the limited sample size of this study and the interaction of unknown factors between the BRAF pseudogene and these genes. Most of the paired normal tissues were BRAF pseudogene positive but did not overexpress the BRAF protein, which is contradictory to the role of the BRAF pseudogene as an oncogene. Moreover, in Zou et al., the BRAF pseudogene was detected in 43% of the multinodular goiter cases analyzed (23). Thus, the BRAF pseudogene might play different roles in PTCs and in normal thyroid tissue/benign lesions. In PTCs with BRAF protein overexpression, the BRAF pseudogene might promote tumorigenesis by acting as competitive noncoding RNA to increase BRAF gene expression (24). However, in normal tissue/benign lesions without BRAF overexpression, the BRAF pseudogene might have minimal effect on BRAF gene expression.
Understanding the differential factors involved in the regulation of BRAF expression between normal and tumor tissues might provide crucial information on the pathogenesis of tumorigenesis. In contrast with the present findings, Zou et al. (23) did not detect BRAF-pseudogene expression in the normal tissue. This difference might be due to the small sample size of their study (5 vs. 48 normal tissue samples). Notably, BRAF-pseudogene expression was detected in 43% of the multinodular goiter samples by Zou et al. (23).
In conclusion, numerous recent studies have investigated the clinicopathologic characteristics and potential utility of the BRAFV600E mutation in the diagnostic, prognostic, and therapeutic aspects of PTC. Unlike the highly consistent results of in vitro studies, the current clinical data show conflicting results regarding the utility of the BRAFV600E mutation as a genetic prognostic marker of conventional PTC. However, the association of high BRAF mRNA levels with more advanced clinical features suggests that BRAF mRNA levels are a more useful marker of the clinical risk of PTCs than the presence of the BRAFV600E mutation. The correlation of BRAF-pseudogene mRNA with BRAF mRNA in PTCs is in agreement with the role of the BRAF pseudogene as competitive noncoding RNA that regulates BRAF expression to promote tumorigenesis. However, the lack of an association between the BRAF pseudogene and thyroid- and tumor-specific gene expression and the clinical manifestations of PTCs emphasizes the need for additional studies with larger sample sizes for clarifying these issues.
Footnotes
Author Disclosure Statement
No competing financial interests exist.