
Abstract
Background:
Graves' orbitopathy (GO) is the main extrathyroidal manifestation associated with Graves' disease (GD). It is characterized by reduced eye motility due to an increased volume of orbital fat and/or of extraocular muscles (EOMs) infiltrated by fibrosis and adipose tissue. The pathogenetic mechanisms leading to fibrosis and adipogenesis are mainly based on the interaction between orbital fibroblasts and immune cells (lymphocytes and mast cells) infiltrating the GO EOMs.
Methods:
Analysis of the morphological status, oxidative stress (OS), and antioxidant defenses in the orbital muscular cells and adipocytes in GO patients compared with controls was conducted.
Results:
Both cell types are affected by OS, as shown by the increased expression of 4-hydroxynonenal, which leads to apoptosis in muscular cells. However, the EOMs and the adipocytes possess antioxidant defenses (peroxiredoxin 5 and catalase) against the OS, which are also upregulated in thyrocytes in GD. The expression of adiponectin (ApN) and proliferator-activated receptor gamma (PPARγ) is also increased in GO muscular cells and adipocytes. OS and antioxidant proteins expression are correlated to the level of blood antithyrotropin receptor antibodies (TSHR-Ab).
Conclusion:
Even when TSHR-Ab level is normalized, OS and antioxidant protein expression is high in EOM muscular cells and adipocytes in GO compared with controls. This justifies a supplementation with antioxidants in active as well as chronic GO patients. Orbital muscular cells are also the sources of PPARγ and ApN, which have direct or indirect local protective effects against OS. Modulation of these proteins could be considered as a future therapeutic approach for GO.
Introduction
G
GO evolves in two phases. The first active phase is characterized by the infiltration of the EOMs by Th1 lymphocytes and by the dissociation of the muscular cells by edema. Fibrosis and adipogenesis in the EOMs are the hallmarks of the second chronic Th2 phase. De novo adipogenesis also occurs in adipose tissue investing the orbit. The remodeling of muscular tissue is responsible for reduced eye motility, whereas increased volume of the EOMs and adipose tissue leads to exophthalmos (2).
Hondur et al. have shown increased OS and antioxidant activity in orbital fibroadipose tissue in GO (6). Factors known to worsen OS also worsen the prevalence of GO among GD patients and include cigarette smoking (7) and 131I therapy (8).
Moreover, a therapeutic effect of selenium (Se) has already been proven in mild GO in large multicenter, double blind, placebo-controlled clinical trials (9). Seleno-enzymes and their antioxidant capacity may modify the autoimmune mechanism and regulate the associated inflammation. This mechanism may explain the beneficial effect of Se in GO (9).
In GO patients, the production of T cells chemoattractants, and of hyaluronan, a highly hydrophilic glycosaminoglycan responsible for edema is induced by the interaction between IgG and orbital fibroblasts overexpressing the insulin like growth factor-1 (IGF-1) receptor, another candidate autoantigen for GO (2).
A characteristic of the orbital fibroblasts is their divergent phenotypes with various potentials of differentiation (2). Recently, an increased abundance of fibrocytes has been demonstrated in GD patients (2). These fibrocytes deriving from blood circulating B cell precursors express the IGF-1 receptor, but also the TSH-R, at a high level, particularly in GO patients. When activated by TSH, they produce cytokines such as IL-6 and TNFα, responsible for the initiation of the active phase of GO disease (2). The roles of the orbital fibroblasts and their interplay with immune cells are now better understood and have been extensively described in recent reviews (1,2), but the morphological status of the EOM cells and orbital adipocytes is still poorly documented.
Moreover, it has been shown that agents that ligate and activate PPARγ promote the adipocyte differentiation of orbital fibroblasts (1,2) and PPARγ is known to induce ApN production (10). The upregulation of ApN has been demonstrated in tibialis muscle in response to either inflammation or metabolic and oxidative aggression, both in vivo in murine models of LPS injection or type 2 diabetes, as well as in vitro in cultured myotubes. This increase of ApN has been considered as a local protection against inflammation and oxidative damage (11 –14).
The aim of this study was to analyze how EOM cells and orbital adipocytes face the cytokine environment. A morphological analysis was performed to detect intracellular OS, apoptosis, and the expression of several antioxidant proteins such as peroxiredoxins (PRDXs) and catalase, and their correlation with TSHR-Ab levels. ApN and PPARγ expression in the muscular cells was also evaluated given the recently demonstrated antioxidant effect of ApN in tibialis muscle (11 –14).
Materials and Methods
EOM, orbital fat, and thyroid samples
Surgical samples of EOMs were obtained from patients with GO (n = 19) or from control patients with essential strabismus (n = 15) or non-GO disease (fibrosis, tumors; n = 8). Orbital fat was obtained from patients receiving surgery for GO (n = 10) or for orbital fractures (n = 8), and they served as controls. Thyroid samples, obtained from patients receiving surgery for GD (n = 7), were compared with paranodular normal tissues from control patients receiving surgery for multinodular goiter (n = 10). The characteristics of control and GO patients included in the morphological study are summarized in Table 1. In GO patients, the mean TSH levels were in the normal range. All tissues were surgical specimens obtained after patients gave informed consent, and this study was approved by the Ethic Committee of Université Catholique de Louvain (registration number B403201317337).
GO, Graves' orbitopathy; TSHR-AB, thyrotropin receptor antibodies.
Light microscopy
Muscle, fat, and thyroid samples were fixed in 4% formaldehyde for 24 h and embedded in paraffin. Sections 5 μm thick were stained with hematoxylin-eosin-saffron (HES) for morphological studies and with toluidine blue to detect mast cells.
Immunohistochemistry
All antigens, 4-hydroxynonenal (4-HNE), caspase-6, PRDX5, catalase, ApN, and PPARγ were detected in paraffin sections. The characteristics of antibodies are summarized in Supplementary Table S1 (Supplementary Data are available online at
Negative controls were performed by omission of the first antibody, by using preimmune serum, or by incubation with an irrelevant antibody.
RNA purification and reverse transcription
EOM lysates were suspended in TriPure Isolation Reagent (Roche Diagnostics, Vilvoorde, Belgium), and total RNA was purified according to the manufacturer's protocol. Reverse transcription was performed by incubating 2 μg of total RNA with oligo (dT) primers and RevertAid™ H Minus M-MuLV Reserve transcriptase (Fermentas Life Sciences, St-Leon-Rot, Germany).
Quantitative polymerase chain reaction
Reverse transcription quantitative (RT qPCR) primers were designed (Primer Express Software, Applied Biosystem) for human ApN, PRDX5, PPARγ, and 28S RNA (Supplementary Table S2). Total RNA equivalents (120 ng) were amplified with iQ SYBR Green Supermix (Bio-Rad Laboratories, Temse, Belgium) containing 300 nM of each specific primer using an iCycler iQ Real Time PCR Detection System (Bio-Rad). The threshold cycles (Ct) were measured in separate tubes and in duplicate. The identity and purity of the amplified product was checked by electrophoresis on agarose mini-gels and analysis of the melting curve carried out at the end of amplification. To ensure the quality of the measurements, each plate included a negative control for each gene. The ΔCt values were calculated in every sample for each gene of interest as follows: Ctgene of interest – Ctreporter gene with 28S as the reporter gene (mRNA of reporters remained stable throughout the experiments). Relative changes in the expression level of one specific gene (ΔΔCt) were calculated as ΔCt of the test group minus ΔCt of the control group, and then presented as 2–ΔΔCT. The PCR efficiency equaled 1 for each gene studied.
Statistical analysis
Results are expressed as the mean ± standard error of the mean (SEM). Ranges for gene expression levels are presented in each figure as 2–ΔΔCT±SEM, where SEM is calculated from the ΔΔCt values.
Comparisons between two conditions were made using t-tests. Statistical analysis for gene expression levels was performed on the ΔΔCt values. Differences were considered statistically significant at p < 0.05.
Results
In GO, morphological alteration of EOMs is associated with high muscular cell apoptosis
EOM of control patients with strabismus or non-GO disease (Fig. 1.1A and 1B) were made of bundles with tightly associated cells. Mast cells were rarely observed in control muscles (Fig. 1.1C). In GO patients, the muscular cells were dissociated by edema and inflammatory infiltrates in the active stage (Fig. 1.1D), and by fibrosis and adipogenesis in the chronic stage (Fig. 1.1E). At the later stage, orbital muscles were infiltrated by numerous mast cells (Fig. 1.1F) recognized by their dense basophilic granules, and signs of degranulation were often observed on toluidine blue–stained sections (Figure 1.1F, insert).
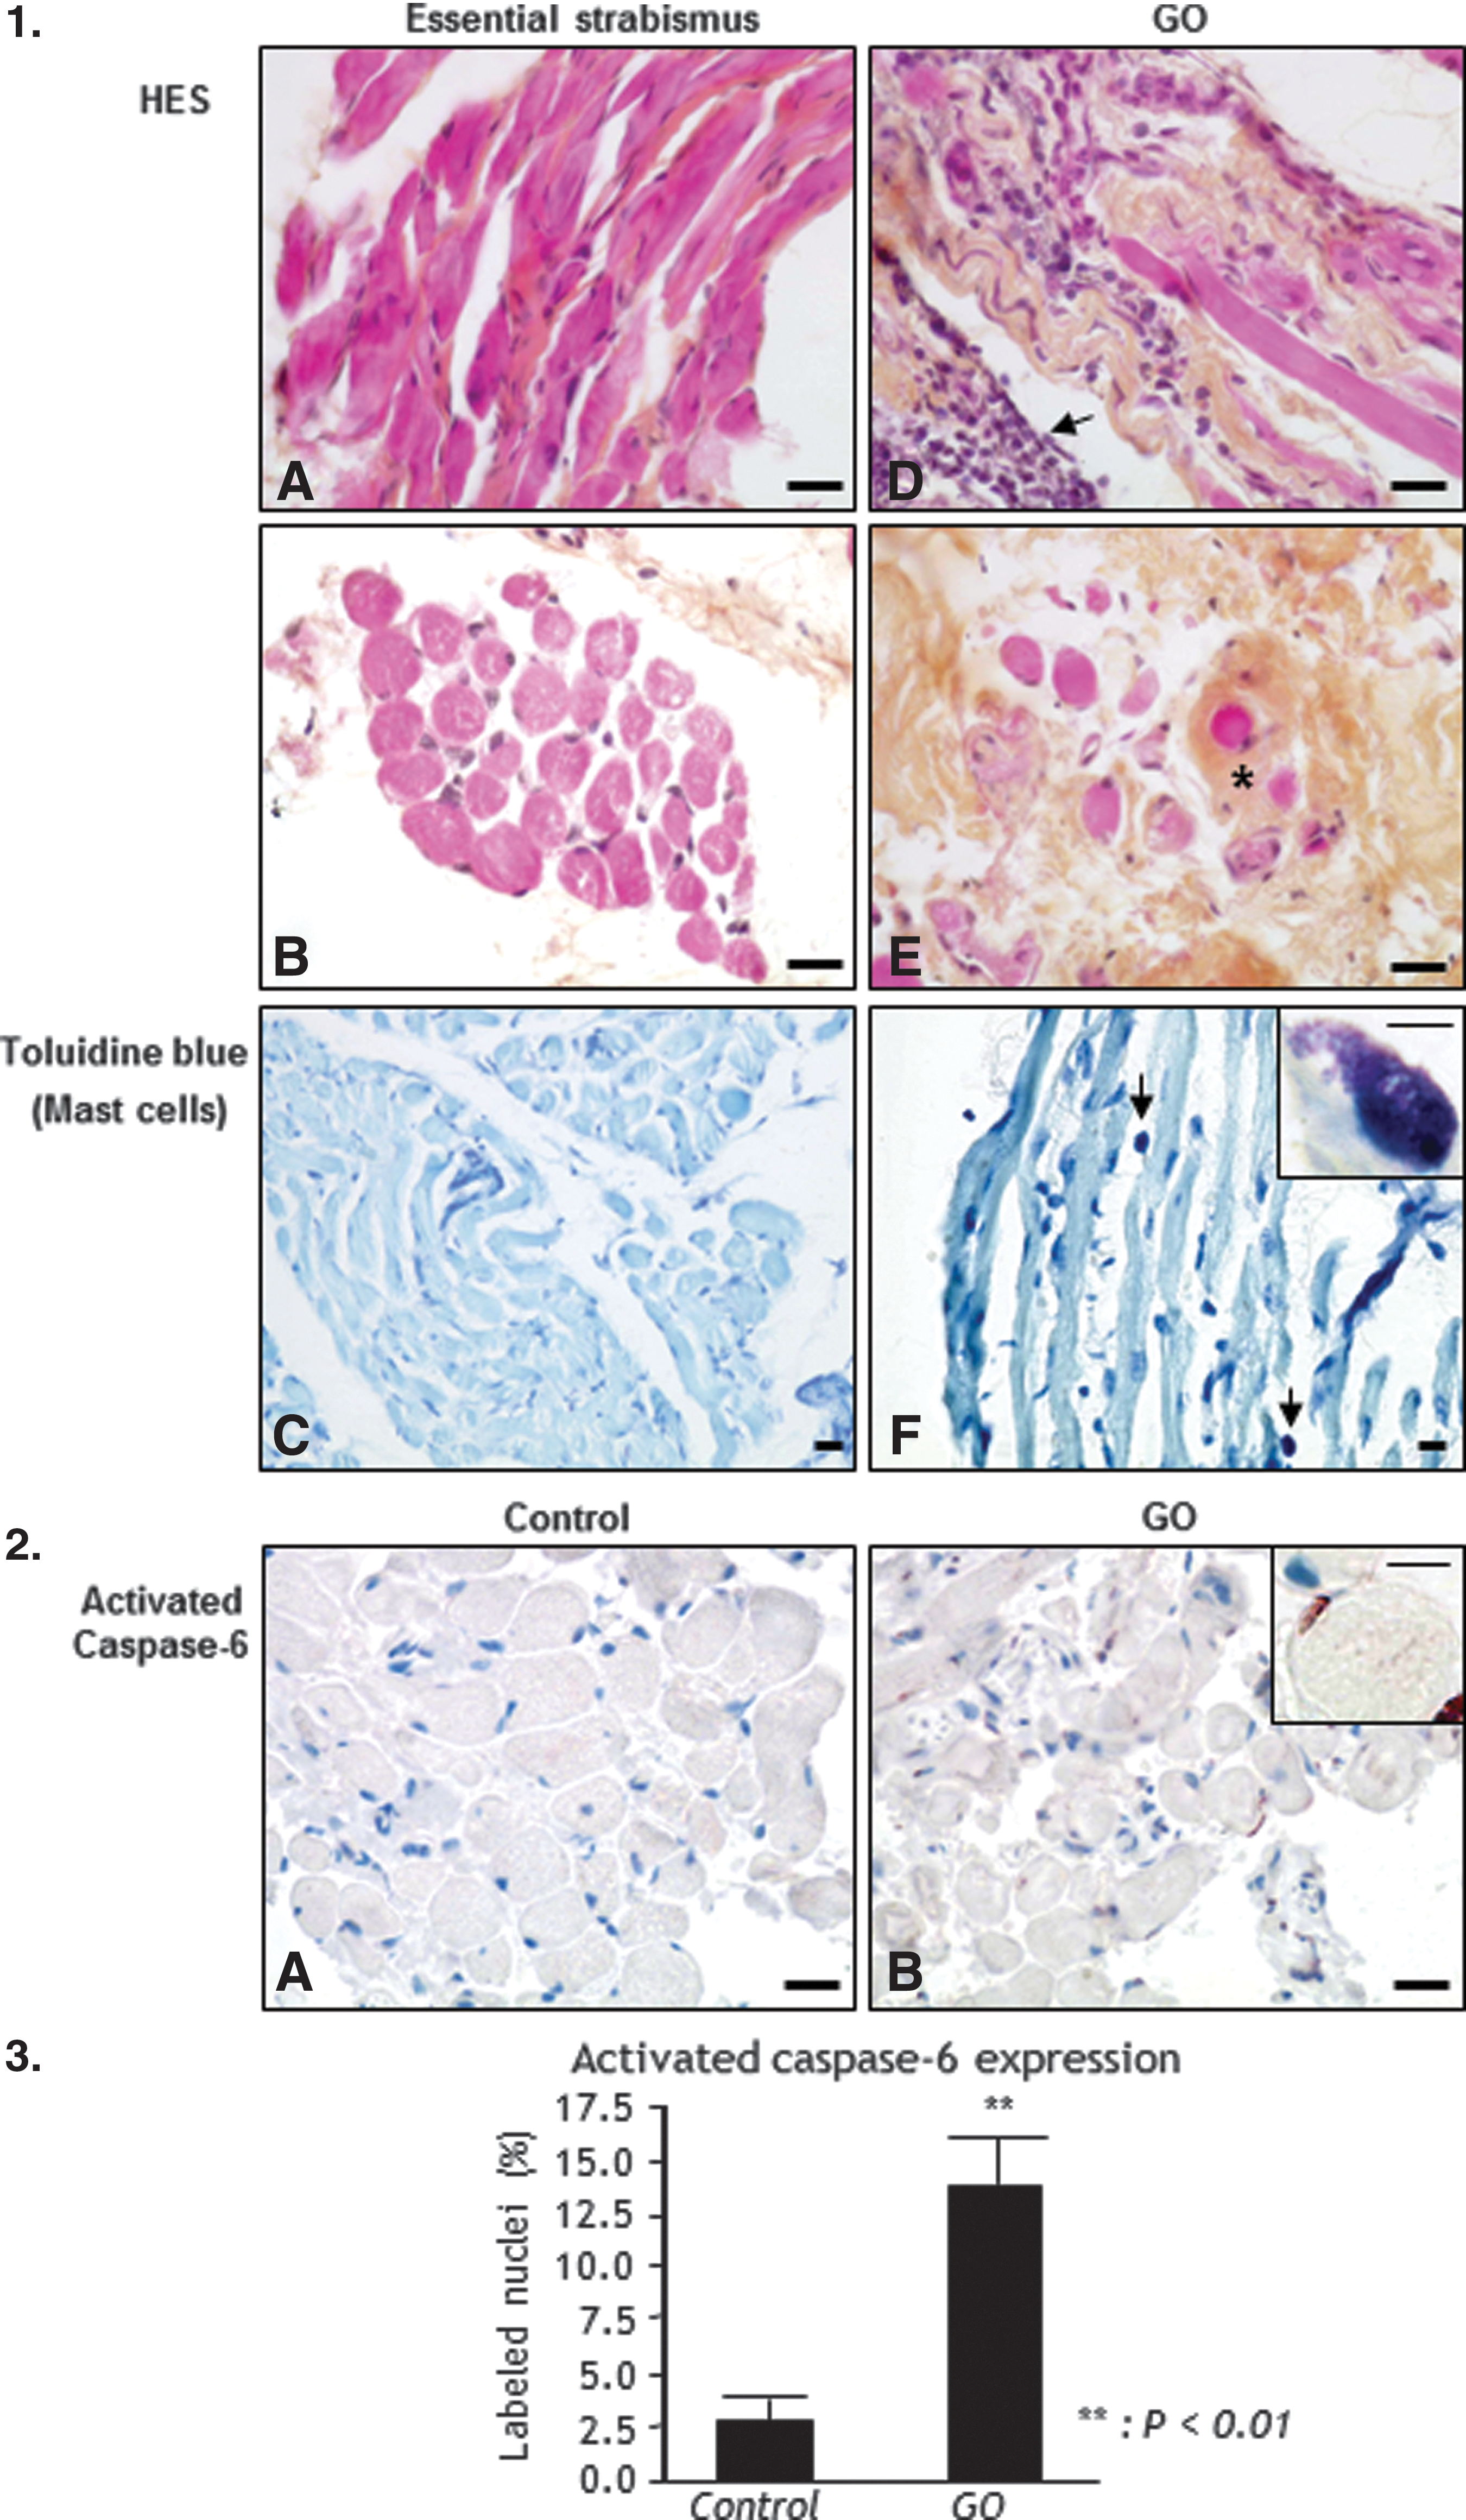
Histology and apoptosis of Graves' orbitopathy (GO) extraocular muscles (EOM; n = 19) and control EOM (n = 23). 1.1. Morphology of EOM. Hematoxylin-eosin-saffron (HES) staining of EOM (
In control and non-GO cases, the level of cell apoptosis was low, and the nuclei of no or only few muscular cells were labeled with the anti-activated caspase-6 antibody (Fig. 1.2A). In GO, numerous nuclei of muscular cells were labeled with the anti-activated caspase-6 antibody (Fig. 1.2B). This apoptosis rate was significantly higher in GO muscular cells than in cells from control cases (7-fold increase, p < 0.01; Fig. 1.3).
Increased OS in GO is associated with upregulation of PRDX5, catalase, ApN, and PPARγ in EOMs
In controls, 4-HNE, a marker of lipid peroxidation, was weakly expressed (Fig. 2A). Its expression was elevated in all GO cases (Fig. 2B and C). In cases with levels of TSHR-Ab > 12.5 IU/L (normal values <12.5 IU/L; Medizym T.R.A, Medipan, recalibration and restandardization with cutoff <12.5 IU/L), a large majority displayed a more intense labeling (Fig. 2B) in comparison with cases with a lower level of TSHR-Ab (Fig. 2C). PRDX5 was also expressed at a low level in the control EOM (Fig. 2D). The labeling was cytoplasmic and sometimes nuclear. In contrast, PRDX5 was more intensively detected in GO, and a diffuse staining was observed in the cytoplasm of all cells with an intensity that correlated with the TSHR-Ab levels (Fig. 2E and F). In controls, catalase expression was low (Fig. 2G), whereas in GO, the labeling was higher and correlated with the level of TSHR-Ab (Fig. 2H and I). ApN labeling was light and variable among cells in controls (Fig. 2J). In GO cases, ApN labeling was very intense (Fig. 2K) to intense (Fig. 2L), with a positive correlation with TSHR-Ab levels, and was localized in the peripheral cytoplasm. PPARγ, an inductor of ApN, was detected in the cytoplasm of control EOM (Fig. 2M), and sometimes in the nucleus. PPARγ nuclear labeling was strongly increased in GO (Fig. 2N and O).
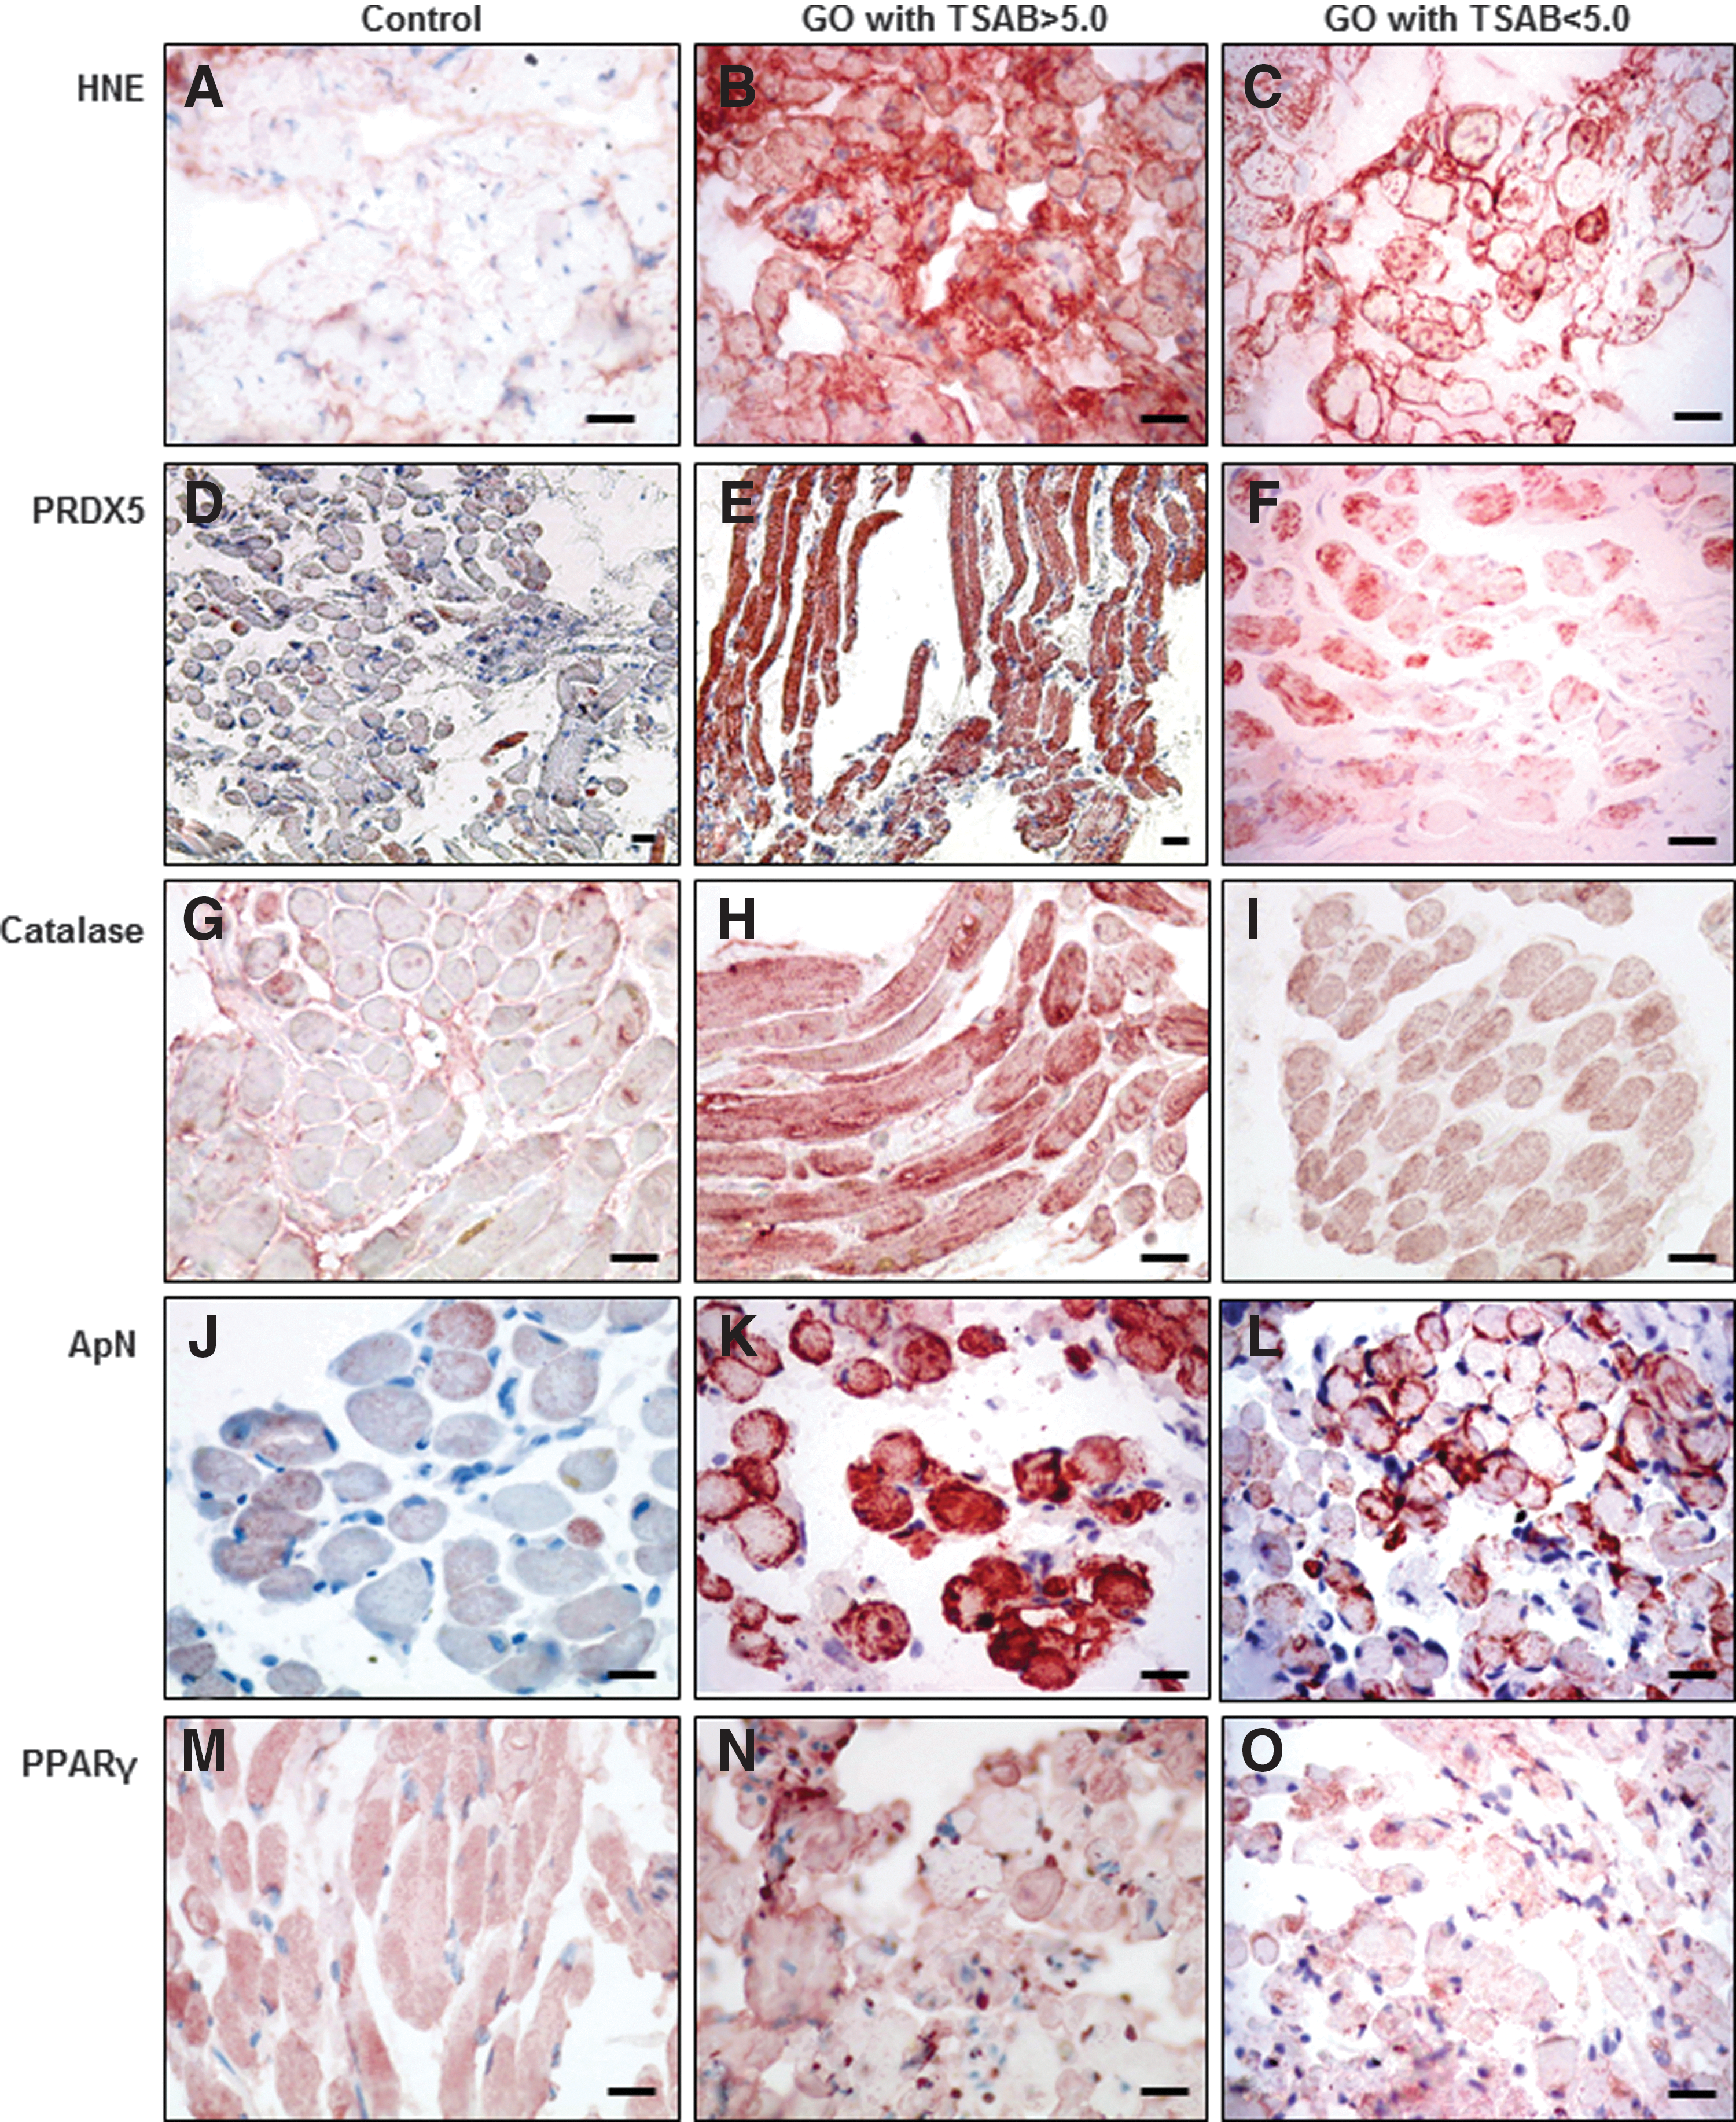
Immunohistodetection of hydroxynonenal (HNE), PRDX5, catalase, adiponectin (ApN), and peroxisome proliferator-activated receptor gamma (PPARγ) in EOM cells. HNE expression is moderate in control orbital muscular cells (
mRNA levels of ApN and PPARγ were significantly higher in GO muscular cells than in control muscular cells (4-fold increase, p < 0.01; Fig. 3A and B). ApN and PPARγ mRNA expression levels were positively correlated in GO as well as in controls (Fig. 3C).

mRNA expression of ApN and PPARγ. ApN (
In GO, orbital adipocytes display OS with upregulation of antioxidant proteins
4-HNE was only weakly positive in control orbital adipocytes (Fig. 4.1A). In contrast, the increased inflammation in GO was associated with a high production of 4-HNE in the adipocytes (Fig. 4.1B) consistent with increased OS. The global antioxidant protein expression was increased in the adipocytes of GO in response to this OS. As compared to controls (Fig. 4.1C), PRDX5 expression was higher in GO adipocytes (Fig. 4.1D). A low level of catalase expression was also observed in control orbital adipocytes (Fig. 4.1E), whereas its expression also strongly increased in the cytoplasm of all GO adipocytes (Fig. 4.1F). In control adipocytes, ApN was detected with a perinuclear localization (Fig. 4.1G). In GO, ApN expression was increased not only in the cytoplasm of adipocytes, but also in endothelial cells and in the lumen of capillaries (Fig. 4.1H). In controls, PPARγ expression was low (Fig. 4.1I) and PPARγ nuclear expression was increased in GO adipocytes (Fig. 4.1J).

Immunohistodetection of HNE, PRDX5, catalase, ApN, and PPARγ in the orbital fat (n = 10) and thyroid (n = 7) of GD patients compared with controls (n = 8; n = 10). 4.1. Immunohistodetection of HNE, PRDX5, catalase, ApN, and PPARγ in orbital adipocytes. The expression of 4-HNE is low in control orbital adipocytes (
In GD, OS and upregulation of antioxidant proteins are observed in thyrocytes
4-HNE was very weakly detected in control thyrocytes (Fig. 4.2A). In GD, the thyrocytes displayed a stimulated and hyperplasic phenotype and the glandular parenchyma was infiltrated by lymphocytes. 4-HNE was highly expressed in the cytoplasm of small cuboidal cells (Fig. 4.2B), suggesting that these cells are exposed to high OS as previously reported (15). Compared with controls (Fig. 4.2C and E), the stimulated follicles in GD also showed greatly increased expression of the antioxidant proteins PRDX5 and catalase (Fig. 4.2D and F). In control thyroids, ApN was detected in the endothelial cells but not in the thyrocytes (Fig. 4.2G), whereas ApN expression was very high in the lumina of the capillaries in the GD thyroids (Fig. 4.2H). Moreover, PPARγ expression was also low in control thyroids (Fig. 4.2I), but its nuclear expression was high in GD thyrocytes (Fig. 4.2J) in active follicles with a cuboidal epithelium.
Discussion
In this work, a morphological analysis was performed evaluating OS and antioxidant defenses in EOM and orbital fat cells, as well as in thyrocytes of GD patients with GO. Up to now, most of the studies about GO pathogenesis focused on orbital fibroblasts, and alterations in the muscular cells remain poorly characterized due to the limited access to in vivo muscle biopsies.
The present data indicate that in GO, an extended mast-cell infiltration occurs in EOM and orbital fat in the chronic phase of the disease. Increased OS and upregulation of antioxidant proteins (PRDX5 and catalase) were also demonstrated in extraocular muscular cells, orbital adipocytes, and thyrocytes. When the antioxidant defenses are overwhelmed, cell apoptosis ensues, as shown in GO muscular cells. An increased production of ApN and PPARγ by orbital adipocytes, but also by the extraocular muscular cells themselves, was also observed.
Th1 and Th2 lymphocytes contribute to the pathogenesis of GO at early and late stages, respectively, and orbital fibroblasts are capable of initiating the lymphocytic recruitment and tissue remodeling (1,2). In several autoimmune diseases, mast cells can interact with T and B cells and normally counteract T regulatory cell function (16). These T regulatory cells have indeed been shown to be unable to downmodulate the immune response and the tissue damage in autoimmune thyroid diseases (17).
Mast cells (18) and lymphocytes producing various cytokines have been described in GO EOM where they interact with fibroblasts (2). In the present study, signs of mast-cell degranulation were often observed, as described in the inflammatory eyelid lesions of IL-4 transgenic mice (19), mast cells being preferentially located in close vicinity to fibroblasts and adipocytes, as previously reported in GO EOM (3) and pretibial myxedema (4). In co-culture with mast cells, orbital fibroblasts generated increased levels of prostaglandin-E2 (PGE-2) (20), known to favor Th2 immune pathway (21) and to drive fibrosis.
Chemokine production by mast cells was also stimulated by cigarette smoke favoring fibrosis and chronic obstructive pulmonary disease (22). This could explain how cigarette smoking has a detrimental effect in GO (23). Reactive oxygen species (ROS) responsible for OS were also described as inducers of mast-cell activation and histamine release (24).
An increased OS and antioxidant activity have been demonstrated in orbital fibroblast cells in GO (6). The increased oxidative damage in cultured GO orbital fibroblasts was significantly correlated with TSHR-Ab levels (25). A major contribution of the present study is the demonstration that muscular cells and orbital adipocytes are targets of this OS. In muscular cells, this led to an increased apoptotic rate, as shown by the high number of cell nuclei expressing the activated caspase-6. Morphological alterations of GO EOM have been described, mainly in mitochondria (26). This could explain the liberation of calsequestrin, considered as an auto antigen involved in GO (27).
This study also showed that OS was higher when TSHR-Ab levels were higher than 12.5 IU/L. This finding is in agreement with the fact that the production of TSH-R stimulating antibodies (TSAB) is a trigger for the initiation of GO and that serum TSAB correlate with clinical disease severity (28). Nevertheless, OS persisted in subjects with normalized levels of TSHR-Ab. Increased OS and antioxidant activity were also observed in thyrocytes, as previously described (15,29). Indeed, thyrocytes must produce H2O2 that is required for hormonal synthesis. An excessive H2O2 production not used for thyroglobulin iodination is responsible for the overproduction of free radicals leading to OS. This has been demonstrated in rat thyroids during goiter involution induced by high iodide doses (30) or in caveolin-1 knockout mice (31), in Pendred's syndrome (32), and in Hashimoto's thyroiditis (15), and results in disruption of the thyroxisome, an entity required for proper thyroid hormonal synthesis (33).
As far as antioxidant defenses are concerned, PRDX5, catalase, and ApN were of interest here. PRDXs are peroxiredoxins that reduce H2O2 and alkyl hydroperoxides into H2O (34). PRDX5 is localized in mitochondria, peroxisomes, nuclei, and cytosol. It reduces peroxinitrites and protects mitochondria and nuclear DNA from oxidative damage (34). Its higher expression could be due to the production of cytokines by inflammatory cells as reported by Wang et al. who showed that IL-1β and TNFα are two main regulators of PRDX5 expression in human osteoarthritis (35,36), and in human degenerative tendons (36). Increased expression of PRDX5 was also described in GD thyrocytes (29). Catalase is also a major antioxidant, which converts H2O2 to oxygen and water and which is mainly located in peroxisomes that also contain H2O2 generating oxidases leading to ROS formation. The balance between generation and scavenging of ROS in peroxisomes is thus essential for cell homeostasis (36). The upregulation of catalase expression in GD thyrocytes, as well as in muscular cells and adipocytes in cases of GO, demonstrates that these three cell types have, besides PRDX5, another way to face OS. The upregulation of these antioxidants could be beneficial for the inhibition of GO disease, as it has been demonstrated for selenium (37). Interestingly, it has been demonstrated that the expression of the catalase gene is upregulated by PPARγ in human adipocytes (38). ApN is another protein whose transcriptional activity is stimulated by PPARγ (39). Besides its essential role in energy homeostasis, ApN displays anti-inflammatory properties (39). A major and novel observation of our work is the demonstration that ApN production is not only increased in GO adipocytes but also in GO muscular cells themselves, and this may help in cell defenses against OS.
Delaigle et al. and Jortay et al. (11 –14) have also shown an upregulation of ApN in tibial skeletal muscular cells in response to either inflammation secondary to LPS injection, or metabolic and oxidative damage associated with type 2 diabetes. In these studies, ApN upregulation was considered as a local protection against OS. It certainly has the same effect in GO muscular cells and ApN production seems to be crucial to locally counteract the inflammatory damage, oxidative stress and apoptosis.
In GO orbital fat and in GD thyroids, ApN was detected at a high level in adjacent blood capillaries. Increased serum ApN levels have been reported in GD patients and correlate with the degree of hyperthyroidism and the autoimmune process (40). This suggests that ApN could also have a systemic effect in GD to maintain the inflammatory/immune balance of the muscular cells.
ApN production could also exert other beneficial effect on muscle tissue, since it has been shown to activate muscle cells to proliferate (41) and to promote the differentiation of myoblasts into myotubes (42).
PPARγ plays an essential role in stimulating the transcriptional activity of the ApN gene and maintaining the protein expression in adipocytes (39). Increased ApN and PPARγ mRNA levels were described in GO adipose tissue (1). The present study demonstrates for the first time their increased expression in muscular cells themselves. PPARγ may also be viewed as a component of the antioxidant system, since it has been demonstrated that it protects various cell types against OS and apoptosis, and exerts anti-inflammatory properties in several diseases (10).
In conclusion, as summarized in Figure 5.1, in the case of GO, TSHR-Ab and cytokines produced by lymphocytes and mast cells infiltrating the EOM and the orbital fat induce OS in these cells. To face this increased OS, the production of antioxidant proteins (PRDX5, catalase, and ApN) is upregulated in muscular cells and adipocytes, as well as in thyrocytes in GD. The expression of catalase and ApN is upregulated by PPARγ whose expression is also increased in GO muscular cells and adipocytes. Nevertheless, this oxidative load is insufficiently compensated by the antioxidant defenses, regardless of the TSHR-Ab levels, leading to an elevated apoptosis rate among the EOM. These data suggest that there may be a potential benefit of initiating antioxidant therapy, even in patients at a chronic stage and normalized TSHR-Ab levels (see Fig. 5.2).

Schematic model of Graves' orbitopathy oxidative stress mechanisms. 5.1. Cytokines and TSHR-Ab are responsible for OS in EOM and in orbital adipocytes. In GO, lymphocytes and mast cells infiltrating the orbital tissue produce TSHR-Ab and cytokines. This triggers an important reaction on orbital fibroblasts expressing the TSH receptor. This affects the morphological status of EOM cells and orbital adipocytes leading to increased OS. Some of the muscular cells appear unaffected, others are subject to high OS, and some undergo aptoptosis. In order to counteract this increased OS, an upregulation of antioxidant proteins (PRDX5, catalase, and ApN) is produced in the EOM and the adipocytes. Catalase and ApN expression is upregulated by PPARγ whose expression is also increased in GO muscular cells and adipocytes. 5.2. Disruption of redox homeostasis in GO. In GO, the production of reactive oxygen species is insufficiently compensated by the antioxidant proteins and is related to TSHR-Ab levels, to cytokine production, to smoking, and to radiotherapy. Inflammation and immune reaction can be partially controlled with glucocorticoid therapy. This increase in OS in the EOM cells leads to an elevated apoptosis rate, increased inflammation, and fibrosis. The antioxidant defenses may be positively enforced by the therapeutic use of antioxidant treatments such as selenium.
Footnotes
Acknowledgments
We would like to acknowledge Christine de Ville de Goyet, Marc de Bournonville, Michelle Cougnon and Walter Hudders for their technical help.
Author Disclosure Statement
No competing financial interests exist.