
Abstract
Background:
Computer simulation tools for education and research are making increasingly effective use of the Internet and personal devices. To facilitate these activities in endocrinology and metabolism, a mechanistically based simulator of human thyroid hormone and thyrotropin (TSH) regulation dynamics was developed and further validated, and it was implemented as a facile and freely accessible web-based and personal device application: the THYROSIM app. This study elucidates and demonstrates its utility in a research context by exploring key physiological effects of over-the-counter thyroid supplements.
Methods:
THYROSIM has a simple and intuitive user interface for teaching and conducting simulated “what-if” experiments. User-selectable “experimental” test-input dosages (oral, intravenous pulses, intravenous infusions) are represented by animated graphical icons integrated with a cartoon of the hypothalamic–pituitary–thyroid axis. Simulations of familiar triiodothyronine (T3), thyroxine (T4), and TSH temporal dynamic responses to these exogenous stimuli are reported graphically, along with normal ranges on the same single interface page; and multiple sets of simulated experimental results are superimposable to facilitate comparative analyses.
Results and Conclusions:
This study shows that THYROSIM accurately reproduces a wide range of published clinical study data reporting hormonal kinetic responses to large and small oral hormone challenges. Simulation examples of partial thyroidectomies and malabsorption illustrate typical usage by optionally changing thyroid gland secretion and/or gut absorption rates—expressed as percentages of normal—as well as additions of oral hormone dosing, all directly on the interface, and visualizing the kinetic responses to these challenges. Classroom and patient education usage—with public health implications—is illustrated by predictive simulated responses to nonprescription thyroid health supplements analyzed previously for T3 and T4 content. Notably, it was found that T3 in supplements has potentially more serious pathophysiological effects than does T4—concomitant with low-normal TSH levels. Some preparations contain enough T3 to generate thyrotoxic conditions, with supernormal serum T3-spiking and subnormal serum T4 and TSH levels and, in some cases, with normal or low-normal range TSH levels due to thyroidal axis negative feedback. These results suggest that appropriate regulation of these products is needed.
Introduction
W
This study describes THYROSIM, a novel simulation tool based on this model, implemented as a user-friendly web application (app) and globally accessible via the Internet. THYROSIM has been developed primarily for researchers, teachers, clinicians, and others interested in and more or less familiar with the workings of TH regulation. Modern computational and Internet technology tools have been exploited for facilitating the complex human interface issues. Only pictures, graphs, and familiar clinical science language and quantitative ideas are used on the app interface—no higher math is required. It is offered as an accessible tool for research and teaching about the dynamic regulation of this multi-feedback system in health and disease, as well as a tool for patient education.
First, the embedded simulation model is further validated with additional published clinical data not used in model development, which demonstrably extends its potential applicability in the clinic, research laboratory, and classroom. Then the practical utility of the THYROSIM simulator for interactively teaching and conducting simulated “what-if” experiments is demonstrated using examples of current clinical and public health import. Several “what-if” simulations of plasma hormone responses for hypothetical dosing of subjects with levothyroxine, or with non-prescription “thyroid support supplements” are presented, several of which have been found to contain liothyronine and/or T4 in clinically significant amounts (6). THYROSIM is used to simulate the effects of these oral dosage supplements on circulating thyroxine (T4), triiodothyronine (T3), and thyrotropin (TSH) in normal adults. The results suggest that some of these over-the-counter (OTC) “supplements” will induce significant perturbations in circulating THs and that appropriate regulation of these products is needed to prevent serious health consequences, including thyrotoxicosis.
The THYROSIM web app is freely available via all major web browsers, including Internet Explorer, Google Chrome, Mozilla Firefox, Apple Safari, and Amazon Silk, making THYROSIM available on a variety of personal devices and tablets (e.g., iPhone, iPad, Android, Kindle®, Nook®) as well as laptop and desktop computers. It is fully accessible from user (client) computers or devices by remotely connecting to the UCLA (server) website at:
An Android OS-based version of THYROSIM is also being made available as a self-contained app. It is available by request from the corresponding author, and will be made available for free download at the Google apps website. The mathematical model embedded in THYROSIM is represented by 13 ordinary differential equations (ODEs), 12 additional algebraic equations describing various terms in the ODEs, 3 output measurement equations and more than 50 physiological parameters (5). All are given in the Supplementary Data (Supplementary Data are available online at
Materials and Methods
THYROSIM: what it is and how it works
A full screenshot of the animated cartoon and results interface is shown in Figure 1. Brief directions for use are opened at the top of the screen. All simulation results are given quantitatively on the right-hand side of the interface, graphed as familiar T3, T4, and TSH temporal dynamic responses, each with normal-range bands shown in yellow/crosshatched. T4, T3, and TSH are graphed separately, in familiar unit scales, so that individual responses can be better visualized and compared. On a computer, hovering the mouse over graphed results generates a label containing numerical (time and concentration) values of the nearest point, as illustrated in Figure 1, where T3 = 1.16 at 1.85 days.
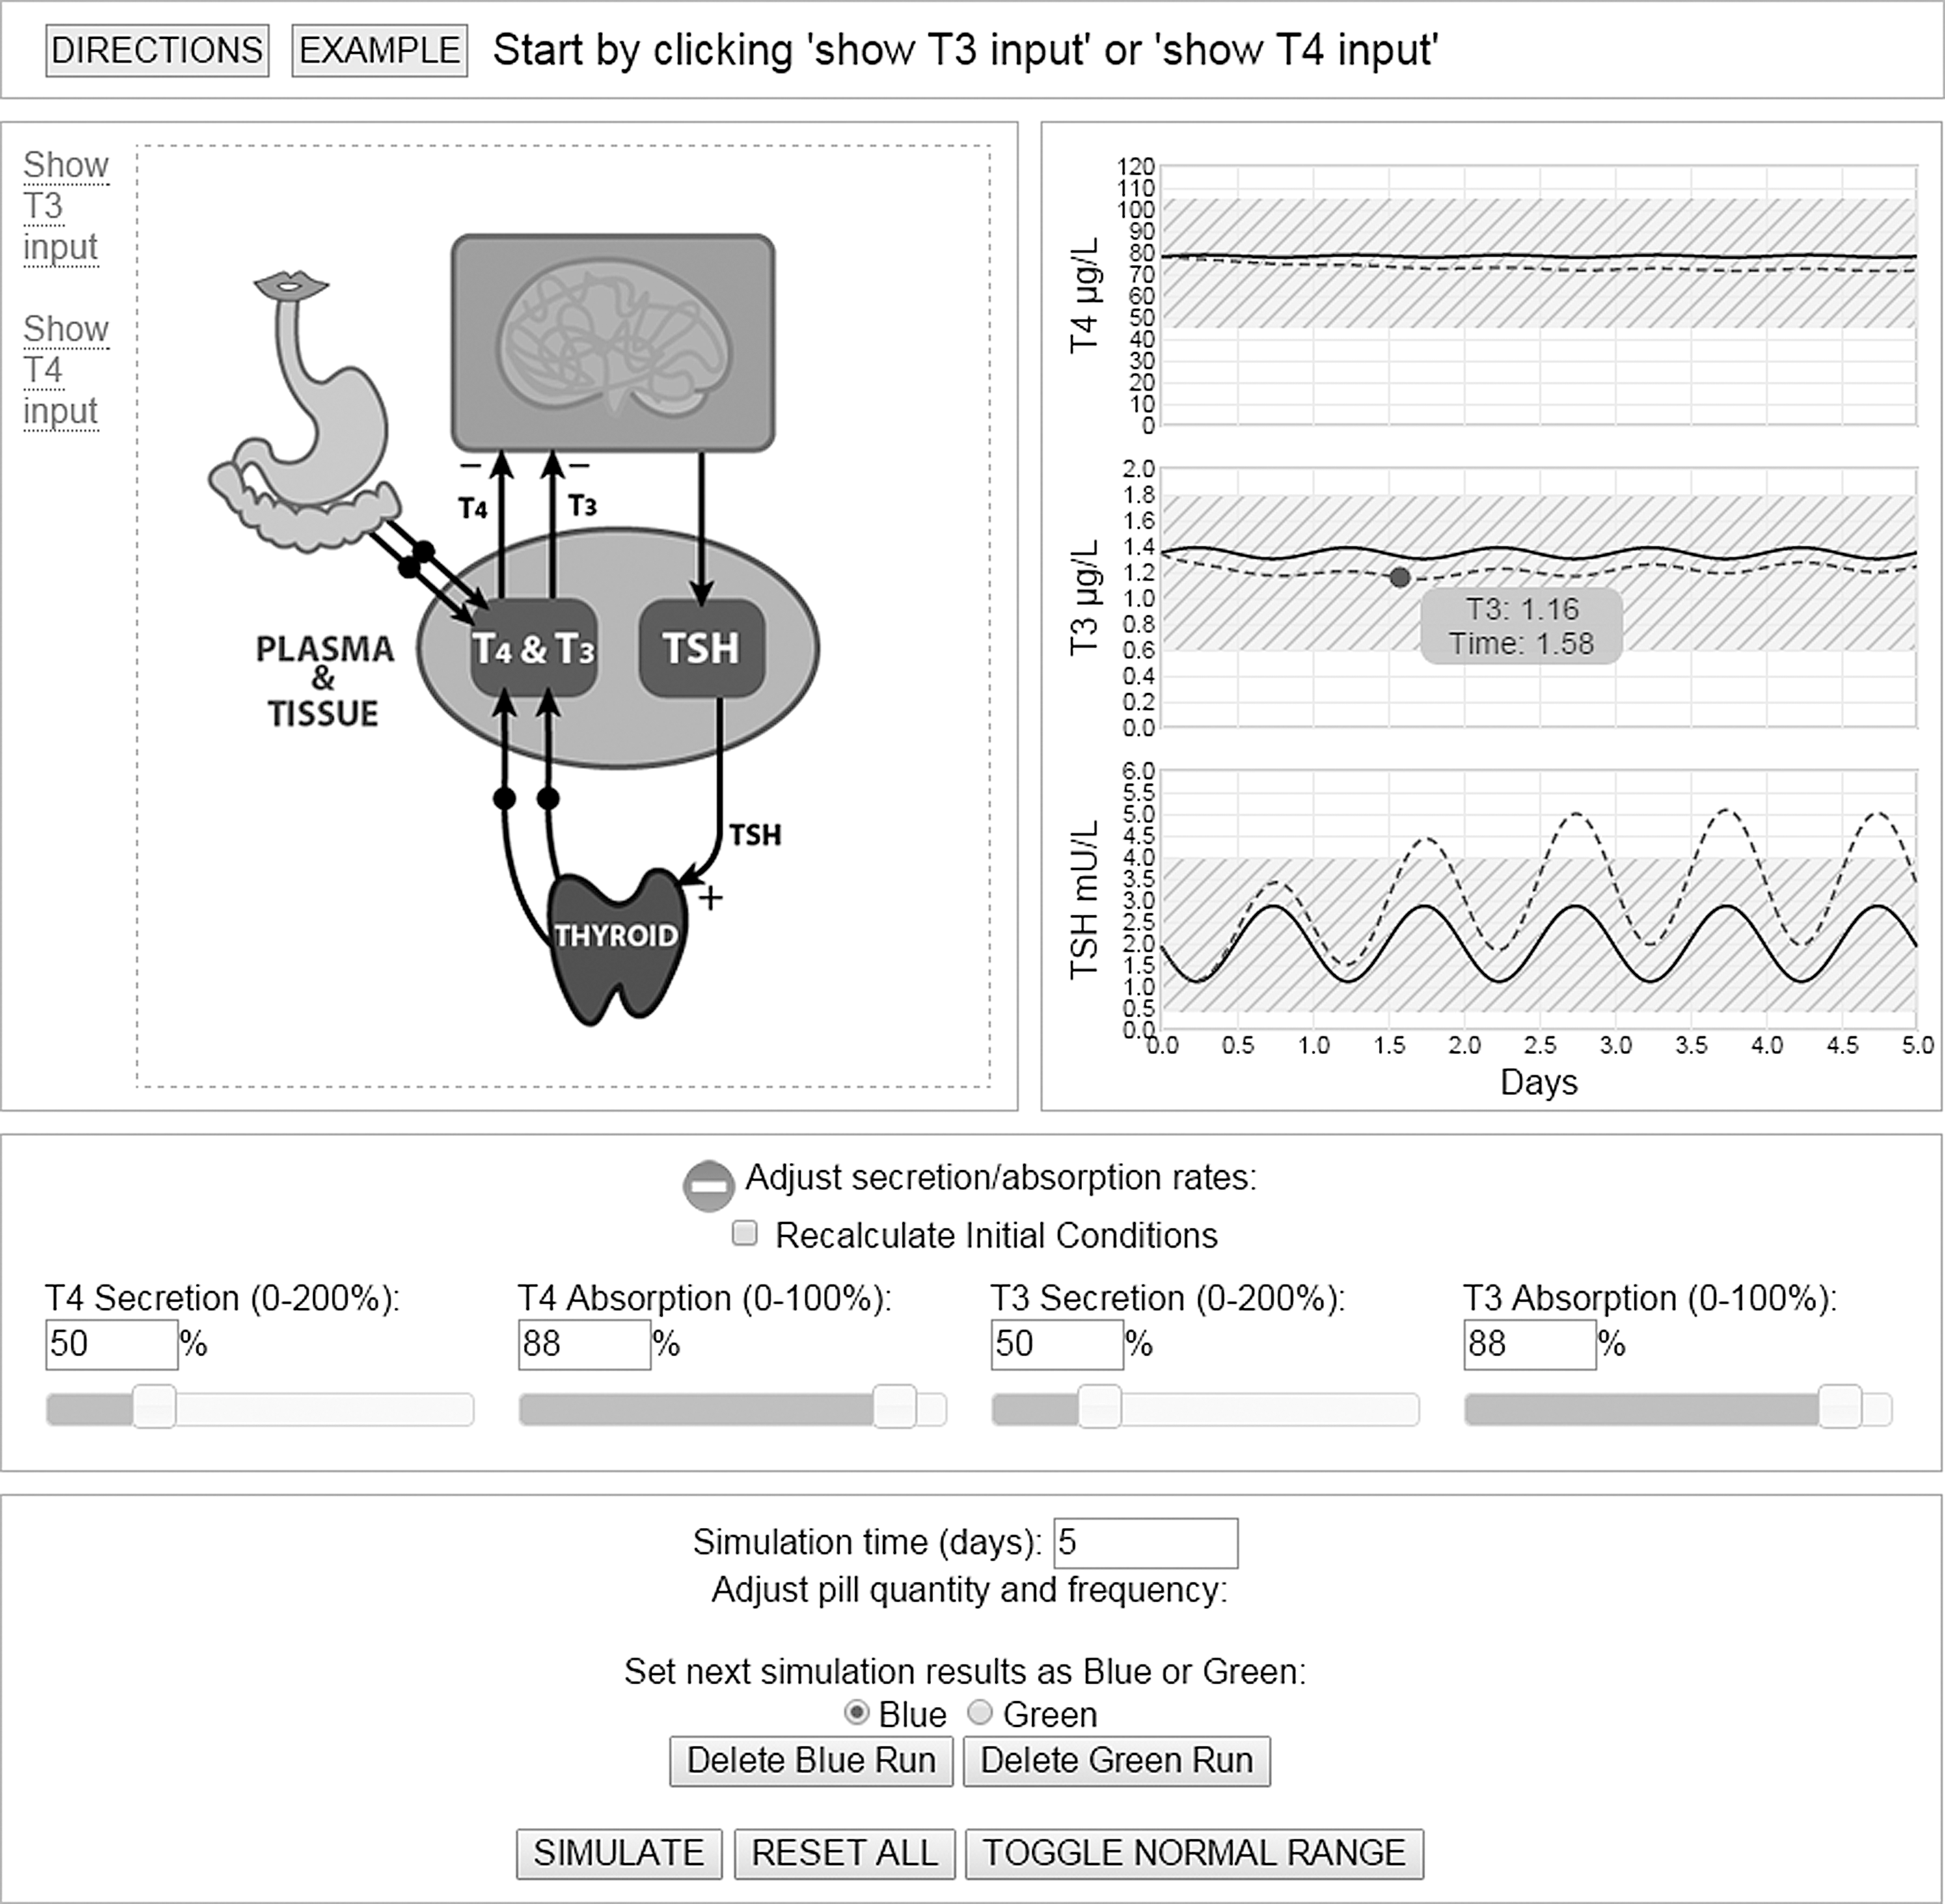
Single-page screenshot of the web application, showing graphical interface for implementing simulation experiments, with hormonal responses to two “what-if” experiments: (i) euthyroid steady-state conditions; (ii) response to simulated surgical hemi-thyroidectomy (see text), both over five days. Detailed hormone concentrations at any time are available by hovering the mouse over the plots, as shown for triiodothyronine (T3) at time 1.58 days. DIRECTIONS for using the app and an EXAMPLE are directly accessible at the top of the single interface page, as shown.
Figure 1 includes two sets of example results. The first are the built-in example graphs, run from the top of the screen—a simulation of normal TH dynamics over a five-day period (solid blue curves). The dashed green curves are for a superimposed “what-if” experiment described further below.
The cartoon image on the upper left-hand side of Figure 1 represents the whole body (pink oval), brain and feedback system components, and exogenous entry pathways that include absorption of oral inputs through the gut and intravenous (IV) pulse and infusion inputs. The top far-left is where exogenous T3 and T4 (TH) input stimuli are specified by the user. Each TH has an oral input (pill) icon, IV pulse (syringe) icon, and IV infusion (IV bag) icon. Inputs are color-coded (T3 is blue and T4 is green) so they are easily distinguished. When an input is added, an associated animation is shown. Oral input stimuli, by default, require dose, dosing interval, and start and end day values, all entered in the bottom-half of the interface. An IV-pulse input requires dose and start day. IV-infusion inputs require dose and start and end day values, also entered in the bottom-half of the interface. Multiple inputs—different doses, different doses at different times, and so on—are entered as needed for the experiment being simulated; they simply expand the list at the bottom as they are added.
Simulating “what-if” experiments
Adjusting secretion and absorption
Users can simulate a spectrum of abnormal as well as normal thyroid conditions, including hypo- and hyperthyroidism and malabsorption, by adjusting T3 and T4 secretion and absorption rates. Controls for T4/T3 secretion/absorption rate changes are located beneath the center image. These can be adjusted to simulate abnormal states (change the values directly in the box or via scrollbars by clicking on the orange-white “+”). Euthyroid (default) conditions are defined as 100% (T4 secretion), 88% (T4 absorption); 100% (T3 secretion) and 88% (T3 absorption) (1,2), and simulation steady-state initial conditions (ICs) are precomputed to accelerate the numerical solution process. Nominal absorption percentages were estimated from real pharmacokinetic data (7) in Eisenberg et al. (1). When T4/T3 secretion/absorption values are changed, the dynamics of the system are different, and the default behavior is to recalculate ICs. Users also have the option to use euthyroid steady-state IC values, which can be useful for simulating a change in a patient condition, for example for simulating hormone dynamics after thyroidectomy.
To begin a simulated experiment, users enter test-input and other simulation “what-if” experimental conditions into their web browser via the single-screen graphic interface, as described above and further below. This input is validated (silently) and, if needed, the web application alerts the user to make corrections or prompts the remote UCLA server to begin simulating the model experiment. A program on the server parses the input from the user-client and generates internal commands to execute the model solver on the server. The model ODEs are solved numerically using the open-source, freely available ODE solver in OCTAVE (8). (Details are given in the Supplementary Data.) When simulation is complete, results are sent back to the user's browser, and plasma T4, T3, and TSH time-course responses to the simulated test-inputs are graphed on the user interface screen, as in Figure 1. Computations are done in molar units and hormonal output results are converted to μg/L or mU/L for T4, T3 and TSH time-course plotting on the screen.
For example, the dashed green hormone results curves in Figure 1 simulate a hemi-thyroidectomy. This “what-if” experiment was done by first adjusting the thyroidal secretion rates to 50%, setting the slider positions halfway in the lower part of Figure 1. “Recalculate Initial Conditions” was then unchecked for the hemi-thyroidectomy condition, so both sets of results used euthyroid ICs. The experimental goal was to observe the dynamic responses following surgical hemi-thyroidectomy in an otherwise euthyroid individual.
The dashed green curve graphs display T4, T3, and TSH dynamic responses to the simulated experiment. The T4 and T3 graphs show small oscillations. T4 decreases very slowly, whereas T3 levels fall briefly at first, but then increase and continue to approach the solid euthyroid steady-state line slowly. For TSH, oscillations are stable for the euthyroid solid simulation curve, whereas the green dashed curve response show oscillations with increasing mean values, illustrating the effects on “axis” negative feedback.
Implementing and comparing different exogenous input quantities and schedules
Typical THYROSIM usage involves simulating and comparing plasma hormone response dynamics, following simulated “what-if” exogenous experimental stimuli, including oral, IV-pulse and IV-infusion hormone treatment options. For easy comparisons, the interface superimposes two sets of simulation results—a key feature of “what-if” experimentation—in two different colors (blue and green; one dashed, the other solid), as exemplified for hypothetical patient-education situations and hormone absorption comparisons in the Results section. THYROSIM allows single or multiple exogenous test-input stimuli at user-specified doses and times, and simulation time can be extended to a maximum of 100 days. For example, a user can explore different T4 and/or T3 dosages that might be given orally to reestablish euthyroid conditions over different time intervals (e.g., a month or two) in a hypothetical primary hypothyroid patient with 50% or other percent residual thyroidal secretion. Simulation time and pill quantity and frequency adjustments are made on the lower part of the interface page, populated as a user adds inputs. Added inputs (e.g., T4 or T3 doses) are arranged in chronological order based on these times. The simulation is then partitioned into intervals using these times as boundaries. ICs for each interval are adjusted by the amount of exogenous input at the specific time point, and each interval is then executed as a separate simulation increment. For IV-infusion inputs, the endpoint is also used as a boundary. Controls for deleting, enabling, and disabling inputs are provided. Results from each interval are aggregated, and all are displayed as a continuum and as a single experimental outcome on graphs of T4, T3, and TSH temporal dynamic responses, as illustrated in Figure 1 and later in Figures 5 –8.
TH absorption as well as secretion rates can be changed, with exogenous inputs (oral, IV pulse, and IV infusion) added and/or removed to explore “abnormal” responses to different experimental inputs and conditions, as illustrated further below.
Results
Additional validation studies: kinetic responses in plasma to various oral dose preparations—simulated versus measured
The physiologically based TH feedback control system model upon which the THYROSIM simulator was developed was validated against real kinetic data not used in model quantification in earlier publications (1 –5). All comparisons with T3 and/or T4 dosing in hypothyroid and euthyroid adults and children provided strong validation of the accuracy of THYROSIM plasma hormone kinetic responses over a broad range of test inputs, up to 600 μg of oral T4 and 75 μg of T3 dosing and other conditions (1 –5). Several of these are illustrated in Figure 2, with details described in the figure legend. Additional simulation studies with THYROSIM are compared here, with real TH kinetic data reported in several additional publications involving human oral dosing experiments (9 –11).

Sample THYROSIM validation studies completed previously (1
–5). (
Figure 3A and B compares THYROSIM predicted serum T3 concentrations (solid curves) to serum T3 concentration data after oral administration of desiccated thyroid containing 99 μg T3 (Fig. 3A) or 75 μg synthetic T3 (Cytomel®; Fig. 3B), respectively (9) (T4 content was 363 μg; plasma T4 kinetic response was not reported for this study). Serum T3 concentrations (solid squares), measured over 26 hours, followed real dosing at those levels (fig. 1 in LeBoff et al.) (9). Figure 3A predicted levels are quite similar to measured serum T3, with the same peak values and area under the curve (AUC). The Figure 3B curve also has about the same peak value and AUC of the serum data, anticipating the data somewhat, suggesting possibly delayed absorption of the synthetic T3 dose in these subjects studied at a different time, or a delayed release rate of T3 from the Cytomel® preparation.

One-day simulated kinetic response curves versus measured results (squares) in plasma to (
In LeBoff et al. (9), figures 2 and 3 provided plasma T3 or T4 kinetic response data for two additional studies involving oral dosing with TH. The second study (fig. 2 in LeBoff et al.) (9) was performed with synthetic T3 (75 μg Cytomel®), or with desiccated thyroid (five grains equivalent, Proloid®) containing 275 μg of T4 + 99 μg of T3, and serum T3 levels were measured over 26 hours. In the third study, desiccated thyroid (six grains equivalent, Armour®) containing 363 μg of T4 + 99 μg of T3 was administered, and plasma T4 responses were measured over 26 hours again, all within the TH ranges for which THYROSIM was developed. Close agreement in all cases further validate THYROSIM predictions after near-physiological range doses. THYROSIM also closely reproduced results of a similar study by Snyder and Utiger (10) (see their fig. 2), who gave combined daily oral doses of synthetic TH over four weeks to normal subjects at two different levels—15 μg of T3 + 60 μg of T4 and 30 μg of T3 + 120 μg of T4—and measured both plasma T3 and T4 levels over the last 24 hours of treatment. Data from Snyder and Utiger (10) and model agreement simulations are provided in Figures S3 and S4 of the Supplementary Data.
Research and education applications of THYROSIM
Testing different degrees of thyroid gland secretion loss
The dynamical simulation curves in Figure 4 illustrate kinetic hormonal responses in serum over 30 days resulting from day-zero reductions of glandular secretion, first from 100% to 10% (solid blue curves), and then from 100% to 1% (dashed green curves). Secretion rates of 1% shown in Figure 4 are for the second (dashed curve green) run. One percent residual secretion is within the remnant ranges reported after thyroidectomy in Lal et al. (12) and in the authors' own post-thyroidectomy results reported in Eisenberg et al. (4). TSH values quickly become and remain clearly overtly hypothyroid for both reductions, with values also consistent with previously published data (4). T4 and T3 values become distinctly subnormal for 1% secretion; for 10% secretion, they fall to the low end of the normal range, all as illustrated by the yellow/crosshatched-band normal ranges in the graphs.
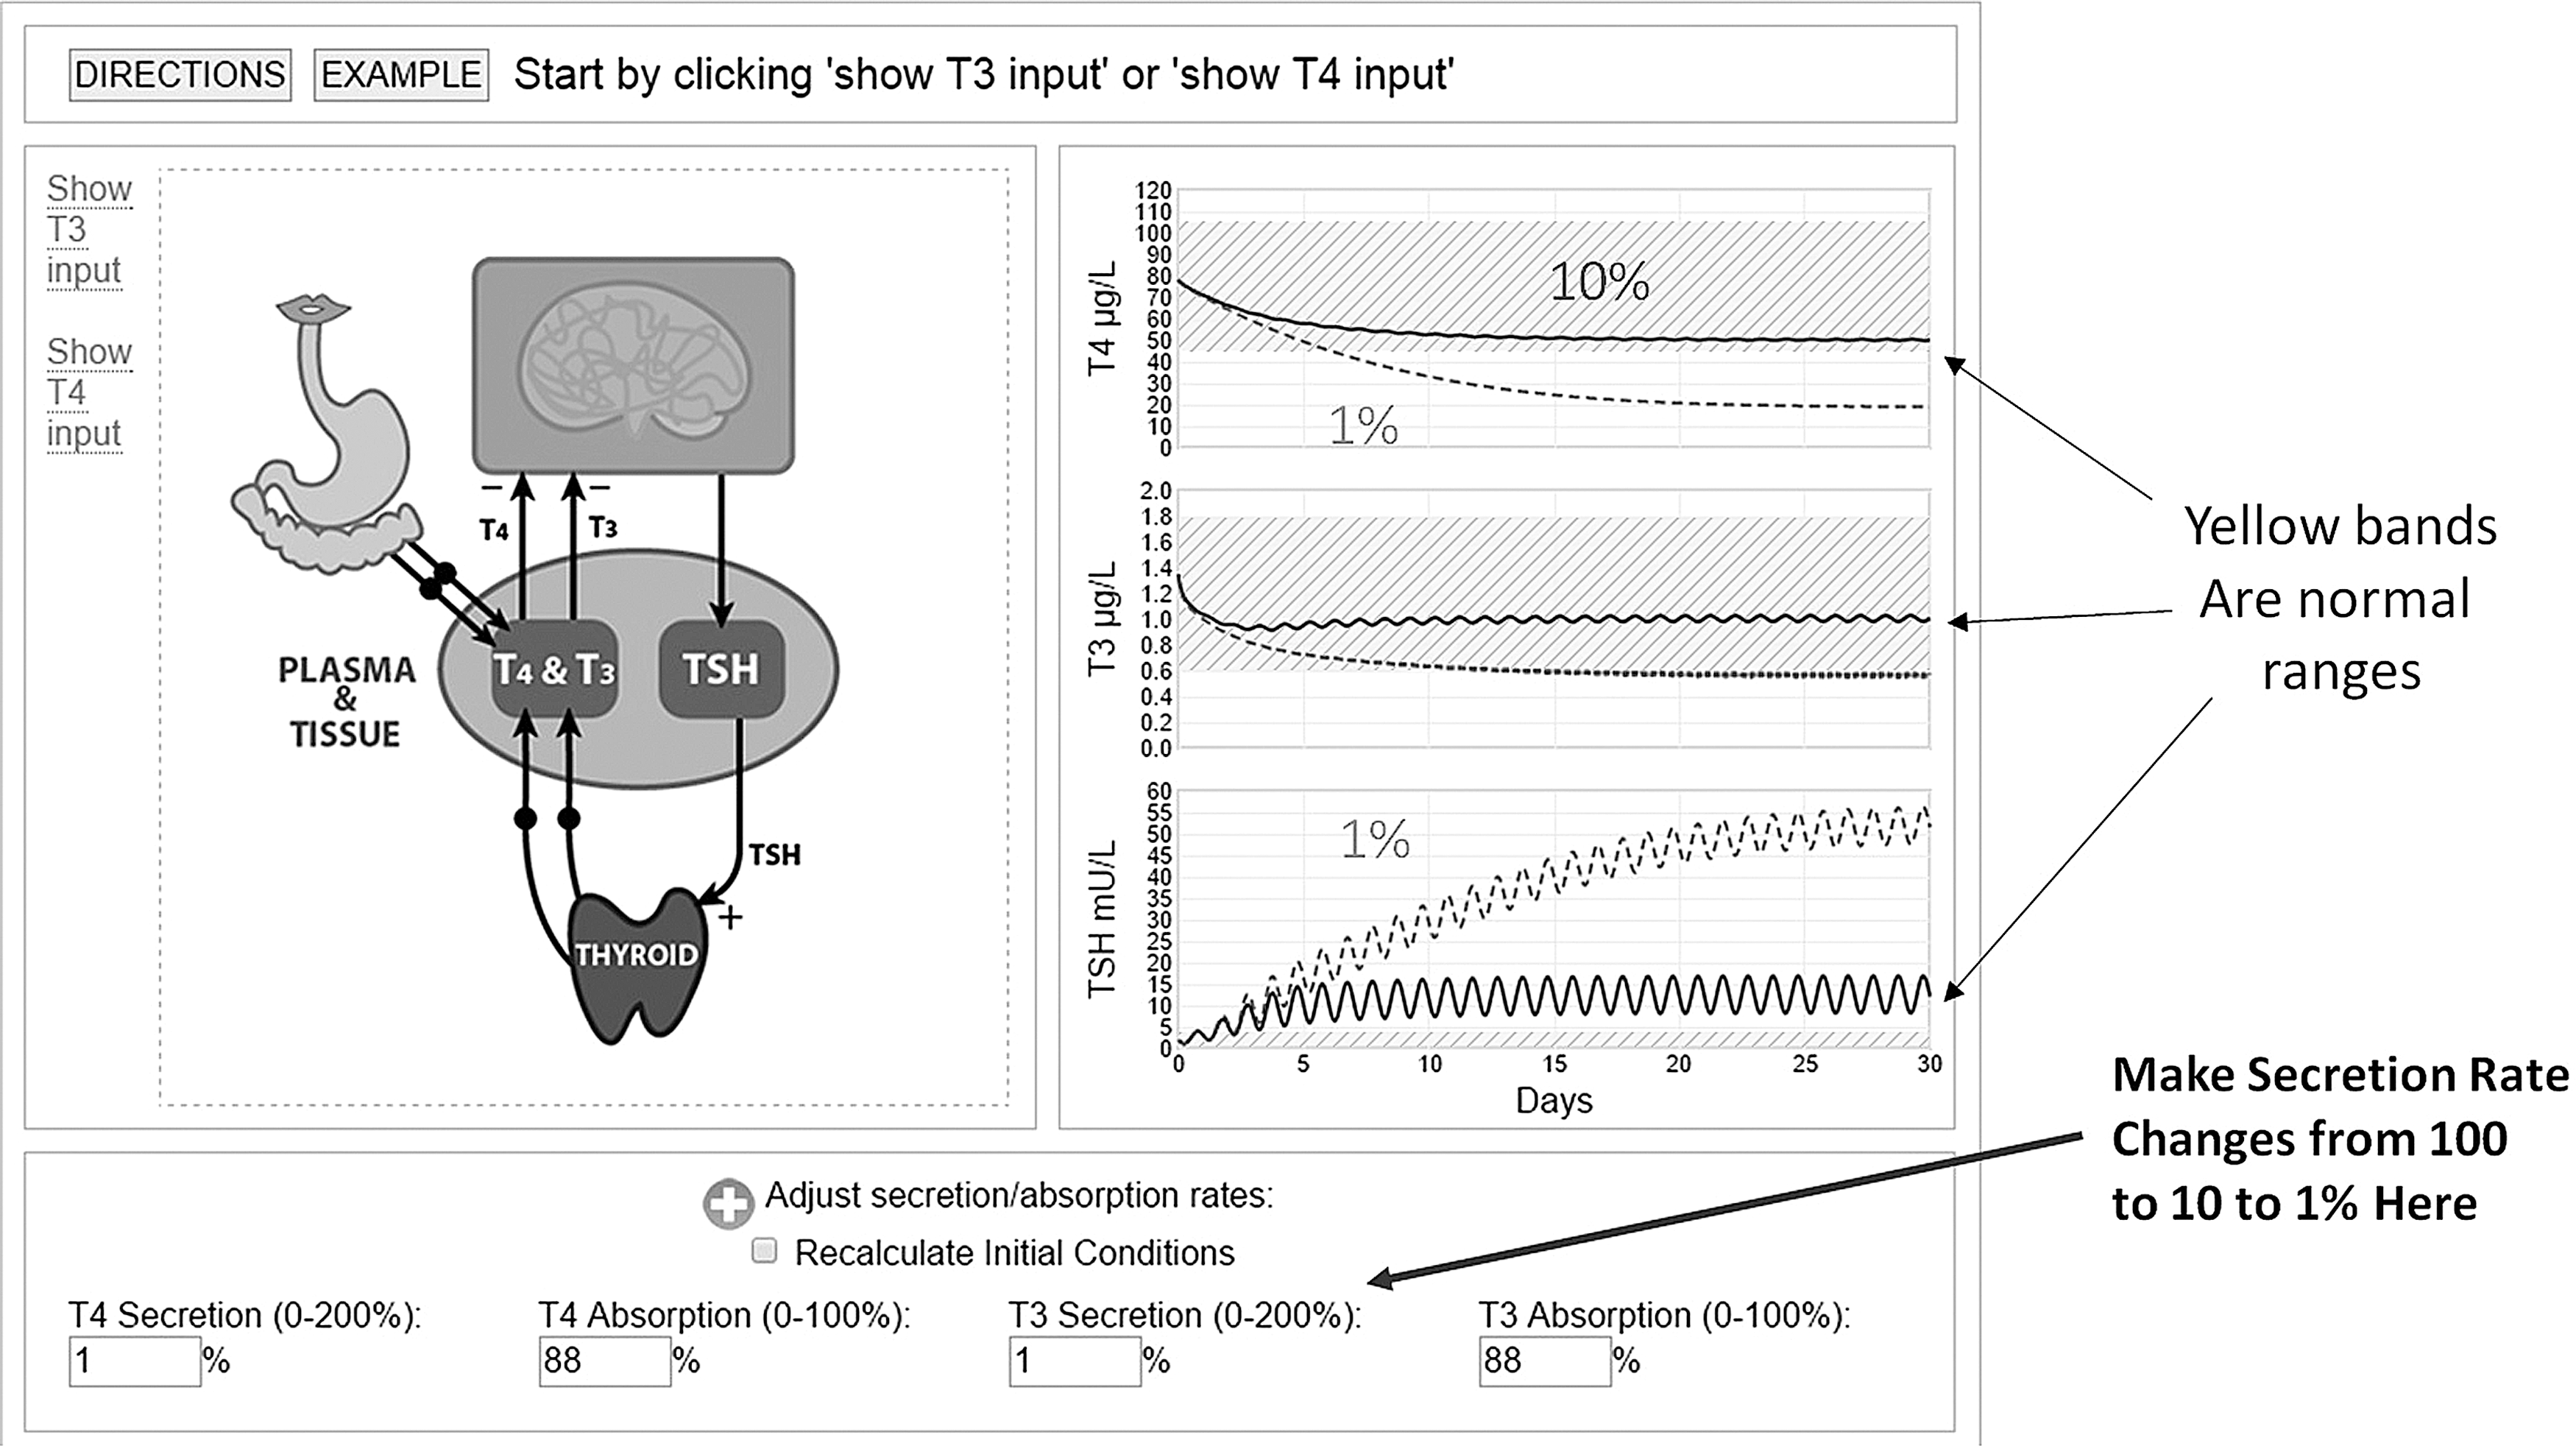
THYROSIM simulator demonstration experiments, illustrating 100% (start) down to 10% or to 1% thyroidal secretion changes at time zero and their 30-day responses to these reductions. The timing and severity of hypothyroidism is reflected in all three plots.
Testing oral hormone absorption differences
This example compares THYROSIM results using different assumptions about oral hormone absorption fractions. THYROSIM default values for the percent of oral hormone absorbed in normal human subjects are 88% for both T3 and T4, estimated from real pharmacokinetic (PK) data in 33 normal volunteers fasted over 10 hours (1,7). Figure 2 of Kaplan et al. (13) provided serum T4 concentration data over five weeks in normal subjects given daily 75 μg T3 doses for four weeks. Assuming 88% absorption of the daily T3 doses, the simulated T4 response shown in Figure 5 (dashed green curves) falls too steeply with respect to the serum T4 data over the four weeks of treatment. However, at 50% absorption (solid blue curves), it tracks the T4 data fairly well. The cessation of daily T3 dosing raises the suppressed TSH back into the normal range by reducing the negative feedback effect of added T3, as also noted for the T3 and T4 dynamics in week 5. With no mention of diet in Kaplan et al. (13), it is suspected that these not-fasted subjects ate normally, possibly reducing the absorption of T3.
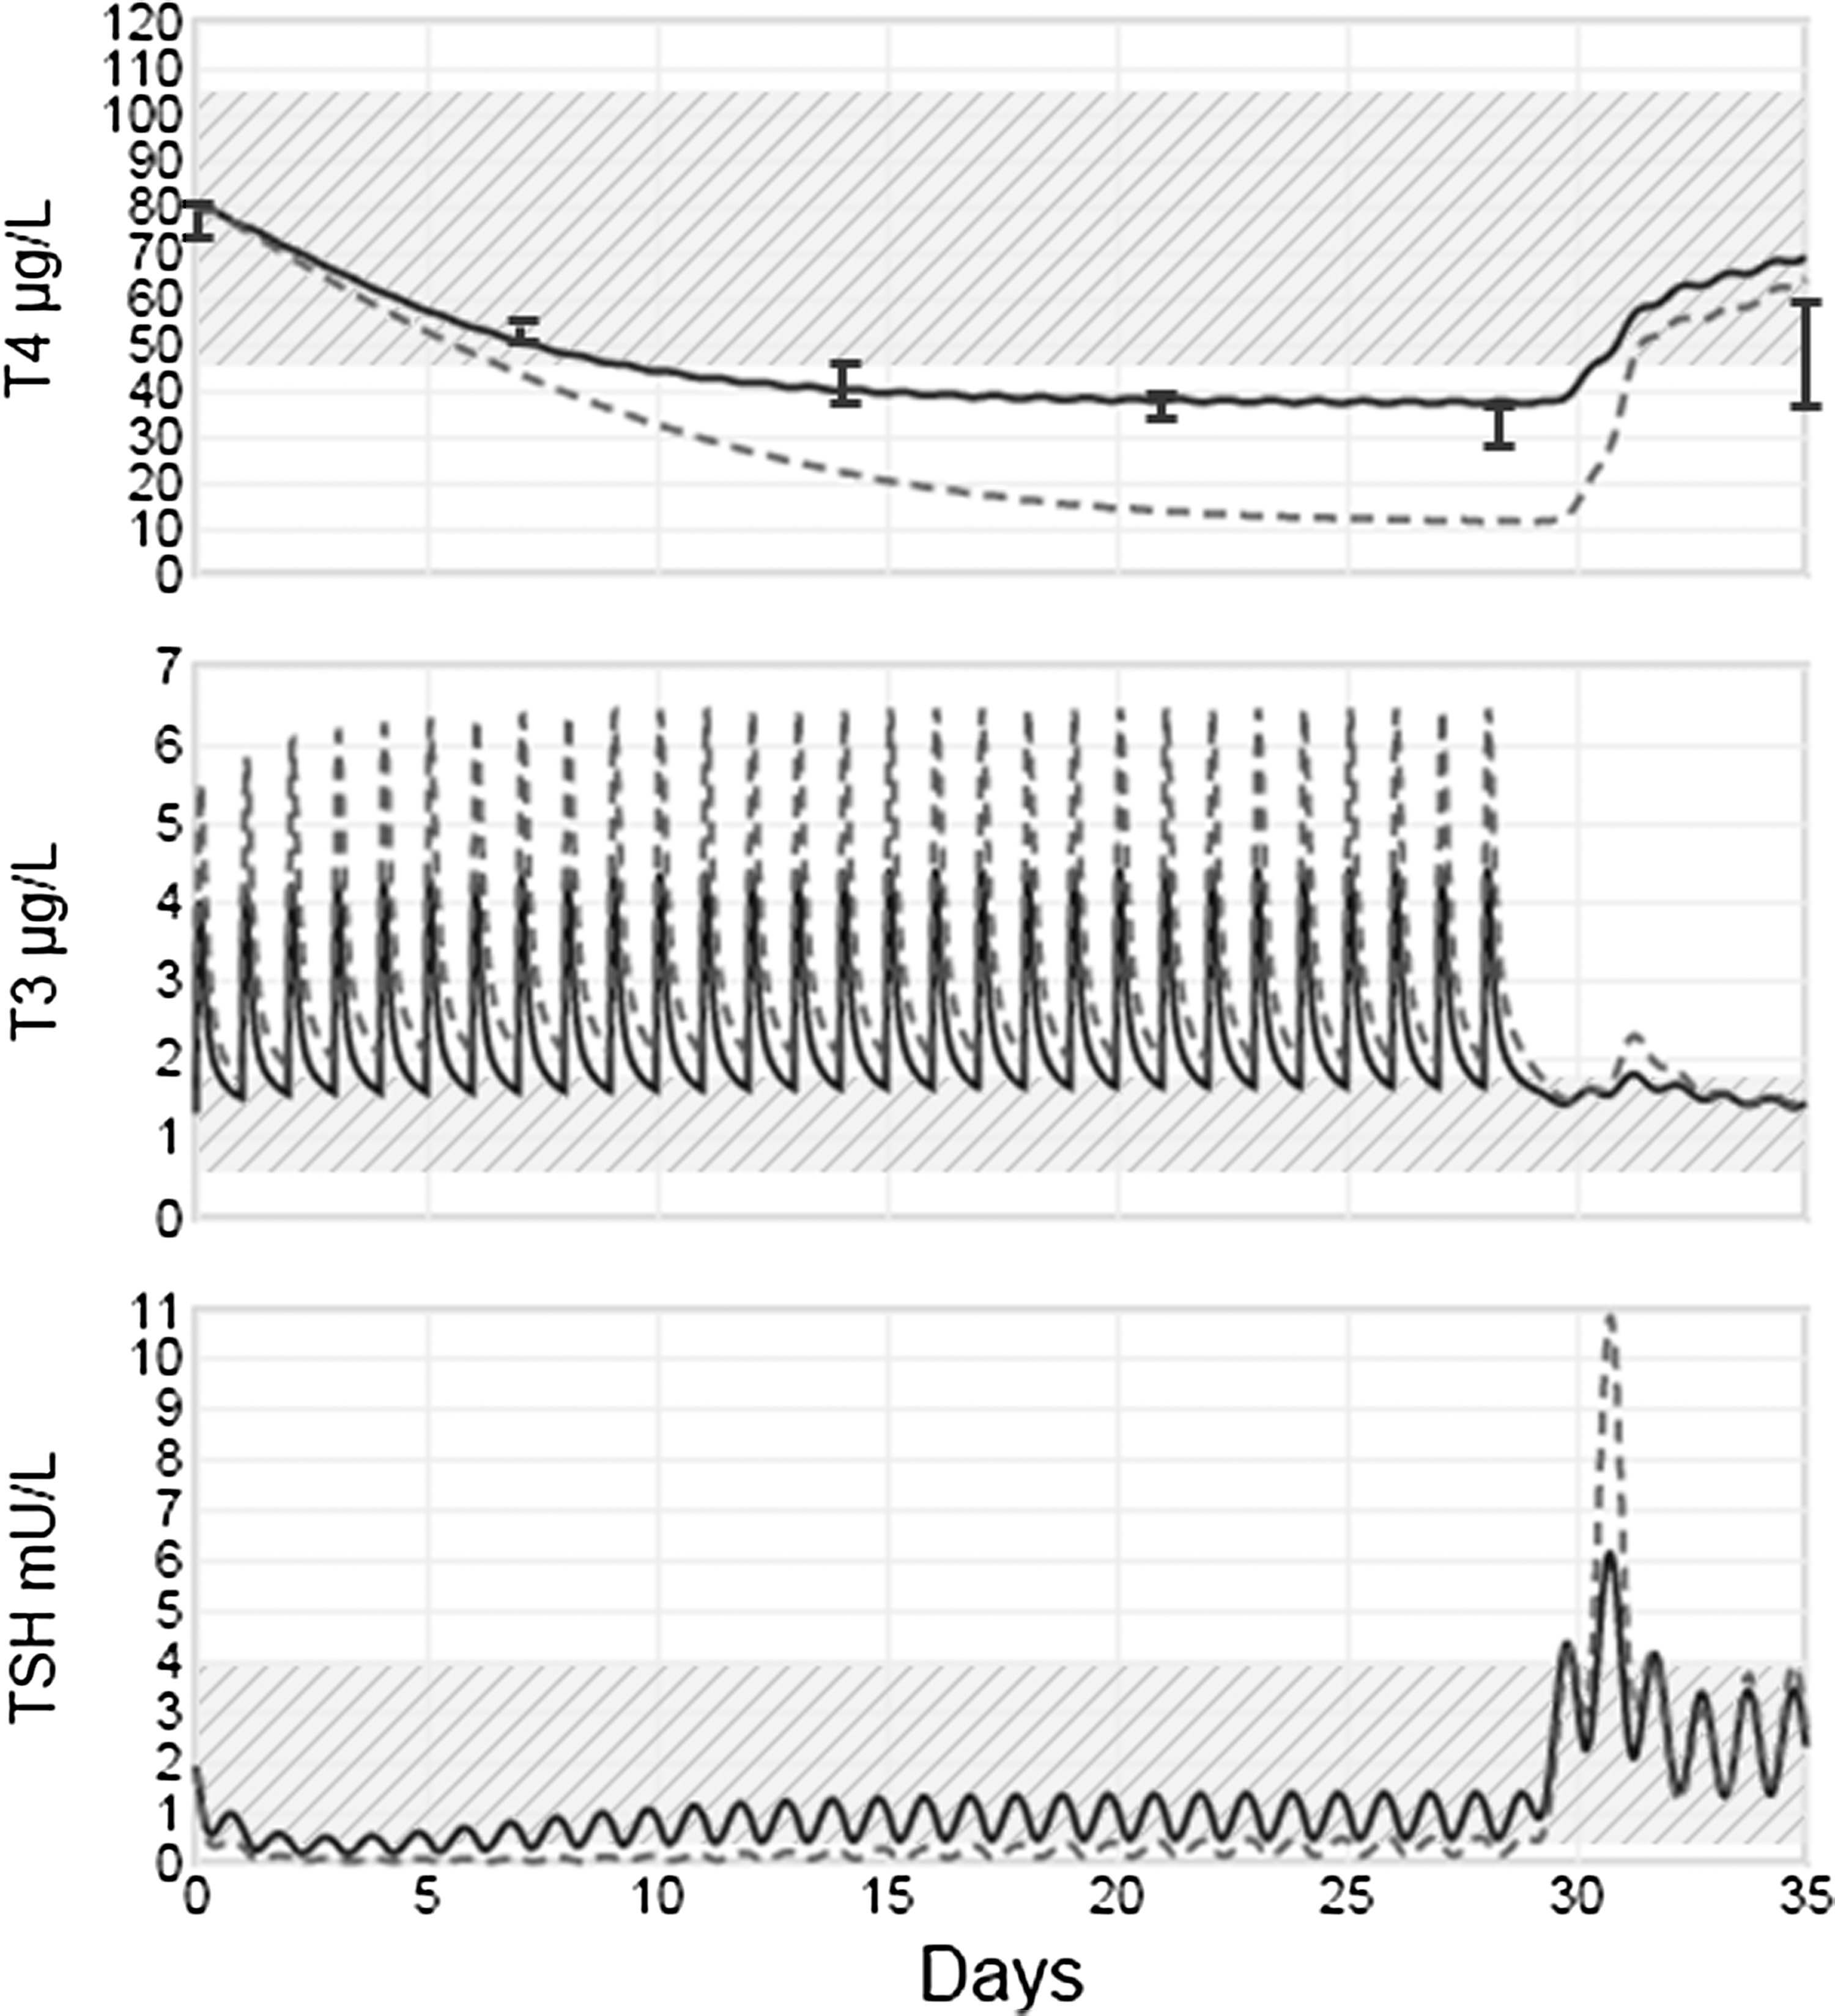
Simulated versus measured (T4 only) hormone kinetic responses to 75 μg of T3 daily dosing for four weeks in euthyroid subjects (13). The solid blue curves assume 50% and the dashed green curves assume 88% absorption of the T3 dose, which was not reported in the published study (13). Normal range bands are shown in yellow/crosshatched. Weekly measured standard error of the mean range data are shown superimposed on the T4 plot (from fig. 2 of Kaplan et al.) (13). The predictive simulation response graphs of unmeasured T3 and TSH concentrations (added value) illustrate exceedingly large abnormal T3 spiking and suppressed and transiently spiking TSH responses, reflecting mild thyrotoxic conditions for this T3 dosing pattern.
The added value in Figure 5 is the simulation response graphs of unmeasured T3 and TSH concentrations in the study subjects, predicting exceedingly large abnormal responses, especially in T3 spiking and suppressed and transiently spiking TSH responses, reflecting mild thyrotoxic conditions for this T3 dosing pattern.
Patient education/public health application: predicted endocrinological responses to some OTC “thyroid health” supplements
Kang et al. (6) recently measured the T3 and T4 content of 10 thyroid dietary supplements available commercially without prescription. They found highly variable amounts of T3 and/or T4 in all but one, and clinically relevant amounts of both in the majority of them, some exceeding common treatment dosages for hypothyroidism. They emphasized the importance of patient and provider education regarding use of such readily available supplements, unregulated by the FDA or other agency monitoring hormone content. The consequences of their findings were simulated on TH dynamics of otherwise hypothetical euthyroid and hypothyroid individuals taking the recommended dosages for one month. Several of these simulated experiments are illustrated in Figures 6 –8, with all simulated dosages and month-long hormonal responses to them within the validated ranges of applicability of THYROSIM.
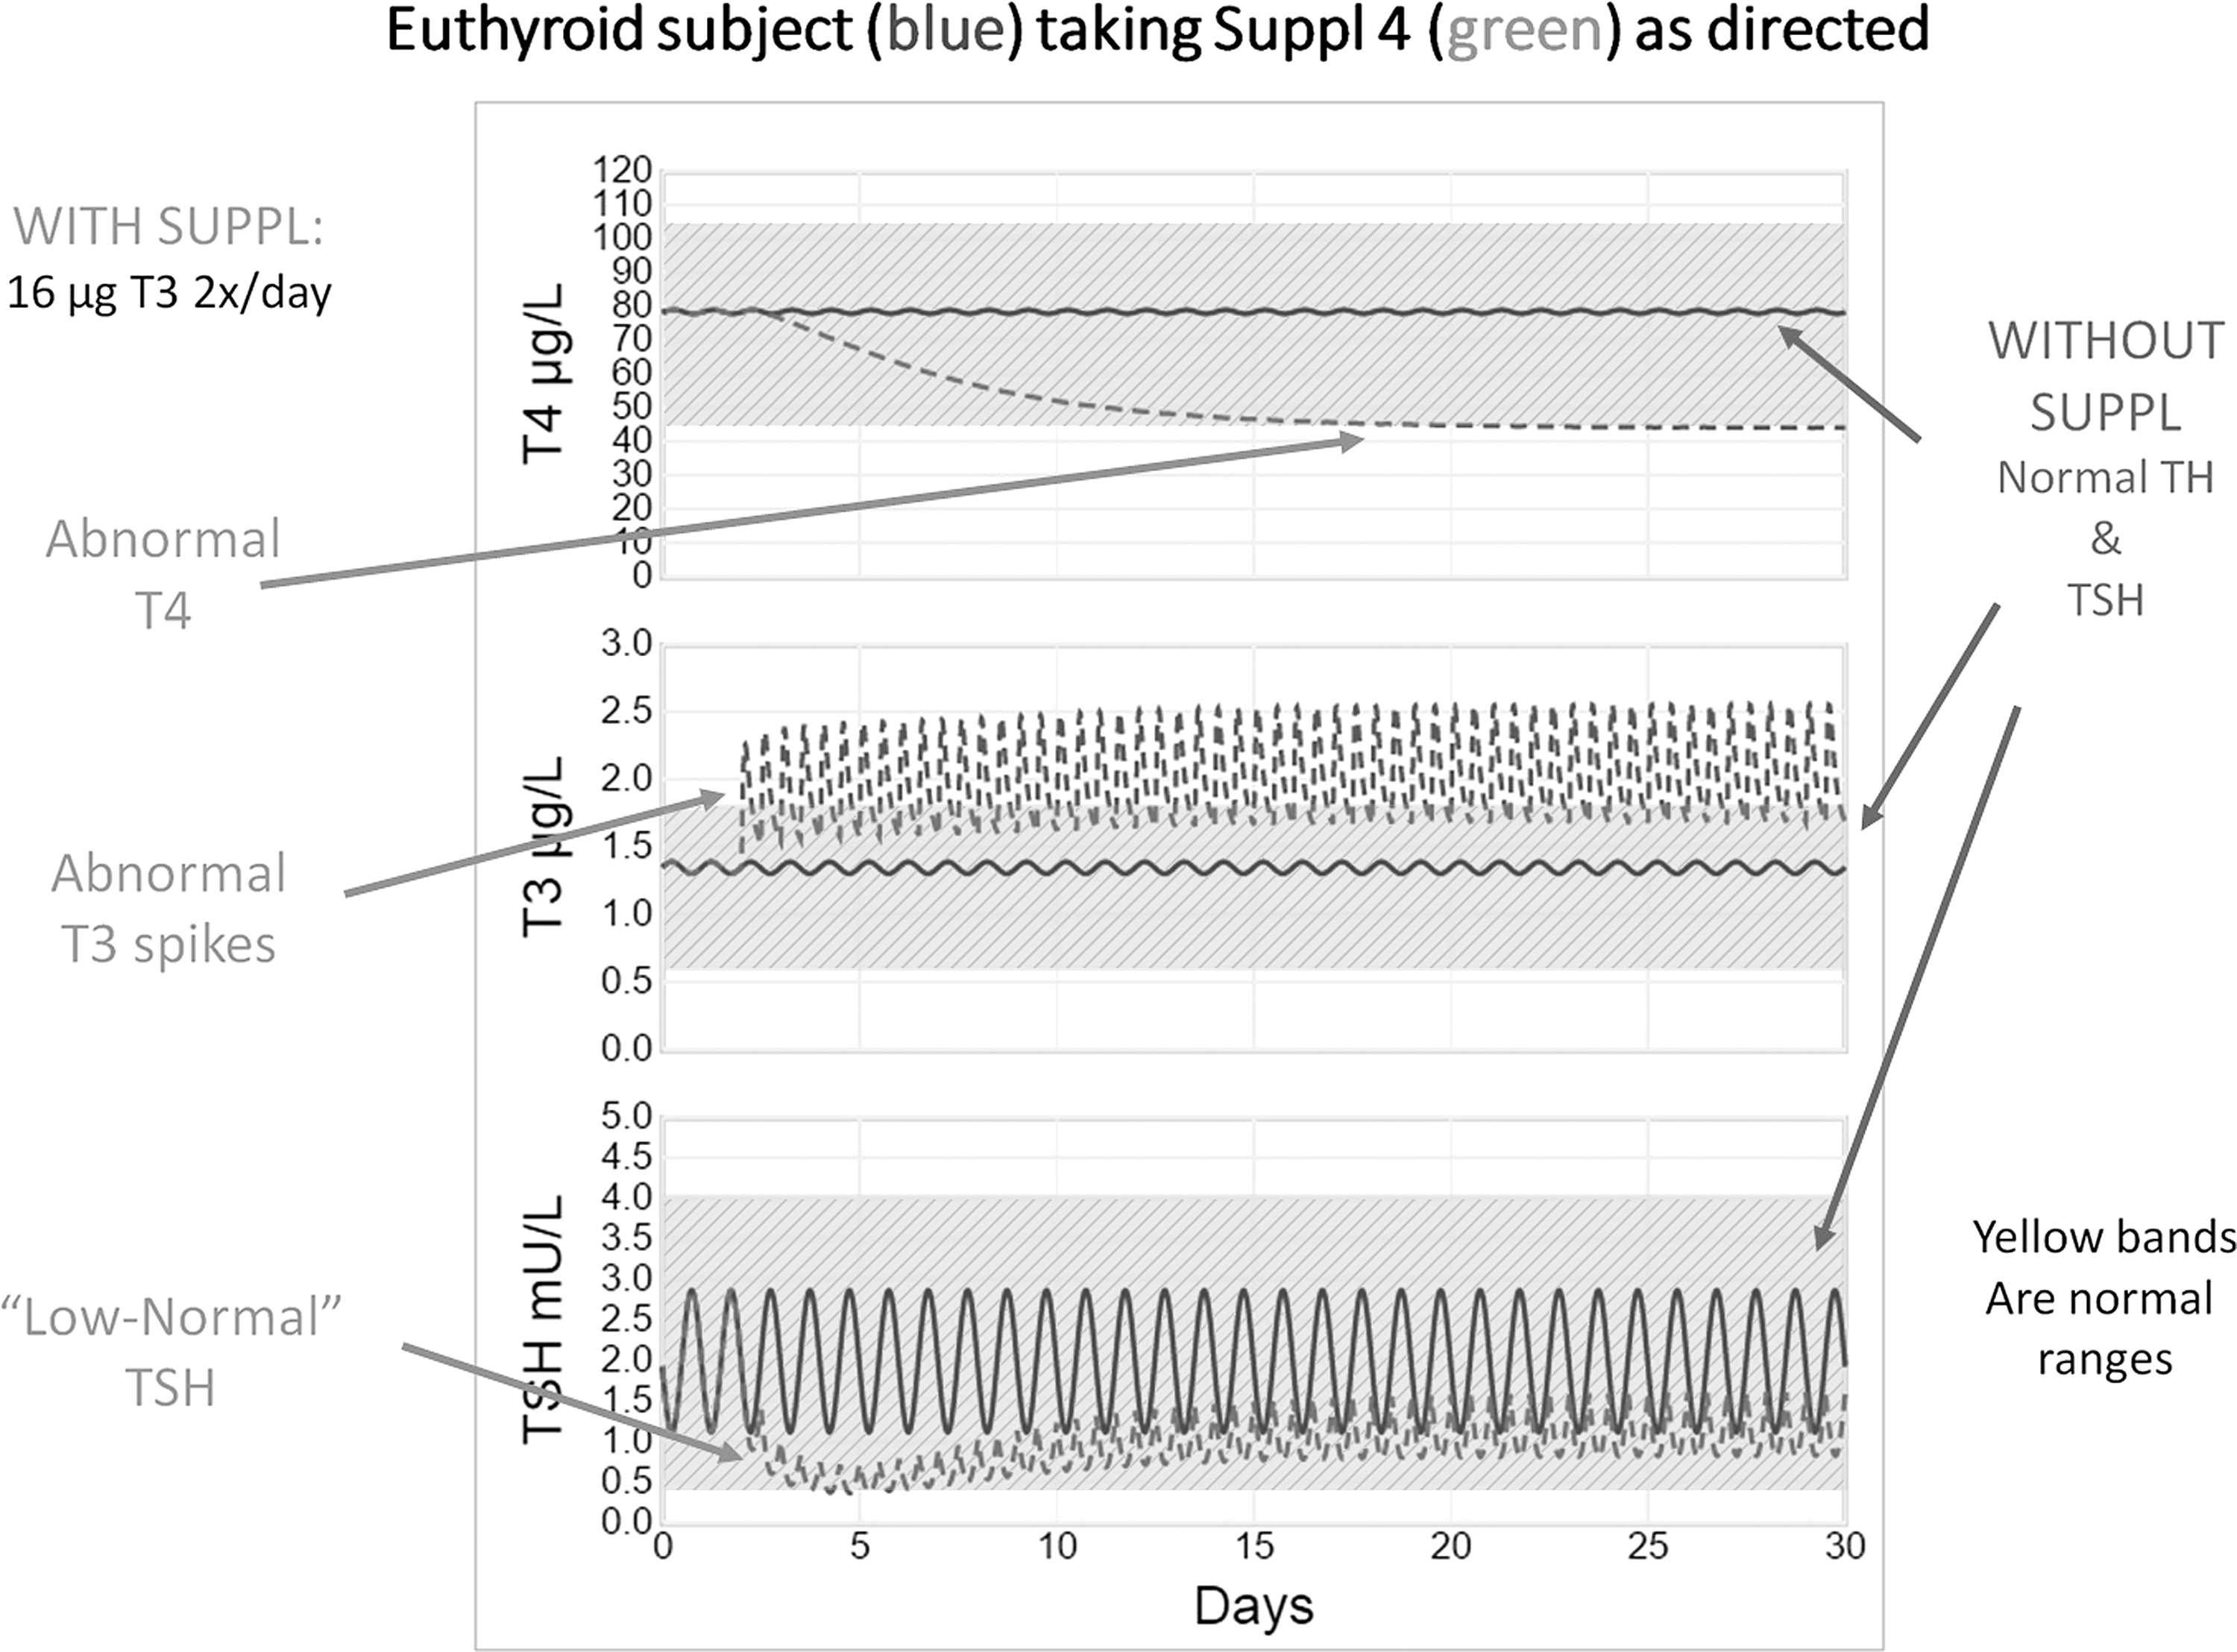
Supplement effects: simulated kinetic responses over a month for hypothetical euthyroid subjects with no supplementation versus oral dosing begun on day 2 with over-the-counter (OTC) supplement #4, two tablets twice daily, each tablet containing ∼8 μg of T3 only (∼32 μg T3/day), as directed by the manufacturer. Normal range bands are shown in yellow/crosshatched. With no supplement (solid blue curves), TSH, T3, and T4 are in the middle of their normal ranges. With supplements (dashed green curves), T4 concentrations become subnormal within a week, and serum T3 spikes are present within a day. In contrast, TSH initially dips below normal and then rises to the low-normal range. Supplement hormone content values are from table 1 of Kang et al. (6).
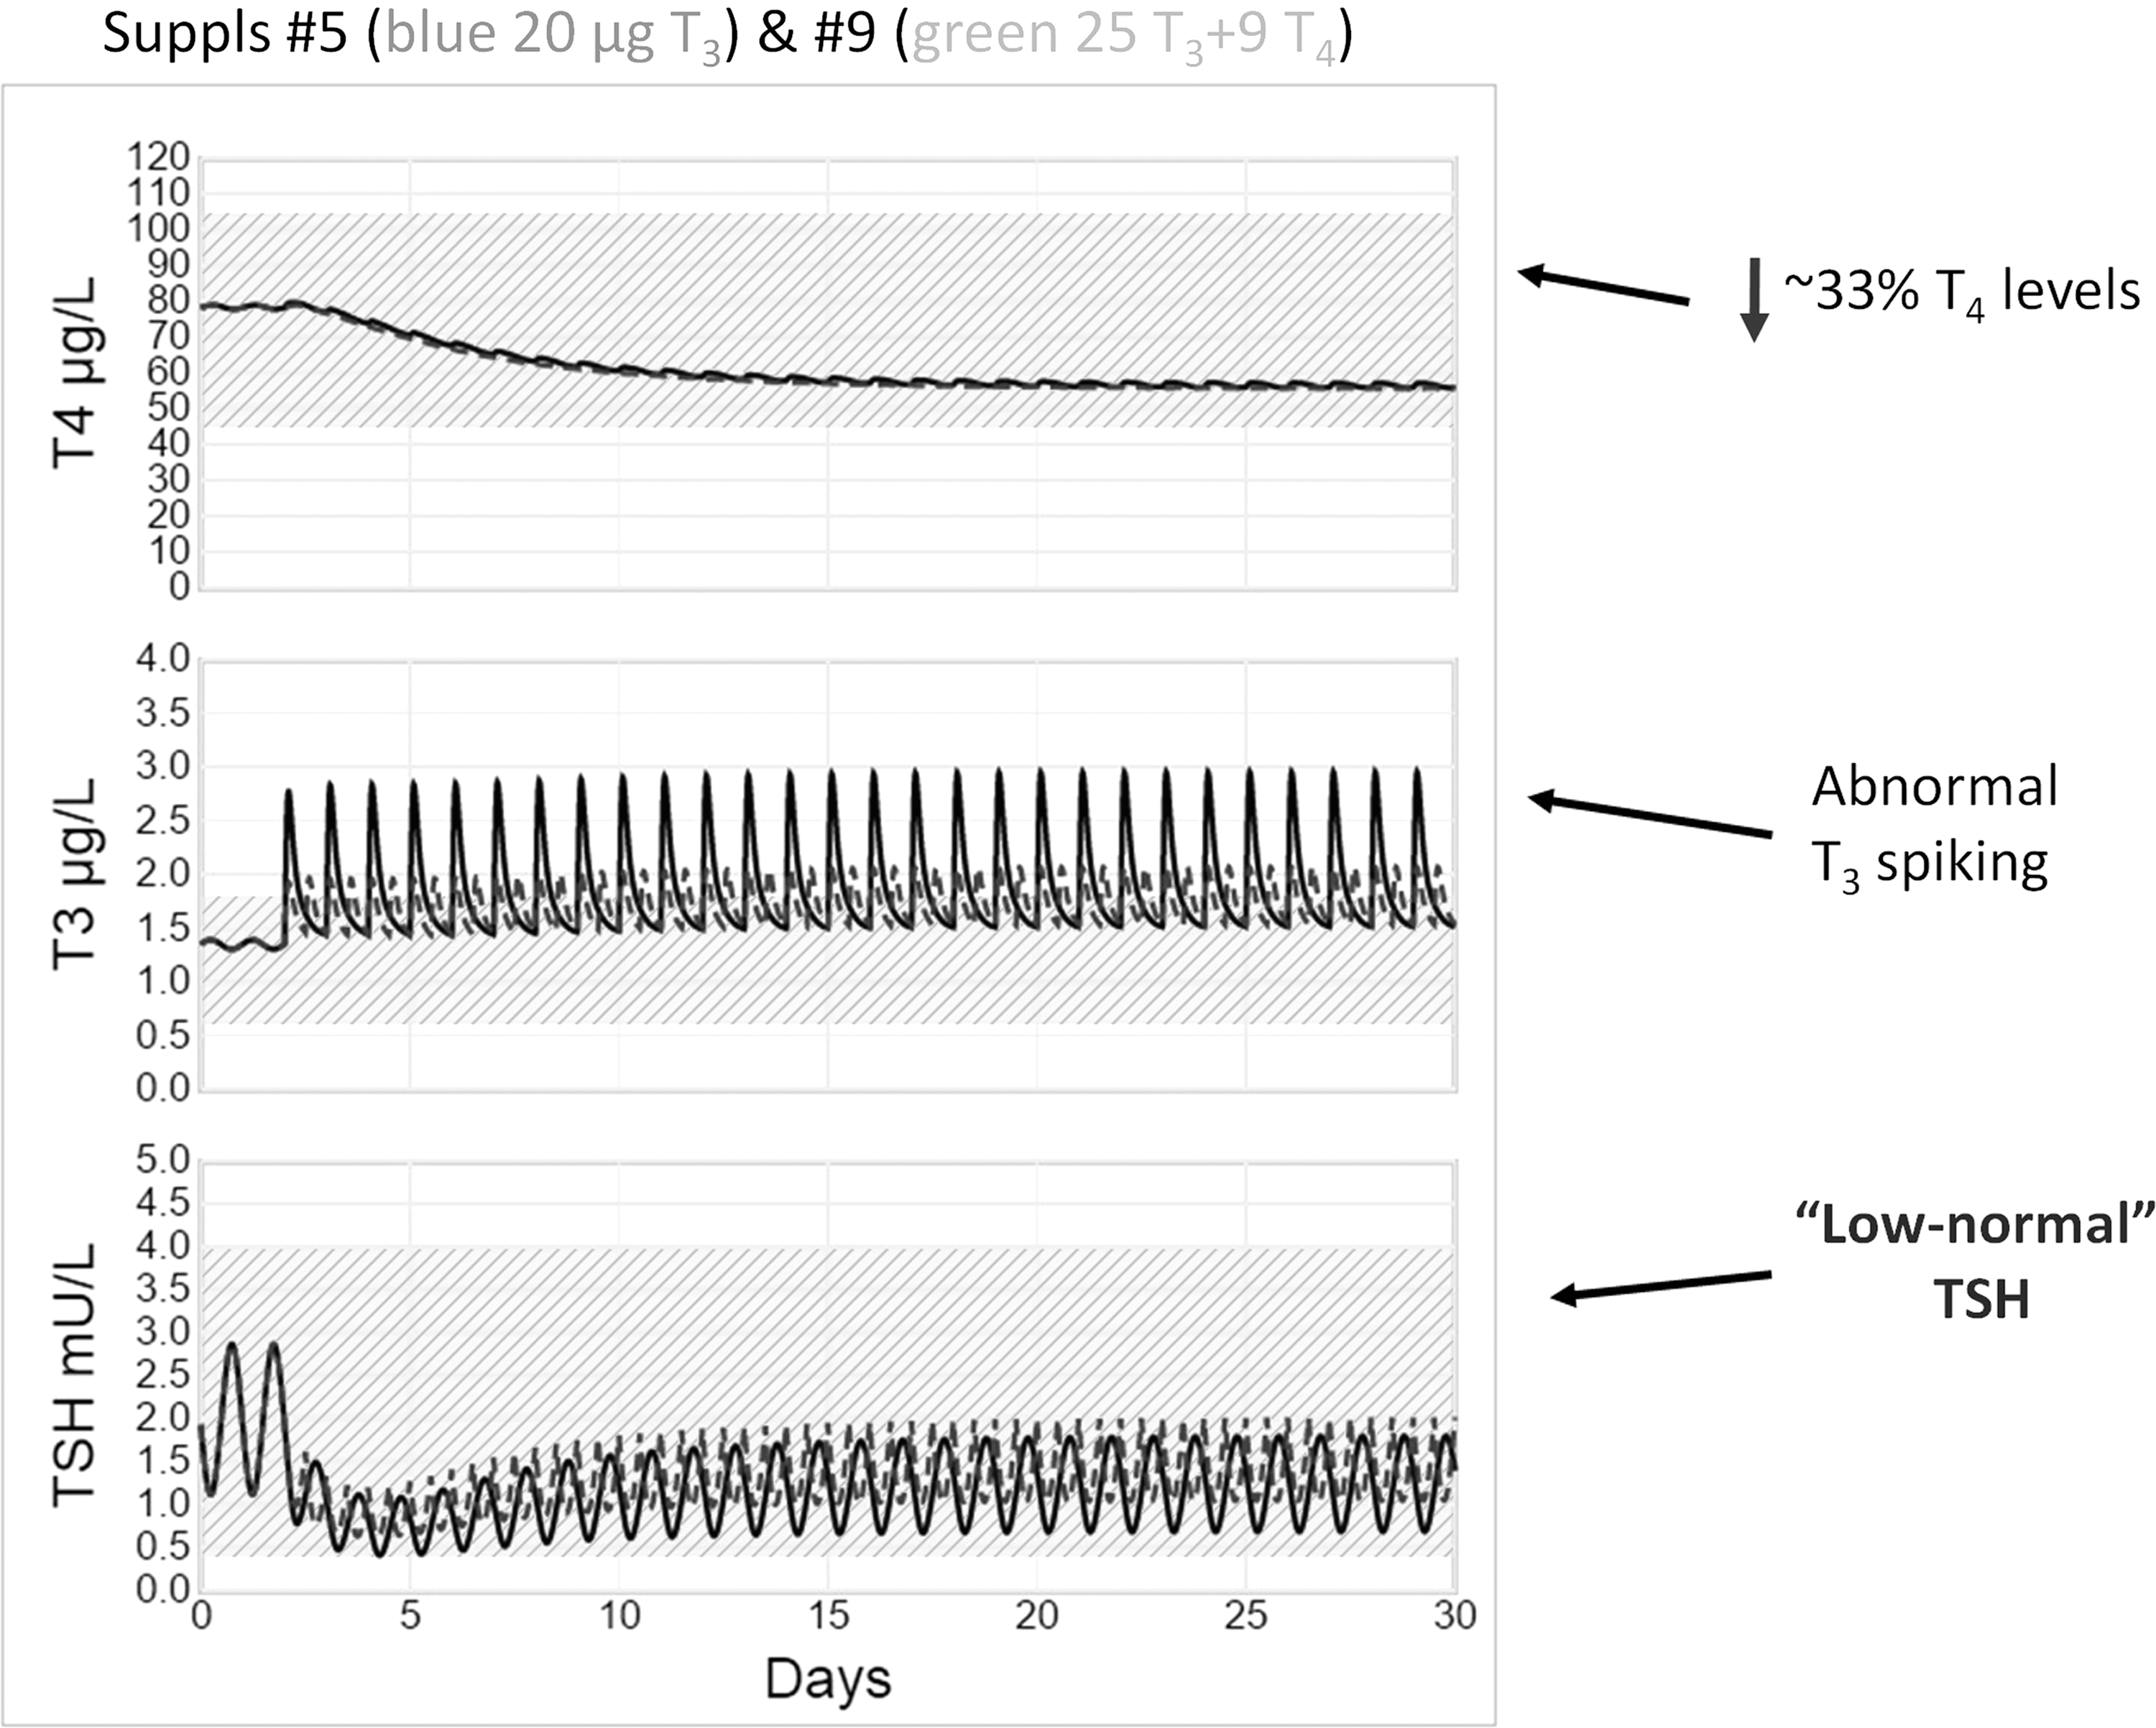
Supplement effects: simulated kinetic responses in hypothetical euthyroid subjects over a month to two different supplements, begun on day 2, one containing 25.4 μg of T3 + 8.57 μg of T4 once daily (#9, solid blue curves), the other 10 μg of T3 only, twice daily (#5, green dashed curves). Normal range bands are shown in yellow/crosshatched. With either supplement, T4 concentrations become subnormal within a week, and abnormal T3 spiking is present within a day. In contrast, TSH initially dips below normal and then rises to the low-normal range in response to either supplement. Supplement hormone content values are from table 1 of Kang et al. (6).

Supplement effects: simulated kinetic responses over a month to two different T3–T4 combination OTC supplements, each begun on day 2 in hypothetical euthyroid subjects, one containing 1.83 μg of T3 + 5.77 μg of T4 three times daily (#2, blue curves), the other 4.13 μg of T3 and 22.9 μg of T4 four times daily (#3, green curves), as directed by the manufacturer. Normal range bands are shown in yellow/crosshatched. With either supplement, T4 and T3 levels remain in the mid- to high-normal ranges, as does TSH for the low-TH dosing (#2), attributed to axis feedback providing appropriate regulation in response to the relatively low T4 dose in supplement #2. In contrast, for the high-dose T4 supplement (#3), TSH falls to below normal values and remains there, in the “thyrotoxic” range, during treatment. Supplement hormone content values are from table 1 of Kang et al. (6).
Figure 6 depicts simulated kinetic responses over a month for a hypothetical euthyroid subject with no supplementation (solid blue curve) versus superimposed responses to oral dosing with T3-only supplement #4—two tablets twice daily, each containing ∼8 μg of T3 (∼32 μg T3/day)—as directed by the manufacturer (from table 1 of Kang et al.) (6), and begun on day 2 (dashed green curve). With no supplement (solid blue curves), TSH, T3, and T4 are in the middle of their normal ranges. With supplements (dashed green curves), T4 concentrations become subnormal within a week, and T3-doubling spikes are present within a day. In contrast, TSH initially dips below normal and then rises to the low-normal range. Results (not shown) differed only slightly for a simulated hypothyroid subject with 50% thyroid secretory function.
Figure 7 depicts simulated kinetic responses in hypothetical euthyroid subjects over a month to two different OTC supplements begun on day 2, one containing 25.4 μg of T3 + 8.57 μg of T4, once daily (#9 solid blue curves), the other 10 μg of T3 only, twice daily (#5 green dashed curves), also as directed by the manufacturer (from table 1 of Kang et al.) (6). With either supplement, abnormal T3-doubling spikes are present within a day, and T4 concentrations become subnormal within a week. In contrast, TSH concentrations after transient dips remain in the low-normal range in response to either supplement. These results suggested eliminating the 8.57 μg of T4 dose in another simulation run (not shown), which gave nearly superimposed results. Physiologically, the small amount of T4 in the preparation had little or no effect on TH dynamics compared with the relatively large dose of T3.
Figure 8 depicts simulated kinetic responses in hypothetical euthyroid subjects over a month to two different combination T3 + T4-containing OTC supplements, again with dosing begun on day 2. The first had 1.83 μg of T3 + 5.77 μg of T4 three times daily (#2 solid blue curves); the other had 4.13 μg of T3 and 22.9 μg of T4 four times daily (#3 green dashed curves), each as directed by the manufacturer (from table 1 of Kang et al.) (6). With either supplement, T4 and T3 levels remain in the mid- to high-normal ranges, as does TSH for the low-TH dosing (#2). In contrast, for the high-dose T4 supplement (#3), TSH falls to below normal values and remains there, in the “thyrotoxic” range, during treatment.
Discussion
We created THYROSIM as an intuitive and friendly user interface for exercising a sophisticated and mechanistically-based human TH feedback regulation model. The imbedded model accurately represents average adult populations, having been quantified and validated primarily from euthyroid volunteer subject data. This facile simulation tool functions as a freely accessible Internet (web) application, for use by anyone with an Internet connection and an interest in normal and perturbed TH regulation dynamics. By releasing THYROSIM as a web application, access is thus offered to the widest possible audience, not for clinically prescribing treatment, but for use as a research, teaching, and patient education tool. Potentially useful information about hypothetical treatments with hormone or hormone-containing substances can be gleaned from it, as has been illustrated above and is discussed further below.
THYROSIM requires minimal quantitative skills, and is especially useful for performing intuitive, hypothetical, “what-if” experiments. It includes basic graphical tools to set up numerous “what-if” simulation experiments—useful primarily for better understanding and teaching human TH regulation, for example in a physiology or medical or pharmacology school course, or in a patient education situation—graphically illustrating effects of non-adherence, for example, on circulating hormone levels. Oral hormone inputs can be simulated as either single doses, repeated period (e.g., daily) doses of T4 and/or T3, and so on, simulating typical (or experimental) therapeutic dosing regimens. Users also can simulate IV-pulse and IV-infusion input dosing, or combinations thereof, with options to delete, edit, or temporarily disable/enable any input. Simulation of common abnormal conditions is accomplished by simply adjusting percentages of TH secretion (0–200%) and gut absorption (0–100%), for example secretion for completely thyroidectomized patients can be set to 0%. For these simulated patients, it is possible to see how thyroidectomy changes TH levels by not recalculating ICs and setting the simulation to start at euthyroid (100%) values. For simulated hypo/hyperthyroid patients, recalculating ICs would likely be preferred to setting them to start from euthyroid steady-state conditions, since they might have been in their respective abnormal states for some time. This means a user could simulate a hypothetical patient with no TH secretion for an extended period of time, even if such a patient might more realistically have been hospitalized and treated before the end of the simulation time.
THYROSIM users only need a modern browser and Internet connection. It works directly with Microsoft Internet Explorer v9 and above, Google Chrome, Apple Safari, Amazon Silk, and Mozilla Firefox browsers. This Internet app is thus functional on handheld smart phones and tablets such as the Google or Samsung Android, Apple iPhone/iPad/iPod, Nook®, and Amazon Kindle®, as well as laptop and desktop computers running any of these browsers. A self-contained version of the THYROSIM app, not requiring an Internet connection, is also available for Android devices and has been distributed to several endocrinologists in the United States and Europe.
In earlier work (1 –5), the simulator was shown to reproduce all experimental results published in the several papers on which it is based and was also validated against several not used in its development, as illustrated in part in Figure 2. It has been further validated here against data from several additional published studies using oral dosing regimens with both T3 and T4, two of these illustrated in Figures 3 and 4. Validations and other examples have shown how the comparison and normal range features can be used to check predicted hormone dynamics visually in different thyroid states or under different treatment protocols. These controls provide broad flexibility in designing a variety of “what-if” experiments—simulated studies that sharpen intuition as well as knowledge about the dynamics of this neuroendocrine system.
The use of THYROSIM has been illustrated in several typical applications, quantifying T3, T4, and TSH kinetic responses after simulated (i) thyroid surgery (Figs. 1 and 4), (ii) daily dosing with different oral TH preparations (Figs. 3 and 5), (iii) altered hormone absorption (Fig. 5), and (iv) dosing of euthyroid subjects with TH-containing supplements (Figs. 6 –8). These “what-if” experiments mimicked the effects of several OTC preparations containing various quantities of TH, measured and reported in a previous publication (6) but untested objectively in experimental subjects, which has been accomplished here by simulation of hypothetical subjects receiving these supplements.
Notably, the OTC supplement simulations indicate that the T3 content in supplement pills has a potentially greater pathophysiological effect on TSH concentrations than does T4, leading to abnormal T3-spiking and substantial and sustained reductions in T4 levels (Figs. 6 and 7). In additional test simulations (not shown), it was found that the small amount of T4 (∼9 μg) in Figure 7 pills had little effect on the kinetics; it was the T3 (∼25 μg) in the tablets that had the major quantitative effect.
In Figure 8, both multi-dose OTC supplement combinations, totaling ∼6 μg of T3 + 17 μg of T4 and 16 μg of T3 + 92 μg of T4 daily, altered TH levels, but not in all ways anticipated. Neither combination resulted in values outside normal ranges for plasma T3 or T4, whereas TSH was substantially suppressed for the larger (92 μg) but not the smaller (17 μg) dose of T4 in the combinations supplements, the smaller but not the larger dose effect compensated by axis feedback.
These kinds of “what-if” experiments—the major goal of predictive simulation models—provide guidance on what might be expected if these unregulated preparations were used as suggested on their labels. The results with preparation #4 (Fig. 6), for example—dosing with a total of ∼32 μg of T3 per day in a hypothetical euthyroid or hypothyroid individual—would substantially reduce serum T4 due to feedback effects and would raise mean serum T3 well above the normal range, possibly causing mild thyrotoxicosis and certainly making thyroid function tests difficult to interpret. In contrast, other preparations would not affect serum TH concentrations nearly as much, due to the reduction in endogenous TH secretion through negative feedback at the hypothalamic/pituitary level. Thus, they would not, as implied, “supplement” thyroid function. It is of course not clear whether these OTC products might be purchased by individuals seeking to induce increases in metabolic rate, or by those who were either properly or self-diagnosed as being hypothyroid. Since the current understanding of thyroid physiology suggests that circulating T4 is required to provide adequate supplies of T3 to the central nervous system, and that even mild thyrotoxicosis may have adverse effects on cardiac and bone health, this information might deter their use as well as demonstrate their potential toxicity to the appropriate regulatory agencies (14).
Results in Figures 6 –8 also underscore the need to measure serum T4 and T3 as well as TSH levels in patients who may be ingesting hormonal T4 or T3 in OTC “thyroid support” supplements, information possibly not provided to their physicians. THYROSIM results suggest that thyroidal axis negative feedback can mask such perturbations, maintaining TSH levels in the normal or low-normal range.
Footnotes
Acknowledgments
Partial fellowship support for Simon X. Han was provided by the UCLA Graduate Division. We are very grateful to undergraduate student Lu Chen (Beijing, China), who developed the self-contained THYROSIM Android app. We also thank the three reviewers and the editor for their very valuable and constructive comments and suggestions.
Author Disclosure Statement
No competing financial interests exist.