
Abstract
Background:
Except from associations study with body weight, there are few longitudinal data regarding the association between thyroid function and anthropometric measurements such as waist circumference, waist-to-hip ratio, or waist-to height ratio.
Objective:
This study aimed to investigate the association of thyrotropin (TSH) at baseline with changes in different anthropometric markers between baseline and follow-up in the general population.
Method:
Data were used from four population-based longitudinal cohort studies and one population-based cross-sectional study. A total of 16,902 (8204 males) subjects aged 20–95 years from the general population were studied. Body mass index, waist circumference, waist-to-hip ratio, and waist-to-height ratio were measured. Multivariable median regression models were calculated adjusting for the following covariates: age, sex, baseline value of the respective anthropometric marker, smoking status, follow-up-time period, and study site.
Results:
In cross-sectional analyses, serum TSH within the reference range was positively associated with waist circumference (β = 0.94 cm [confidence interval (CI) 0.56–1.32]) and waist-to-height-ratio (β = 0.029 [CI 0.017–0.042]). These associations were also present for the full range of TSH. In the longitudinal analyses, serum TSH at baseline was inversely associated with a five-year change of all considered anthropometric measures within the prior defined study-specific reference range, as well as in the full range of serum TSH.
Conclusion:
High TSH serum levels were positively associated with current anthropometric markers, even in the study-specific reference ranges. In contrast, high TSH serum levels were associated with decreased anthropometric markers over a time span of approximately five years. Further research is needed to determine possible clinical implications as well as public health consequences of these findings.
Introduction
O
Thyroid function is considered to play a pivotal role in regulating metabolism and food intake (5). Thyroid function can be determined by thyrotropin (TSH) serum levels. While increased TSH stimulates the secretion of the hormones thyroxine (T4) and triiodothyronine (T3) from the thyroid gland (metabolism increases), a decreased TSH inhibits T4 and T3 secretion (metabolism decreases).
The role of thyroid function in the development of overweight and obesity is a topic of intensive research. To date, the relation of overt thyroid dysfunction with body weight is well established (6,7). While hyperthyroidism induces weight loss, hypothyroidism leads to weight gain. However, the association between thyroid function within the reference range, as well as subclinical dysfunction and anthropometric markers in longitudinal analysis, is still not well understood.
Data from a few studies indicate that high serum TSH levels are related to increased body mass index (BMI), even in subjects with normal thyroid function (e.g., serum TSH levels within the reference range). However, these studies focused only on BMI as anthropometric measure and mostly analyzed cross-sectional data (6,8 –10). Thus, there is a lack of studies analyzing the impact of thyroid function by applying different anthropometric markers such as waist circumference (WC), waist-to-hip ratio (WHR), or waist-to-height ratio (WHtR), as well as of studies using longitudinal data.
The aim of the present study was therefore to evaluate the association between serum TSH and different anthropometric markers in a pooled data set of five large population-based (four longitudinal and one cross-sectional) European studies. The study sought to analyze these associations both cross-sectionally and longitudinally. Furthermore, the aim was to analyze these associations in the full range as well as in the reference range of serum TSH levels.
Materials and Methods
Study population
For the present analyses, data from four population-based cohort studies and one population-based cross-sectional study were used as follows: 1. CARdiovascular disease, Living and Ageing in Halle (CARLA) from Central East Germany (11); 2. Rotterdam Study from the Netherlands (12); 3. Inter99 from Denmark (13); 4. Study of Health in Pomerania (SHIP) from Northeast Germany (14); and 5. Kooperative Gesundheitsforschung in der Region Augsburg (KORA) from South Germany (15).
Study characteristics are summarized in Table 1. Information on these studies is given elsewhere in more detail (3,15 –17). All studies followed the recommendations of the Declaration of Helsinki and were approved by the local ethics committees. Participants gave informed written consent.
TSH, thyrotropin; WC, waist circumference.
Interview
In all studies, trained and certified staff administered standardized personal interviews and conducted standardized examinations. Smoking status was categorized into the three categories: smokers, former smokers, and never smokers. Former smokers were defined as individuals who had smoked during their lifetime but not in the last 12 months prior to the time of the baseline examination.
Physical examination
Height and weight were measured for the calculation of the BMI: BMI = weight (kg)/height2 (m2). Circumferences of the waist and the hip were measured according to the guidelines of the World Health Organization reference (18). For all measures, a flexible, non-stretchable graduated tape measures was used. The subjects stood in front of a pier glass wearing only non-restrictive briefs or underwear. Waist circumference was either taken at the nearest point or at the midway between the inferior margin of the last rib and the crest of the ilium in a horizontal plane. The hip circumference measurement was taken at the level of the maximum extension of the buttock. Details on the anthropometric measurement for each study are given in Table 1. WHR was calculated by dividing WC by hip circumference, and WHtR was calculated by dividing WC by body height.
Laboratory measurements
In Inter99, the Rotterdam Study, and KORA, blood was collected in a fasting state, while in the CARLA and SHIP, blood was drawn from non-fasting participants. The measurement procedures for TSH in the five studies are given in Table 1. For the analyses, study-specific reference ranges were used as follows: SHIP, CARLA: 0.25–2.12 mIU/L (19); KORA: 0.52–3.60 mIU/L (20); Inter99: 0.30–4.00 mIU/L (21); and the Rotterdam Study: 0.40–4.00 mIU/L (22). The study-specific upper limits of serum TSH levels were defined as high serum TSH levels, and study-specific lower limits of serum TSH levels were defined as low serum TSH levels.
Furthermore, in order to account for differences in serum TSH distributions across the different studies, the TSH variable was used as multiple of the study-specific median of the TSH distribution (TSH-MOM) for analyses regarding the whole TSH range (23).
Statistical analysis
Data on quantitative characteristics are expressed as median and interquartile range (IQR). Data on qualitative characteristics are expressed as percentages and absolute numbers. The association between baseline serum TSH levels and anthropometric markers at baseline were assessed using multivariable median regression models adjusted for age, sex, and smoking status. For longitudinal analyses, changes of all variables were calculated standardized to a follow-up time of five years by the following formula: (VariableFollow-Up – VariableBaseline)/Follow-Up Time × 5. Associations between baseline TSH-MOM and the change in anthropometric markers between baseline and follow-up were assessed by multivariable median regression adjusted for baseline values of age, sex, and smoking status. Associations between change in TSH-MOM and change in anthropometric markers between baseline and follow-up were determined by multivariable median regression adjusted for baseline values of age, sex, and smoking status. To assess the sensitivity of the longitudinal results for loss to follow-up, inverse probability weights were calculated for each of the single studies, and those weights were used in the regression models. The aim of this approach is to give more weight to subjects whose propensity to drop out of the study is high (24). The weights accounted for loss to follow-up are based on age, sex, BMI, and smoking status.
In the analyses with categorized TSH (hyper- and hypothyroidism) as exposure, the category of serum TSH levels within the reference range were the reference. All regression models were calculated separately for each individual study and again for the pooled data set. Pooled analyses were additionally adjusted for the included studies. To explore further whether the heterogeneity across the studies may have affected the results, all models were recalculated as mixed models with study as a random factor. The results, however, did not substantially differ from those of the standard regression models adjusting for the study. Thus, results are reported only from the standard regression approach.
In all analyses with continuous exposure variables, fractional polynomials were applied to explore and graph nonlinear associations (25). The dose–response relationship was found using fractional polynomials up to degree 2 with all possible combinations of powers selected from the set (−2, −1, −0.5, 0, 0.5, 1, 2, 3) and by comparing them using the log likelihood to determine the best-fitting model. If none of the fractional polynomials models fitted the data significantly better than the one with the untransformed exposure variable, calculations were done using the untransformed exposure variable. Interaction terms between serum TSH levels and all confounders were tested in the regression models.
A p-value of <0.05 was considered as statistically significant. Analyses were carried out with Stata v13.1 (Stata Corp., College Station, TX).
Results
Descriptives
The characteristics for the whole study population for each cohort are displayed in Table 1. Baseline values of all participants stratified by study are given in Table 2. While participants from the Dutch Rotterdam study were the oldest, the participants of the Danish Inter99 study were the youngest. Participants of CARLA had the highest BMI (median 27.9 kg/m2; IQR 25.1–31.0). In contrast, participants of Inter99 had the lowest BMI (median 25.6 kg/m2; IQR 23.2–28.6). The participants of CARLA showed also the highest WC (median 100.3 cm; IQR 91.9–107.7) compared with the other participating studies. Serum TSH levels were higher in Inter99, KORA, and the Rotterdam Study than they were in SHIP and CARLA.
High and low TSH levels were defined according to study-specific reference intervals.
Data are expressed as median and interquartile-range (continuous data), or as numbers and percentage (categorical data).
fT3, free triiodothyronine; fT4, free thyroxine.
Cross-sectional analyses: serum TSH concentrations at baseline and anthropometric markers at baseline
Results from cross-sectional analyses are given in Table 3, and adjusted regression curves for the association between baseline serum TSH levels and the anthropometric markers in the single studies are given in Figures 1 (TSH-MOM over the full range) and 2 (serum TSH over the study-specific reference range). In the pooled sample, TSH-MOM was positively associated with BMI, WC, and WHtR for the full range of TSH, as well as for the prior defined reference range of TSH. To illustrate the effect size, for example, an increase of median BMI of about 0.3 kg/m2, from 27.0 to 27.3 kg/m2 (adjusted medians), could be observed by increasing the serum TSH level from 1 to 3 TSH-MOM (see Fig. 1). An increase of median waist circumference of about 0.9 cm, from 83.9 to 84.8 cm (adjusted medians), could be observed by increasing serum TSH level from 1 to 3 TSH-MOM.
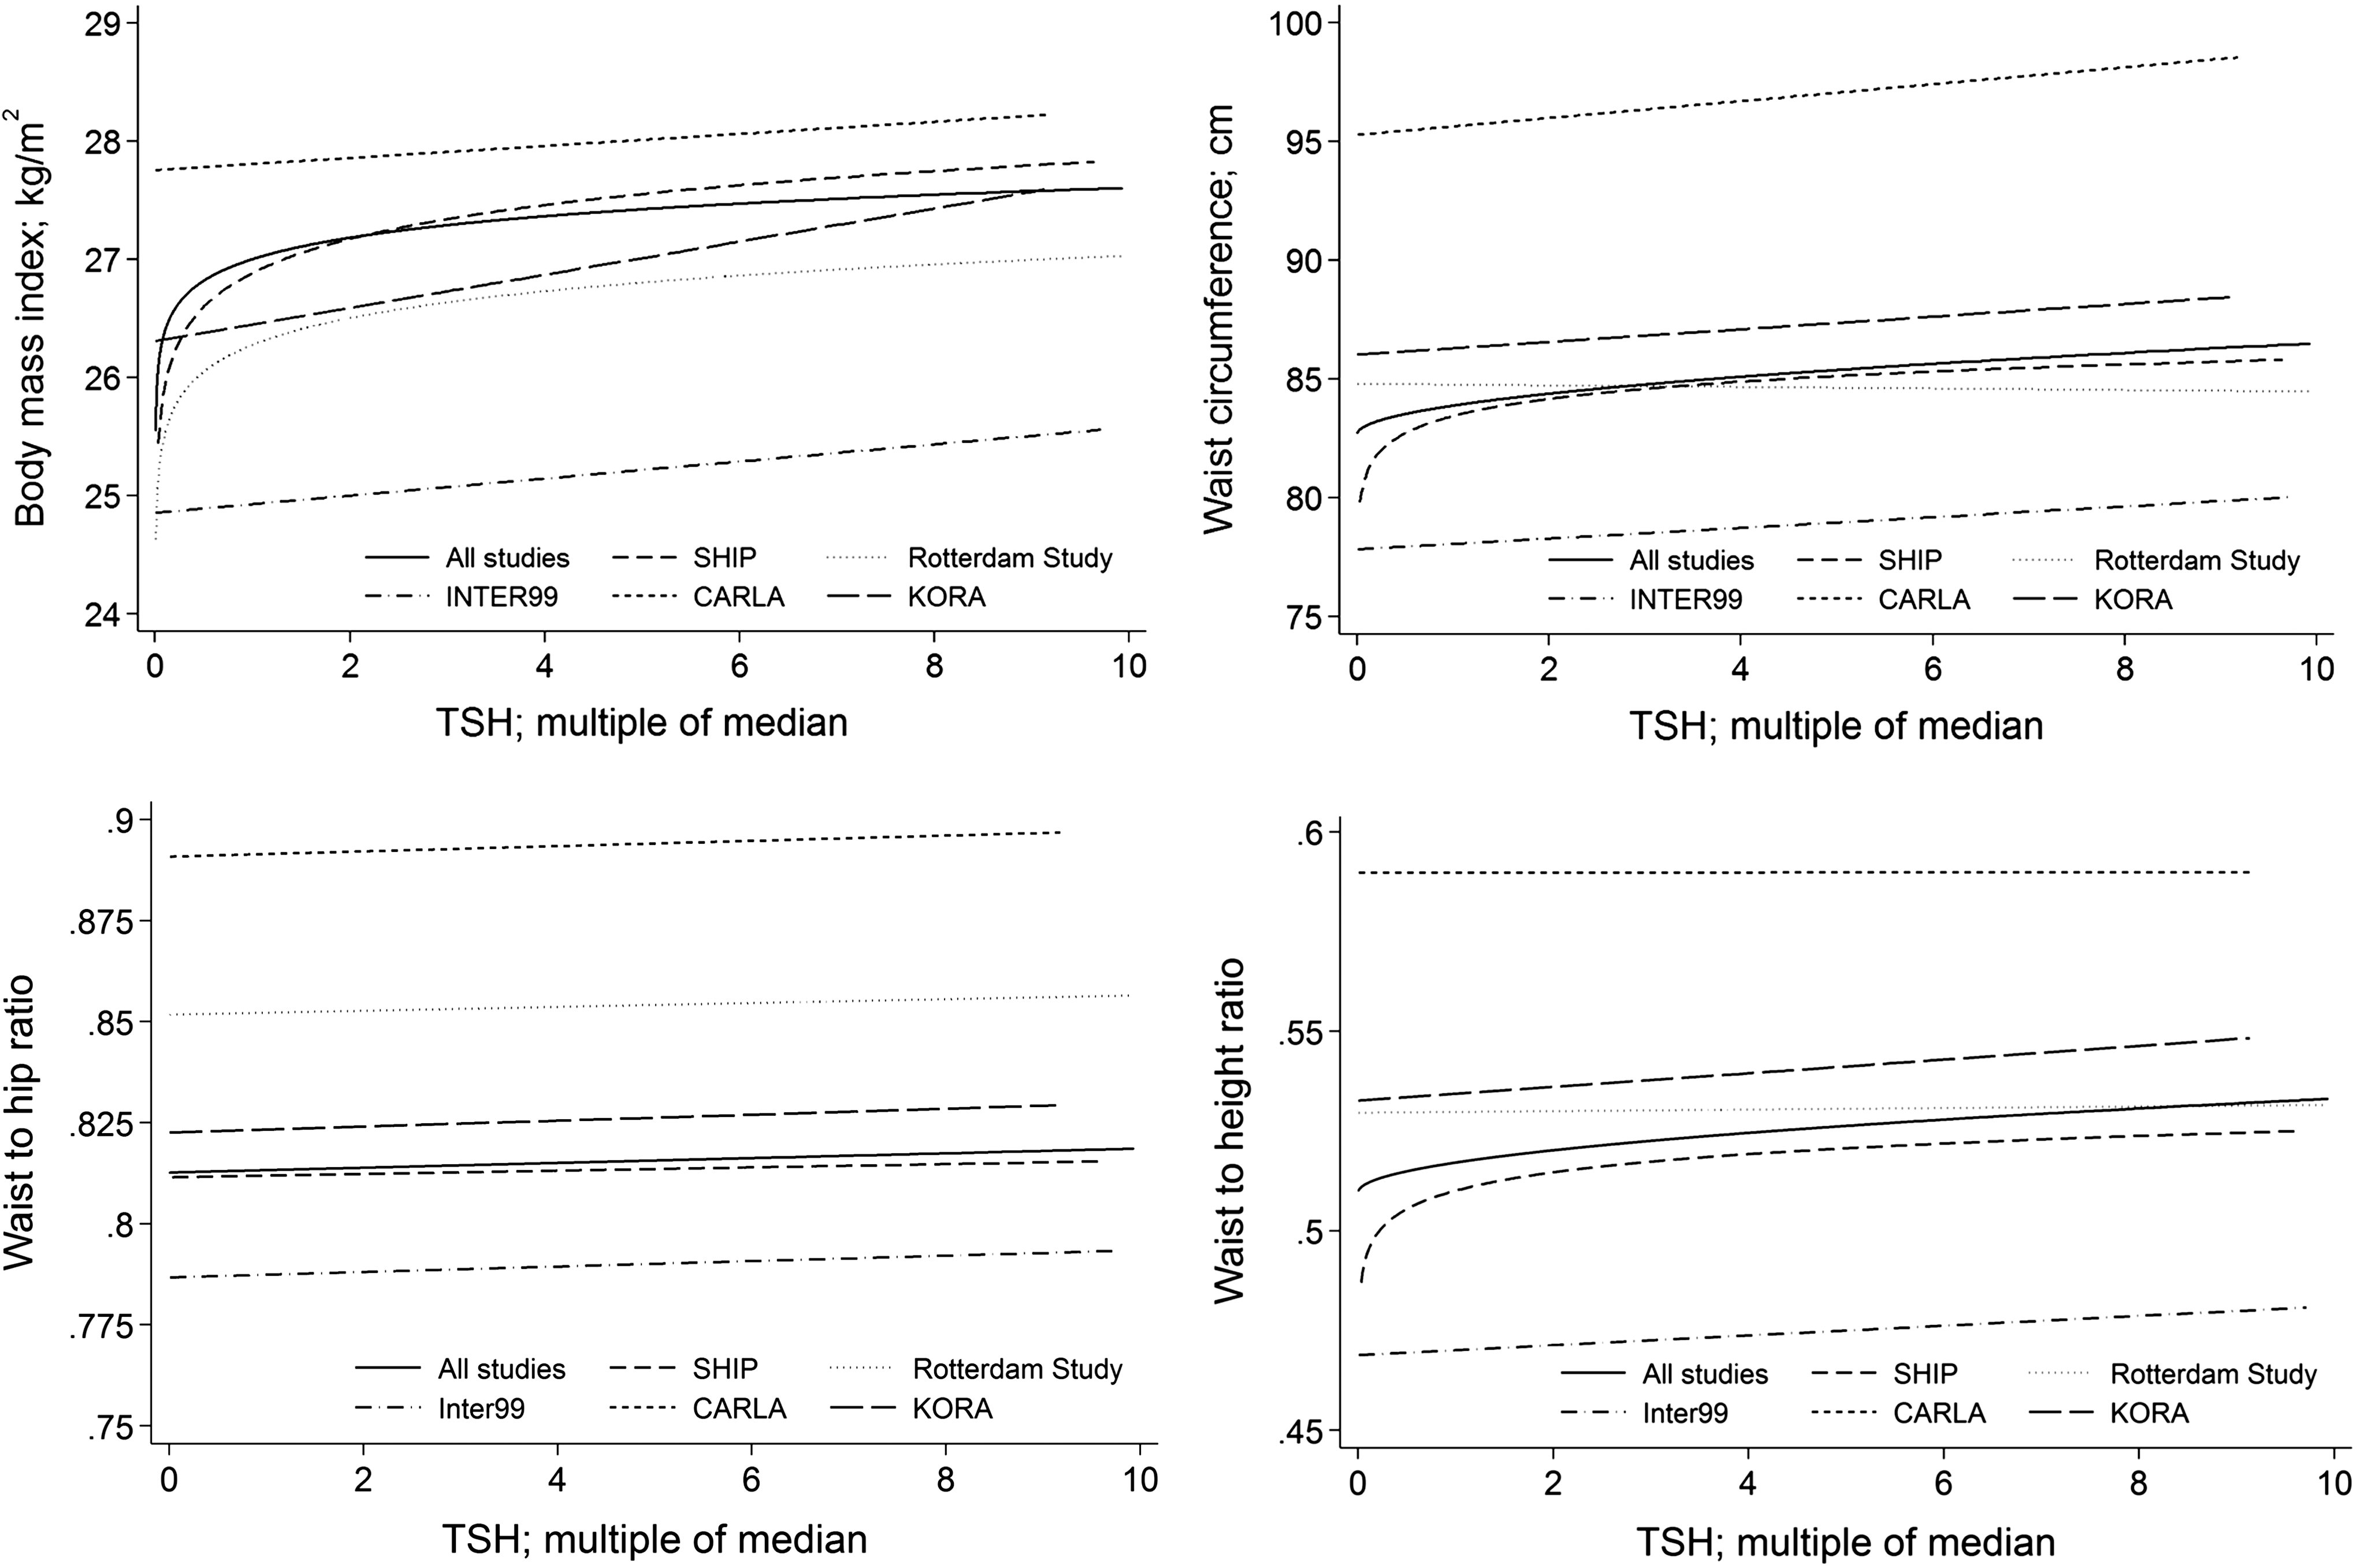
Adjusted regression curves for the association between baseline median of the thyrotropin distribution (TSH-MOM) over the full range and baseline anthropometric measures body mass index (BMI), waist circumference (WC), waist-to-hip ratio (WHR), and waist-to-height ratio (WHtR) in the single studies and the pooled population.
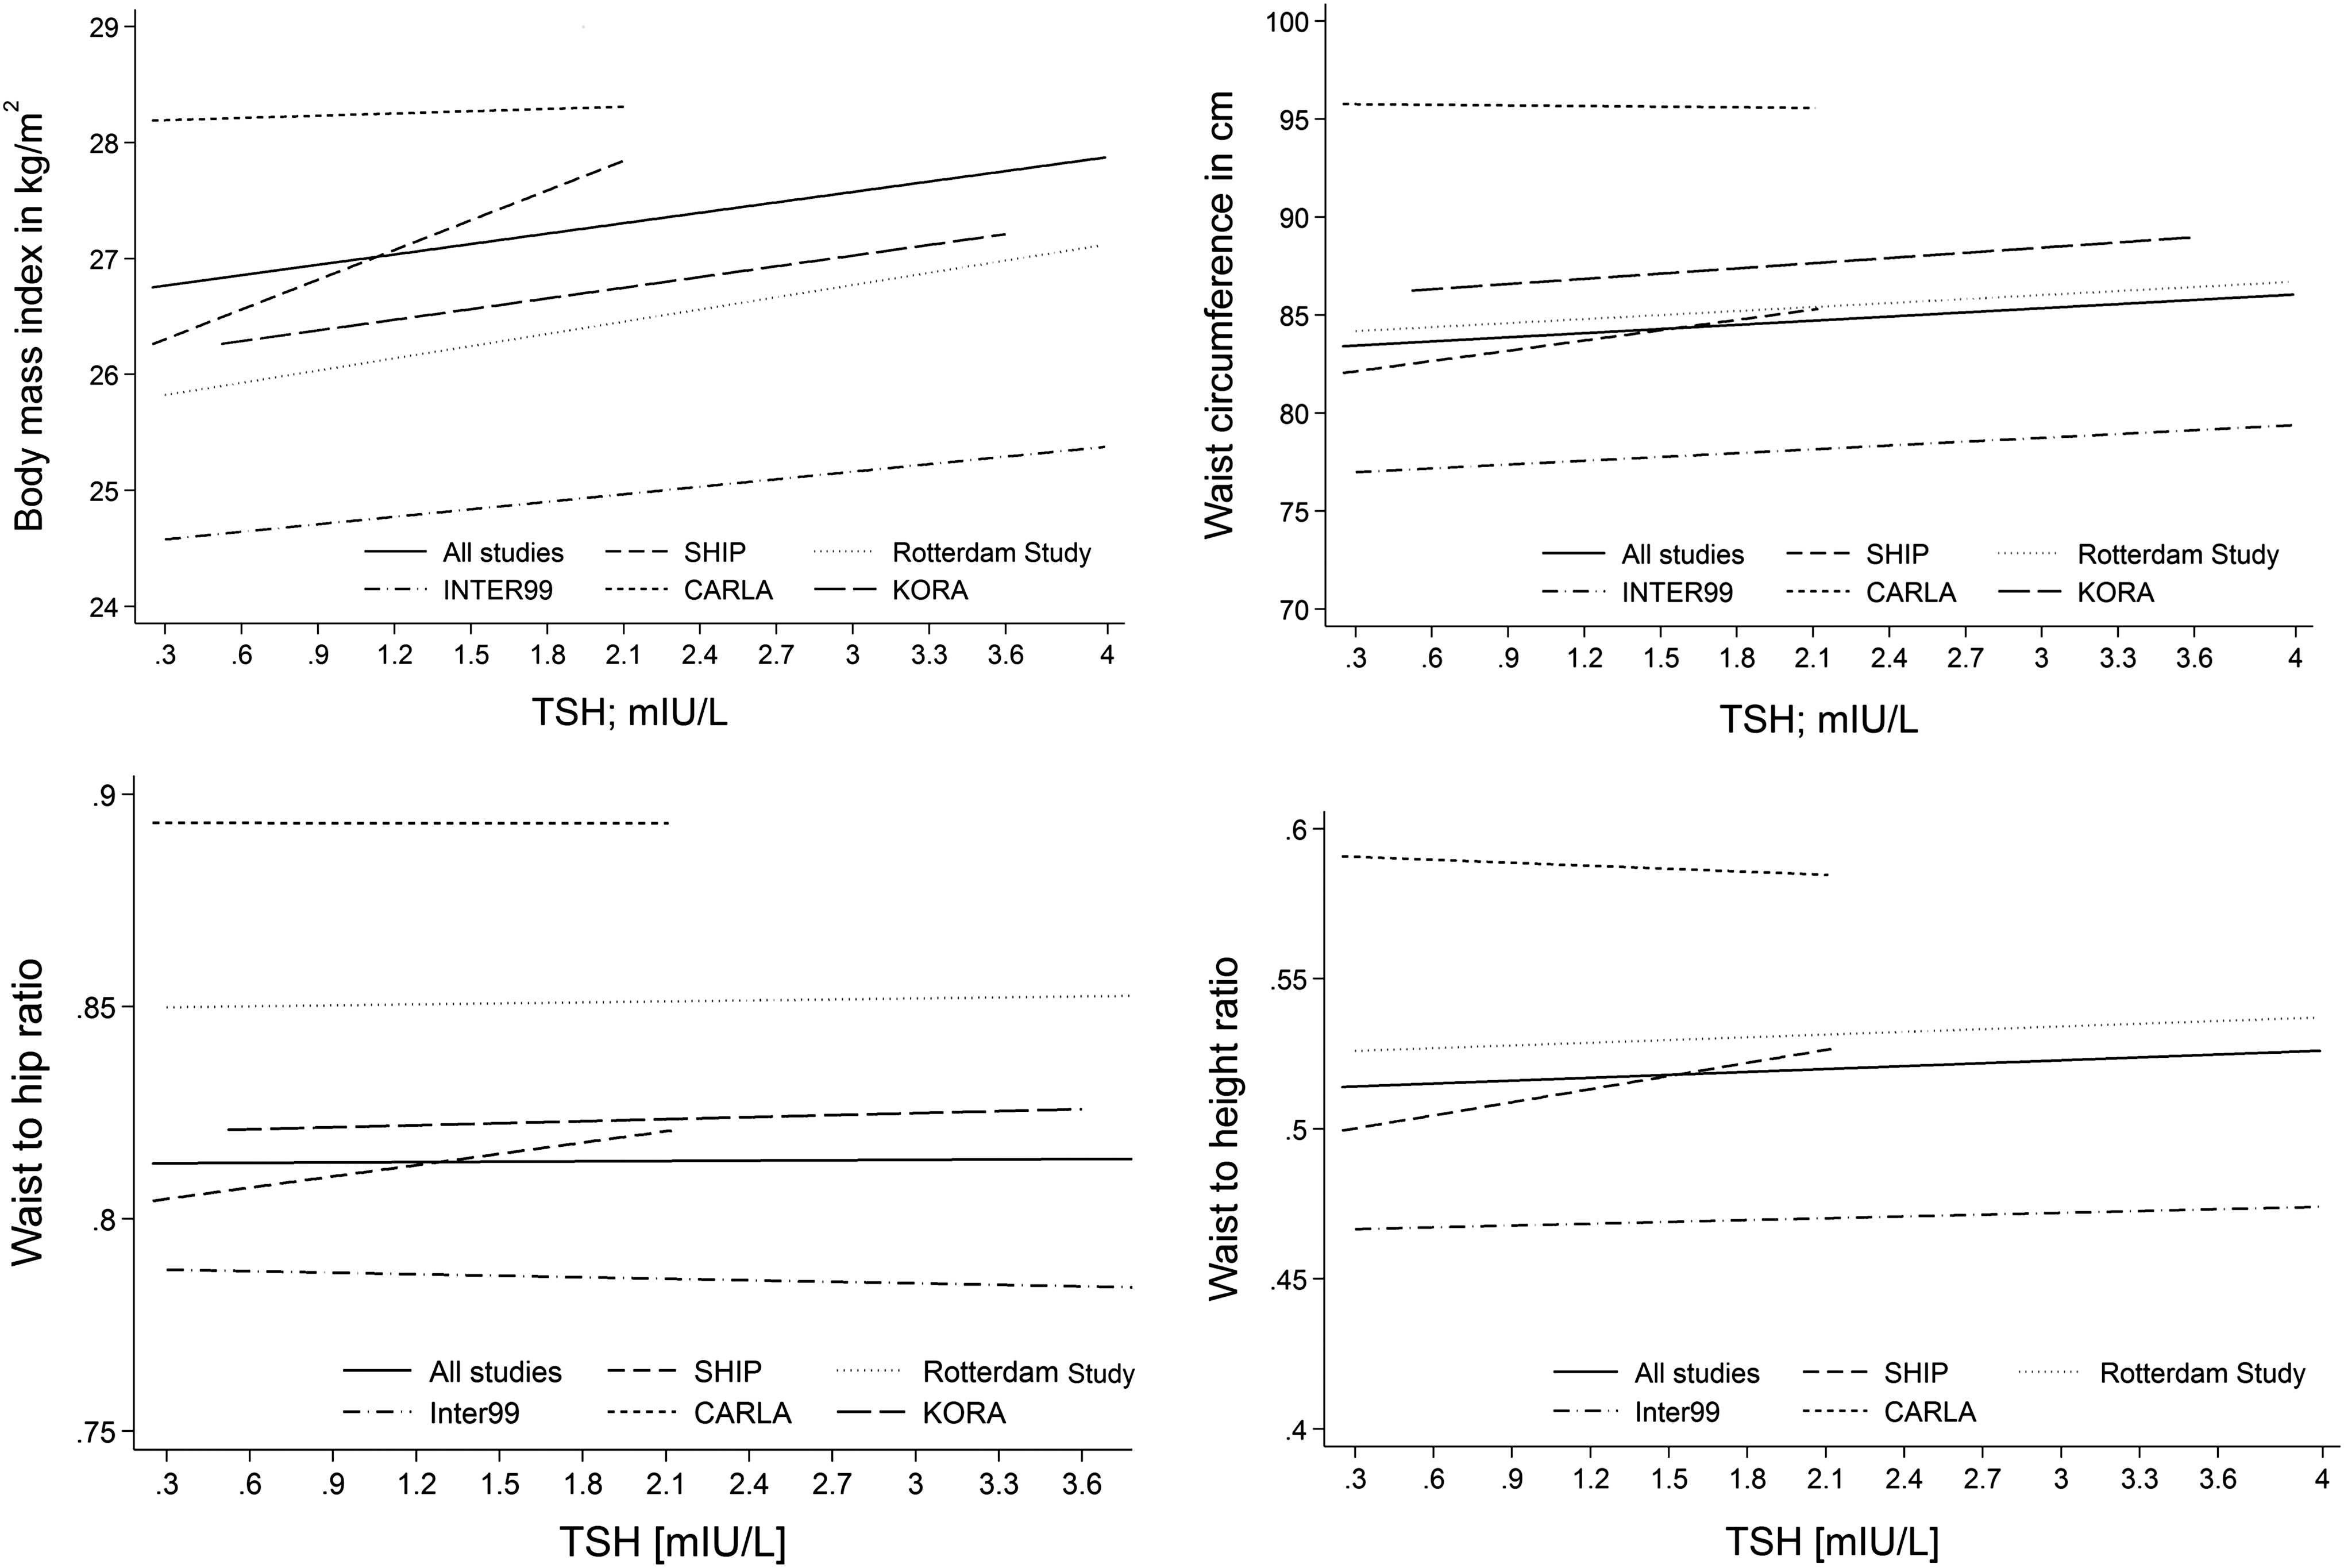
Adjusted regression curves for the association between baseline serum TSH over the study-specific reference range and baseline anthropometric measures BMI, WC, WHR, and WHtR in the single studies and the pooled population.
Median regression adjusted for age, sex, smoking status, and study. Fractional polynomials were applied to test for a nonlinear relationship between serum TSH levels and the respective outcome.
In comparison to TSH in the study-specific reference range.
p < 0.05.
TSH-MOM, multiple of median.
Per TSH concentration increase by 1 mIU/L within the reference range, the BMI increased in the median by 0.30 kg/m2 [CI 0.17–0.43], and WC was in median 0.71 cm [CI 0.37–1.04] higher for each increase of one TSH unit. For WHR, a statistically significant association was observed only in the full range but not in the reference range of serum TSH.
One out of five studies did not show an association between any considered anthropometric marker and TSH level in the cross-sectional analyses (CARLA study). Analyses of serum TSH levels within the reference range revealed similar but weaker results except for one study. In the Rotterdam study, a positive association was shown for BMI but not for the other considered anthropometric markers.
Comparing subjects with high serum TSH levels to subjects with normal TSH levels, significant positive associations were observed for all considered anthropometric markers except for WHR (e.g., BMI: β = 0.90 [CI 0.57–0.1.24]). Correspondingly, subjects with high TSH have in median a 0.90 kg/m2 higher BMI than euthyroid subjects do. On the other hand, subjects with a low serum TSH levels had significantly lower BMI values (β = −0.39 [CI −0.69 to −0.10]) than subjects with normal TSH levels and lower WC (β = −0.93 [CI −1.69 to −0.18]).
Association between serum fT3 and fT4 levels at baseline and anthropometric markers
In three out of five studies (SHIP, CARLA, and KORA; n = 8923), we were able to analyze the association between serum levels of fT3 and fT4 at baseline and the anthropometric markers. Serum fT3 levels were positively associated with BMI (β = 0.23 [CI 0.09–0.37]), but not with the other anthropometric markers. However, serum fT4 levels were positively associated with WC (β = 0.17 [CI 0.06–0.28]) and WHtR (β = 0.001 [CI 0.0003–0.002]), but not with BMI.
Longitudinal analyses: serum TSH concentrations at baseline and change in anthropometric markers
Longitudinal analyses were performed in all studies except the KORA study. Changes in anthropometric measures were strongest in SHIP and weakest in CARLA. While in SHIP median WC increased by 3.35 cm (IQR 0.08–6.70) within five years, the increase of median WC in CARLA was 0.78 cm (IQR −3.08 to 4.51) in the same period. Median BMI increased in SHIP by 0.61 kg/m2 (IQR −0.31 to 1.61), while the lowest increase of BMI was observed in the Rotterdam Study (0.25 kg/m2; IQR −0.48 to 1.03).
Results of the longitudinal analyses are given in Table 4 and Figure 3. In all studies, serum TSH levels at baseline were inversely associated with a five-year change of all considered anthropometric measures.
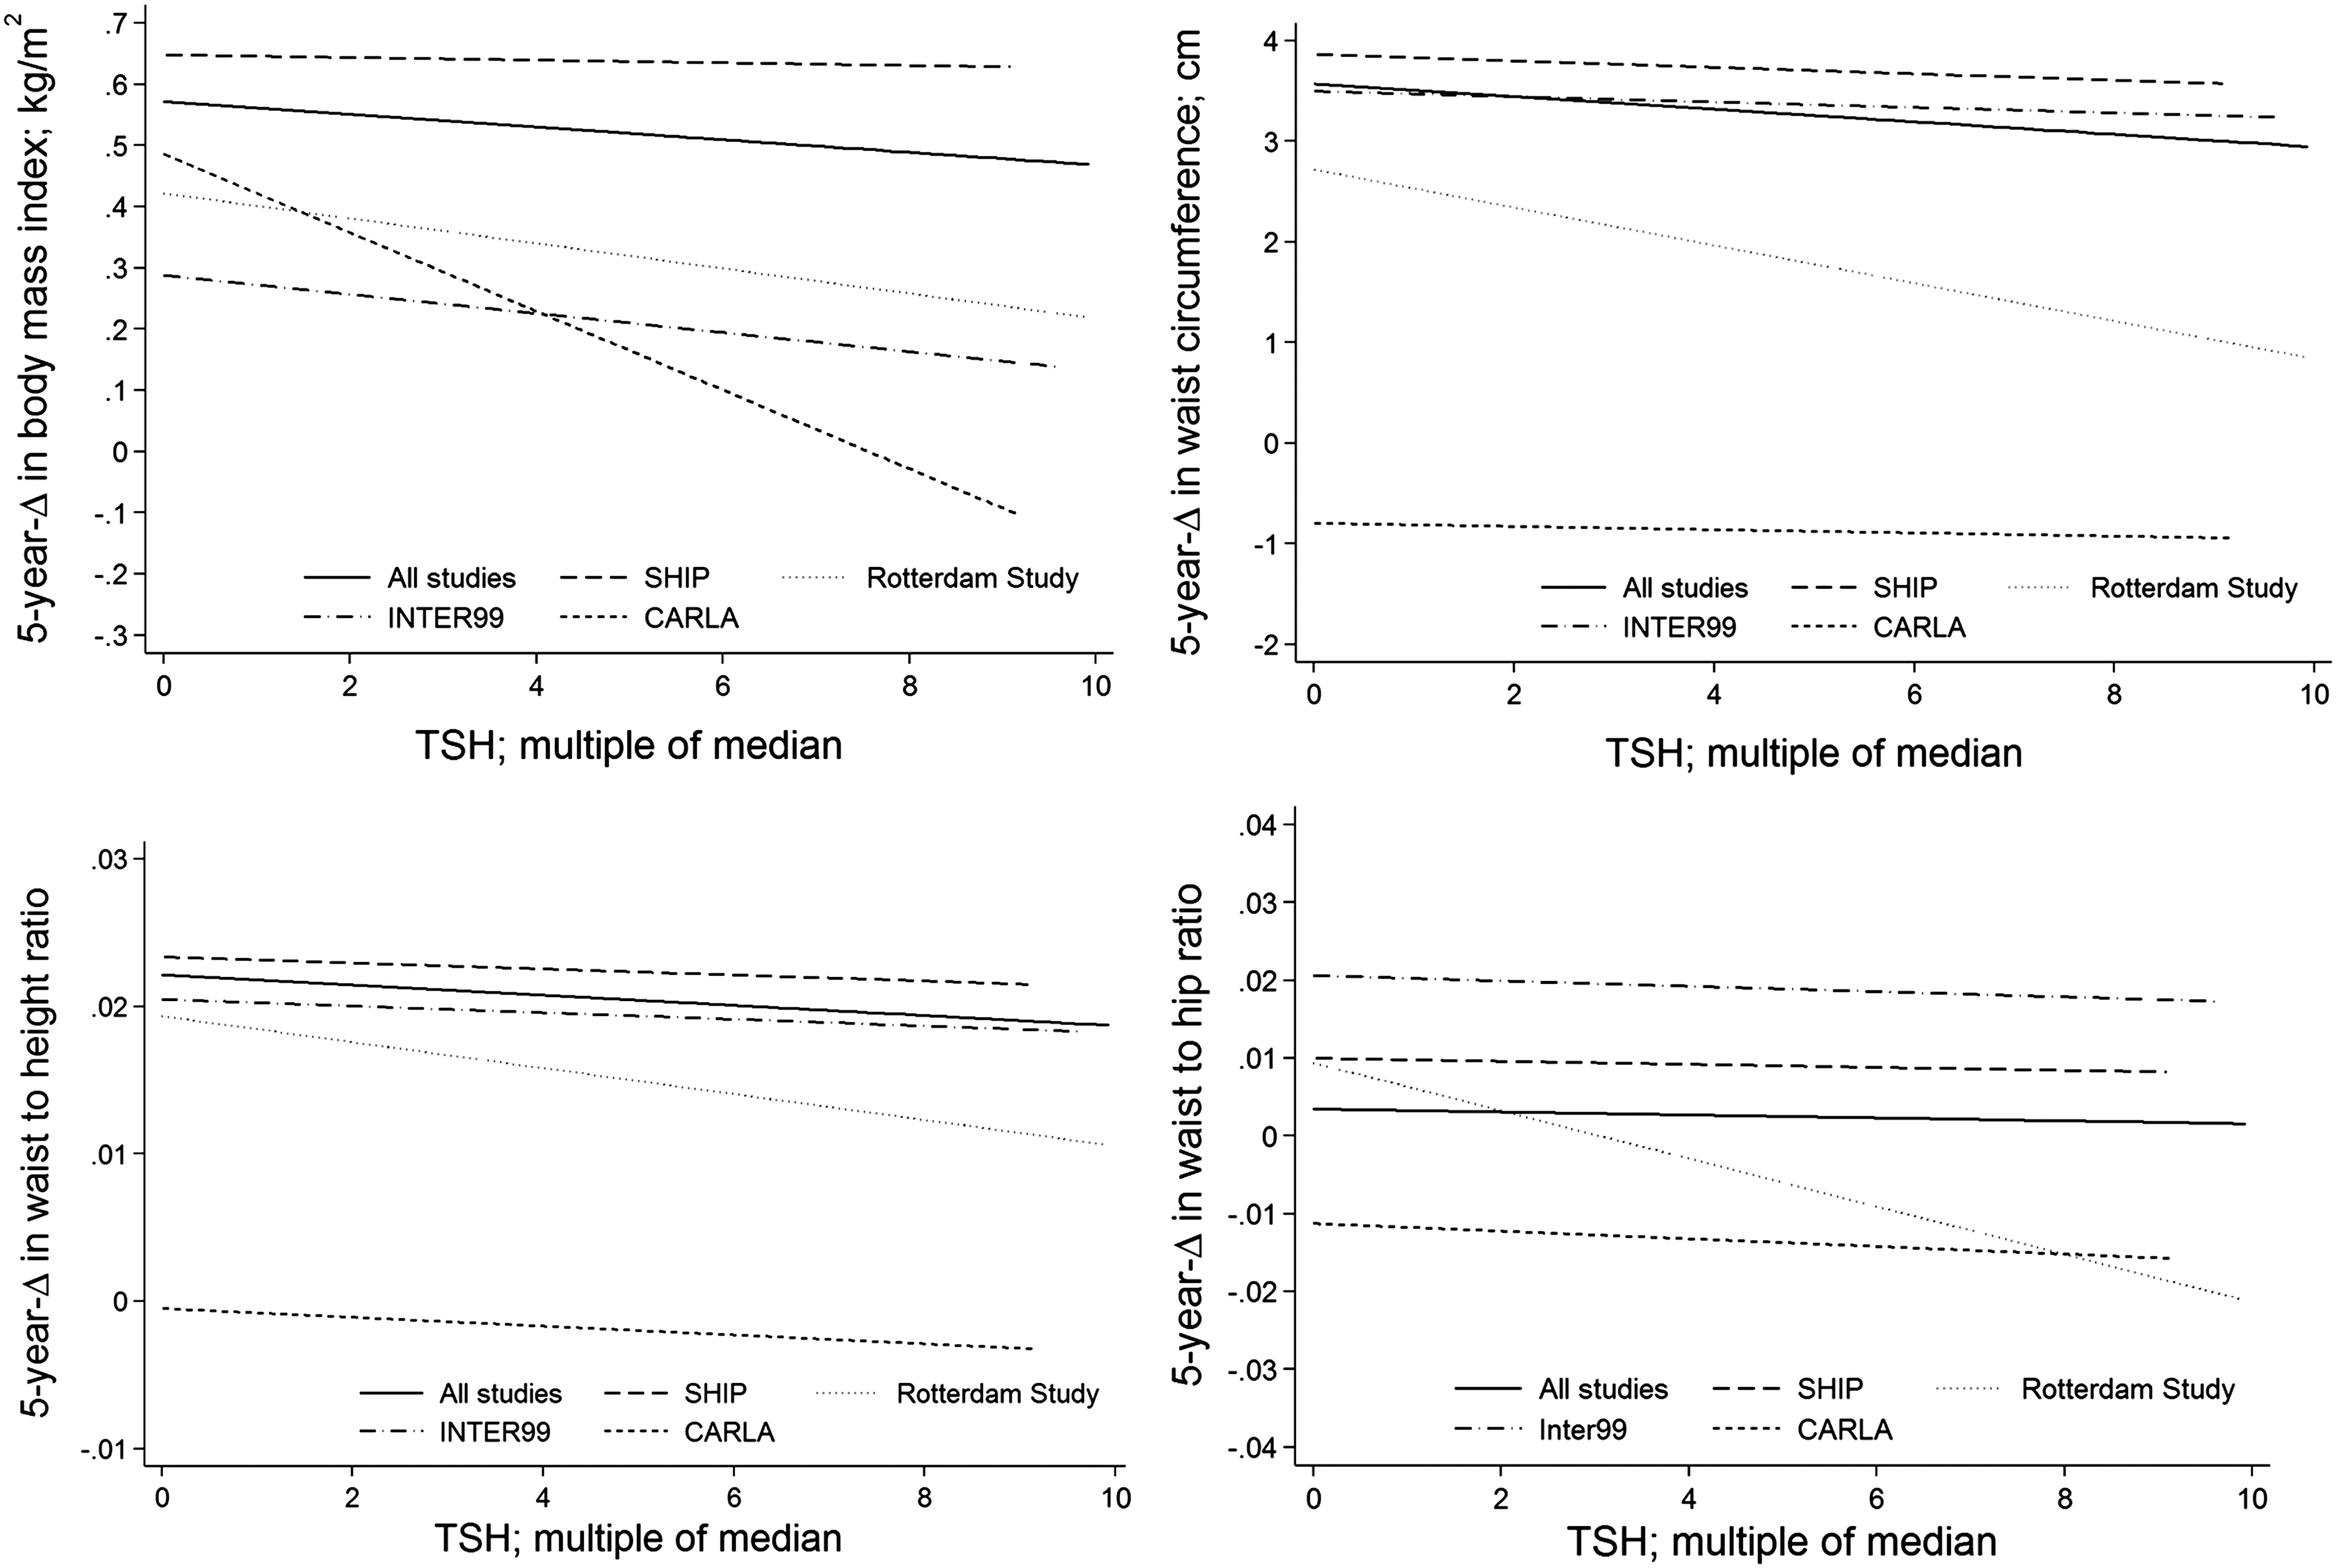
Adjusted regression curves for the association between baseline TSH-MOM over the full range and five-year change of anthropometric measures BMI, WC, WHR, and WHtR in the single studies and the pooled population.
Median regression for the five-year change in anthropometric measurement; all models adjusted for baseline values of age, sex, smoking status, and study, and weighted multiplicatively for non-response to follow-up. Fractional polynomials were applied to test for a nonlinear relationship between serum TSH levels and the respective outcome. Data are expressed as β and confidence intervals.
Reference range for serum TSH levels is 0.3–3.0.
p < 0.05.
For example, a median decrease of 0.125 cm WC (difference from 3.5 to 3.4 cm) was observed by increasing TSH from 1 to 3 TSH-MOM. BMI showed a median decrease of 0.02 kg/m2 (difference from 0.56 to 0.54 kg/m2) by increasing TSH from 1 to 3 TSH-MOM (see Fig. 2). These associations were also present for serum TSH at baseline within the prior defined reference range. Within this range, BMI decreased in median by 0.05 kg/m2 [CI −0.10 to −0.01] per one unit of TSH, and WC decreased in median by 0.17 cm [CI −0.39 to −0.06] per one unit of TSH.
No median difference was observed between subjects with high serum TSH levels and changes in any of the considered anthropometric markers. Comparing subjects with low serum TSH levels with subjects having serum TSH levels within the reference range, median changes in anthropometric markers were observed for BMI (β = 0.13 [CI −0.02 to 0.28]) and for WC (β = 0.24 [CI −0.46 to 0.94]).
Longitudinal analyses: change in serum TSH levels and change in anthropometric markers
The association between the five-year change of serum TSH levels and the five-year change of the considered anthropometric measures were analyzed in two out of five participating studies (Inter99 and SHIP). A positive association was found between TSH change and change in BMI (β = 1.87 [CI 1.27–2.45]), change in WC (β = 6.45 [CI 4.35–8.54]), and change in WHtR (β = 0.36 [CI 0.02–0.05]). No such association was observed for WHR (β = 0.00 [CI −0.02 to 0.02]).
Discussion
Positive associations were found between serum TSH levels and different anthropometric measures, including BMI, WC, and WHtR, in cross-sectional analyses. Except for WHR, such associations were also observed when analyses were restricted to subjects with serum TSH levels within the study-specific reference range. Correspondingly, individuals with high serum TSH levels (defined by the study-specific reference values as well) at baseline had significantly higher baseline values of BMI, WC, WHtR, and WHR than those with serum TSH levels within the reference range. These findings are in accordance with results from previous cross-sectional analyses investigating associations between serum TSH and anthropometric measures (mainly BMI) (6,7,9,16).
In the pooled longitudinal analyses of all four prospective studies, an inverse association was observed between serum TSH levels at baseline and five-year change in all considered anthropometric measures. Correspondingly, an increased TSH at baseline was associated with a decrease in BMI, WC, WHtR, and WHR. These findings are in contrast to previous studies, in which no association between TSH levels at baseline and change in anthropometric markers was detected (7,26), or a positive association between TSH serum levels and weight change was observed (16). One possible explanation for this unexpected result could be the fact that subjects (except for Inter99) with high TSH values at baseline were informed about their thyroid status and afterwards received TSH-lowering medication, which may have resulted in a decrease of both TSH values and BMI between baseline and follow-up. Consistent with this assumption, it was observed that an increase of serum TSH levels between baseline and follow-up was associated with an increase in body weight during the same period in the two studies (SHIP and Inter99), where data of TSH at the follow-up were available. This finding is in agreement with results from the Norwegian HUNT study, in which an association between change in serum TSH and change of BMI and WC was demonstrated, respectively (26).
The association between thyroid function and anthropometric markers is still not well understood. Thyroid function and anthropometric markers seem to affect each other mutually. Previous studies suggest that the prevalence of thyroid diseases is increased in obese subjects (17,27). A possible underlying mechanism may be that the regulation of the hypothalamic–pituitary–thyroid axis is affected by anthropometric- or nutrition-related factors (28), since obese subjects without thyroid dysfunction have higher serum TSH levels than healthy subjects with normal weight have (5). The positive association between TSH serum levels and anthropometric markers seen in the cross-sectional analyses could be mediated via leptin, which is secreted by the adipocytes and is known to stimulate TSH secretion by the pituitary (29). A positive association between leptin and TSH has previously been found (30). A stimulating effect of leptin on TSH secretion would also lead to increased thyroid hormone levels. Indeed, in the three studies with available data for serum fT3 and fT4, there was a positive association between these thyroid hormones and anthropometric markers. In contrast, a Danish study found the opposite: a decrease in serum fT4 with increasing BMI (16). However, the latter study was performed in an iodine-deficient region before the initiation of an iodization program in Denmark. In contrast, in northern Germany (SHIP) and southern Germany (KORA), the iodine supply is considered to be sufficient after the initiation of such a program (20). Thus, differences in iodine supplies may be responsible for the contradictory findings.
It has been reported that loss in body mass may induce a decrease in TSH (31,32), which leads to the assumption that TSH decreases among people who lose weight but increases among people who gain weight (26). The effect of obesity on serum TSH levels is more difficult to explain. It has been suggested that a TSH increase should be considered as an adaptive mechanism in order to counteract the increased weight (33). Another approach to explain this association is the hypothesis that TSH is either partially biologically inactive or TSH resistance is increased among people with obesity. Furthermore, the association in this direction can also be triggered by the previously mentioned effect of leptin secretion by adipocytes on serum TSH levels.
Strengths and Limitations
The major strength of this study is the large number of individuals from five population-based studies. All studies used similar standardized procedures of anthropometric measurements and recruited subjects from regions with different previous histories of iodine deficiency.
Some limitations also need to be recognized. Despite the harmonization of the anthropometric measurements, an impact of the inter- or intra-observer variability of the manually derived measures cannot be completely ruled out, in particular regarding hip and waist circumferences. Furthermore, methodological differences in anthropometric measurement may be responsible for study-specific differences in several results such as WC. However, the direction of the associations between serum TSH levels and anthropometric markers is, despite different levels, almost always the same for all studies.
While blood samples in Inter99, KORA, and the Rotterdam Study were taken from fasting subjects, in SHIP and CARLA blood samples were taken from non-fasting individuals. Thus, lower serum TSH levels were observed in SHIP and CARLA than in the other three studies, which may be referred to the non-fasting state (34). Moreover, thyroid biomarkers were partly determined in different laboratories. While in SHIP, KORA, and CARLA samples were measured in the same laboratory, the Rotterdam Study and Inter99 used other laboratories. This may have limited the comparability of the TSH measurements between the studies. However, it is assumed that the associations between serum TSH levels and the anthropometric markers should not be affected.
Serum TSH levels at the first follow-up were only determined in two out of five studies. Thus, changes of TSH levels could not be included in the pooled analyses. Furthermore, age ranges differ substantially between the included studies, which might limit the interpretation of the results. However, results from the different studies pointed mostly in the same direction, so that it was feasible to perform an analysis based on pooled data from all studies.
Conclusion
Elevated and high TSH serum levels are positively associated with current anthropometric markers of obesity in a cross-sectional setting, but show a negative association with the change in these anthropometric markers over a time span of approximately five years. Further research is needed to determine clinical implications as well as public-health consequences of these findings.
Footnotes
Acknowledgments
SHIP is part of the Community Medicine Research Network of the University Medicine Greifswald, which was funded by the German Federal Ministry for Education and Research, the Ministry for Education, Research and Cultural Affairs, and the Ministry for Social Affairs of the State Mecklenburg-West Pomerania. Analyses were further supported by the German Research Foundation (DFG-SPP 1629 ThyroidTransAct: VO955/12-1).
CARLA was funded by a grant from the Deutsche Forschungsgemeinschaft (DFG, German Research Foundation) as part of the Collaborative Research Center 598 “Heart failure in the elderly—cellular mechanisms and therapy” at the Medical Faculty of the Martin-Luther-University Halle-Wittenberg; by a grant of the Wilhelm-Roux Programme of the Martin-Luther-University Halle-Wittenberg; by the Federal Employment Office; and by the Ministry of Education and Cultural Affairs of Saxony-Anhalt.
Inter99 was supported by The Danish Medical Research Council, The Danish Centre for Evaluation and Health Technology Assessment, Novo Nordisk, Copenhagen County, The Danish Heart Foundation, The Danish Pharmaceutical Association, Augustinus foundation, Ib Henriksens foundation, and Beckett foundation.
We are grateful to the study participants, the staff from the Rotterdam Study, and participating general practitioners and pharmacists. The Rotterdam Study is supported by the Erasmus MC and Erasmus University Rotterdam; the Netherlands Organization for Scientific Research (NWO); the Netherlands Organization for Health Research and Development (ZonMw); the Research Institute for Diseases in the Elderly (RIDE); the Netherlands Genomics Initiative (NGI); the Ministry of Education, Culture and Science; the Ministry of Health Welfare and Sports; the European Commission (DG XII); and the Municipality of Rotterdam.
The KORA research platform and the KORA Augsburg studies are financed by the Helmholtz Zentrum München, German Research Center for Environmental Health (GmbH), which is funded by the German Federal Ministry of Education, Science, Research and Technology and by the State of Bavaria. Statistical analyses were supported by the Deutsche Forschungsgemeinschaft (DFG VO 955/12-1).
Author Disclosure Statement
The authors have nothing to disclose.