
Abstract
Background:
Recently, a number of studies have advocated the diagnostic benefit of contrast-enhanced computed tomography (CECT) in the current ultrasound (US)-based preoperative evaluation of thyroid cancer. However, no study has been conducted to optimize a CECT protocol focusing on tumor conspicuity using a multi-detector CT scanner. This study aimed at determining the optimal scan delay for increased CT attenuation differences between thyroid cancer and parenchymal background using a biphasic CECT examination.
Methods:
This study retrospectively enrolled 84 patients (M:F = 7:77; M age = 44.8 ± 10.9 years) with 87 papillary thyroid carcinomas (M size = 14.1 mm) who consecutively underwent US and CECT examination prior to surgery. In each patient, CT scanning was taken twice—once with a 40-second delay and once with a 70-second delay—using a 64-channel multi-detector scanner. After obtaining the mean attenuation value (MAV) of the thyroid cancer and the ipsilateral parenchyma by drawing regions of interest on the CECT images based on their cytopathologic results and US findings, the parenchyma–cancer differences (PCD) between the early and delayed scans were simply compared using a paired t-test. Then, the mean differences in the MAVs of the thyroid cancer and ipsilateral parenchyma (hereafter abbreviated as Group) between the early and delayed scans (abbreviated as Time) were compared after adjusting for the other factors that significantly affected MAVs, such as concentration of iodinated contrast medium (abbreviated as CCM) and size of thyroid cancer (abbreviated as Size) using a repeated-measures general linear model.
Results:
Because the ipsilateral parenchyma exhibited significantly higher attenuation on the early scan and further decline on the delayed scan compared with thyroid cancer (p < 0.001), the PCD for thyroid cancer was significantly better with a 40-second scan delay than a 70-second delay (58.8 ± 36.6 Hounsfield units [HU] vs. 40.4 ± 25.6 HU; p < 0.001). Similar results were obtained from the repeated-measures general linear model that considered the effects of CCM, Size, Group, and Time, and the interaction of Group and Time.
Conclusion:
Based on this CECT study that adjusted for the effects of CCM and size on MAV, early scans (e.g., 40-second scan delay) are helpful for improving the tumor conspicuity of thyroid cancer on CECT images.
Introduction
A
This study aimed to investigate the influence of scan delays on tumor conspicuity by comparing the CT attenuation difference between thyroid carcinomas and parenchymal backgrounds that were obtained from the biphasic CECT examination (40- and 70-second scan delays) using a 64-channel MDCT.
Methods
Patients
The Institutional Review Board approved the review of medical records and US and CECT findings of the selected patients. The informed consent requirement was waived because the patients' data were evaluated retrospectively and anonymously. At the authors' institution, US-guided fine-needle aspiration (FNA) is the primary modality for evaluating thyroid nodules. After obtaining the cytologic diagnoses of malignancy, some patients undergo CECT to assess extrathyroidal extension and nodal metastasis within one month of surgery, although CECT is not routinely recommended (7). The indications for CECT examinations among the patients who were scheduled for thyroidectomy were: (i) aerodigestive tract invasion or lateral neck node metastasis was suggested by previous sonographic evaluation; (ii) patients complained of hoarseness, dyspnea, or dysphagia; (iii) bulky or fixed thyroid cancers were palpated during physical examination with or without suspicious substernal extension; (iv) tracheal invasion was suggested by laryngoscopic examination; or (v) reliable sonographic information was not fully provided for the primary thyroid cancer itself and both neck lymph nodes when the cancer was diagnosed at an outside hospital by US-guided FNA.
In addition, radioiodine therapy at the authors' institution is usually performed six to eight weeks after total thyroidectomy; the time interval between iodinated CM infusion and radioiodine therapy is two to three months. Thus, the interference of CM in subsequent radioiodine treatment is negligible based on the recommendation of the European Association of Nuclear Medicine therapy committee (17).
During the two-year period between 2008 and 2009, 299 patients with thyroid cancers underwent thyroid operations at the authors' hospital. Among the 299 patients, 129 subjects were retrospectively identified who met the following inclusion criteria: (i) their thyroid cancers were sonographically assessed by the radiologists in the authors' department prior to surgery; (ii) their CECT examinations were performed in the authors' department before the surgery using the department's standard CT enhancement protocol for thyroid cancer; and (iii) the pathologic type of thyroid cancer was papillary thyroid carcinoma (PTC).
To determine the impact of factors other than scan delay that could possibly affect the mean attenuation values (MAVs) of thyroid cancer and parenchyma, the following features were also recorded from the results for all patients: (i) pathologic evidence of diffuse thyroiditis in ipsilateral thyroid parenchyma (present vs. absent) in the surgical specimen, and (ii) size of thyroid cancer.
Sonographic evaluation and US-guided FNA
Four experienced radiologists performed sonographic evaluations of the thyroid and neck using high-resolution linear transducers (iu-22 or HDI 5000; Philips Healthcare, Bothell, WA). The sonographic features of each thyroid nodule were prospectively described with respect to size, shape, margin, echotexture, echogenicity, and presence of micro- and macro-calcifications (6,18). Based on the known sonographic criteria of malignant thyroid nodules, two board-certified radiologists (10 and 12 years of experience) performed US-guided FNA for suspicious nodules using a 23-gauge needle connected to a 10 mL syringe (19).
Neck CT scanning and CM infusion protocols
The patients were scanned with a 64-channel MDCT scanner (Brilliance 64-channel CT; Philips Medical Systems, Cleveland, OH) at the following settings: rotation time, 0.5 seconds; beam collimation, 64 mm ×0.625 mm; helical pitch (beam pitch), 0.89; table movement, 71.3 mm/sec; tube voltage, 120 kV; tube current, 250 mAs; and field of view, 220 mm. All axial and coronal images were reconstructed every 3 mm on a 512 × 512 matrix. For each patient, an 80 mL bolus of two different non-ionic CM iodine concentrations (Ultravist 300, Bayer Schering, Berlin, Germany, 300 mgI/mL; Omnipaque 350, GE Healthcare, Milwaukee, WI, 350 mgI/mL) was administered into an antecubital vein at a rate of 2.5 mL/sec using a power injector (MCT; Medrad, Pittsburgh, PA) and a 20-gauge intravenous catheter. Immediately after contrast infusion, 20 mL of a normal saline solution was injected at a rate of 3 mL/sec to reduce any perivenous artifacts induced by stagnant CM within the subclavian vein (20). The right arm was preferentially selected whenever possible to avoid delayed CM arrival by physiologic compression of the left brachiocephalic vein as a potential problem when the left arm is used (21).
During the study period, unenhanced CT images were not routinely obtained in the institution to detect calcifications of the thyroid nodule or cervical lymph node, and biphasic CECT examinations were taken for the neck and upper mediastinum. The first scan started at the skull base and continued toward the aortopulmonic window 40 seconds after the CM infusion was begun, and the second scan started 70 seconds after the start of the CM infusion with the same maneuver.
Quantitative imaging analysis
Image analysis was performed on a picture archiving and communication system (Piview; Infinitt, Seoul, Korea) with the same soft-tissue algorithm display (window level, 60 HU; window width, 300 HU). To determine the degree of contrast enhancement, one board-certified radiologist (10 years of experience in cross-sectional and sonographic imaging of the head and neck) quantitatively measured the MAV of the thyroid cancer and the ipsilateral thyroid parenchyma on the same axial-level images obtained at 40- and 70-second scan delays by drawing a region of interest (ROI). Thyroid cancer was defined as a hypoattenuated lesion relative to the normal thyroid parenchyma on the CECT image that was matched positionally with the sonographic appearance of the thyroid nodule that eventually proved to be PTC by both US-guided FNA and surgery. The MAVs of the thyroid cancers were measured on the axial CT images that demonstrated the largest cross-sectional area of the lesion (Fig. 1A and B). The ROIs were drawn on the solid portion of thyroid cancers that did not show any macrocalcification or cystic changes based on the sonographic image. The size of the ROI varied depending on the size of the evaluated lesion, and the mean area of the ROIs was 210.8 ± 100.4 mm2 (range 12.5–1133.5 mm2). The MAVs for the thyroid parenchyma were measured in the ipsilateral parenchymal background devoid of thyroid nodules, calcifications, and prominent artifacts (Fig. 1C and D). Attempts were made to maintain a constant ROI area of approximately 100.0 mm2. The conspicuity of a thyroid cancer can be expressed by the attenuation difference between the ipsilateral parenchyma and the cancer, the so-called parenchyma–cancer difference (PCD). Therefore, the PCD was defined as the result obtained by subtracting the MAV of the thyroid cancer from that of the parenchymal background.
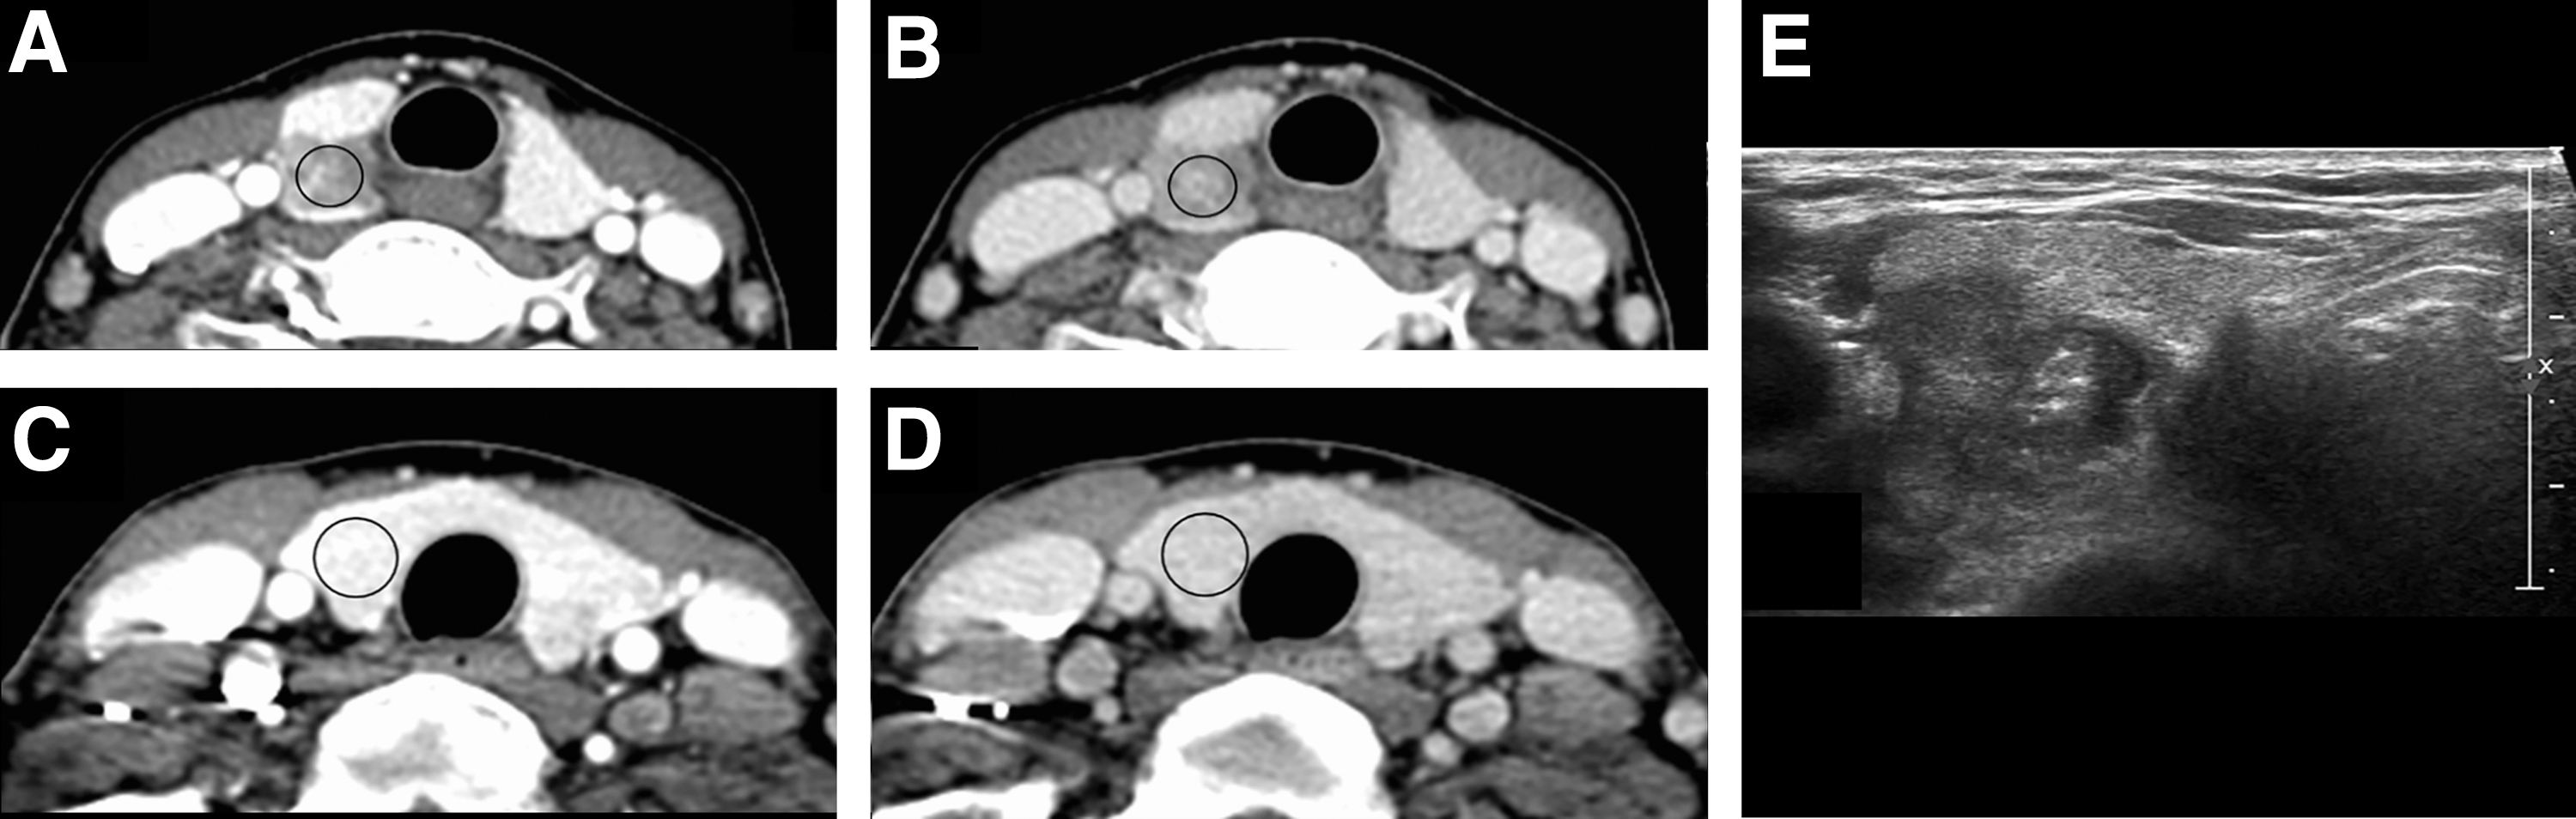
Axial contrast-enhanced computed tomography (CECT) images (window level, 60 Hounsfield units [HU]; width, 300 HU) in a 45-year-old woman with a right-sided papillary thyroid carcinoma (PTC). (
Statistical analysis
All statistical analyses were performed using IBM SPSS Statistics for Windows v20.0 (IBM Corp., Armonk, NY) and SAS v9.4 (SAS Institute, Inc., Cary, NC). Categorical variables are expressed as numbers and percentages. Continuous variables are expressed as mean values ± standard deviation.
First, paired t-tests were used to compare the differences between the mean MAVs for thyroid parenchyma, cancer, and PCDs obtained from CECT images with 40- and 70-second scan delays, without considering the other factors that could have influenced the MAVs.
Second, the mean MAV differences between the thyroid cancer and the ipsilateral parenchyma (hereafter abbreviated as Group) and between the early and delayed scans (abbreviated as Time) were compared using a repeated-measures general linear model after considering the other variables that could influence MAVs, such as sex, age, concentration of iodinated CM (abbreviated as CCM), size of thyroid cancer (abbreviated as Size), and coexistence of diffuse thyroiditis. A p-value of <0.05 was regarded as statistically significant.
Results
Demographics
Among the 129 patients who were initially recruited for this study, 45 patients whose thyroid cancers were not relevantly depicted on their CECT images were subsequently excluded by retrospective review. The reasons for excluding these 45 patients based on their US findings and cytopathologic results were: (i) the sizes of their thyroid cancers were too small to be delineated on CECT images (n = 18); (ii) there was limited evidence to decide which were pathologically verified cancers among the multiple thyroid nodules seen in the CECT image when other benign thyroid nodules coexisted with the thyroid cancer in the surgical specimen, even though they were sonographically assessed (n = 17); or (iii) beam-hardening CT artifacts that occurred around the thyroid gland by highly concentrated CM or clavicle impaired the quantitative measurement of the thyroid cancer and parenchyma (n = 10). The mean size of the thyroid cancers that were not clearly defined on CT images was 4.7 mm (range 1.5–8.7 mm) based on the pathology reports. Finally, 84 patients (7 men; M age = 44.8 ± 10.9 years (range 22–70 years) with 87 PTCs were included.
The mean size of the thyroid cancers in the study population was 14.1 ± 8.3 mm (range 3–50 mm), and the number of thyroid cancers >1 cm in diameter was 51 (58.6%). Among the 84 patients, diffuse thyroiditis coexisted in the surgical specimens of 38 (43.7%). Thirty-five patients (43.7%) and 52 patients (56.3%) received 300 mgI/ml CM and 350 mgI/ml CM, respectively.
Scan delay and contrast enhancement
Both the MAVs that were measured in the thyroid parenchyma and cancers and the PCDs that were assessed with 40- and 70-second scan delays are summarized in Table 1. The mean MAVs for the ipsilateral parenchyma and thyroid cancer were 203.3 ± 25.5 HU and 150.4 ± 44.3 HU, respectively, and 161.6 ± 20.0 HU and 127.8 ± 37.0 HU for the early and delayed scans. From the statistical comparisons using the paired t-tests, the mean MAVs for the ipsilateral parenchyma were significantly greater than those of the thyroid cancers in both scan delays (p < 0.001; Fig. 2A). In addition, the MAVs for both thyroid cancer and ipsilateral parenchyma were significantly higher in the CECT images with the 40-second delay compared with those with the 70-second delay (p < 0.001; Fig. 2B). In particular, the ipsilateral parenchyma showed a significantly steeper decline in the delayed scan than did the carcinomas, which led to a decrease in the PCDs of the delayed scans (58.8 ± 36.6 HU vs. 40.4 ± 25.6 HU; p < 0.001; Fig. 2B). Therefore, the tumor conspicuity of thyroid cancer was better on images that were obtained with a scan delay of 40 seconds considering no effects of other factors (Figs. 3 and 4). In addition, it was noticed that some lymph nodes, which were subsequently confirmed as harboring metastatic disease, were more conspicuous in early images than delayed images (Fig. 5A–E).
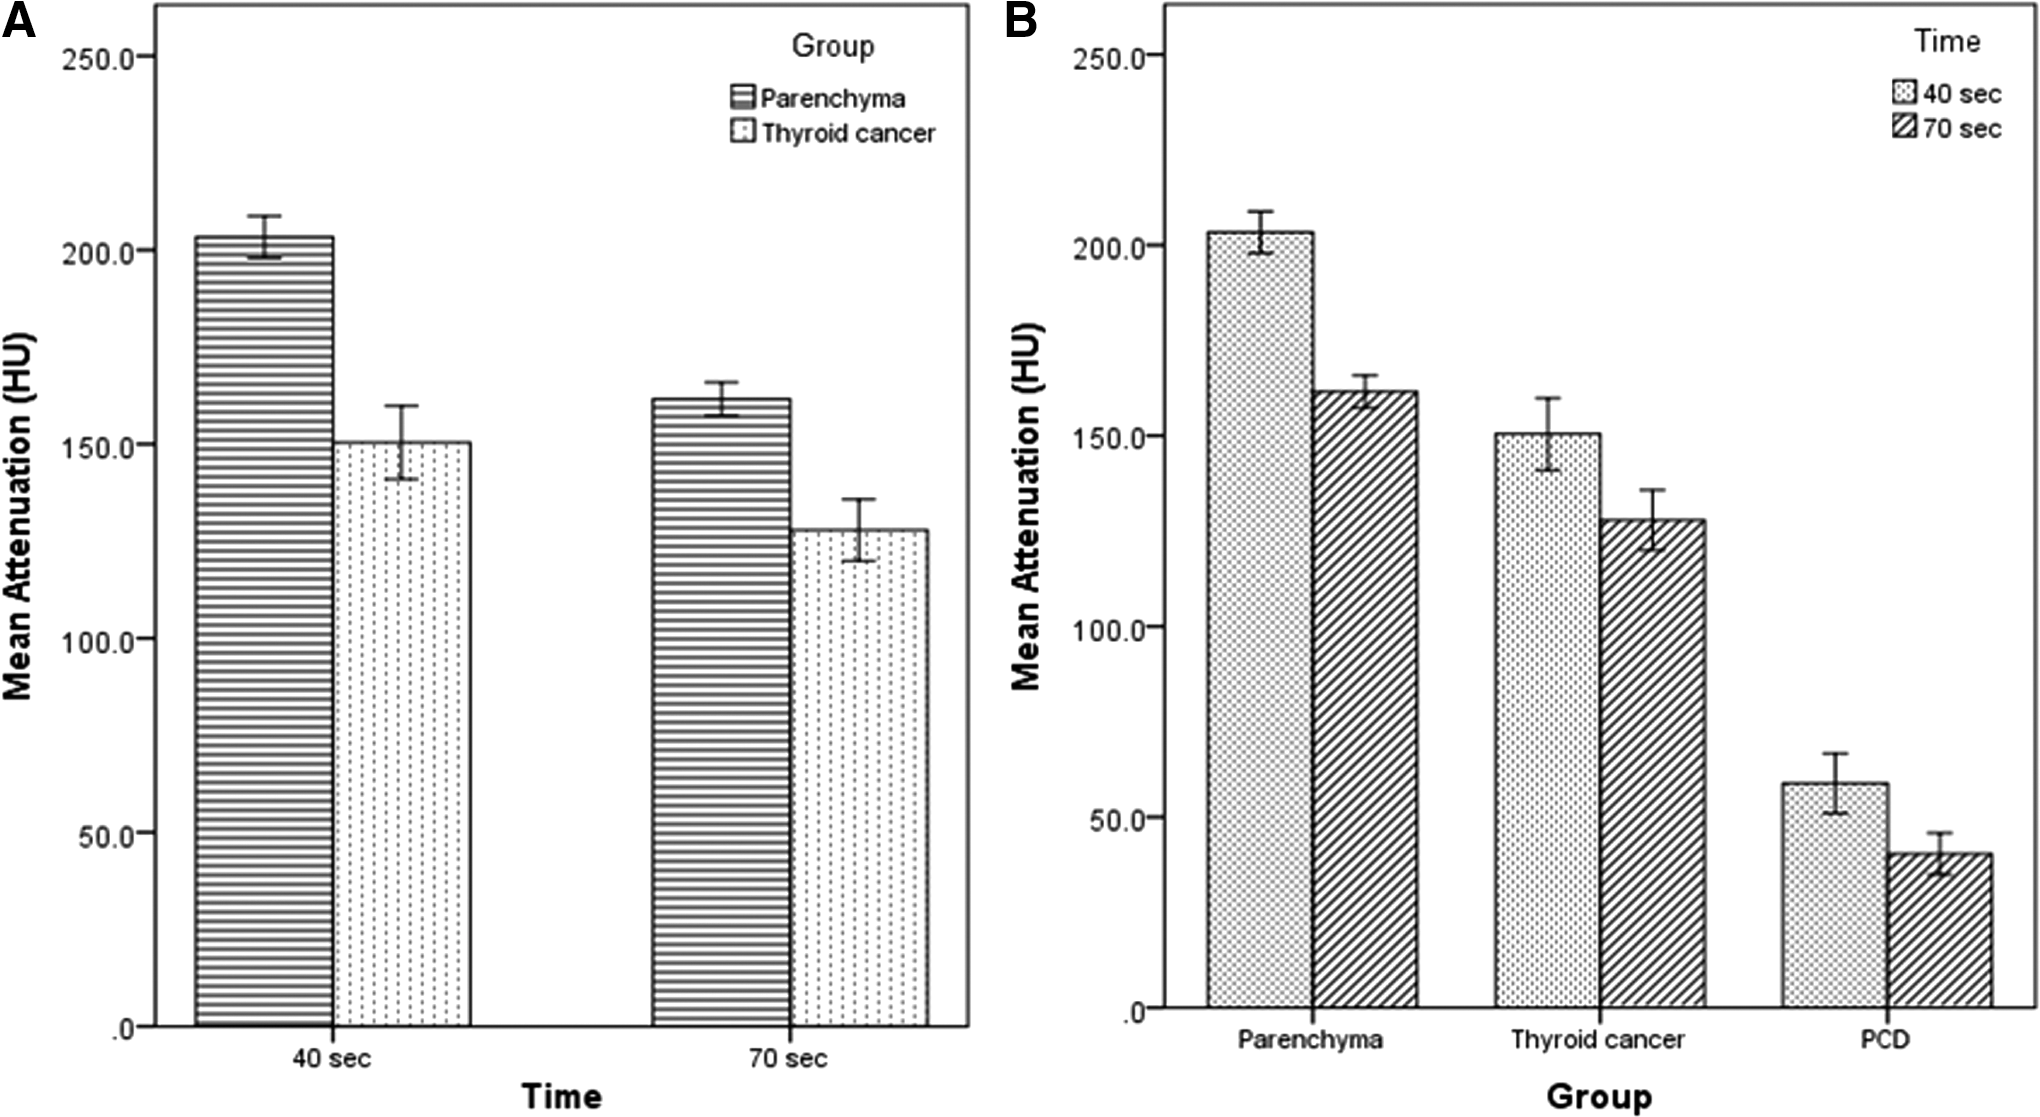
Error bar plot to indicate the mean and confidence interval of mean for Group within Time (
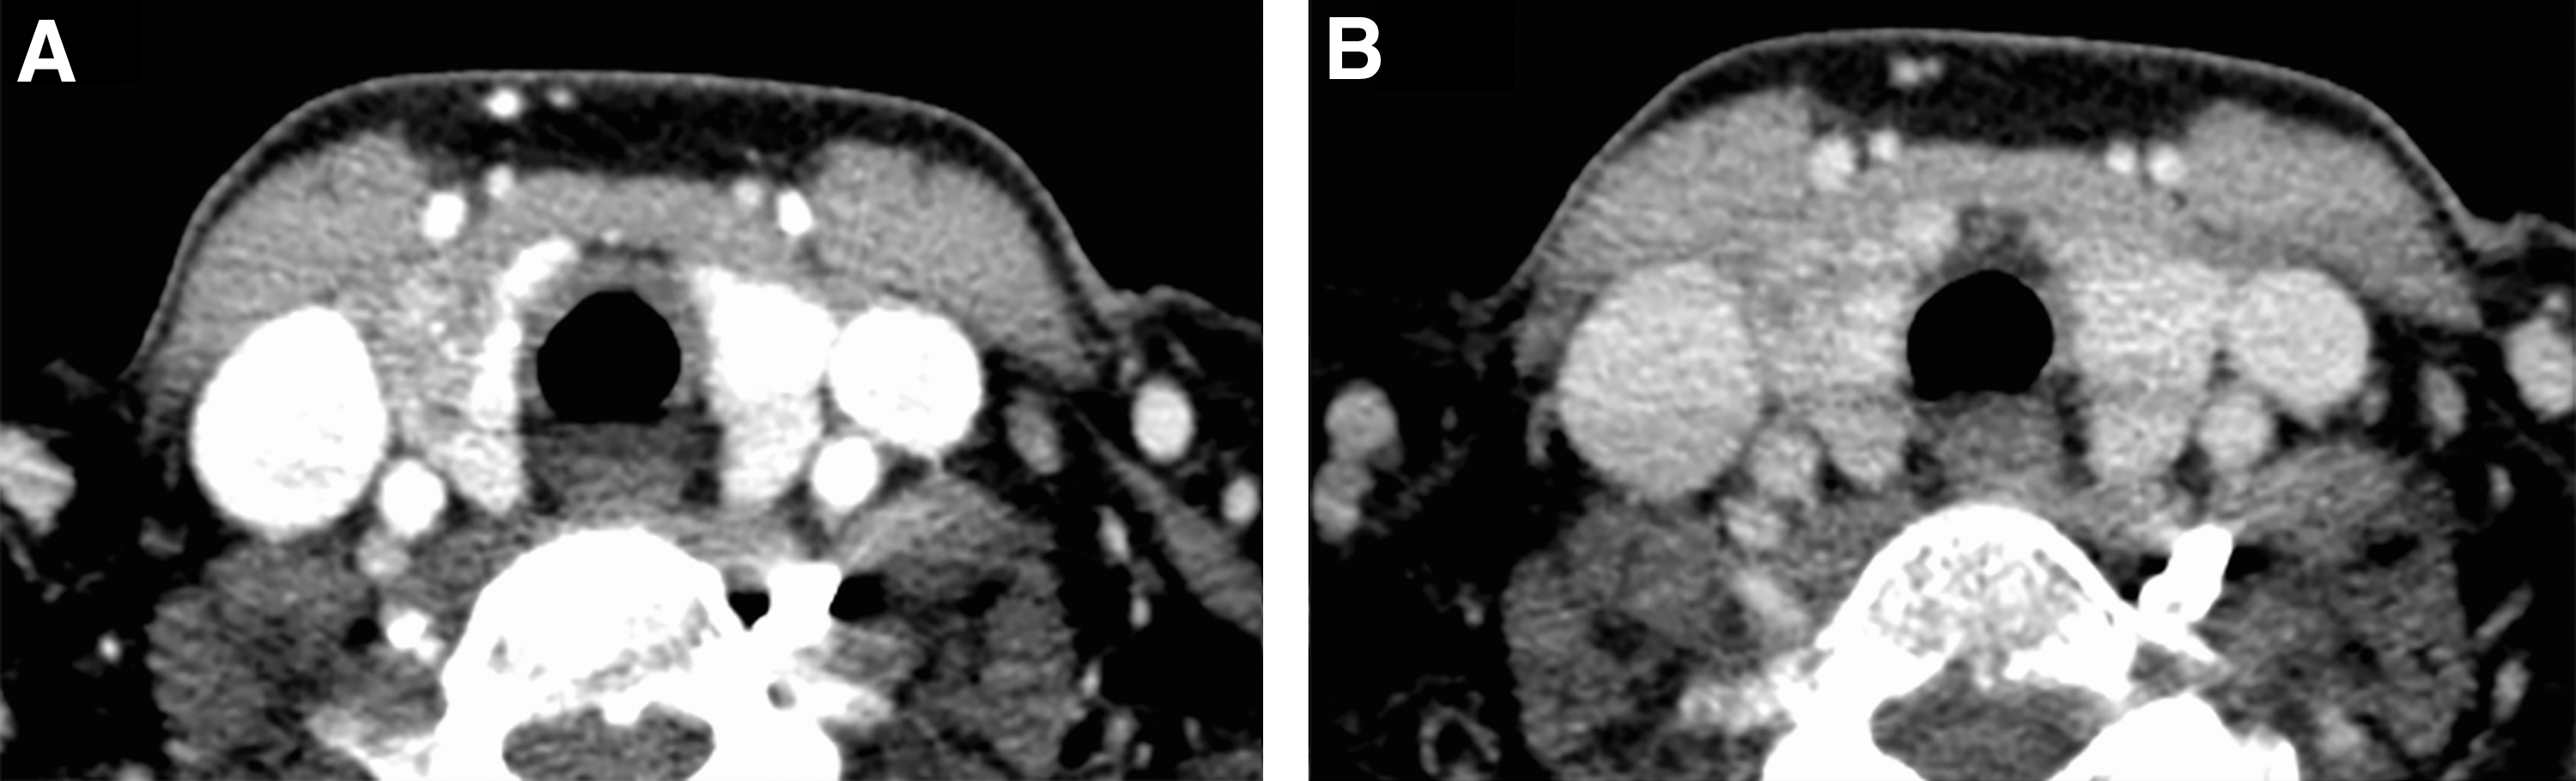
A 29-year-old woman with a right-sided PTC (size 19 mm). The margin of right thyroid cancer is more delineated from the ipsilateral parenchyma in a CECT image obtained with a 40-second scan delay (
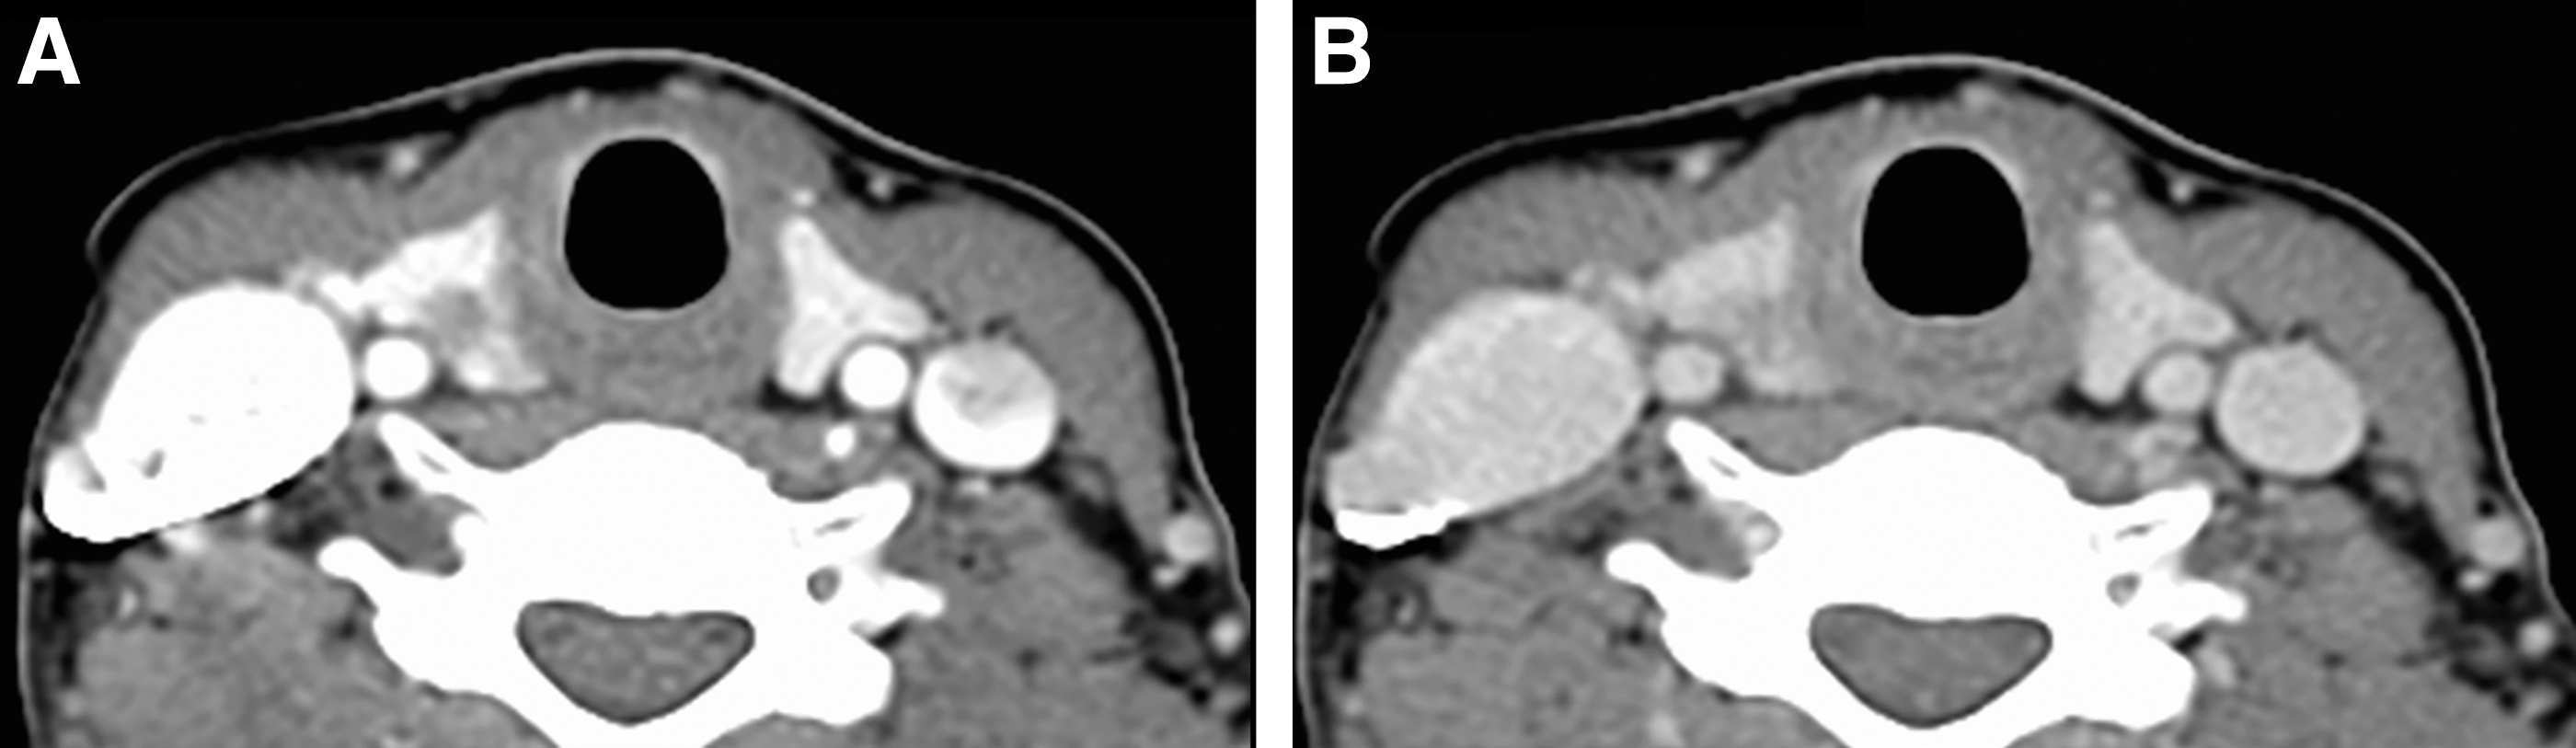
A 46-year-old woman with a right-sided PTC (size 6 mm). The right-sided cancer is more conspicuous in a contrast-enhanced axial CT image obtained with a 40-second scan delay (
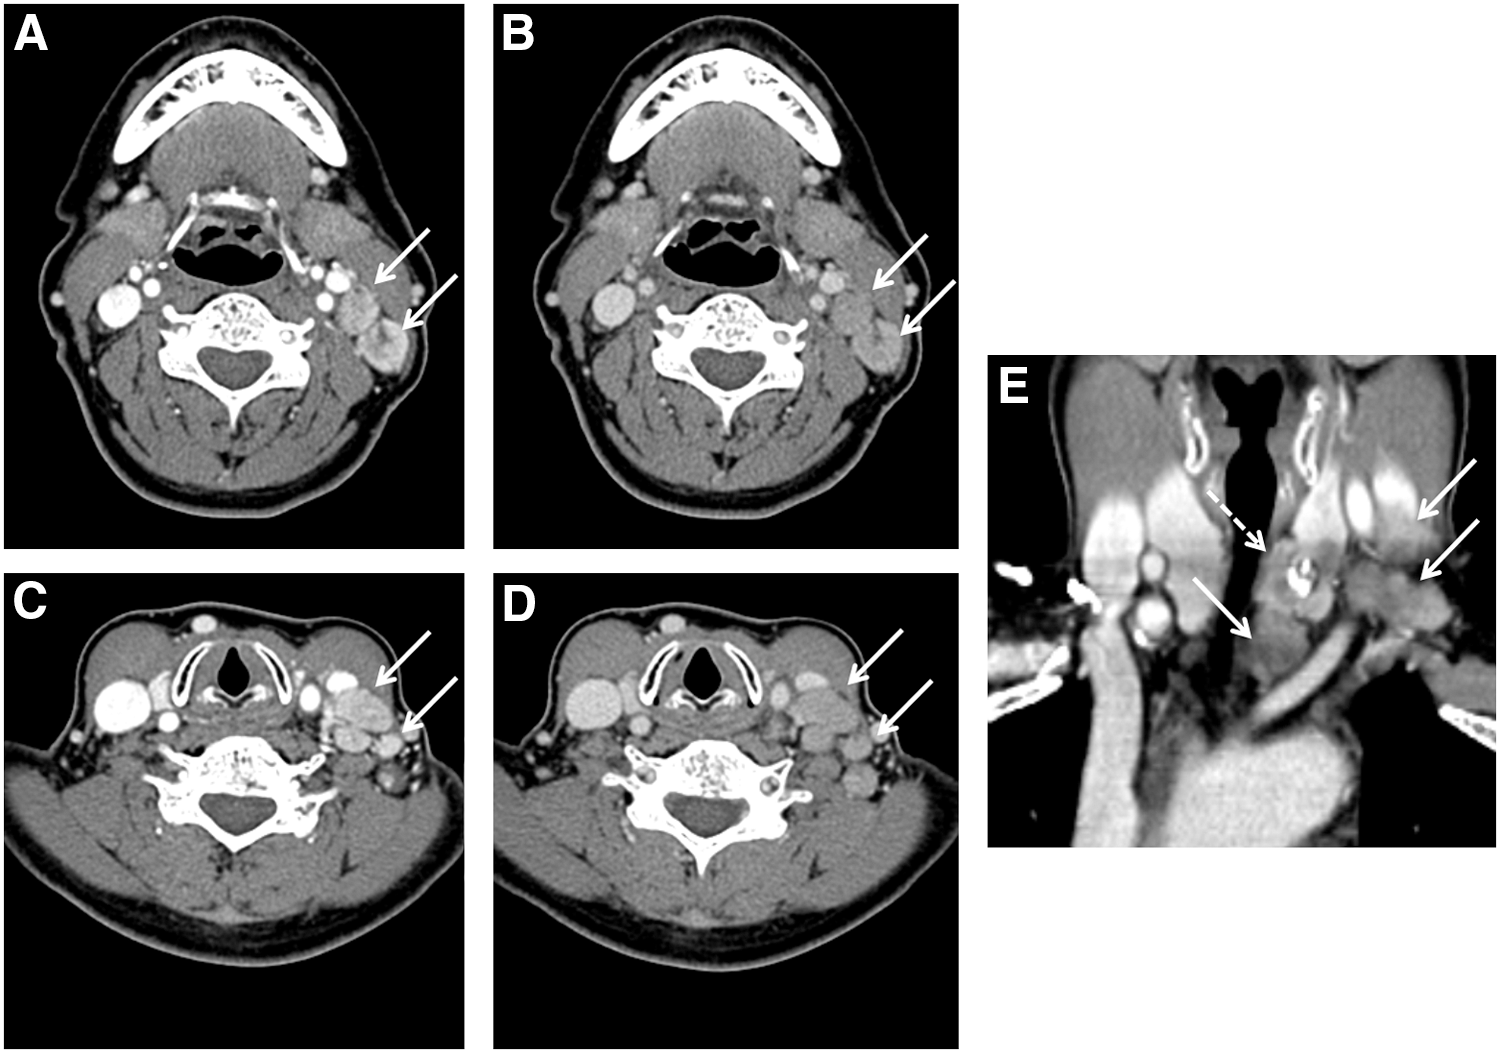
CECT images (window level, 60 HU; width, 300 HU) in a 64-year-old woman with a left-sided PTC with ipsilateral lymph node metastases. Pathologically confirmed metastatic lymph nodes (solid arrows) are more strongly enhanced in the CECT images with a 40-second scan delay compared with a 70-second scan delay at the level of the hyoid bone (
MAV, mean attenuation value; PCD, parenchyma–cancer difference; SD, standard deviation.
Interaction effect of Time by Group considering the effects of other factors such as CCM and Size in the repeated-measures general linear model
The aforementioned results of the paired t-tests did not consider the effects of other factors. Hence, there was a need to investigate the statistical significance of Group and Time after adjusting for the effects of other factors on the MAV. Among the variables, Sex, Age, and coexistence of diffuse thyroiditis showed no statistical significance in the model (p > 0.05). Finally, the main effects of Group, Time, CCM, and Size and the interaction between Group and Time were included in the repeated-measures general linear model.
As shown in Table 2, which shows the estimated MAVs in the fitted model, CCM, Group, Time, Size, and the Group × Time interaction were statistically significant. Therefore, the following estimated function was obtained:
CCM, concentration of iodinated contrast medium; Time, delayed scan time.
where I[X = a] indicates an indicator function defined by I = 1 if X = a, I = 0 if X ≠ a.
Therefore, the MAVs for the CECT images that were obtained after the infusion of 350 mgI/mL were higher than those after the 300 mgI/mL infusion, and the MAVs that were measured in the parenchyma were higher than those in the thyroid cancers. In addition, the MAVs that were measured with a scan delay of 40 seconds were higher than those that were measured with the delay of 70 seconds, but if the size of the thyroid cancer increased by one unit, the MAV decreased by 6.2 units. Regarding the Group × Time interaction effect, which implies that the relationship between Group and MAV cannot be interpreted without referring to Time, multiple comparison after the Bonferroni correction showed statistical significance, which led to a different slopes of MAVs of thyroid cancer and parenchyma along the scan delay documented in Table 1. Table 3 shows the mean MAVs in each group estimated from the repeated-measures general linear model.
The p-values were obtained by Bonferroni adjustments in multiple comparisons.
Discussion
Although US and US-guided FNA are widely accepted as primary imaging modalities for thyroid cancer, CECT examinations could help most thyroid surgeons to detect metastatic lymph nodes in the neck, mediastinum, or retropharyngeal space and extrathyroidal extensions of primary tumors owing to their detailed anatomic images from the skull base to the mediastinum, which are not disturbed by adjacent bone, air, calcification, or operator's inexperience (3,6). Recently, a number of published studies have noted the improved sensitivity of combined US/CECT in detecting metastatic cervical lymph nodes compared with US alone (1,9 –11). Moreover, extrathyroidal invasion adjacent to the soft tissue, although reported to occur in <5% of well-differentiated thyroid carcinomas, is highly associated with substantial morbidity and locoregional failure (22). In a study of 84 patients with advanced thyroid cancers (86 malignant tumors: 37 T3, 49 T4), Seo et al. also supported the superiority of CECT for evaluating the extrathyroidal invasion of thyroid cancer to adjacent structures (4). That study's reported mean sensitivity, specificity, and accuracy of CECT were as follows: 59.1%, 91.4%, and 83.2% for tracheal invasion; 28.6%, 96.2%, and 90.7% for esophageal invasion; 75.0%, 99.4%, and 98.8% for invasion of the common carotid artery; 33.3%, 98.8%, and 97.1% for invasion of the internal jugular vein; and 78.2%, 89.8%, and 85.5% for invasion of the recurrent laryngeal nerve. Therefore, CECT has been recognized as a useful modality for determining extrathyroidal extension with other adjunctive modalities including MR imaging and endoscopy (5,6).
Similar to the situation in patients with squamous-cell carcinomas of the head and neck, intravenous infusion of iodinated CM is generally recommended for CT examination of patients with thyroid cancers, unless there is a contraindication such as an allergy or concern for contrast nephropathy (6). For the relevant detection of extrathyroidal extension of a primary tumor, necrosis, or cystic change within metastatic lymph nodes, a more sophisticated CM enhancement protocol to accommodate the narrower temporal window secondary to faster scanning should be established (23). Among the various factors affecting the magnitude and timing of intravenous CM enhancement, CT scanning factors critically influence the degree of contrast enhancement at a specific time point (12). Inadequately selected CT scanning parameters will result in a poor-quality image contrast, even with perfectly determined patient and CM factors for contrast enhancement. These scanning parameters include scan duration, scan direction, and scan delay from the start (or completion) of CM injection to the initiation of the scan (23). Therefore, the major parameters of the CECT protocol for head and neck cancer using the MDCT scanners with 16 or more rows are as follows: 40–80 sec for scan delay, 75–140 mL for total amount of CM, and 2.5–3.0 mL/sec for flow rate (24 –26). However, to the authors' knowledge, thyroid cancer has not been assessed regarding better tumor conspicuity since the introduction of higher-row MDCT scanners. Therefore, various CT protocols were used in previous studies that investigated thyroid cancers. The major CT scanning parameters of these studies were as follows: 120 kVp, 140–300 mAs; detector rows, 16–128; collimation, 0.625–1.2 mm; scan delay, 35–60 sec; flow rate, 2.0–3.0 mL/sec; total amount of CM, 65–130 mL; iodine concentration, 300–370 mgI/mL (1,4,9 –11,13 –15). For the imaging of parathyroid adenomas, several researchers have compared the individual temporal enhancement pattern of parathyroid adenomas to find an optimal scan delay using a higher row MDCT scanner after discriminating their individual scan delays into different phases: 25–30 sec for the arterial phase and 55–90 sec for the venous or late phases (27 –30).
Based on the hypothesis that scan delay would be the main determinant of tumor conspicuity for thyroid cancer, two different scan delays were compared—40 seconds for early scans and 70 seconds for delayed scans, similar to the multiphasic CECT protocol used for parathyroid adenomas (27 –30). With the biphasic scanning that began 40 and 70 seconds after the start of the CM infusion, it was observed that the MAVs of the thyroid parenchyma were significantly greater than those of the thyroid cancers on both scan delays and showed a relatively steeper decline on the delayed scan compared with those of thyroid cancers. Accordingly, tumor conspicuity, expressed as PCD in the current study, decreased on the CECT images with a 70-second scan delay compared with a 40-second delay. This could be explained by the relatively rapid wash-in and wash-out in thyroid parenchyma. The intense enhancement of thyroid parenchyma that was demonstrated in the early scan was in agreement with the characteristic enhancement profile of thyroid parenchyma that has been mentioned in previous multiphasic CECT studies that investigated parathyroid adenomas (27,30). In the study by Vu et al., peak enhancement of thyroid parenchyma was achieved during the arterial phase (25 sec) with a mean attenuation of 196 ± 35 HU, and a gradual decrease in CT attenuation was observed during the venous (55 sec) and delayed (85 sec) phases, with mean attenuations of 155.15 ± 25.44 and 138.70 ± 25.45 HU, respectively (30). In addition, the mean CT attenuations for thyroid parenchyma were reported as 184 ± 39 HU for the arterial phase (25 sec) and 139 ± 22 HU for the delayed phase (80 sec) in a recent study by Bahl et al. (27).
Typically, both thyroid lobes receive arterial blood supply from the superior and inferior thyroid arteries and occasionally the thyroid ima artery, which originate from the external carotid artery, thyrocervical trunk, and aortic arch, respectively, with a prominent collateral network within the thyroidal capsule (31). Three pairs of veins provide venous drainage of the thyroid gland (the superior, middle, and inferior veins) by flowing into the internal jugular or brachiocephalic veins (31). Thus, it is assumed that the cause of this “rapid wash-in and wash-out” pattern of thyroid parenchyma was the relatively close location to the supplying arteries and draining veins to the major neck vessels, in contrast to other head and neck tissues. Additionally, the inherently high-iodine content of thyroid parenchyma could have accentuated the increase in CT attenuation on the early CM-enhanced images (16), although we did not measure the parenchymal CT attenuation on unenhanced images. Consistent with this hypothesis, the present data provide strong support for early scan delays (e.g., 40 sec) for better soft-tissue contrast between thyroid cancer and background on CM-enhanced MDCT with higher-row CT detectors.
Some limitations of this study should be mentioned. First, because only patients whose thyroid cancers had been visualized on both US and MDCT examinations were selected, very small thyroid cancers (i.e., <5 mm in diameter), which tend to be poorly noticed in MDCT images, were excluded from the analysis. However, it is believed that this limitation did not significantly alter the results because preoperative CECT is not usually indicated in patients with small carcinomas. Second, the CT scanning protocols were composed of only two phases, with 40- and 70-second scan delays, and thus a time-enhancement curve that would reflect the overall enhancement features of the thyroid gland could not be obtained. Moreover, pre-enhanced CT scanning within our MDCT scanning protocol was not included, so that the degrees of the actual enhancement of the thyroid gland could not be assessed. Third, a fixed volume (80 mL) of CM was administered at a constant flow rate of 2.5 mL/sec, regardless of the patients' body mass index. Ideally, a total volume of CM should be customized to the individual patient depending on total body weight, cardiac output, and circulation time. Thus, the relationships of CT enhancement of the thyroid gland to these patient-related factors could not be assessed. Fourth, it is acknowledged that the point of CECT examination in thyroid cancer would be to look for extrathyroidal invasion or nodal metastasis rather than simply to depict tumors. Although the improved lesion conspicuity of thyroid cancer and metastatic lymph node is demonstrated by the quantitative measurement and images, this study does not formally prove a diagnostic benefit of our CT protocol for thyroid cancer, extrathyroidal invasion, or metastatic lymph nodes that may be missed by sonography. Thus, additional studies are needed to analyze those features using the same CT protocol.
In summary, this study demonstrates that the tumor conspicuity of thyroid cancer using higher-row MDCT examinations is mainly determined by thyroid parenchymal enhancement, which was maximized by early scanning, 40 seconds from the start of the CM infusion. Thus, to improve the distinction of thyroid cancers from the parenchymal background, beginning CT scanning earlier is proposed.
Footnotes
Author Disclosure Statement
None of authors has any conflict of interest.