
Abstract
Background:
Overt hypothyroidism (OH) is associated with abnormal lipid metabolism and endothelial dysfunction under fasting conditions. The balance of evidence suggests similar but less marked abnormalities in subclinical hypothyroidism (SCH). There are few data regarding the metabolic and vascular effects of OH or SCH under postprandial conditions.
Methods:
This was a cross-sectional study, carried out in a teaching hospital. Subjects with OH (n = 21), SCH (n = 28), and controls (n = 44) matched for age, sex, and body mass index (BMI) were studied under fasting and postprandial conditions. Postprandial lipid metabolism with particular emphasis on intestinally derived lipoproteins, HDL cholesterol (HDL), and endothelial function were compared in subjects with OH and SCH who were matched for age, sex, and BMI. Apolipoprotein B48 (Apo B48), a measure of intestinally derived lipoprotein, was measured by enzyme-linked immunosorbent assay. HDL was subfractionated into HDL2 and HDL3 by rapid ultracentrifugation. Functional aspects of HDL were determined by monitoring the activities of cholesteryl-ester-transfer-protein (CETP) and lecithin-cholesterol-acyl-transferase (LCAT). Systemic and HDL-associated inflammation was assessed by measuring serum-amyloid-A (SAA) levels. Endothelial function was assessed by flow-mediated dilatation (FMD) of the brachial artery in response to hyperemia of the forearm.
Results:
There were no significant between-group differences in LDL cholesterol or triglyceride concentration. Peak Apo B48 levels were greater in OH (p < 0.001) and SCH (p < 0.05) compared with control subjects. HDL area under the curve (AUC) was lower postprandially in SCH (p < 0.001) but not OH compared with control subjects. HDL2- and HDL3-associated CETP AUC was lower only in OH (p < 0.005) compared with controls. FMD was reduced in OH (p < 0.05) compared with SCH and controls postprandially.
Conclusion:
Postprandial lipoprotein and vascular abnormalities differ between OH and SCH. Although both are characterized by increased intestinally derived lipoprotein particles, HDL is reduced only in SCH. Maintained HDL in OH probably reflects reduced CETP activity, which was not observed in SCH. Postprandial endothelial dysfunction is abnormal only in OH, and this effect does not appear to reflect increased inflammation.
Introduction
E
The effects of hypothyroidism on HDL cholesterol (HDL) are less clear. Levels have been reported to be normal or slightly increased in OH (6), and normal or reduced in SCH (7 –9). Consistent with the latter, studies in euthyroid subjects have demonstrated associations between higher thyroid hormone levels and higher HDL concentrations. Mechanisms through which thyroid hormone could influence HDL include increased cholesteryl-ester-transport-protein (CETP); transferring cholesterol from HDL to LDL and very low-density lipoprotein [VLDL] particles (10), increased hepatic lipase (influencing HDL subfractions), and increased cholesterol efflux from macrophages to HDL via the ABCA1 transporter (11).
For a number of reasons, studies in the postprandial phase enhance understanding of these processes and their clinical importance. First, postprandial lipoprotein abnormalities are considered to be independently predictive of atherogenesis, in the case of triglycerides more markedly than fasting levels (12,13). Second, meal ingestion can act as a challenge to accentuate abnormalities that are difficult to detect under fasting conditions. To date, very few postprandial studies have been carried out in OH or SCH. One study using the retinyl palmitate technique demonstrated an increase in intestinally derived lipoprotein particles following L-thyroxine replacement in OH (14). Another demonstrated a greater frequency of postprandial hypertriglyceridemia levels in OH with also a possible effect in SCH (15). In view of the prevalence of SCH (4–10% of the adult population) (16) and the observations that cardiovascular risk is increased in these patients, studies of postprandial lipoprotein metabolism in SCH are justified. Furthermore, studying triglyceride and HDL metabolism under postprandial conditions would provide further insights into how lipoprotein physiology is altered in hypothyroidism.
Detailed postprandial studies were carried out in subjects with OH and SCH and in matched controls. Measurement of Apo B48 was used to determine the proportion of intestinally derived lipoprotein particles in circulation. HDL was subfractionated into HDL2 and HDL3 and their isolates were assessed for a variety of lipid and protein components, including CETP. Endothelial dysfunction was determined using flow-mediated dilatation (FMD) of the brachial artery (17,18).
Methods
Experimental subjects
Ninety-three subjects were recruited. Subjects with OH (n = 21) and SCH (n = 28) were recruited from general practitioner referrals to the endocrine laboratory or endocrinology outpatient clinic. Control subjects (n = 44) were recruited by local advertisement. OH was defined as a thyrotropin (TSH) concentration of ≥10 mIU/L and free thyroxine (fT4) concentration of ≤11 pmol/L. SCH was defined as a TSH concentration of ≥4 and ≤10 mIU/L and normal circulating fT4 concentration.
Exclusion criteria included a prior history of ischemic heart disease, stroke, diabetes, head injury, epilepsy, psychiatric illness, significant visual impairment, or pregnancy. Subjects were excluded if they had a body mass index (BMI) of <18 or >35 kg/m2. Subjects were also excluded if they were taking medication that was likely to influence the results, including statin therapy, antihypertensive or anti-inflammatory medication, aspirin, hormone replacement therapy or combined oral contraceptives. All participants gave written informed consent before participating in the study, which was approved by the Research Ethics Committee of the Adelaide and Meath Hospital and St. James's Hospital (Dublin, Ireland).
Study design
This was a cross-sectional study. All subjects attended the Diabetes Day Centre in the Adelaide and Meath Hospital, Tallaght, Dublin, following a 12 hour fast and having avoided excessive exercise and alcohol for the previous 24 hours. A mixed meal consisting of three slices of toasted white bread, three 7-g packs of standard butter, a standard commercially available blueberry muffin, and a 330-mL carton of flavored milk was consumed within 15 minutes. The nutritional content of this meal was 940 kcal consisting of 27 g of protein and 140 g of carbohydrate (40 g of sugar and 36 g of fat).
Fasting blood samples were taken for analysis of plasma lipids, including Apo B48 and HDL subfractions, and FMD of the forearm was measured. Postprandial samples were taken at 15, 30, 60, 90, 120, 240, 360, and 480 minutes following the mixed meal. FMD was measured in the postprandial setting at 240 minutes (T240). All subjects were included in the final analysis, resulting in 49 cases and 44 controls, matched for age, sex, BMI, and waist–hip ratio (WHR).
Measurement of body composition
All subjects underwent estimation of body composition using auxiological methods and bioimpedance analysis. Height (measured with a Harpenden stadiometer) and weight were measured in a hospital gown. Waist (WC) and hip (HC) circumferences were measured with a non-distensible flexible tape measure at the waist and hip. A health and lifestyle questionnaire was completed by each participant, including details on smoking history and alcohol consumption, which could potentially influence markers of inflammation. Percentage body fat was estimated using a body fat analyzer (TBF-300; Tanita Corp.). Percent fat was calculated using the manufacturer's programmed equations. All measurements were made by the same observer on all study days.
Laboratory methods
TC, triglycerides, and HDL were measured by an enzymatic colorimetric method (Cobas Roche Diagnostics Ltd.) on the Roche P Module (Roche). Glucose was measured by an enzymatic method on the Roche P Module. Insulin was measured by electrochemiluminesence immunoassay (Cobas Roche Diagnostics Ltd.) on the Roche E Module (Roche). LDL-C was calculated using the Friedwald equation.
Measurement of hormones
TSH and fT4 were measured by standard chemiluminesence immunoassays (Cobas Roche Diagnostics Ltd.) on the Immulite 2500 analyzer (Siemens). In the authors' laboratory, the reference ranges are 0.4–4.0 mIU/L and 9–22 pmol/L, respectively.
Measurement of markers of inflammation and cytokines
Total and differential white-cell counts were measured by laser flow cytometry. High sensitivity C reactive protein (hsCRP) was measured by an enzyme-linked immunosorbent assay (ELISA) using a commercially available kit according to the manufacturer's instructions (BioCheck, Inc.).
Measurement of Apo B48
Apo B48 was measured by ELISA using a commercially available kit (Gentaur).
Isolation and subfractionation of HDL2 and HDL3 from serum
HDL2 and HDL3 were isolated from serum by rapid ultracentrifugation according to a method previously established (19). This method is a three-step, six-hour long procedure; crude (c)HDL was isolated by a two-hour rapid sedimentation method. This cHDL was then subfractionated into HDL2 and HDL3, by two 2-hour sequential rapid flotation ultracentrifugation procedures.
Apolipoprotein A1 determination
Apolipoprotein A1 (Apo A1) concentration in the HDL subfractions was determined using single radial immunodiffusion (19).
Serum-amyloid-A concentration
Serum-amyloid-A (SAA) in serum and associated with HDL2 and HDL3 was analyzed by an ELISA assay (Invitrogen; KHA0011), as per the manufacturer's instructions. Analysis was performed using a Grifols TRITURUS system.
CETP and lecithin-cholesterol-acyl-transferase activity
The activities of CETP and lecithin-cholesterol-acyl-transferase (LCAT) were measured in serum and in HDL2 and HDL3 using commercially available fluorometric assays, as per manufacturer's instructions (CETP catalogue no. RB-CETP; LCAT catalogue no. RB-LCAT; Roar Biomedical).
Total protein determination
Protein concentration within HDL2 and HDL3 was determined by a spectrophotometric assay (19). Total protein concentration was utilized to standardize SAA, CETP, and LCAT within HDL2 and HDL3.
FMD
FMD of the brachial artery was completed at two time points during the study: fasting and at 240 minutes postprandially. FMD was carried out on each subject's right arm, with measurements of the brachial artery diameter and flow parameters taken at rest, and at 30, 60, 90, and 120 seconds after the performance of a hyperemic maneuver. A sphygmomanometer cuff was inflated to at least 20 mmHg greater than systolic pressure on the upper arm for five minutes before release, with images taken at the time points mentioned above. Calculation of percentage change of the arterial diameter was calculated based on resting diameter compared to the maximal increase seen over these time points.
Statistical analysis
Statistical analysis was performed using PASW Statistics for windows v18.0 (SPSS, Inc.). Data are presented as the mean ± standard deviation (SD). Skewed variables were logarithmically transformed to normalize data prior to analysis. Absolute p-values are displayed to allow the reader to interpret results of borderline significance. Analysis of variance (ANOVA) was the primary statistical tool used. Mixed between- and within-subject ANOVAs were used to compare measurements across different time points between the three groups. Where significant main effects were observed (p < 0.05), subsequent one-way ANOVAs compared the dependent variable (measurement) between the groups. Where significant between-group differences were observed, post hoc analyses were performed to explore the differences further. A Bonferroni adjustment was applied to these comparisons to maintain a reasonable α-level across all tests. The relationship between TSH and fT4 concentrations and all dependent variables were evaluated using Pearson's correlation coefficient.
Results
Baseline characteristics
OH, SCH, and control subjects were closely matched for age, sex, BMI, WHR, and percent body fat (Table 1). Median TSH concentrations for OH, SCH, and controls were 53.7 mIU/L, 5.5 mIU/L, and 1.9 mIU/L, respectively (Table 2). There were no significant between-group differences in homeostatic model assessment–insulin resistance, hemoglobin A1c, insulin area under the curve (AUC), or glucose AUC (Table 2).
Data expressed as mean ± SD. p-Value derived from mixed between- and within-subject ANOVAs.
ANOVA, analysis of variance; BMI, body mass index; NS, non-significant; OH, overt hypothyroidism; SCH, subclinical hypothyroidism; SD, standard deviation; WHR, waist–hip ratio.
Data expressed as mean ± SD or median for skewed data. p-Value derived from mixed between- and within-subject ANOVAs.
AUC, area under the curve; fT4, free thyroxine; HOMA-IR, homeostatic model assessment—insulin resistance; LDL-C, LDL cholesterol; TSH, thyrotropin.
LDL-C, HDL, and triglycerides
There was no significant effect of group or time for LDL-C or triglyceride concentration (Table 2). There was a significant effect of time for HDL concentration, with all groups showing a significant decrease postprandially (p < 0.001; Fig. 1). There was also a significant between-group effect for HDL concentration (p < 0.01). Post hoc analysis revealed significant differences between SCH subjects and controls for both peak (p < 0.05) and AUC HDL (p = 0.001) concentrations. Differences between SCH and OH approached significance (p = 0.07) in post hoc analysis.
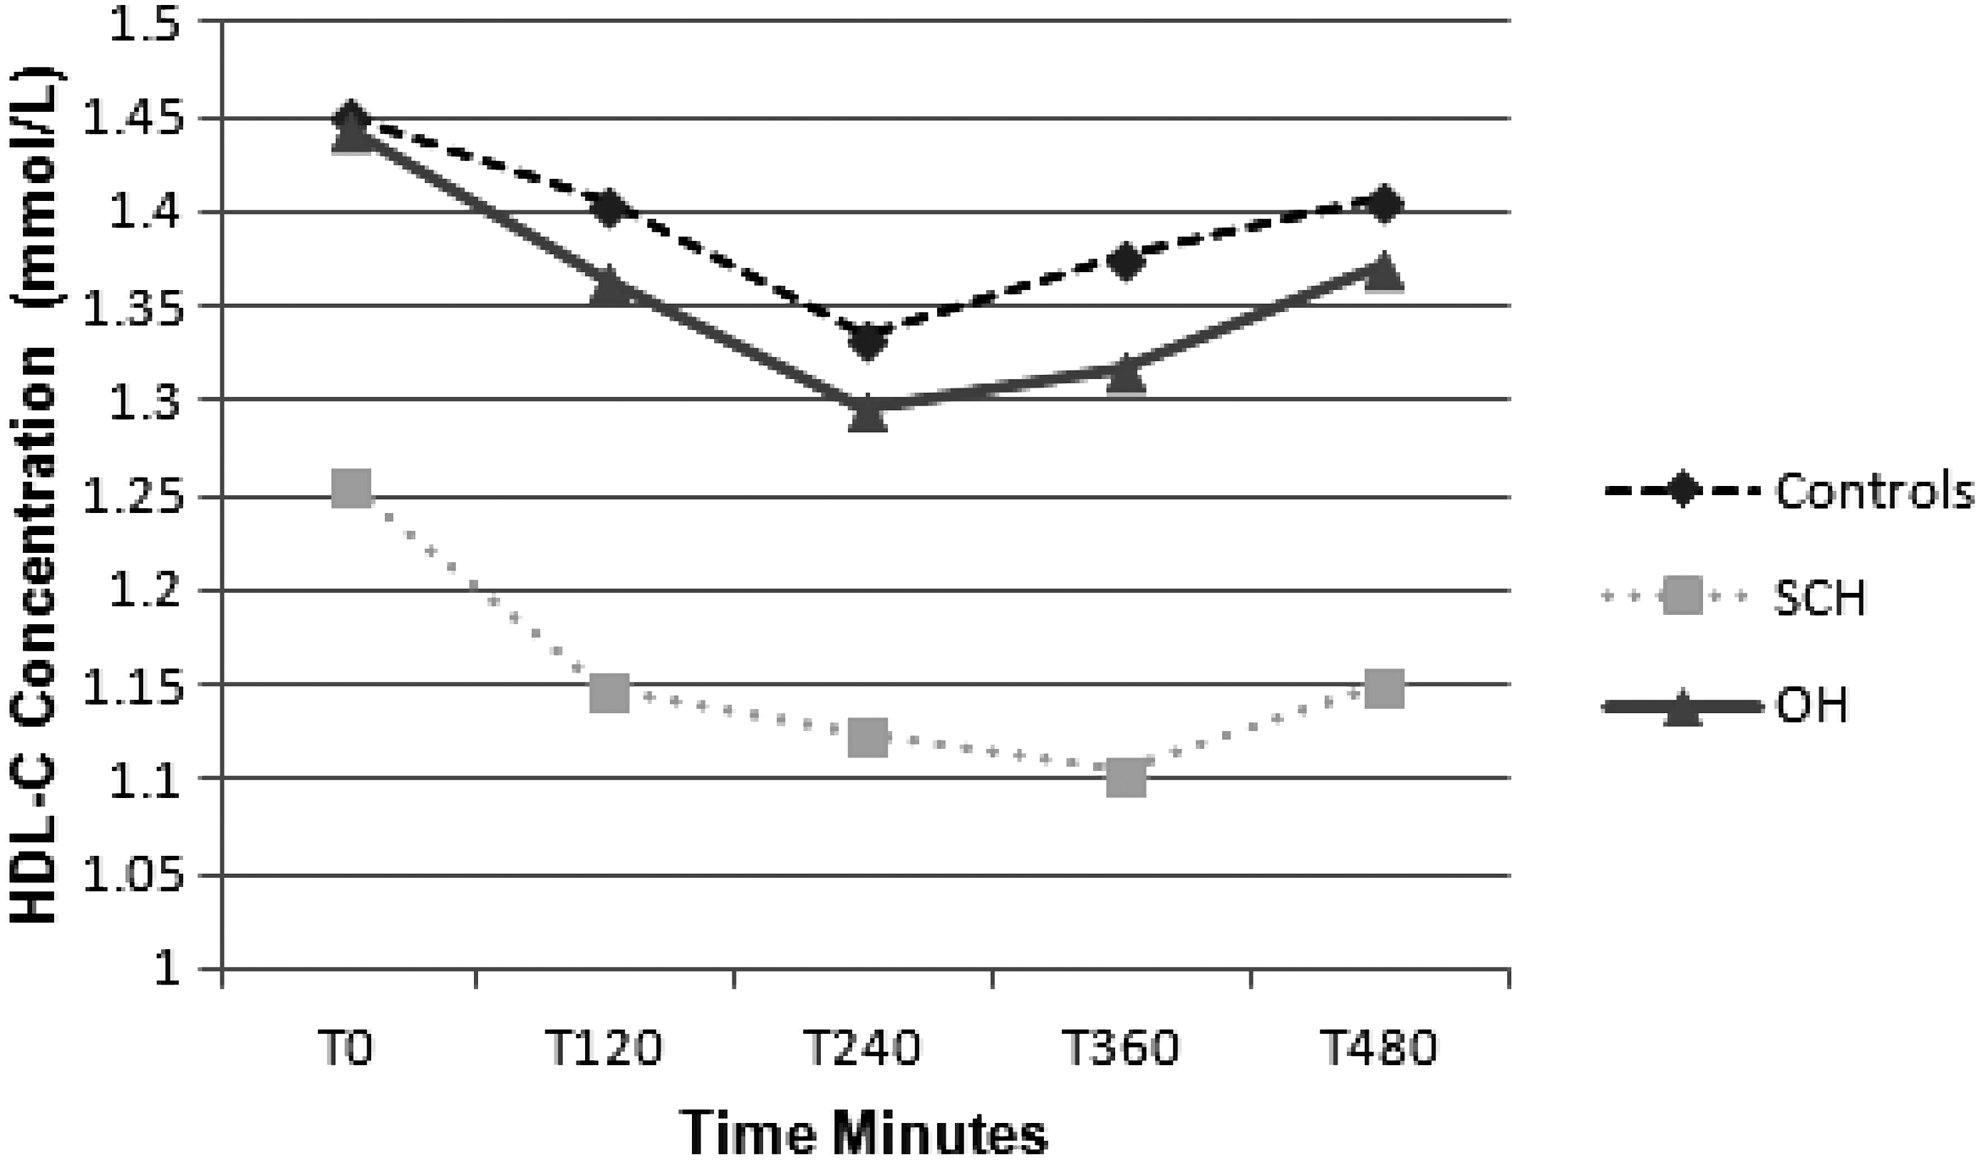
Mean HDL cholesterol (HDL-C) concentration fasting and T120, T240, T360, and T480 postprandially in control (n = 44), subclinical hypothyroid (SCH; n = 28), and overt hypothyroid (OH; n = 21) subjects. Post hoc analysis revealed significant differences between SCH and control subjects for both peak (p < 0.05) and area under the curve (AUC) HDL-C (p = 0.001) concentrations.
Apo B48 concentration
There was a significant effect of time for Apo B48 concentration, with all groups showing a significant increase postprandially (p < 0.001; Fig. 2). There was also a significant between-group effect for Apo B48 concentration (p < 0.001). Post hoc analysis revealed significant differences between OH subjects and controls for fasting (p < 0.005), peak (p = 0.001), and AUC Apo B48 (p < 0.001) concentrations. Post hoc analyses also demonstrated a significant difference between SCH subjects and controls for peak (p < 0.05) Apo B48 concentration.

Mean Apolipoprotein B48 (Apo B48) concentrations fasting and T120, T240, T360, and T480 postprandially in control, SCH, and OH subjects. Post hoc analysis revealed significant differences between OH and control subjects for fasting (p < 0.005), peak (p = 0.001), and AUC Apo B48 (p < 0.001) concentrations. Post hoc analysis also demonstrated a significant difference between SCH and control subjects for peak (p < 0.05) Apo B48 concentration.
HDL2 analyses
HDL2 total protein concentration
There was no significant effect of time for HDL2 total protein concentration, but it did approach significance (p = 0.07). Although there was no significant between-group effect, AUC HDL2 total protein concentration approached significance (p = 0.056) between groups.
Markers of HDL2 function
There was no significant effect of time for HDL2-associated CETP activity. There was a significant between-group effect for HDL2-associated CETP activity (p < 0.0001). Post hoc analysis revealed significant differences between OH and controls for fasting (p < 0.01), peak (p < 0.005), and AUC HDL2-associated CETP activity (p < 0.005; results not shown). There was a significant effect of time for CETP/Apo A1 per HDL2 concentration (p < 0.01), but no significant between-group effect. There were no significant differences in LCAT activity (results not shown).
HDL3 analyses
HDL3 total protein concentration
There was a significant effect of time for HDL3 total protein concentration (p < 0.05), with both OH and SCH groups demonstrating a significant increase postprandially (Fig. 3). There was also a significant between-group effect for HDL3 total protein concentration (p < 0.05). Post hoc analysis revealed significantly lower concentrations between SCH subjects and controls for fasting HDL3 total protein concentration (p < 0.005) and differences that approached significance for peak (p = 0.052) and AUC HDL3 total protein (p = 0.06) concentration.
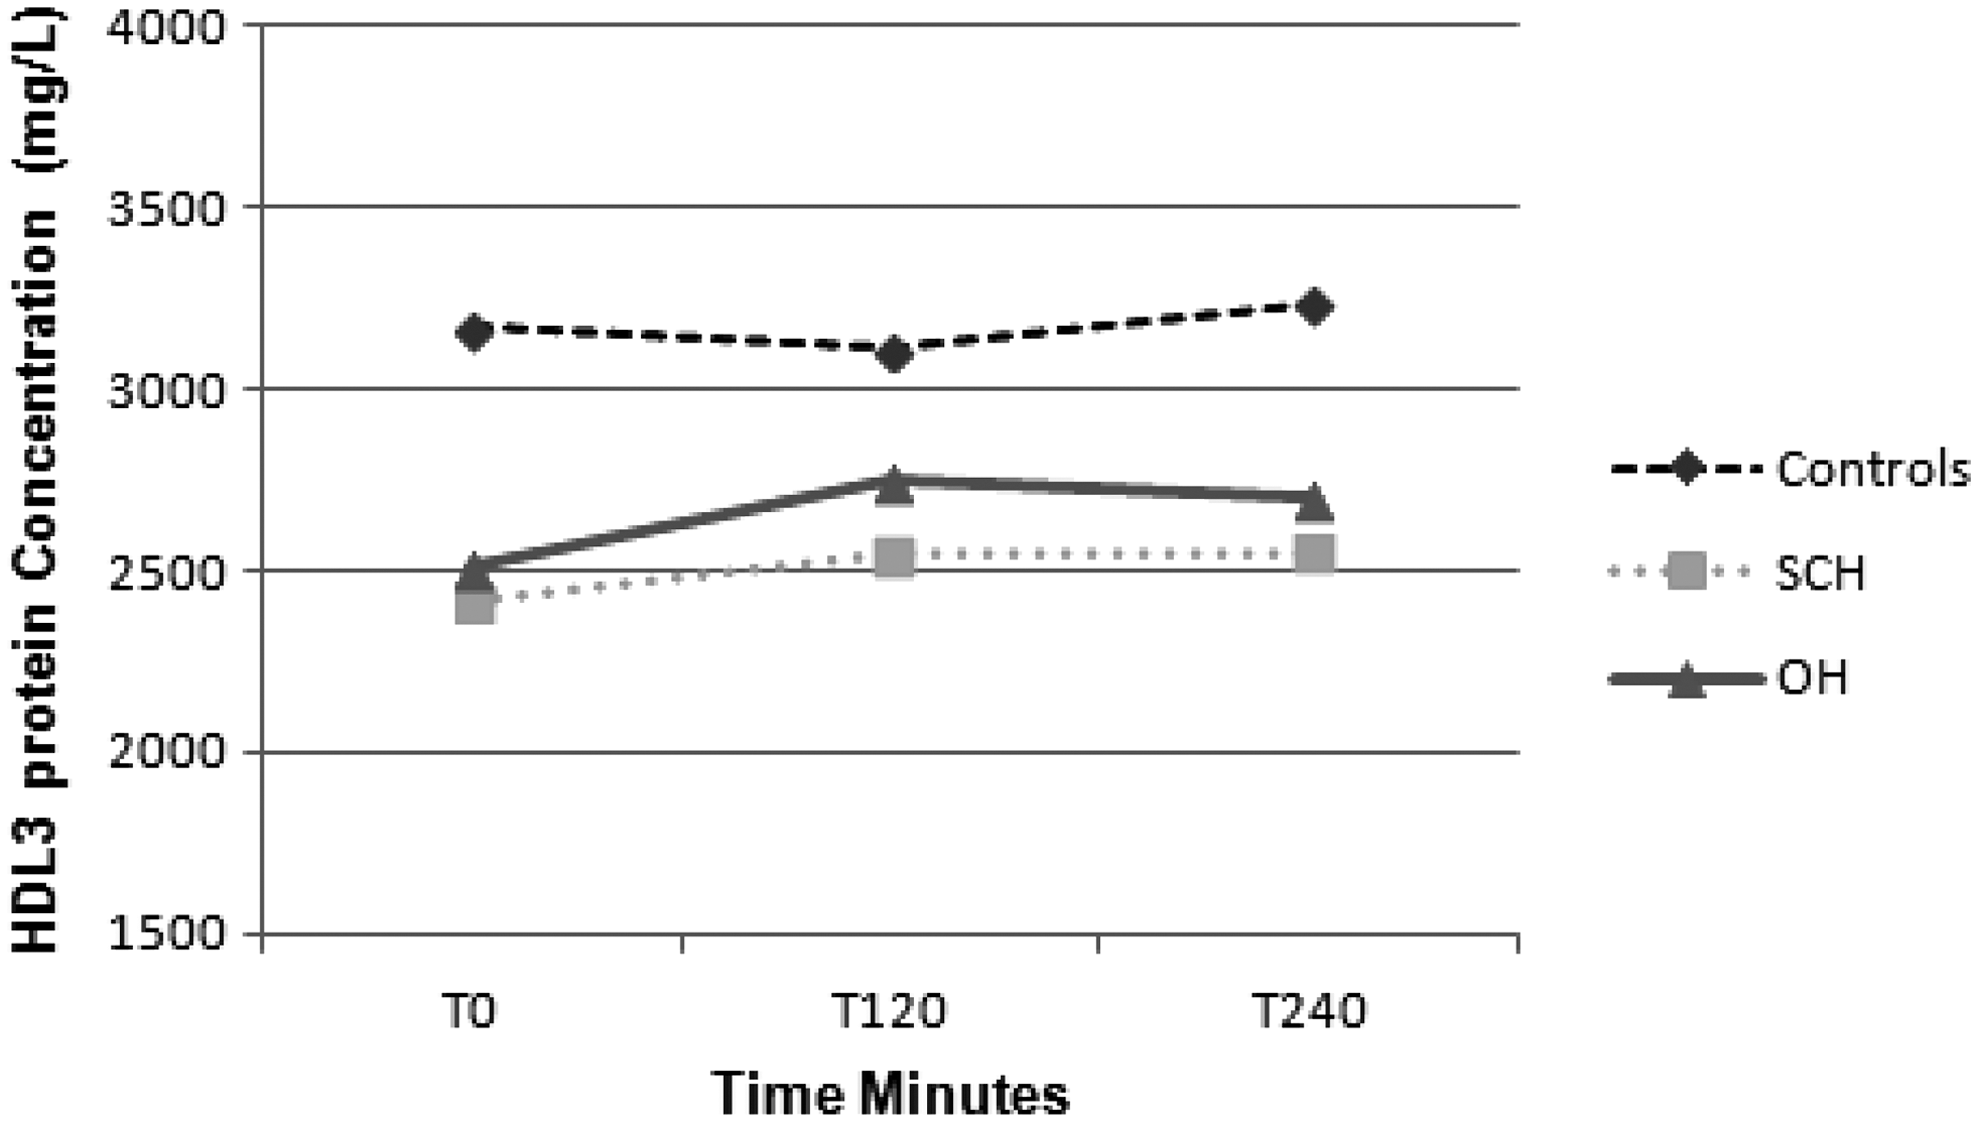
Mean HDL3 total protein concentrations fasting and T120, T240, T360, and T480 postprandially in control, SCH, and OH subjects. Post hoc analysis revealed significant differences between SCH and control subjects for fasting HDL3 total protein concentration (p < 0.005) and differences that approached significance for peak (p = 0.052) and AUC HDL3 total protein (p = 0.06) concentrations.
Markers of HDL3 function
There was a significant effect of time for HDL3-associated CETP activity, with all groups showing an overall significant increase postprandially (p < 0.001; Fig. 4). There was also a significant between-group effect for HDL3-associated CETP activity (p < 0.05). Post hoc analyses revealed significant differences between OH subjects and controls for fasting (p < 0.05), peak (p < 0.05), and AUC HDL3-associated CETP activity (p < 0.001). There was a significant effect of time for CETP/Apo A1 per HDL3 concentration (p < 0.01), but no significant between-group effect (results not shown). There were no significant differences in LCAT (results not shown).
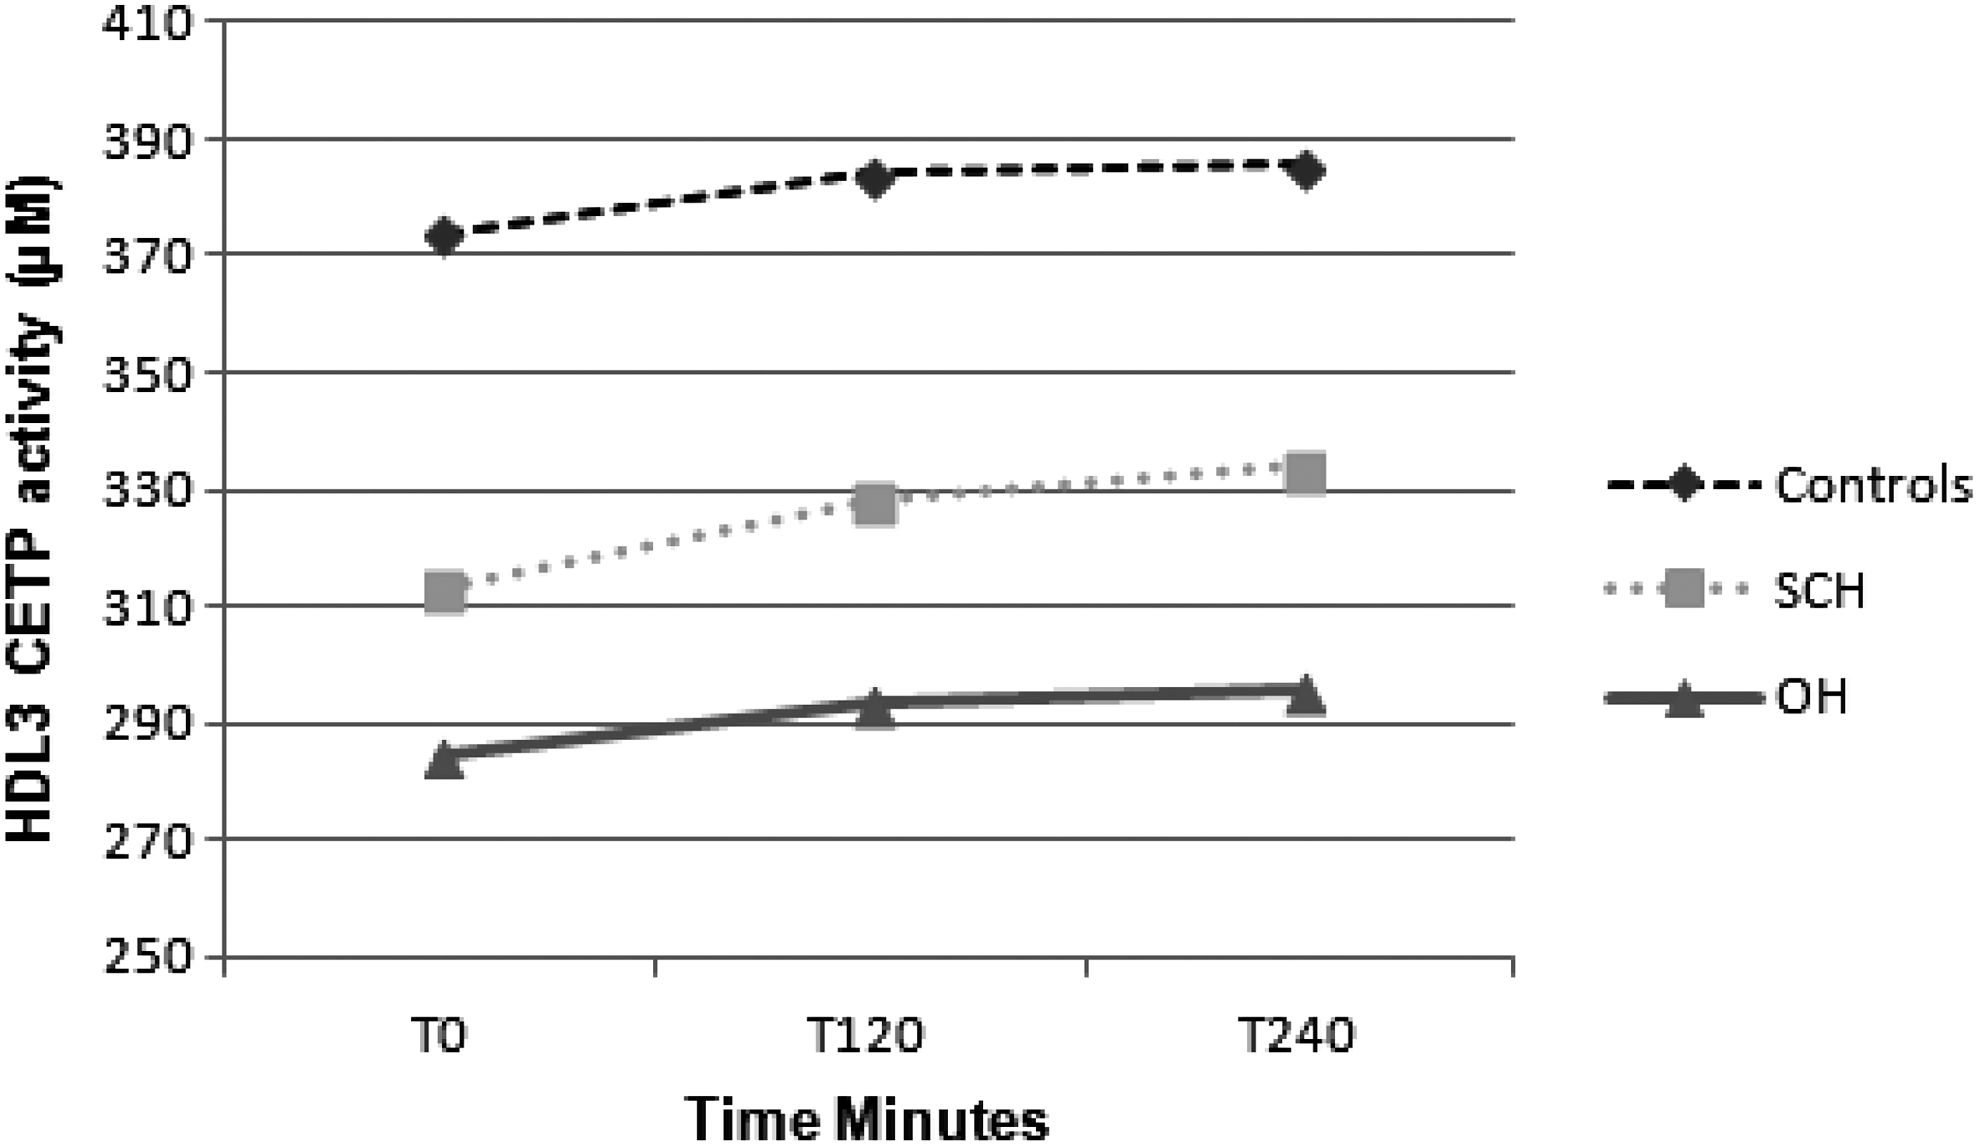
Mean HDL3-associated cholesteryl-ester-transfer-protein (CETP) concentrations fasting and T120, T240, T360, and T480 postprandially in control, SCH, and OH subjects. Post hoc analysis revealed significant differences between OH and control subjects for fasting (p < 0.05), peak (p < 0.05), and AUC HDL3-associated CETP activity (p < 0.001).
Inflammation and endothelial function
There was no significant time or group effects for white cell count, neutrophil count, hsCRP, SAA, or systolic or diastolic blood pressure (results not shown).
There was no significant effect of time or between-group effects for fasting brachial artery diameter or %FMD. The %FMD change is an indication of endothelial function. There was a significant effect of time for postprandial %FMD change (p < 0.05). There was a significant between-group effect for postprandial %FMD change (p < 0.05). Post hoc analysis revealed significant changes between OH subjects compared with controls (p < 0.05; Table 3).
Data expressed as mean ± SD. p-Value derived from mixed between- and within-subject ANOVAs, where significant main effects were observed (p < 0.05).
Significant between OH versus control subjects.
FMD, flow-mediated dilatation of the brachial forearm.
Correlations
A positive correlation was observed between TSH and fasting and peak Apo B48 (p < 0.005 and p < 0.05, respectively) and AUC Apo B48 concentration (Table 4). A negative correlation existed between TSH and AUC CETP HDL2 and HDL3 and the %FMD change postprandially (Table 4). A negative correlation was observed between fT4 and AUC Apo B48 concentration and a positive one between it and AUC CETP HDL2 and HDL3 (Table 4). A number of additional correlations existed, including AUC Apo B48 negatively correlating with AUC CETP HDL3 and %FMD change postprandially (Table 4) and also a positive correlation between with AUC CETP HDL2 and %FMD change postprandially (Table 4).
R-values for Pearson's product moment correlation coefficient * p < 0.05 or ** p < 0.005 for all correlations.
Apo B48, Apolipoprotein B48; CETP, cholesteryl-ester-transfer-protein.
Discussion
This is the most detailed study yet reported of the postprandial phase in OH and SCH, and the first to include postprandial effects on Apo B48, functional aspects of HDL, and endothelial dysfunction. The results demonstrate postprandial abnormalities in both OH and SCH that were not evident under fasting conditions, and suggest that the effects of SCH are not simply similar but rather less severe effects of OH.
Both OH and SCH were characterized by increased intestinally derived lipoprotein particles, demonstrated by increased levels of Apo B48, in the postprandial phase compared with control subjects. Although the median TSH concentration in the SCH group was 5.5 mIU/L, post hoc analysis demonstrated a significant difference between SCH and control subjects for peak (p < 0.05) Apo B48 concentration. Postprandially, the majority of circulating triglycerides exist in two forms: Apo B48–rich chylomicrons and apolipoprotein-B100 (Apo B100)–rich VLDL particles that are synthesized in the liver. Abnormalities in chylomicron synthesis and clearance are thought to play a role in the development of atherosclerosis (20). Chylomicron particles have been found in the atherosclerotic plaque and Apo B48 receptors found on the surface of the macrophage (21). A delayed chylomicron clearance response is seen in patients with coronary heart disease (22). The mechanism through which Apo B48 levels are increased in OH could be due in part to their increased secretion or decreased clearance and/or degradation. Animal studies have shown decreased clearance of chylomicron-rich lipoproteins in hypothyroid rats (23,24). In LDLR knockout mice, both Apo B100 and Apo B48 levels were reduced by administration of T3 (5). Fasting Apo B48 concentrations in subjects with OH and SCH improved post-treatment with L-thyroxine therapy, but this study did not measure Apo B48 concentrations in a control population, nor did it examine lipid parameters in the postprandial setting (25). A decrease in intestinally derived lipoprotein particles following L-thyroxine therapy in OH subjects was observed using retinyl palmitate as a means of extracting the chylomicron-rich lipoproteins (14). However, retinyl palmitate is not as accurate a measurement of postprandial intestinal lipoproteins properties as Apo B48 measurement by ELISA (26). Hepatic lipase facilitates the uptake and degradation of chylomicron remnants, and a number of studies have found that hepatic lipase is more responsive to changes in fT4 levels than lipoprotein lipase (27 –29). Total Apo B kinetics were studied in detail in six individuals with OH, and an increase in hepatic lipase activity on replacement of thyroid hormone was observed (30). Gut transit time increased in subjects with hypothyroidism when replaced with thyroid hormone (31). This may in part explain in this study the failure of Apo B48 levels to return to fasting levels fully at eight hours. Fasting Apo B48 levels have correlated positively to TSH levels in two previous studies (15,25). Supporting these studies, both fasting and postprandial Apo B48 levels positively correlated with TSH concentration and negatively with fT4 concentration in this study. Peak Apo B48 was significantly increased in SCH compared with controls, and both fasting, peak, and AUC Apo B48 was significantly increased in OH compared with controls in this study.
Plasma HDL levels in OH did not differ from control subjects either fasting or postprandially, However, although fasting HDL levels did not differ in SCH from control subjects, a highly significant difference emerged postprandially. Fasting HDL has been reported to be increased (32,33), similar (34), or decreased (35) in OH. A number of studies have reported a decrease in fasting HDL concentration in treated OH subjects, including a decrease in HDL by 20% in OH-treated subjects (30,32,33,36). Conversely, fasting HDL has been reported to be similar (37) or decreased (32) in hyperthyroidism. An inverse relationship exists between plasma HDL concentration and coronary artery disease (38). Observational data suggest that the incidence of coronary artery disease increased by 2–3% for every 1% decrease in HDL (39). However, the concept that increased HDL translates into cardiovascular disease reduction has been challenged by recent genetic studies, suggesting that mutations causing an increase in HDL do not confer a reduction in myocardial events (40).
When the subfractions of HDL were examined, it was found that HDL2- and HDL3-associated total protein differed subtly between groups. HDL3-associated protein was significantly lower in the fasting SCH group compared with controls only. In contrast, there was no significant difference in HDL2-associated protein between groups. The differences between HDL3- and HDL2-associated proteins are difficult to explain, given the lack of significant change in Apo A1 concentration. The smaller HDL3 particle incorporates Apo A1, while the larger HDL2 particle incorporates Apo A1 and Apo A2. A previous study documented increased fasting HDL2-associated protein and Apo A1 levels in OH compared with euthyroid controls, which reversed on thyroid hormone replacement (41), and although in this study the concentration of Apo A1 was increased in OH compared with SCH and control subjects, both fasting and postprandially was not significant. This differing total protein concentration in HDL3 between the SCH and control subjects may be related to changes in other HDL-associated proteins that were not measured in the current study, especially paraoxonase-1 (PON-1). PON-1 activity is reportedly decreased in thyroid disorders, perhaps partly explaining the reduced LDL oxidation observed in hypothyroidism (42). This reduction in PON-1, which was not measured in this study, may partly explain some of the increase in surrogate markers of vascular inflammation observed in the OH group but not in the SCH group.
In addition, this difference may possibly be due to the decreased CETP activity observed fasting and postprandially in the OH group. Decreased CETP activity has previously been reported in fasting subjects with OH (10,43). Further insights can be gained by considering HDL metabolism and its role in reverse cholesterol transport. Due to the action of ABCA1, the nascent HDL molecule removes cholesterol esters from foamy macrophages and matures to HDL3 due to the addition of Apo A1. LCAT facilitates further maturation to the HDL3 particle, to the larger HDL2 subfraction, conferring more protective properties. CETP facilitates the mass gradient transfer of cholesterol in exchange for triglycerides from HDL2 to the Apo B-containing lipoproteins, LDL and VLDL (44). The observed decreased CETP activity was more marked in HDL2, which may reflect decreased CETP activity in HDL2, as this is where it exerts most of its action. Additionally, this latter result also suggests that the mass of CETP was not different between the groups (due to a lack of change in total protein) but that its activity function was influenced by the presence of OH.
The relationship between HDL, CETP, and atherogenesis is complex. CETP activity has been described as both pro- and anti-atherogenic (45). Animal studies have reported a reduction in atherosclerosis by inhibiting CETP activity (46) and CETP gene transfer induced atherosclerosis in mice (47). Genetic CETP deficiency results in large HDL particles that are cholesterol saturated and thus poor cholesterol acceptors (48), and is not associated with significantly decreased rates of cardiovascular disease (49). Data from the Honolulu Heart Study suggests that CETP deficiency associated with HDL concentrations between 1.06 and 1.55 mmol/L was associated with risks of coronary artery disease similar to that in non-CETP-deficient subjects, and HDL levels of >1.6 mmol/L appear to confer anti-atherogenic effects (50). Further insight can be gained from CETP inhibitors. The first Phase III study (ILLUMINATE; NCT00134264) of a CETP inhibitor, Torcetrapib, commenced in 2004 and terminated in 2007 due to increased incidence of the primary cardiovascular disease endpoints in the treated group. A less potent CETP inhibitor, Dalcetrapib (Dal-OUTCOMES; NCT00658515), entered Phase III trials in 2008 and was discontinued in 2012 following interim analysis due to futility. A number of prospective observational cohort studies have demonstrated an inverse relationship between the incidence of cardiovascular disease and plasma CETP concentration (51 –56). Reduced CETP concentrations, as observed in the OH group in this study, are associated with larger HDL particles and concentration, but this does not reflect the functionality of HDL in reverse cholesterol transport.
There was no difference in the HDL-associated inflammatory marker SAA, either in serum or associated with HDL2 and HDL3 between groups, perhaps indicating that although HDL is preserved in OH, it is not conferring a reduction in systemic inflammation. There were no significant time or group effects for white cell count, neutrophil count, hsCRP, or systolic or diastolic blood pressure. However, a correlation was observed between TSH and the percentage change in FMD postprandially, and the absolute postprandial change decreased significantly in the OH group compared with both controls and SCH. Whether the reduction noted in both peak and AUC HDL observed in SCH compared with controls results in a functional deficit in HDL remodeling is not known, and its clinical relevance remains to be determined.
FMD is a validated tool used to measure endothelial function and is independent predictor of future cardiac events (57). In one previous study, following an oral fat load, FMD was reduced in both controls and SCH and OH subjects and remained decreased in OH only at eight hours (58). Unlike two other studies that used fasting measurements, a significant change in FMD was not shown in this study in the SCH group (59,60). Postprandial FMD inter-correlated with fasting, peak, and AUC Apo B48 in this study, and although other studies have demonstrated a reduction in FMD in OH, no study has measured Apo B48 in tandem with FMD, either fasting or postprandially, and this information gives additional insight into the postprandial phase in SCH and OH subjects. There was a strong inter-correlation between CETP-associated HDL2 and HDL3 and the absolute and percentage postprandial change in FMD, and although HDL is preserved in OH, reduced FMD indicates likely postprandial inflammation occurring, perhaps mediated in some way by reduced CETP activity.
Conclusion
This is the most detailed postprandial study to date in OH and SCH, demonstrating changes that were not evident under fasting conditions. Postprandial Apo B48 concentrations were increased to a greater degree in OH compared with SCH and fasting. However, postprandial HDL only reduced in SCH. Similar changes were observed in HDL2 and HDL3. Preservation of HDL may be secondary to the decreased CETP activity observed in the OH group only. Postprandial endothelial dysfunction is only decreased in the OH group and does not appear to reflect inflammation.
Footnotes
Author Disclosure Statement
The authors have nothing to disclose.