




Abstract
Background:
The thyroid is composed of endocrine epithelial cells, blood vessels, and mesenchyme. However, no data exist thus far on absolute cell numbers, relative distribution, and proliferation of the different cell populations in the developing and mature thyroid. The aim of this study was therefore to establish a flow cytometry protocol that allows detection and quantification of discrete cell populations in embryonic and adult murine thyroid tissues.
Methods:
Cell-type anti-mouse specific antibodies were used for erythroid cells (Ter119), hematopoietic cells (CD45), epithelial cells (EpCam/CD326, E-cadherin/CD324), thyroid follicular cells and C-cells (Nkx2-1), endothelial cells (Pecam/CD31, Icam-1/CD54), and fibroblasts (PDGFRa/CD140a). Proliferating cells were detected after labeling with 5-bromo-2′-deoxyuridine (BrdU). For flow cytometry analyses, micro-dissected embryonic (E) and adult thyroids were pooled (E13.5, n = 25; E15.5, n = 15; E17.5, n = 15; adult, n = 4) in one sample.
Results:
The absolute parenchymal cell numbers per mouse thyroid (M ± SD), excluding the large number of CD45+ and Ter119+ cells, increased from 7425 ± 1338 at E13.5 to 271,561 ± 22,325 in adult tissues. As expected, Nkx2-1+ cells represented the largest cell population in adult tissues (61.2 ± 1.1%). Surprisingly, at all three embryonic stages analyzed, thyroid follicular cells and C-cells accounted only for a small percentage of the total thyroid cell mass (between 4.7 ± 0.4% and 9.4 ± 1.6%). In contrast, the largest cell population at all three embryonic stages was identified as PDGFRa/CD140a+ fibroblasts (61.4 ± 0.4% to 77.3 ± 1.1%). However, these cells represented the smallest population in adult tissues (5.2 ± 0.8%). Pecam/CD31+ endothelial cells increased from E13.5 to E15.5 from 3.7 ± 0.8% to 8.5 ± 3.0%, then remained stable at E17.5 and adult tissues. Proliferation rates were sizable during the entire organogenesis but differed between cell populations, with distinct proliferative peaks at E13.5 in epithelial cells (32.7 ± 0.6% BrdU+ cells), and at E15.5 in endothelial cells (22.4 ± 2.4% BrdU+ cells). Fibroblasts showed a constant proliferation rate in embryonic tissues. In adult tissues, BrdU+ cells were between 0.1% and 0.4% in all cell types.
Conclusions:
Using a novel flow cytometry–based method, a previously unobserved highly dynamic growth pattern of thyroid cell populations during embryogenesis was uncovered. This approach will provide a useful new tool for cell function analyses in murine thyroid disease models.
Introduction
T
At present, however, very few data are available with regard to the precise cellular composition and cell growth dynamics of the developing thyroid due to lack of TFC-specific surface antigens and protocols for nuclear staining with TFC-specific transcription factors such as Nkx2-1. One previous study quantified the different cell populations in the adult dog thyroid before flow cytometry was available by transmission electron microscopy (6). In that study, 70% of thyroid cells were epithelial cells, 6% endothelial cells, and 24% fibroblasts (6). However, these results were never confirmed in other species.
Flow cytometry allows for a precise quantification of relative distributions of different cell types during various stages of differentiation. Using human thyroid tissues, endothelial cells were studied by flow cytometry using factor-VII related antigen (7). However, other thyroid cells were not analyzed in that study. In another study, thyroglobulin and calcitonin antibodies were used to quantify TFC and C-cell mass in adult rat thyroids. This study showed that 40% of the cells were thyroglobulin positive, thus representing TFCs, and 4% were calcitonin positive, representing C-cells (8).
To make more precise data available on thyroid cell populations both in adults and during thyroid development, a flow cytometry protocol was developed to quantify the main cell populations in the murine thyroid gland and to provide data on the developmental growth dynamics of the embryonic thyroid gland at different consecutive stages for the first time. This protocol provides a new tool for future in-depth analyses of murine thyroid disease models.
Materials and Methods
Mice
Embryos from Swiss albino mice at embryonic day (E) 13.5, 15.5, and 17.5, and adult female pregnant mice (8 weeks old) were obtained from Janvier Labs. All experiments were performed in accordance with federal regulations.
In vivo labeling of mice with bromodeoxyuridine
Mice were injected intraperitoneally with 2 mg 5-bromo-2′-deoxyuridine (BrdU; BD Biosciences; 1 mg/100 μL of phosphate-buffered saline [PBS] per mouse) 2 h prior to tissue isolation.
Cell suspension preparation
Embryonic thyroids from E13.5, E15.5, and E17.5 embryos and thyroids from adult female pregnant mice were micro-dissected, cleaned of fat and connective tissue, and placed in ice-cold PBS containing 2% fetal calf serum (FCS). Only entire bilobed thyroid glands with intact isthmus were used for experiments. Each experiment used pooled tissues to obtain sufficient cells for analysis: E13.5, n = 25 pooled thyroids per sample; E15.5, n = 15 pooled thyroids per sample; E17.5, n = 15 pooled thyroids per sample; adult tissues, n = 4 thyroids per sample. To reduce experimental variation, all embryonic and adult thyroid tissues were micro-dissected on the same experimental day, and all four stages were analyzed within the same experiment on the same day. Thyroids were enzymatically digested with 1 mg/mL collagenase/dispase and 2 μg/mL DNase I (Roche Diagnostics) at 37°C for 20 min until single-cell suspension was obtained. Adult thyroids were first cut into small pieces using sterile scissors before enzymatic digestion. After obtaining the single-cell suspension, cells were centrifuged with PBS containing 2% FCS for 5 min at 453 g. Cells were then stained with cell surface markers for 20 min on ice. Prior to intracellular staining, cells were fixed and permeabilized using the BD Cytofix/Cytoperm™ Fixation/Permeabilization solution kit (BD Biosciences), according to the manufacturer's guidelines. Cells were then exposed to 10% goat serum for 45 min at room temperature. Intracellular staining with anti-Nkx2-1 antibody was done for 45 min at room temperature followed by secondary antibody for 30 min at room temperature. Non-nucleated cells were excluded by staining with DAPI; (4′,6-Diamidine-2′-phenylindole dihydrochloride; Roche Diagnostics). To analyze cell proliferation, cells were also treated with 30 μg of DNase I (BD Biosciences) followed by anti-BrdU staining and 7-AAD (7-Aminoactinomycin D; BD Biosciences) after the fixation and permeabilization step.
Flow cytometry analysis
Cells were acquired on BD FACSAria II flow cytometer (Becton Dickinson). FlowJo software (Tree Star, Inc.) was used for analyzing flow cytometry data. The following monoclonal antibodies were used: E-cadherin/CD324 (ECCD-2) from Invitrogen; EpCam/CD326 (G8.8), PDGFRa/CD140a (APA5), CD45 (30-F11), Ter119 (TER-119), Icam-1/CD54 (YN1/1.7.4), and Pecam/CD31 (390) from Biolegend; and Nkx2-1 (EP1584Y) from Abcam. As secondary antibody, goat anti-rabbit A647 was obtained from Life Technologies.
To calculate the absolute cell numbers, all events acquired were first gated to remove cell debris by using forward-scattered light (FSC) and side-scattered light (SSC; Fig. 1A). Then, cell doublets were removed by using SSC-height (SSC-H) and SSC-width (SSC-W). Organ cellularity was determined with a Z1 Coulter Counter (Beckman Coulter). The absolute cell number of each cell type was calculated by multiplying organ cellularity with the frequency of individual cell populations determined by flow cytometry.
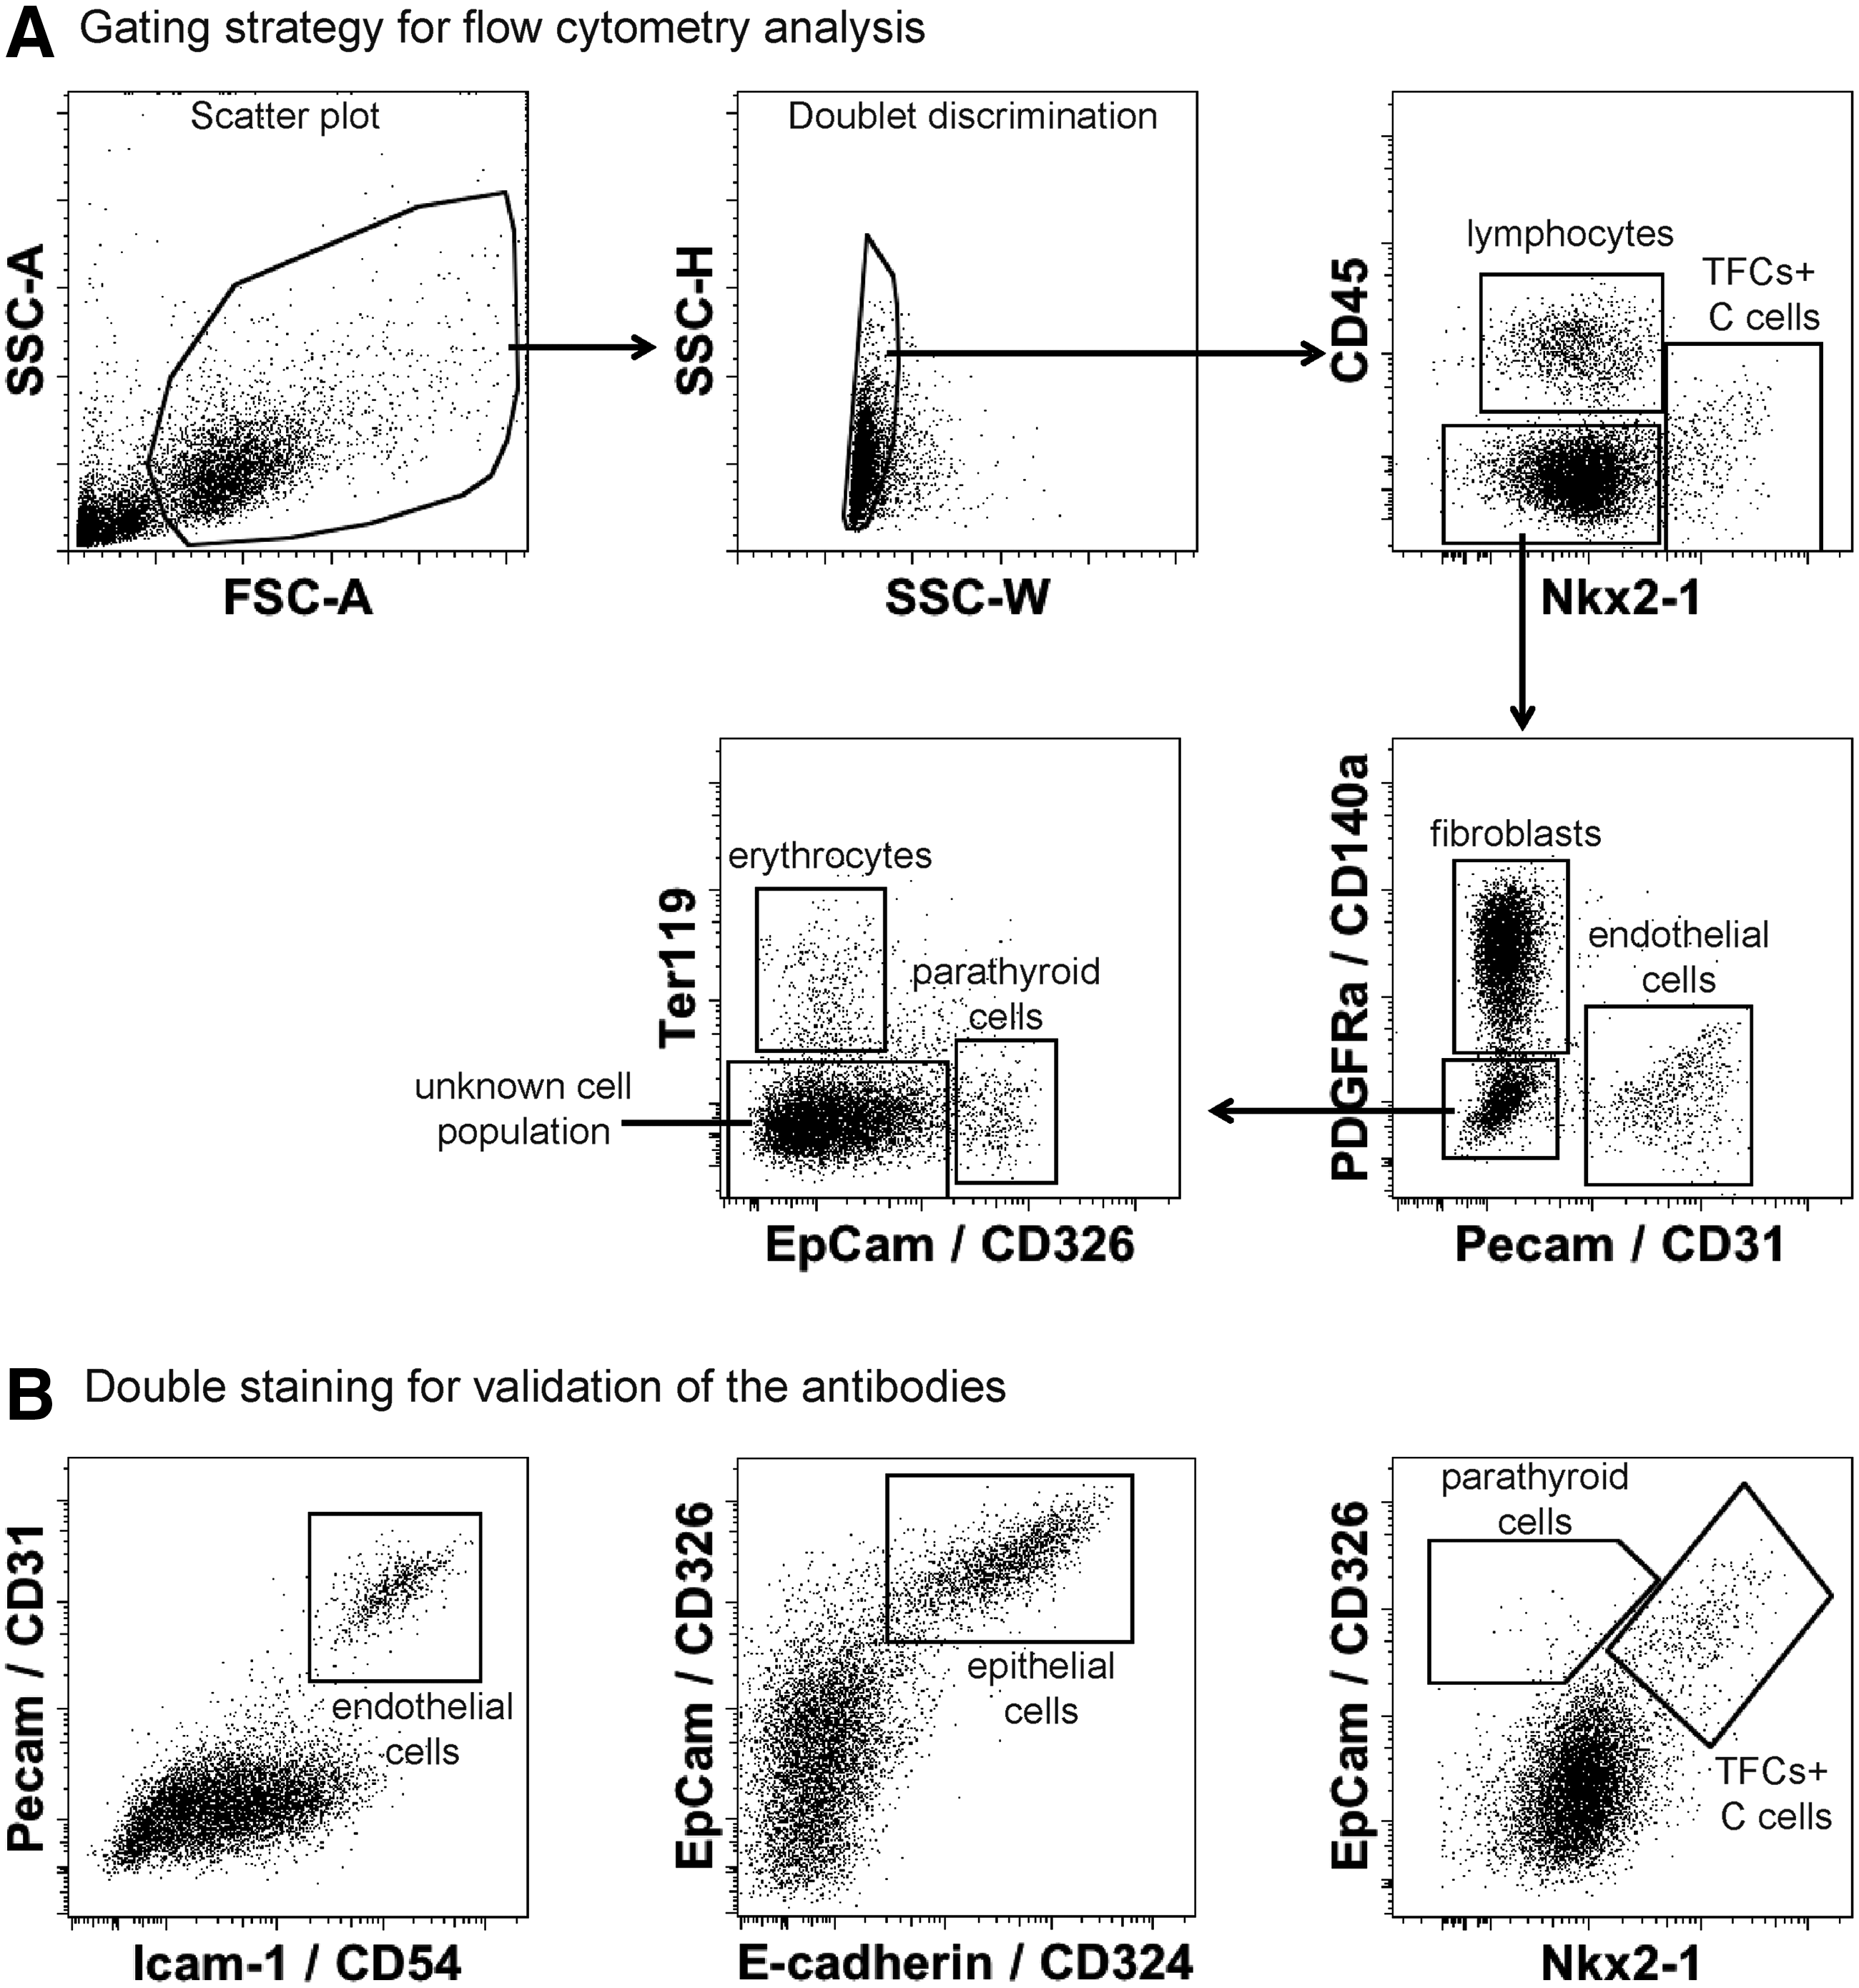
Gating strategy for flow cytometric analysis of thyroid glands. (
Statistical analysis
All values are given as M ± SD. The data represent three independent experiments. For multiple group comparisons, one-way analysis of variance with Tukey's multiple comparison post-test was performed using GraphPad Prism v5 for Mac OS X (GraphPad Software;
Results
Establishment of a combination of specific antibodies suitable for the evaluation of the thyroid gland
First, a protocol of intranuclear staining with Nkx2-1, a transcription factor expressed in TFCs and C-cells (9), was established. Using this approach, it was possible to identify the TFC/C-cell population (Fig. 1A and B). Second, the use of established surface markers to identify epithelial cells (EpCam/CD326+, E-cadherin/CD324+), endothelial cells (Pecam/CD31+, Icam-1/CD54+), fibroblasts (PDGFRa/CD140a+), erythroid cells (Ter119+), and hematopoietic cells (CD45+) in the thyroid tissue was validated (Fig. 1A and B). The final gating strategy consisted of the combined use of Nkx2-1, CD45, Pecam, PDGFRa, EpCam, and Ter119 (Fig. 1A). Nkx2-1–/EpCam+ cells represent parathyroid cells (Fig. 1A and B). The used gating strategy allowed characterizing between 82% and 92% of cells in the embryonic thyroid and 93% of cells in the adult murine thyroid gland (Fig. 1A and Table 1). However, a population ranging from 8% to 20% of cells remained negative for all six antibodies in the different embryonic and adult tissues.
Data represent results from three independent experiments (M ± SD) with pooled tissues (n = 25 bilobed thyroids at E13.5, n = 15 bilobed thyroids at E15.5 and E17.5, and n = 4 thyroids in adult samples for each experiment).
E, Embryonic day.
Assessment of absolute thyroid population cell numbers
The mean absolute total cell number (Table 2 and Fig. 2) of one thyroid gland was 7425 ± 1338, 18,444 ± 1259, 31,804 ± 2610, and 271,561 ± 22,325 cells at E13.5, E15.5, and E17.5, and in adult tissues, respectively. Different growth patterns were observed in endocrine cells, endothelial cells, and fibroblasts. First, Nkx2-1+ TFC/C-cell and Nkx2-1–/EpCam+ parathyroid cell numbers were 684 ± 91, and 109 ± 33 cells/thyroid at E13.5, respectively, and increased 243-fold and 438-fold at the adult stage (166,208 ± 17,334 and 47,598 ± 7008 cells/thyroid). Second, the cell number of Pecam+ endothelial cells was 274 ± 75 at E13.5 and reached 22,813 ± 4027 in adult tissues (83-fold increase with a peak between E13.5 and E15.5 during angiogenesis of the embryonic thyroid). Lastly, PDGFRa+ fibroblasts showed highest cell numbers in embryonic tissues, although only with a slight increase from E13.5 to adult stage (2.0×), and surprisingly with a decrease by 28% between E17.5 and the adult stage. Nkx2-1–/CD45–/Pecam–/PDGFRa–/EpCam–/Ter119– cells showed a 34-fold increase from 609 ± 154 cells/thyroid at E13.5 to 20,837 ± 9,899 cells/thyroid in the adult. The absolute cell numbers of each cell type are summarized in Table 2 and Figure 2.

Comparison of absolute cell numbers of the whole thyroid and of each subpopulation at embryonic stages and in adult tissues. One thyroid; data are representative for the whole cell mass of one entire bilobed thyroid gland after exclusion of Ter119+ erythroid cells and CD45+ hematopoietic cells; Nkx2-1+ cells, thyroid follicular cells, and C-cells; Nkx2-1–/EpCam+ cells, parathyroid cells; Pecam+ cells, endothelial cells; PDGFRa+ cells, fibroblasts; Nkx2-1–/CD45–/Pecam–/ PDGFRa–/EpCam–/Ter119– cells, unknown cell type. Data represent results from three independent experiments (M ± SD) with pools of n = 25 bilobed thyroids at E13.5, n = 15 bilobed thyroids at E15.5 and E17.5, and n = 4 thyroids in adult samples for each experiment.
Data represent results from three independent experiments (M ± SD) with pooled tissues (n = 25 bilobed thyroids at E13.5, n = 15 bilobed thyroids at E15.5 and E17.5, and n = 4 thyroids in adult samples for each experiment).
Relative frequencies of cell types
For calculation of relative frequencies of parenchymal cell populations, the number of Ter119+ erythroid cells and CD45+ hematopoietic cells were subtracted from the absolute total cell number of one thyroid gland. TFCs and C-cells (Nkx2-1+ cells) were surprisingly low in relative frequency (4.7–9.4%) in embryonic tissues (Table 1, Fig. 3). In contrast, in adult tissues, they represented as expected the predominant population (61.2% of all cells). Parathyroid cells (Nkx2-1–/EpCam+ cells) were low (0.8–3.0%) in embryonic tissues, but increased to 17.8% in adult thyroid tissues. Endothelial cells (Pecam+) doubled their frequency between E13.5 and E15.5 from 3.7% to 8.5% and remained at 8.5%, and 8.4% at E17.5 and adult stage, respectively. Fibroblasts (PDGFRa+) were the predominant cell type in embryonic thyroid glands (61–77%), while they formed the smallest cell population in adult tissues with 5.2% (Figs. 3 and 4A). Finally, the cell population negative for all used antibodies (Nkx2-1–/CD45–/Pecam–/PDGFRa–/EpCam–/Ter119–) increased from 8% at E13.5 to 20% and 19% at E15.5, and E17.5, respectively, but was low in adult tissues (8%). The origin of this cell population remains to be characterized.
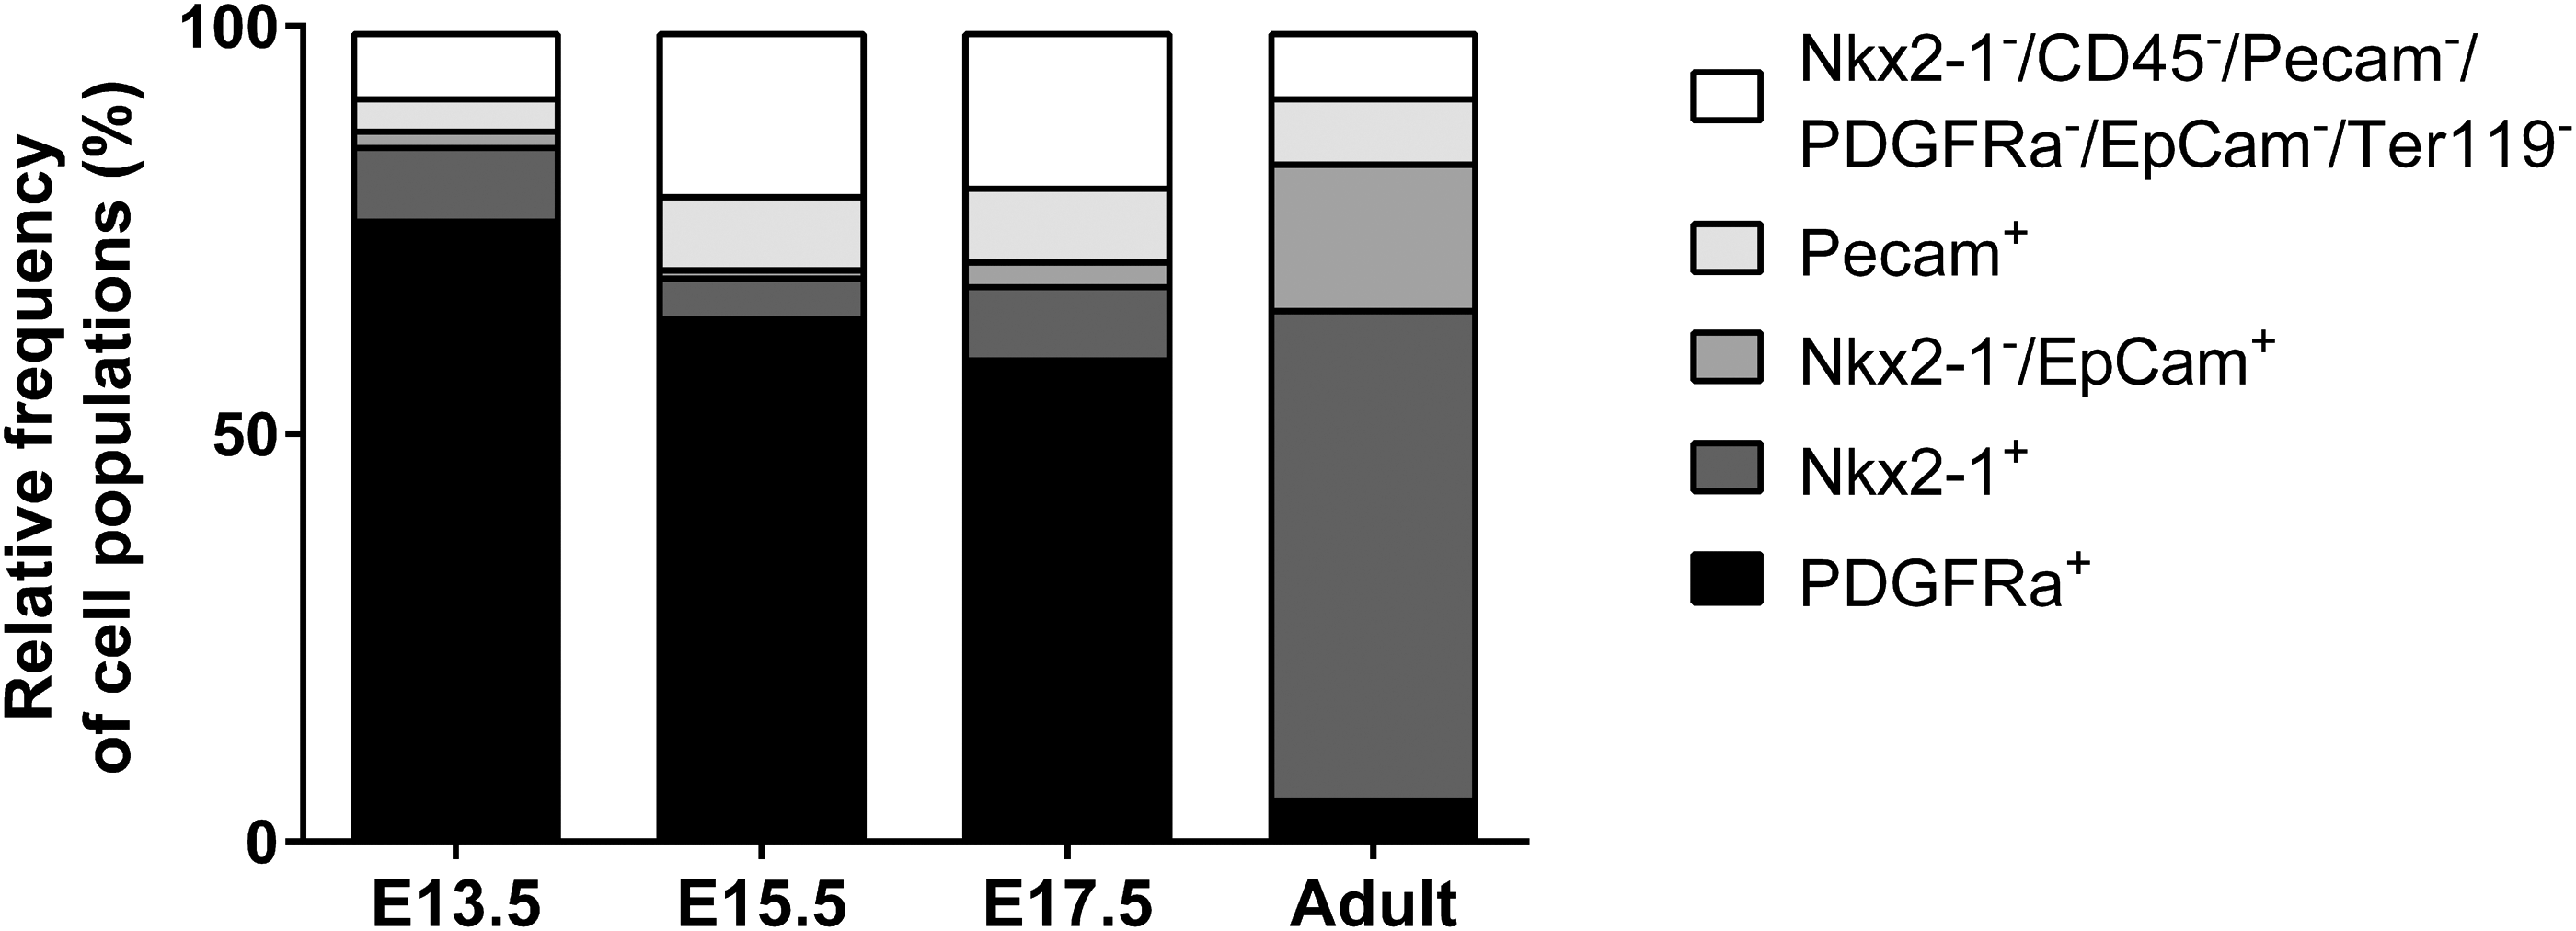
Relative frequencies of cell populations characterized by flow cytometry in embryonic and adult thyroid tissues. Relative frequencies were calculated after exclusion of erythroid (Ter119+) and hematopoietic cells (CD45+). Results represent data from three independent experiments (M ± SD) with pooled thyroid tissues (n = 25 bilobed thyroids at E13.5, n = 15 bilobed thyroids at E15.5 and E17.5, and n = 4 thyroids in adult samples for each experiment).
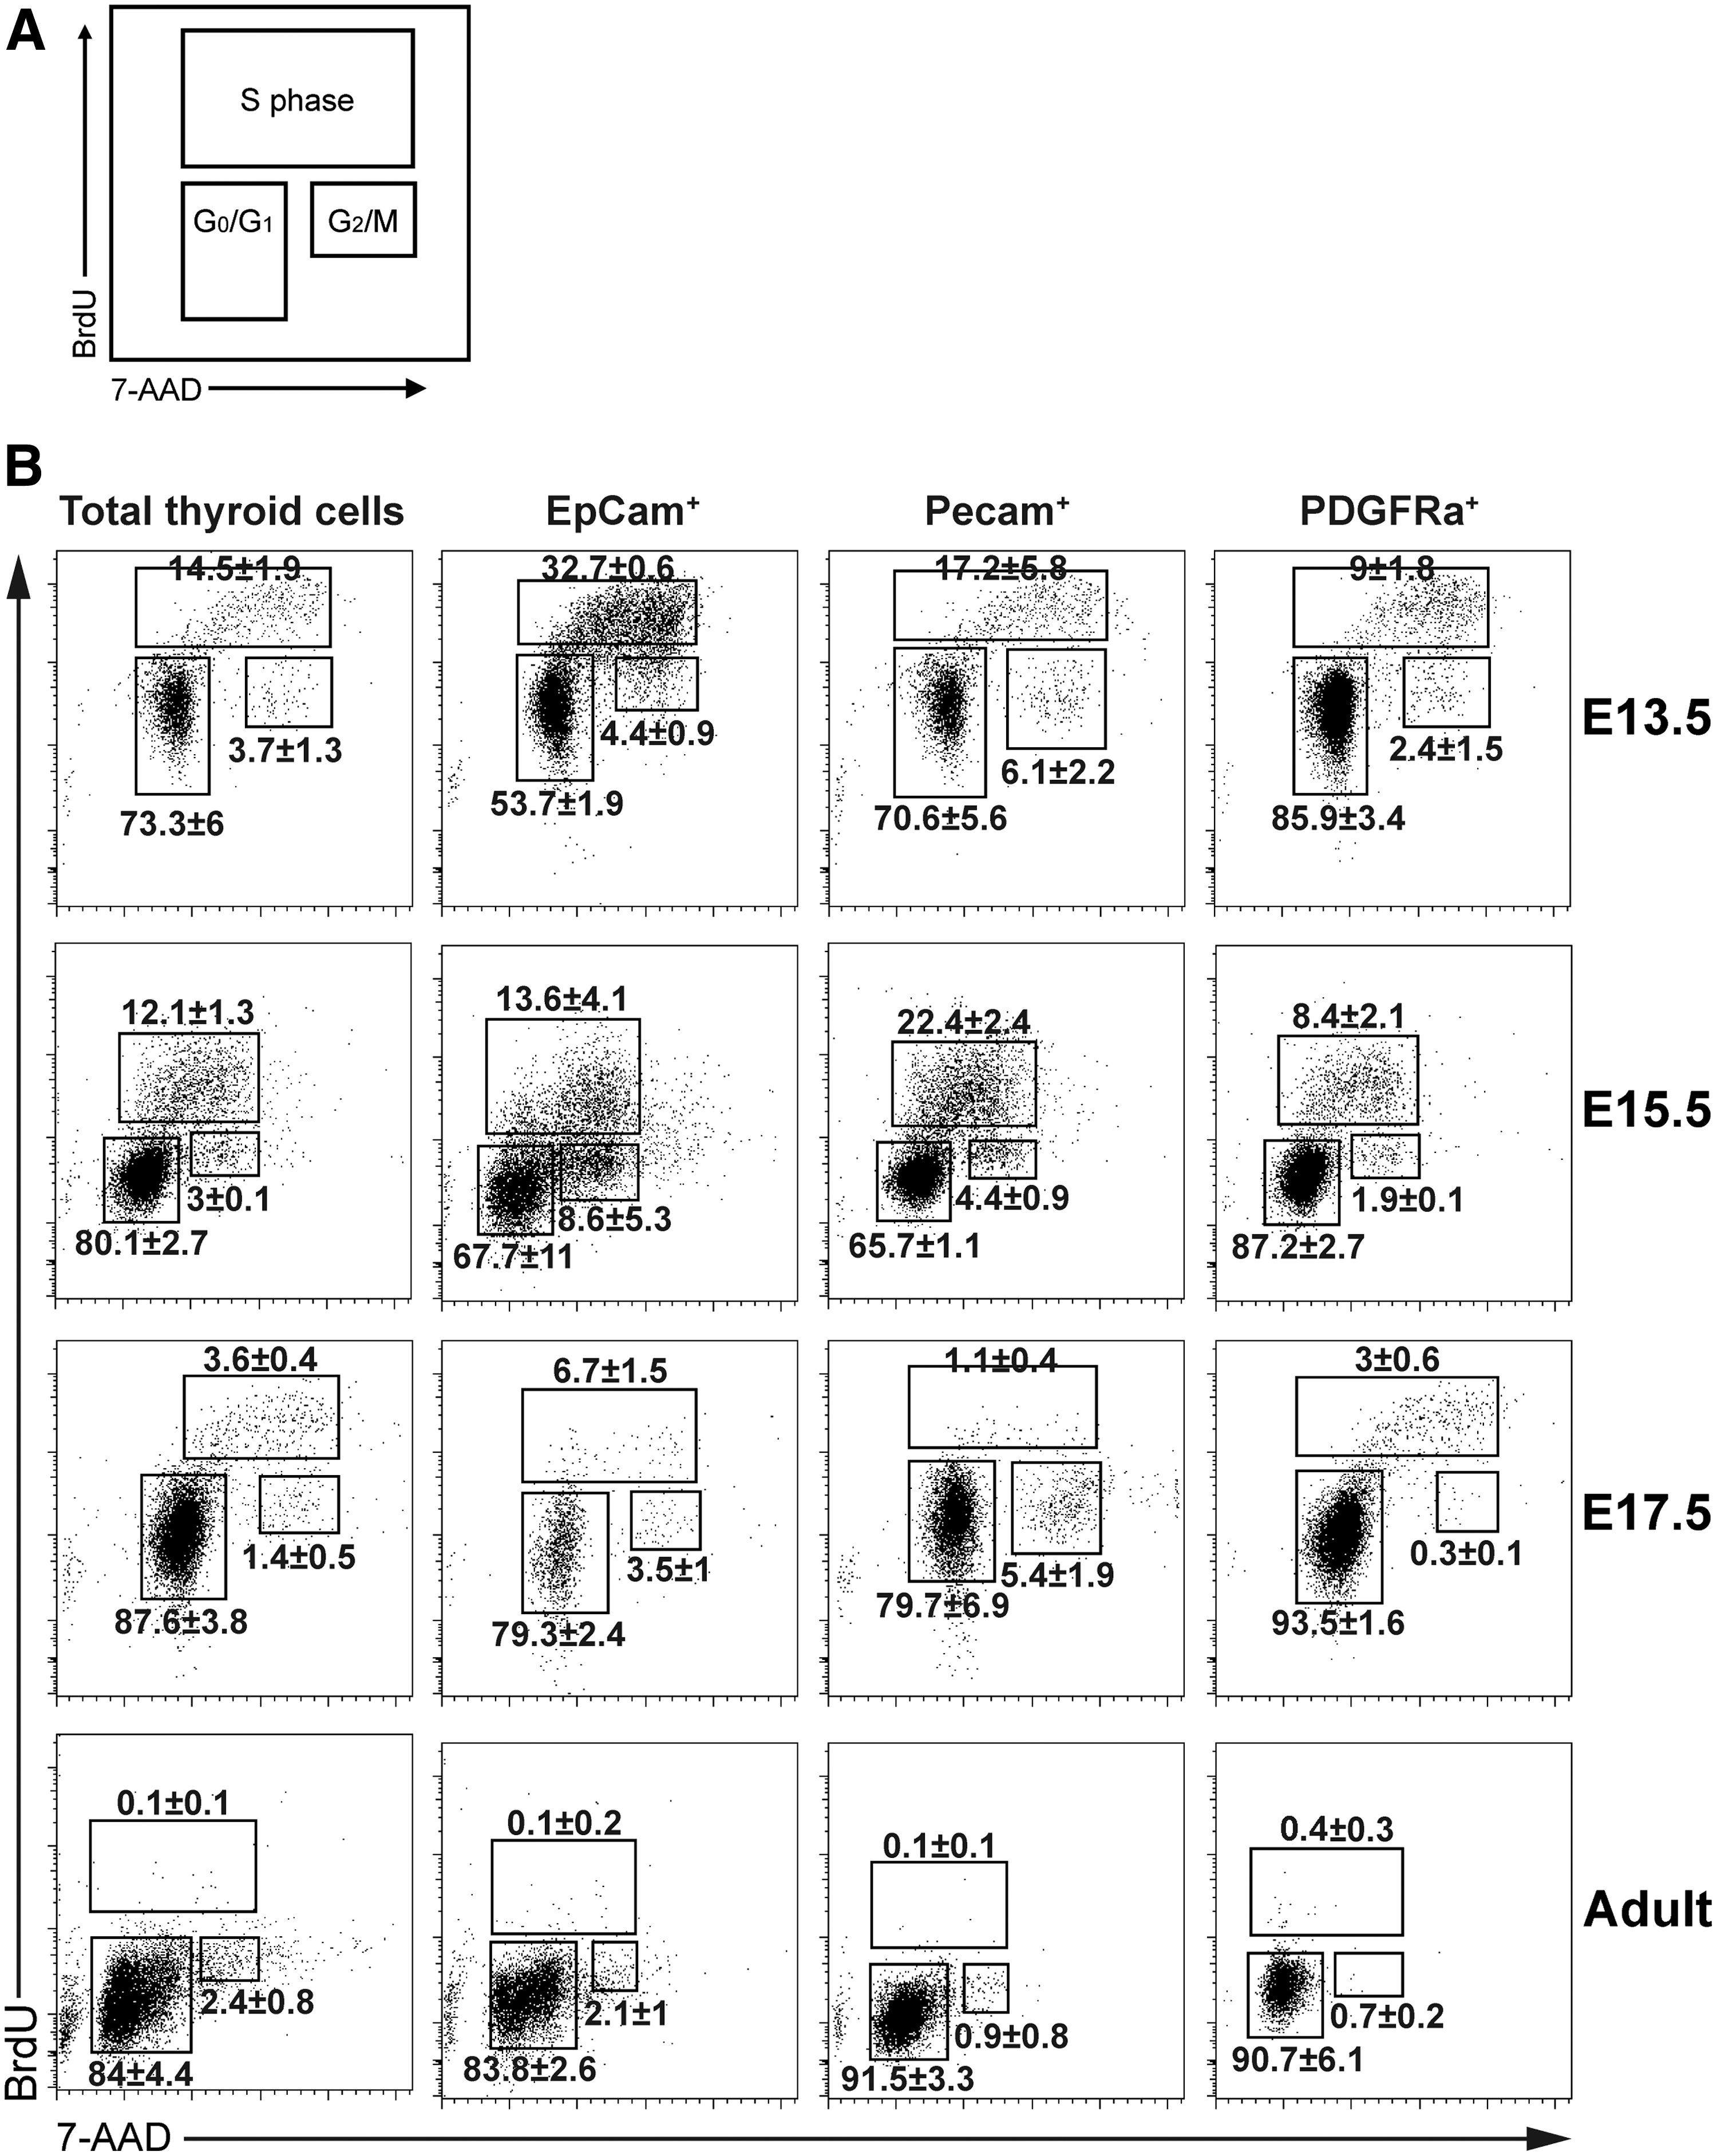
Cell cycle analysis at all stages in cell populations. (
Cell cycle analysis of discrete thyroid cell types
The different phases of the cell cycle in the identified cell populations were assessed by BrdU and 7-AAD labeling. Cells in G0/G1 phase were BrdU–/7-AAD2n, cells in S-phase were BrdU+/7-AAD2n/4n, and cells in G2/M phase were BrdU–/7-AAD4n (Fig. 4A). Embryonic stage-specific frequencies of cells in S-phase were significantly different between E13.5-E15.5-E17.5 tissues for EpCam+ epithelial cells (p < 0.01) and Pecam+ endothelial cells (p < 0.05), while in PDGFRa+ fibroblasts, values were not statistically different in embryonic stages (p = 0.07). In contrast to epithelial cells, endothelial cells, and fibroblasts, the unknown cell population (Nkx2-1–/CD45–/Pecam–/PDGFRa–/EpCam–/Ter119–) harbored markedly stable frequencies of BrdU+ cells between E13.5 and E17.5 (p = 0.6). Hence, significant differences of the relative frequencies of cells in S-phase were observed between the different cell types at each embryonic stage (E13.5, p < 0.01; E15.5, p < 0.05; E17.5, p < 0.05), while the BrdU-positive cell frequency did not differ in adult tissues between cell types (p = 0.55).
Frequencies of proliferating cells among EpCam+ epithelial cells were highest at E13.5 (32.7 ± 0.6%). The fraction of proliferating cells then decreased to 13.6 ± 4.1% at E15.5 and to 6.7 ± 1.5% at E17.5 (Figs. 4B and 5B). In adult thyroid glands, the frequency of BrdU+ cells was 0.1 ± 0.2%. In contrast, the fraction of proliferating cells among Pecam+ endothelial cells increased in their proliferation from 17.2 ± 5.8% (E13.5) to 22.4 ± 2.4% at E15.5. Late in embryonic development (E17.5), a fraction (1.1 ± 0.4%) of Pecam+/BrdU+ double-positive cells was present. In adult tissues, the proliferation rate of Pecam+ cells was 0.1 ± 0.1%. Finally, PDGFRa+ fibroblasts showed stable proliferation rates at E13.5 and E15.5 (9.0 ± 1.8%, and 8.4 ± 2.1%, respectively; Figs. 4B and 5B). They decreased to 3.0 ± 0.6% at E17.5, and to 0.4 ± 0.3% in adult thyroids. The cell population negative for all used surface and intracellular markers (Nkx2-1–/CD45–/Pecam–/PDGFRa–/EpCam–/Ter119–) showed proliferation rates of 14.8 ± 1.9% at E13.5, 16.8 ± 5.5% at E15.5, and 11.4 ± 9.1% at E17.5, and 0.0 ± 0.1% in adult tissues.
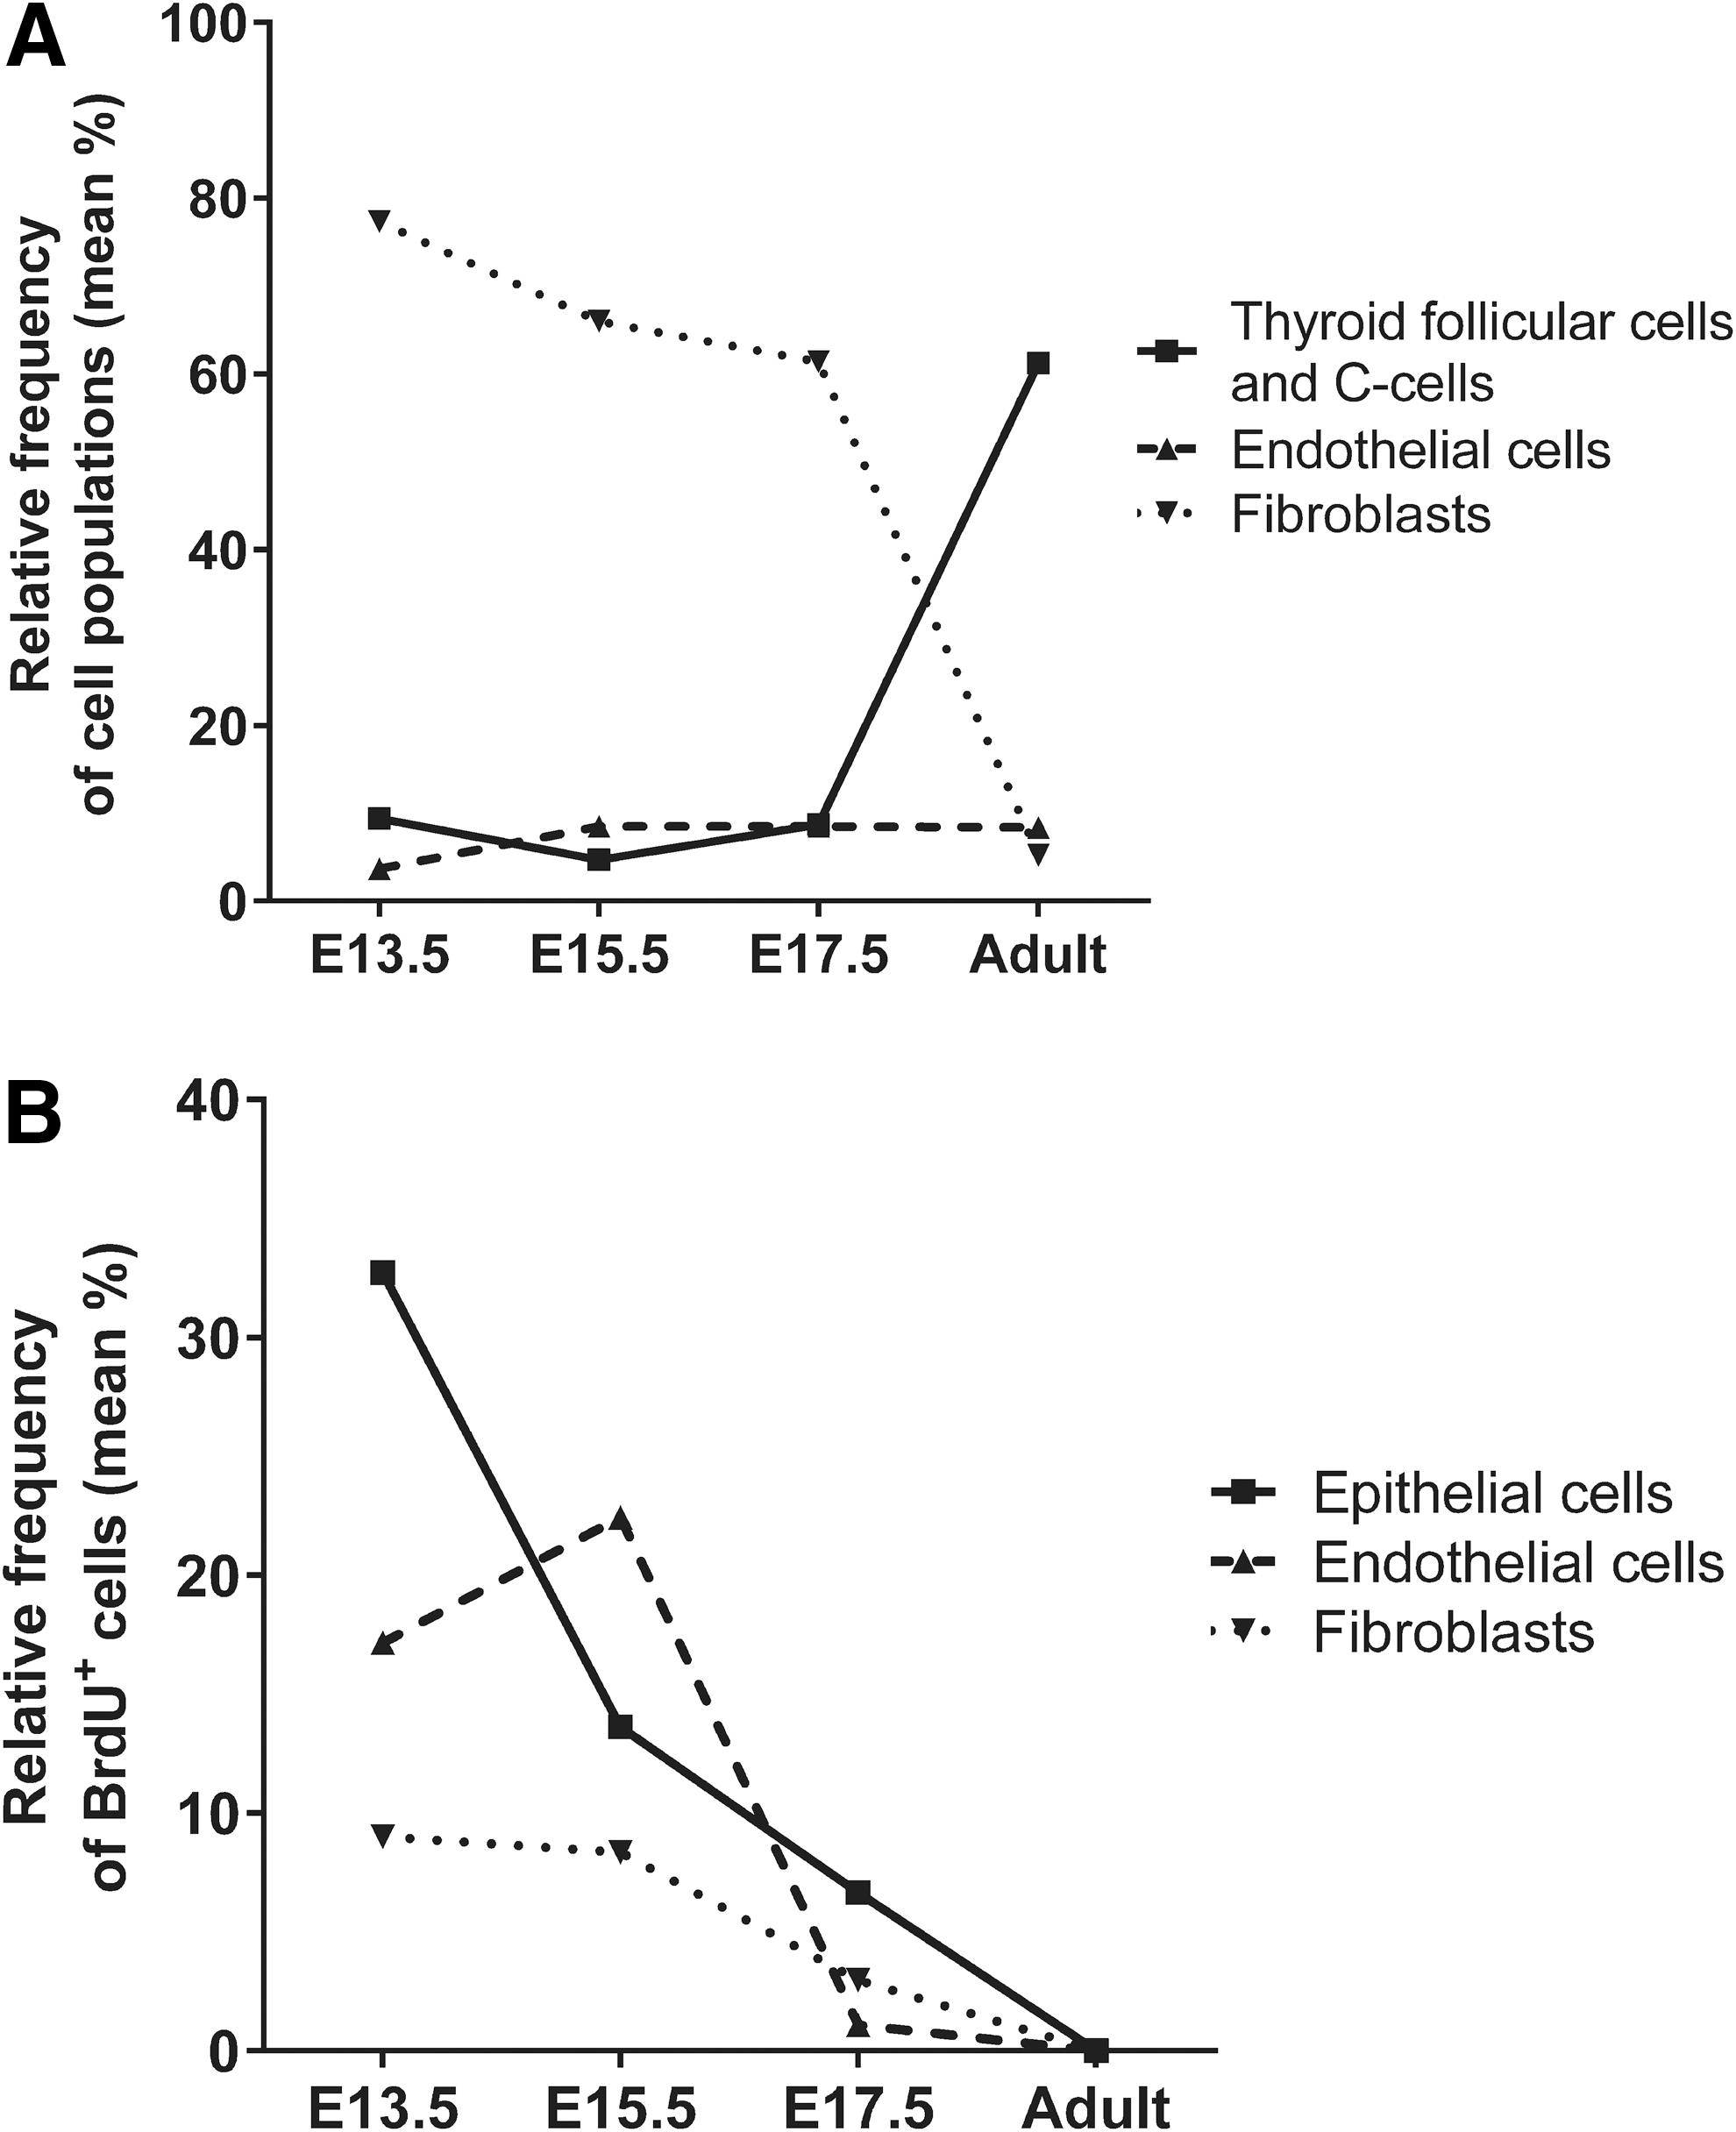
Summary of cell growth dynamics of the three main populations of the thyroid gland during late embryonic stages and in adult tissues. (
Thus, our data indicate distinct cell population–specific proliferative waves during thyroid development, with a peak proliferation at E13.5 in the epithelial population and at E15.5 in endothelial cells. In contrast, fibroblasts showed more stable proliferation rates during thyroid differentiation without clear peaks, and the unknown cell population is characterized by a markedly stable but high frequency of BrdU+ cells in embryonic tissues.
Discussion
Improved tools for suitable cell analysis are required to obtain more in-depth knowledge with regard to thyroid development and disease. Flow cytometry has not been a standard protocol to date for thyroid research. The use of flow cytometry in this study made it possible to quantify absolute cell numbers, relative frequencies, and the proliferation rate of endocrine epithelial cells, endothelial cells, and fibroblasts in embryonic and adult murine thyroid tissues (summarized in Fig. 5A and B). The protocol provides a new tool for research in thyroid development and disease models in the mouse.
Previously, sorting of human thyroid endothelial cells and TFC precursors expressing green fluorescent protein (GFP) in vitro had been reported (7,10). Both protocols did not allow analysis of the in vivo frequencies and cell growth dynamics of cell subpopulations in the developing thyroid. One study quantified TFCs in adult rat thyroids in vivo by flow cytometry (8). These investigators used intracellular thyroglobulin (TG) and calcitonin staining to identify TFCs and C-cells. They observed 40% TG-positive TFCs, and 2–4% calcitonin-positive C-cells. The remaining cells were not characterized. In the present study, the frequency of TFCs in adult tissues was higher (61%; see Table 2 and Fig. 2), which is likely explained by two technical differences. First, the exclusively intranuclearly expressed TFC and C-cell transcription factor Nkx2-1 was used in the current study instead of TG to characterize TFCs. TG can be detected in the cytoplasma of TFCs, especially in embryonic tissues (11 –13). However, synthesized TG is excreted and accumulates within the follicular lumen and might be a less specific marker for TFCs than Nkx2-1 is. Second, Moerch et al. used a much longer dissociation protocol of thyroid tissue compared with the current protocol, possibly leading to a considerable loss of TFCs by dissociation (8).
Using morphological analysis of adult dog thyroids by transmission electron microscopy, Dow et al. quantified the different cell populations in the adult dog thyroid and found a frequency of 70% for TFCs, 26% of fibroblasts, and 6% of endothelial cells (6). These results were published in 1986, and are the only data characterizing all three main populations of the thyroid gland so far. The present results in the adult mouse thyroid are in accordance with these data concerning the percentage of TFCs (Nkx2-1-positive cells in the present study; 61% vs. 70% in the dog) and endothelial cells (8% vs. 6% in the dog), since these two cell types can be clearly differentiated from interstitial cells by morphological criteria. The relative abundance of fibroblasts was clearly lower in the current study (Fig. 3). It is hypothesized that by morphological analysis, all interstitial cells were classified as fibroblasts, as morphological analysis might not be specific enough to differentiate between fibroblasts, C-cells, and the population of unknown cells detected by flow cytometry in this study. Interspecies differences might be a further reason for differences with published data.
Quantitative data on the relative distribution in embryonic thyroids were not available thus far. A surprisingly low frequency of Nkx2-1-positive TFC/C-cells was found at all three embryonic stages analyzed, ranging from 4.7% to 9.4%, in contrast to their high abundance (61%) in adult tissues (Fig. 3 and Fig. 4A). These results in the embryonic tissues could have been limited by the gating strategy, only using Nkx2-1 and not adding further specific TFC markers such as Pax8. However, the epithelial origin and the low relative frequency of Nkx2-1+ cells was validated by double staining with EpCam, an epithelial surface marker known to be expressed on embryonic and adult TFCs (Fig. 1B). It is therefore thought that the strategy identified bona fide TFCs.
Importantly, the present data indicate a switch of relative tissue composition between embryonic and adult tissues. The high percentage of mesenchyme at E13.5, E15.5, and E17.5 is in accordance with immunohistochemical data in the embryonic mouse as well as human thyroid tissue (11,13,14). In both species, Nkx2-1-positive TFCs form strands of epithelial cells embedded in or surrounded by mesenchyme. This close contact of mesenchyme and epithelial cells during development is in accordance with data from other endoderm-derived organs, for example the lung and the pancreas (15,16). The observation that mouse models with deletion of mesenchymal genes (e.g. Fgf10–/– , or Shh–/– ) suffer from thyroid dysgenesis further supports the hypothesis of a functional interaction between mesenchyme and epithelial cells (17,18). Finally, thyroidal fibroblasts showed growth-promoting effects on a thyroid carcinoma cell line but not on differentiated FRTL-5 cells injected intrathyroidally, providing further arguments for epithelial–mesenchymal interactions in an undifferentiated state (19).
The mechanisms by which the Nkx2-1-positive TFC/C-cell population becomes so predominant in the adult tissue remain unclear. The important switch between fibroblast and TFC populations (60-fold increase between E17.5 to adult) occurred after E17.5, the latest stage that was analyzed. For a better understanding of developmental processes, late embryonic, neonatal, and postnatal stages until the adult age need to be analyzed by the same approach. One key observation can be made between the E17.5 and the adult thyroid: the fibroblast population is the only cell population showing a significant decrease not only in relative frequency (61% to 4%) but also in absolute cell numbers (–28%; Table 2 and Fig. 2). Whether this reduction in fibroblast/mesenchymal cell numbers could be explained by apoptosis or by processes of cell fate reprogramming or inter-lineage transdifferentiation, as described recently for cardiac endothelial cells, Schwann cells, or hepatocytes, remains speculative (20 –23).
In addition to phenotype data, this work provides information about cell type-specific proliferation rates. Distinct cell type–specific proliferative waves were observed during thyroid development, with a highest and earliest peak in epithelial cells at E13.5. A second but lower peak was observed in endothelial cells at E15.5. In contrast, mesenchymal cells showed a rather stable proliferation rate throughout development (Fig. 4B and 5B). So far, few data on proliferation of Nkx2-1+ cells during thyroid development are available (14,24). The present flow cytometry results (Fig. 4B and 5B) are in general accordance with BrdU immunohistochemistry, revealing a high proliferation rate during thyroid morphogenesis as reported previously (E11.5: 23%/40%, E13.5: 40%, E15.4: 32%/32%) (14,24).
The observed proliferative wave of endothelial cells at E15.5 is in line with the strictly descriptive data without BrdU labeling of peak angiogenesis at E15.5 during folliculogenesis in the murine thyroid (14,25). Finally, the very low turnover rate in adult thyroid tissues in this study for all cell types is in accordance with the landmark data by Dumont's group in dog and human thyroids, suggesting about five renewals per lifetime (4,26).
It was initially hypothesized that the thyroid is composed of three major cell populations: endocrine epithelial cells, endothelial cells, and mesenchymal cells. However, even after exclusion of circulating Ter119+ erythroid cells and CD45+ hematopoietic cells, a cell population ranging from 8% in adult tissues to 20% in embryonic tissues remained negative for all antibodies used in the protocol. Although the gating strategy does not use a second TFC-specific marker, the negative staining for EpCam and for Nkx2-1 argues against an epithelial or even TFC origin of these cells. Further, this cell population showed a clearly distinct proliferation pattern (with constantly high levels of BrdU+ cells) compared with TFCs, endothelial cells, and fibroblasts, suggesting not being synchronized with the fundamental processes of angiogenesis and folliculogenesis of the differentiating thyroid.
The presence of stem cells in the adult human and murine thyroid at very low frequency (0.3–1.4%) has been suggested recently (27 –30). This percentage is clearly lower than the relative distribution of the uncharacterized cell population in the current experiments (8%; Fig. 3). It therefore remains to be determined whether (i) the Nkx2-1–/CD45–/Pecam–/PDGFRa–/EpCam–/Ter119– cell population represents a homogenous population or several yet unidentified cell populations, and (ii) they would stain positive for stem-cell markers.
In conclusion, a novel validated protocol has been provided for flow cytometric analysis of the different cell populations of the thyroid gland. These results add to current quantitative data on in vivo frequencies and cell growth dynamics during normal murine thyroid development. Finally, a relevant cell population besides epithelial, endothelial, and mesenchymal cells has been identified that needs to be further characterized. This approach will provide a useful tool for cell function analysis in murine thyroid disease models.
Footnotes
Acknowledgments
The project was supported by a research grant from the Swiss National Science Foundation (31003A-130458), and a grant from the Gedächtnisstiftung Suzy Rückert zur Krebsbekämpfung.
Author Disclosure Statement
No competing financial interests exist.