
Abstract
Background:
The serum metabolomic profile and its relationship to physiological changes during hyperthyroidism and restoration to euthyroidism are not known. This study aimed to examine the physiological, adipokine, and metabolomic changes that occur when subjects with Graves' disease transition from hyperthyroidism to euthyroidism with medical treatment.
Methods:
Chinese women between 21 and 50 years of age and with newly diagnosed Graves' disease attending the endocrine outpatient clinics in a single institution were recruited between July 2012 and September 2014. All subjects were treated with thioamides to achieve euthyroidism. Clinical parameters (body weight, body composition via bioelectrical impedance analysis, resting energy expenditure and respiratory quotient via indirect calorimetry, and reported total energy intake via 24 h food diary), biochemical parameters (thyroid hormones, lipid profile, fasting insulin and glucose levels), serum leptin, adiponectin, and metabolomics profiles were measured during hyperthyroidism and repeated in early euthyroidism.
Results:
Twenty four Chinese women with an average age of 36.3 ± 8.6 years were included in the study. The average duration of treatment that was required to reach euthyroidism for these subjects was 38 ± 16.3 weeks. There was a significant increase in body weight (52.6 ± 9.0 kg to 55.3 ± 9.4 kg; p < 0.001) and fat mass (14.3 ± 6.9 kg to 16.8 ± 6.5 kg; p = 0.005). There was a reduction in resting energy expenditure corrected for weight (28.7 ± 4.0 kcal/kg to 21.5 ± 4.1 kcal/kg; p < 0.001) and an increase in respiratory quotient (0.76 to 0.81; p = 0.037). Resting energy expenditure increased significantly with increasing free triiodothyronine levels (p = 0.007). Significant increases in total cholesterol, low-density lipoprotein cholesterol, and high-density lipoprotein cholesterol were noted. There was no significant change in leptin levels, but adiponectin levels increased significantly (p = 0.018). Significant reductions in fasting C2, medium-chain, long-chain, and total acylcarnitines were observed, but no changes in the fat-free mass, branched chain amino acid levels, or insulin sensitivity during recovery from hyperthyroidism were noted.
Conclusions:
Serum metabolomics profile changes complemented the physiological changes observed during the transition from hyperthyroidism to euthyroidism. This study provides a comprehensive and integrated view of the changes in fuel metabolism and energy balance that occur following the treatment of hyperthyroidism.
Introduction
H
The serum acylcarnitine, amino acid, and organic acid profiles provide an integrated and systematic view of in vivo substrate flux during specific steps of fatty acid β-oxidation, amino acid catabolism, and TCA cycle metabolism in the mitochondria. In a study of euthyroid subjects, the concentrations of acylcarnitines were increased in subjects with higher free thyroxine (fT4) levels, suggesting that β-oxidation of fatty acids is strongly associated with serum thyroid hormone concentration (13). Limited studies have been performed to investigate the protein dynamics associated with experimental hyperthyroidism in healthy volunteers (14,15). The serum metabolomic profiles during prolonged and pathological exposure to elevated thyroid hormone and after restoration of euthyroidism are currently not known.
Therefore, this study examined the physiological, adipokine, and metabolomic changes that occur during transition from hyperthyroidism to euthyroidism following medical treatment in Asian female subjects with Graves' disease.
Materials and Methods
Subjects
Chinese women between 21 and 50 years of age and with newly diagnosed Graves' disease attending the endocrine outpatient clinics were recruited between July 2012 and September 2014. Graves' disease was diagnosed based on documented laboratory and clinical evidence of hyperthyroidism (e.g., symptoms of tremors, palpitations, weight loss, heat intolerance, or presence of Graves' ophthalmopathy) and increased thyrotropin (TSH) receptor antibodies (TRAb). Subjects who were pregnant, lactating, allergic to thioamides, or taking medication for weight loss, diabetes, or cholesterol were excluded. Subjects for whom definitive treatment with either radioiodine or surgery was indicated (e.g., concomitant thyroid malignancy, thyroid storm) were also excluded from the study.
All subjects were seen by the study's principal investigator or first co-investigator within two to four weeks at diagnosis and throughout the treatment period (every four to six weeks), and were treated with thioamides (carbimazole or propylthiouracil) to achieve euthyroidism, defined as normal fT4 and TSH. Informed consent was obtained from all patients. The study was approved by the SingHealth central institutional research ethics committee.
Clinical and laboratory measurements
Height, weight, body mass index, heart rate, blood pressure, and thyroid hormone measurements were recorded at each clinic visit. Subjects also were asked to recall their “usual” baseline weight before symptoms onset. After a 10 h overnight fast, indirect calorimetry, phlebotomy, and body composition measurement were performed in all study participants at baseline (before treatment) and after achieving euthyroidism. Both time points were defined as within four weeks from diagnosis and within four weeks from the first blood test results that showed euthyroidism, respectively.
Resting energy expenditure (REE) and respiratory quotient (RQ) were measured using indirect calorimetry. Oxygen consumption and carbon dioxide production was quantified using a TRUEone 2400 indirect calorimeter (ParvoMedics, Sandy, UT), and REE was calculated using a modified Weir equation (16). Body composition (total fat mass, fat-free mass, and fat mass percentage [%BF]) was measured in the fasting state via bioelectrical impedance using a Tanita body composition analyzer (model TBF-300; Tanita Corp., Tokyo, Japan).
Laboratory measurements of fasting glucose, insulin, cholesterol, TRAb, plasma acylcarnitines, and amino acids were performed at baseline (before treatment) and after achieving euthyroidism for each subject. Serum total cholesterol, high-density lipoprotein (HDL) cholesterol, low-density lipoprotein (LDL) cholesterol, triglyceride, glucose, insulin, fT4, fT3, and TSH concentrations were determined on the UniCel DxI 800 Access immunoassay system (Beckman Coulter, Inc., Chaska, MN) using chemiluminescence detection methods. Insulin sensitivity was calculated using the homeostatic model assessment (HOMA-IR) (17). TRAb was measured using a second-generation TBII kit using recombinant human TSHR (rhTSHR) (B.R.A.H.M.S. Diagnostics, Berlin, Germany).
Plasma acylcarnitines and amino acids were measured by tandem mass spectrometry, as previously described (18). Briefly, amino acids were separated using a C8 column (Rapid Resolution HT, 4.5 mm × 50 mm, 1.8 μm, Zorbax SB-C8) on a Agilent 1290 Infinity LC system (Agilent Technologies, Santa Clara, CA) coupled with a quadrupole-ion trap mass spectrometer (QTRAP 5500; AB Sciex, Washington, DC). Mobile phase A (10/90 water/acetonitrile) and mobile phase B (90/10 water/acetonitrile) both containing 10 mM of ammonium formate were used for chromatography separation. The LC run was performed at a flow rate of 0.6 mL/min with an initial gradient of 20% B for 0.5 min, then ramped to 100% B for 2.5 min, maintained for 0.5 min, and followed by re-equilibrating the column to the initial run condition (20% B) for 2 min. All compounds were ionized in positive mode using electrospray ionization. The chromatograms were integrated using MultiQuant™ v3.0 software (AB Sciex). Acylcarnitine measurements were made using flow injection tandem mass spectrometry on the Agilent 6430 Triple Quadrupole LC/MS system (Agilent Technologies). The sample analysis was carried out at 0.4 mL/min of 80/20 methanol/water as mobile phase, and an injection of 4 μL of sample. Data acquisition and analysis were performed on an Agilent MassHunter Workstation B.06.00 Software. Leptin was measured using the Human Metabolic Hormone Multiplex Assay Kit (HMHMAG-34K; Millipore, St. Charles, MO). Adiponectin was measured using a Millipore Human Adiponectin enzyme-linked immunosorbent assay kit (EZHADP-61K; Millipore).
To ascertain dietary intakes, a 24 h recall history was conducted at each time point by a trained clinical staff member with the use of the five-stage, multi-pass interviewing technique to recall and describe every item of food and beverage consumed over the preceding 24 h period (19). Nutrient analyses of the dietary records were performed using Dietplan6 software (Forestfield Software Ltd., Horsham, United Kingdom) and a food composition database of locally available foods to determine total energy intake.
Statistical analysis
Statistical analysis was performed using IBM SPSS Statistics for Windows v21 (IBM Corp., Armonk, NY). Results are presented as the mean ± standard deviations (SD) or median with interquartile range. Clinical, anthropometric, and biochemistry parameters were compared between hyperthyroid and euthyroid status (i.e., before and after thioamides therapy) using the paired t-test for all the parameters, except adiponectin, which was analyzed using the Wilcoxon signed-rank test, since the change in adiponectin violated normality assumption. Linear regression models were developed to examine the effect of change in fT3 levels on change in REE (corrected for weight), fat mass, and HOMA-IR from before treatment to after treatment. A p-value of <0.05 was considered statistically significant.
Results
Clinical and biochemistry
Twenty-four women of Chinese descent with recently diagnosed Graves' disease and an average age of 36.3 ± 8.6 years were studied. The mean duration of hyperthyroid symptoms was 2.5 months prior to their diagnoses. The average duration of treatment that was required to reach euthyroidism for these subjects was 38 ± 16.3 weeks. Comparison of clinical, anthropometric, and biochemistry parameters for these subjects at the time of diagnosis and within four weeks after achieving euthyroidism are shown in Table 1. The average recalled baseline weight before onset of symptoms was 56.1 ± 9.4 kg, and the average weight at diagnosis was 52.6 ± 9.0 kg. There was a significant decrease in body weight from each patient's recalled baseline weight to her weight at the time of diagnosis, as well as a significant increase in body weight from hyperthyroidism to euthyroidism (p = 0.001 and p < 0.001, respectively). There were also significant reductions in heart rate as well as serum thyroid hormone and TRAb levels upon achieving euthyroidism (p < 0.001).
Normal ranges: fT4 = 8.8–14.4 pmol/L; fT3 = 3.2–5.3 pmol/L; TSH = 0.65–3.70 mIU/L.
Statistically significant values are shown in bold.
Results for adiponectin are expressed as median (interquartile range).
BMI, body mass index; BP, blood pressure; REE, resting energy expenditure; fT4, free thyroxine; fT3, free triiodothyronine; TRAb, thyrotropin receptor antibodies; HOMA-IR, homeostatic model assessment; HDL, high-density lipoprotein; LDL, low-density lipoprotein.
Bioelectrical impedance analyses of fat mass and percentage body fat showed significant increases from the hyperthyroid to the euthyroid state (p = 0.005 and p = 0.011, respectively), but there was no significant change in fat-free mass (p = 0.646). REE that was corrected for weight decreased significantly (p < 0.001), and RQ increased significantly from the hyperthyroid to the euthyroid state (M = 0.76–0.81; p = 0.037). REE (corrected for weight) increased significantly with increasing fT3 levels (p = 0.007; Fig. 1). No evidence of any significant relationship between changes in fT3 levels and changes in fat mass or HOMA-IR were found. There was a trend in reductions of reported total energy intakes from the hyperthyroid to the euthyroid state (p = 0.053). There were no significant changes in serum glucose, insulin levels, or HOMA-IR. Multivariate analyses did not find any relationship between changes in fT3 levels with changes in weight, fat mass, or HOMA-IR. Serum total cholesterol, HDL-cholesterol, and LDL-cholesterol increased significantly from the hyperthyroid to the euthyroid state (p < 0.001).
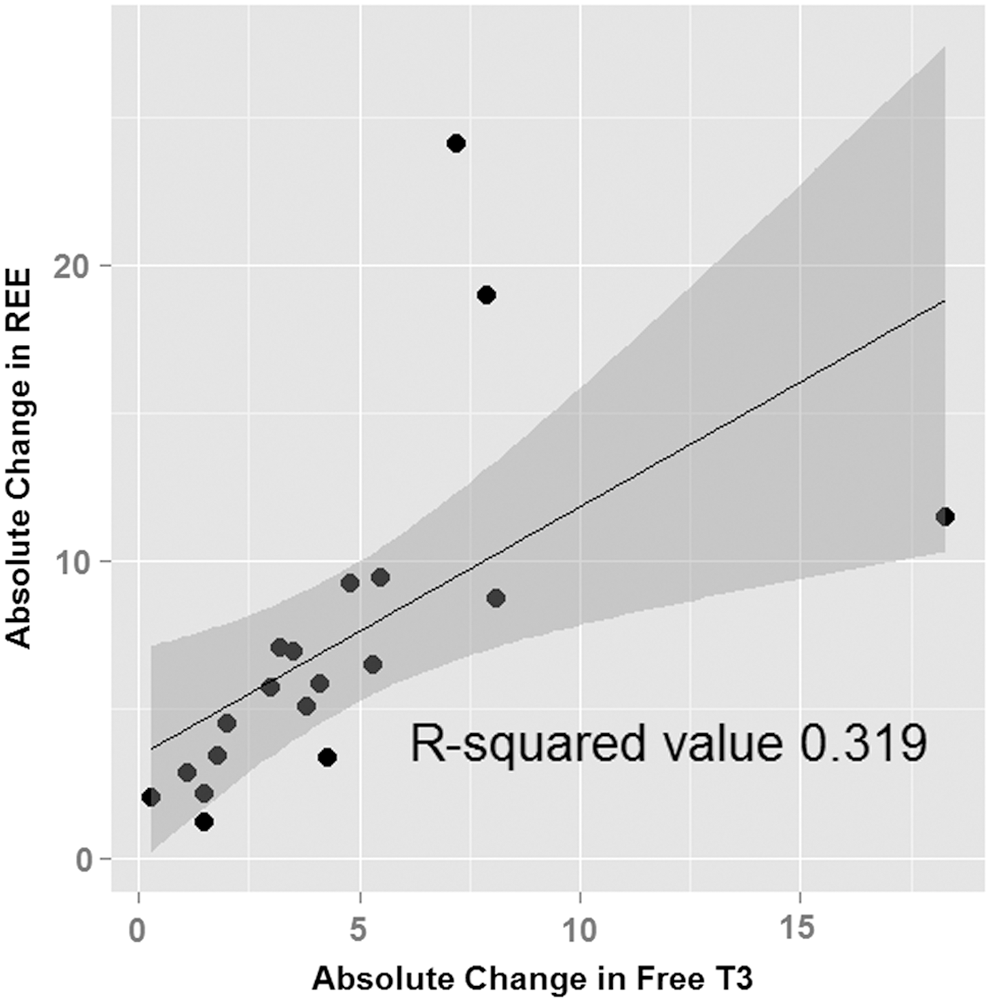
Scatter plot with regression line and confidence region showing the relationship between absolute changes in free triiodothyronine levels and resting energy expenditure (corrected for weight). Exclusion of the two outliers did not change this relationship.
Leptin and adiponectin
There were no significant changes in leptin levels when hyperthyroid subjects became euthyroid (p = 0.081; Table 1). However, there was a significant increase in adiponectin levels (p = 0.018; Table 1).
Serum acylcarnitines, amino acids, and organic acids
Significant reductions were observed in fasting medium- and long-chain, and total acylcarnitines as well as C2 after achieving euthyroidism (Fig. 2). There were no changes in the C3 and C5 acylcarnitine levels, which are downstream intermediates of branched-chain amino acid oxidation. These findings were consistent with the observation that there were no significant differences in the total serum amino acid concentration between the hyperthyroid and the euthyroid state. Interestingly, phenylalanine and tyrosine levels decreased significantly, whereas branched-chain amino acid (leucine, isoleucine, and valine) levels did not change during the transition from hyperthyroidism to euthyroidism (Table 2). Alpha-ketoglutarate, fumarate, and malate levels were reduced significantly, whereas lactate, citrate, and succinate levels remained unchanged (Table 2). The full acylcarnitine analyses results are shown in the Supplementary Table S1 (Supplementary Data are available online at

Changes in acylcarnitines in hyperthyroid state compared to euthyroid state: (
Statistically significant values are shown in bold.
Discussion
Changes in clinical parameters, energy balance, and adipokines
Thyroid dysfunction is associated with changes in energy homeostasis. However, the underlying mechanisms for this disturbance in energy balance and its metabolic implications are not well understood. In this study, the resting energy expenditure and energy intake decreased significantly when hyperthyroid subjects became euthyroid. This was accompanied by significant increases in body weight, fat mass, and percentage body fat, with no change in fat free mass within four weeks of achieving euthyroidism. The study subjects had a statistically significant increase in their body mass index (BMI) by 1 kg/m2 when they achieved euthyroidism. Although this magnitude of increase appears small, it translated into a 5.1% increase in their total body weight. It is well established that changes in body weight by as little as 5–7% can lead to clinically meaningful alterations in metabolic parameters and risk profile (20).
Changes in REE correlated with changes in fT3 levels in our subjects. The association between fT3 and REE was also demonstrated by Mitchell et al. both in thyrotoxic patients and in patients with resistance to thyroid hormone (12). T3 has been postulated to regulate the basal metabolic rate by uncoupling substrate oxidation from ATP synthesis. Using a novel 13C/31P NMR approach in healthy subjects given short-term T3 treatment, Lebon et al. demonstrated that T3 promotes increased thermogenesis, in part by promoting mitochondrial uncoupling in skeletal muscles (11). RQ, a marker of substrate use, increased from 0.76 to 0.81 in the subjects studied here, suggesting a shift from fat utilization to increased reliance on carbohydrate fuel after achieving euthyroidism (21). This metabolic shift could explain the preferential accumulation of fat during the recovery from hyperthyroidism that was observed. Previous body composition studies using dual-energy x-ray absorptiometry showed both fat mass and fat-free mass increased 3–12 months after achieving euthyroidism (22 –24). The study subjects underwent body composition analysis within four weeks of achieving euthyroidism. Thus, it is possible that accumulation of fat-free mass may occur later during the recovery period.
The observation of increased energy expenditure during hyperthyroidism resulting in weight loss despite increased calorie intake is consistent with a previous clinical study (22). In this connection, leptin is decreased in hyperthyroid rats, and increased or unchanged in hypothyroid rats (4). However, the results in humans are conflicting between different studies (4,25). In the present study, there was no significant change in serum leptin levels when the patients transitioned from the hyperthyroid to the euthyroid state. Thus, the results, in combination with those reported previously, suggest that leptin is unlikely to exert major influences on food intake or energy balance in humans with hyperthyroidism. Interestingly, serum adiponectin levels increased significantly in this study. Experimental data suggest that adiponectin augments insulin sensitivity in target tissues. In patients with hyperthyroidism, adiponectin levels are expected to be low and may contribute to insulin resistance (26), although high adiponectin levels were also found in hyperthyroid subjects in some studies (27,28). However, insulin sensitivity did not change in the subjects, despite the increase in adiponectin levels. Of note, results from several studies examining the changes in serum adiponectin levels in hyperthyroid subjects compared to euthyroid subjects have been conflicting (27,29). Hence, the current literature suggests that the metabolic changes observed in thyroid dysfunction do not appear to be mediated by adiponectin (3,29).
The lipid profile in the present subjects showed significant differences between the hyperthyroid and euthyroid states, as both total cholesterol and LDL were reduced in hyperthyroidism. These reductions in total cholesterol and LDL were mainly due to increased clearance during hyperthyroidism (30), although recent studies in mice have shown that thyroid hormone induction of microRNA, miR181d, can lead to decreased sterol O-acyltransferase 2 (SOAT2) expression resulting in decreased cholesterol esters that can be packaged into LDL (30).
Changes in insulin resistance and metabolomics profile
Despite the large shift in fuel metabolism, patients in the present study were not more insulin resistant when hyperthyroid. This finding was unexpected, since the current literature supports the notion that thyrotoxicosis is an insulin-resistant state, and improvement of insulin resistance would have been expected after these subjects were corrected to euthyroidism (31). The reasons for this discrepancy is not clear, but could be related to the fact that the study subjects were all females with normal BMI, and were otherwise healthy and not predisposed toward developing glucose intolerance. The weight gain with treatment of hyperthyroidism in the subjects was attributed mainly to an increase in fat mass. These changes, when coupled with the characteristics of the study subjects, could potentially mask changes in insulin sensitivity during the early treatment of hyperthyroidism. Randin et al. measured insulin sensitivity using glucose clamp studies and found no change in insulin sensitivity in the thyrotoxic state, although the rate of both glucose oxidation and the calculated metabolic clearance of insulin was higher in thyrotoxic patients compared with controls (32). Interestingly, an earlier smaller study by Riis et al. on seven hyperthyroid women with Graves' disease between 26 and 49 years old who were treated to euthyroidism after three months of medical therapy also did not show any changes in insulin, C-peptide, or glucose levels (14). Thus, it is possible that change in insulin resistance occurs only in susceptible individuals with a predisposition toward glucose intolerance. In terms of clinical management, the present study suggests that an increase in insulin resistance in hyperthyroidism is unlikely to occur in an otherwise lean and healthy population.
The present study provides a comprehensive and integrated view of the changes in fuel metabolism in the hyperthyroid state and its transition during return to euthyroidism. A marked shift was observed from fat-burning predominance in the hyperthyroid state to a more mixed utilization of carbohydrate and fat sources of fuels after return to euthyroidism. This finding is apparent at both the whole-body level, as exemplified by the shift in fasting RQ, and the biochemical level, as evidenced by the marked reduction of serum long-chain even acylcarnitines from the hyperthyroid to euthyroid states. The accumulation of serum long-chain acylcarnitines has been linked to incomplete mitochondrial fatty acid oxidation and insulin resistance, resulting from a high-energy “mitochondrial stress” state, based on experimental rodent models (33,34).
In this study, high levels of long- and medium-chain acylcarnitines were found in the serum of hyperthyroid patients. These findings are consistent with increased acylcarnitine flux from complete fatty acid oxidation. This is further supported by the increased serum acylcarnitine (C2AC), which is the final product of fatty acid β-oxidation. In contrast, the rodent studies performed in obese mice fed a high-fat diet also showed accumulation of long-chain acylcarnitines due to incomplete β-oxidation of fatty acids in these circumstances (33). Thus, while the rodents developed insulin resistance due to a high-fat diet intake and secondary mitochondrial stress, patients in the present study remained insulin-sensitive and had complete β-oxidation.
Taken together, these apparently paradoxical results highlight the point that increases in serum long-chain acylcarnitines are highly dependent upon context. In a high-fat state combined with reduced energy expenditure (i.e., a sedentary lifestyle), long-chain fatty acids may undergo partial oxidation with accumulation of serum acylcarnitine intermediates. In a hypercatabolic state such as hyperthyroidism, increased delivery of fatty acid fuel to the mitochondria is coupled with high rates of complete oxidation and ATP production, which can then lead to weight loss and increased energy expenditure.
L-carnitine has an important role in the transport of fatty acids into mitochondria for subsequent β-oxidation, a process that results in the esterification of L-carnitine to form acylcarnitine derivatives (35). As such, the endogenous carnitine pool is comprised of L-carnitine and various short-, medium-, and long-chain acylcarnitine esters. Although this study did not measure free carnitine levels in the subjects, the results show raised acylcarnitine ester levels during hyperthyroidism compared with the euthyroid state, which supports the notion that hyperthyroidism is a cause of acquired carnitine deficiency (36). Carnitine supplementation in healthy subjects has been shown to result in muscle glycogen sparing and better mitochondrial flux, with reduction of anaerobic ATP production during exercise (37). This could potentially be useful in hyperthyroid patients who complain of muscle weakness. Interestingly, previous limited studies suggest a role of using carnitine in the treatment of hyperthyroidism in certain clinical settings (38,39).
The odd chain acylcarnitine species, C3 (propionylcarnitine) and C5 (isovalerylcarnitine), are derived mainly from amino acid catabolism, and remained unchanged in the hyperthyroid and euthyroid states. These results are consistent with other findings showing that branched chain amino acid concentrations were similar in both states. Phenylalanine is a direct precursor for tyrosine. Iodination of tyrosyl residues within thyroglobulin-forming iodotyrosines and iodothyronines occurs in thyroid hormone synthesis. Thus, elevated levels of phenylalanine and tyrosine in the hyperthyroid state also may reflect increased production and turnover of thyroid hormones during hyperthyroid states. Although serum levels of most individual amino acids were unchanged, a recent study of experimental short-term hyperthyroidism showed that increased whole-body protein turnover is an early and direct feature of hyperthyroidism, and precedes the changes to energy expenditure, glucose, and lipid metabolism (15). Higher serum levels of several organic acids during hyperthyroidism in this study's subjects reflect increased mitochondrial biogenesis and TCA cycle activity driven by increased serum T3 (11). After return to euthyroidism, the organic acid levels declined, and likely reflect a reduction in TCA cycle flux.
The main limitation of this study is the small number of subjects with specific demographic and clinical features. In particular, this study included only hyperthyroid Chinese women with Graves' disease, and none of them were obese, resulting in a relatively homogenous group of subjects. Pre-existing obesity and a diagnosis of Graves' disease have been shown to affect weight gain associated with treatment of hyperthyroidism, and could potentially have downstream metabolic consequences (40,41). Ethnicity also has been shown to modify the relationship between weight changes and insulin resistance (42). In addition, serum adipokines such as leptin and adiponectin can exhibit sexual dimorphism (43).
The subjects in this study generally took longer than usual to reach euthyroidism. Of note, seven subjects in this study required more than one year to reach euthyroidism, despite initial high doses of antithyroid drug treatment (carbimazole 20–30 mg per day or equivalent propylthiouracil doses) and close monitoring during the course of the study. This study defined euthyroidism as normalization of both fT4 and TSH. In the largest study, which detailed TSH recovery timeline in 167 patients with Graves' disease treated with antithyroid drugs, the interval between start of treatment and recovery of serum TSH was 8.7 ± 5.9 months (44). This was similar to the duration for TSH normalization in the present study. A recent meta-analysis using pooled data from five studies found that although the majority of patients are expected to achieve a normal TSH by six months of treatment, a proportion will continue to have TSH suppression up to 12 months and beyond (45). The exact reasons for this are unknown, but may be related to persistence of thyroid autoimmunity (44,46). While it is possible that there could be other factors contributing to the metabolic changes, thyroid function was determined at regular intervals, and metabolic parameters were measured shortly after thyroid function normalization in this study, providing an account of the clinical, anthropometric, and metabolic changes during transition from medically treated hyperthyroidism to euthyroidism.
Conclusions
The results of this study show that the recovery from hyperthyroidism in Graves' disease is characterized by weight gain and an increase in fat mass. These changes are accompanied by a reduction in resting energy expenditure and a shift from fat oxidation to increased reliance on carbohydrate as fuel for energy balance. fT3 levels, regarded as a proxy for the severity of Graves' disease, were closely related to resting energy expenditure. The serum metabolomics profile of these subjects complemented these whole-body physiologic and metabolic findings, and supports the role of thyroid hormones in mitochondrial biogenesis. These findings are consistent with an overall reduction in fatty acid β-oxidation and TCA cycle flux after return to euthyroidism. There were no changes in the fat-free mass, branched chain amino acid levels, or insulin resistance during recovery from hyperthyroidism. The results also suggest that the regulation of food intake; energy balance, and metabolic parameters in hyperthyroidism do not appear to be mediated by leptin or adiponectin. Whether all these parameters change after a more prolonged euthyroid recovery period (e.g., three to six months after achieving euthyroidism) remains to be determined by well-designed longitudinal studies.
Lastly, these studies provide a comprehensive and integrated picture of the parallel physiological and metabolic changes that occur during the transition from hyperthyroidism to euthyroidism, and provide new insights into the clinical features and management of hyperthyroidism.
Footnotes
Acknowledgments
The authors would like to thank Ms. Vieon Wu Aini, Ms. Valerie Lai Jia Hui, and Ms. Nur Ain Salleha Binte Abdul Razak for their contributions to this study as research coordinators; Mr. Ching Jianhong and the staff of the Duke-NUS Metabolomics Facility for their expert technical assistance; and Mohamad Na'im M Ayob of the Singapore Institute for Clinical Sciences (SICS), A*STAR, for his kind assistance on the dietary analyses of this study. This study was supported by Singhealth Foundation Grant (Grant Number: SHF/FG541S/2011).
Author Disclosure Statement
The authors have nothing to disclose.