
Abstract
Background:
In recent years, long non-coding RNAs (lncRNAs) have been shown to play a critical regulatory role in cancer biology. However, the contribution of lncRNAs to papillary thyroid cancer (PTC) remains largely unknown.
Methods:
RNA sequencing and quantitative reverse transcription polymerase chain reaction were used to detect and verify changes to the transcriptome profile in 12 PTC tissues compared to paired normal adjacent tissues. The statistical correlation between differentially expressed lncRNAs and clinicopathologic characteristics was analyzed, and potential lncRNA functions were predicted by examining annotations for the co-expressed mRNAs. Furthermore, the specific subgroup patterns of the PTC transcriptome remodeled by BRAF mutations were also analyzed.
Results:
A total of 188 lncRNAs and 505 mRNAs were differentially expressed in 50% or more of the PTC tissues (fold change >2; p < 0.05) as assessed by RNA-sequencing compared with paired normal adjacent tissues. Forty-seven lncRNAs and 39 mRNAs were verified in 31 pairs of PTC specimens using quantitative reverse transcription polymerase chain reaction, and the results were consistent with the RNA sequencing data. The lncRNAs NONHSAT076747 and NONHSAT122730 were associated with lymph node metastasis, and NONHSAG051968 expression was negatively correlated with tumor size. A co-expression network between differentially expressed lncRNAs and protein-coding RNAs was constructed and analyzed, and functional analysis suggested that the differentially expressed genes mainly participate in ECM–receptor interactions and the focal adhesion pathway. Furthermore, a specific PTC transcriptome subtype pattern stratified by BRAF mutation was also uncovered. The p53 signaling pathway was the most highly enriched pathway among the BRAF mutation-related genes.
Conclusions:
This study reveals specific changes to the lncRNA profile associated with PTC, and provides new insight into its pathogenesis. The PTC-associated lncRNAs NONHSAG051968, NONHSAT076747, and NONHSAT122730 might be potential diagnostic and therapeutic targets for PTC patients, and lncRNAs with subtype-specific expression stratified by BRAF mutation might be significant in individual molecular subtypes.
Introduction
T
Recently, studies have shown that a larger part of the genome is transcribed into non-coding RNAs (ncRNAs) than protein-coding RNAs (17,18). Long non-coding RNAs (lncRNAs), tentatively defined as ncRNAs >200 nt in length, are characterized by complex and diverse sequences and mechanisms of action (19). Multiple studies have indicated that increasing numbers of lncRNAs might play significant roles in a variety of biological processes through complicated mechanisms (17,20,21). Notably, differences in lncRNA levels have also been shown to cause aberrant gene expression contributing to carcinogenesis and progression in a variety of human tumors, such as hepatocellular carcinoma (22,23), prostate cancer (24,25), gastric carcinoma (26), ovarian endometriosis (27), and melanoma (28). Some thyroid cancer–associated lncRNAs have also been identified in recent years, including PTCSC1 (29), PTCSC2 (30), PTCSC3 (31), and NAMA (32).
For more than a decade, considerable progress has been made in understanding lncRNA biology, but the contribution of genome-wide changes to lncRNA expression to PTC remains unknown. The development of high-throughput RNA sequencing (RNA-seq) has allowed unprecedented large-scale transcriptome analysis by providing accurate, sensitive, and efficient assessments of transcript sequences and expression levels (33,34). In this study, changes in the transcriptome profiles were examined with RNA-seq in a discovery set of 12 pairs of PTC tissues and with quantitative reverse transcription polymerase chain reaction (qRT-PCR) in a validated set of 31 pairs of PTC tissues. Next, the association of lncRNAs with clinicopathologic characteristics was analyzed. The functions of the lncRNAs were predicted by examining the annotations and the corresponding pathways of the co-expressed mRNAs. In addition, a specific gene aberration pattern in the PTC transcriptome was observed in a subgroup of tumors harboring a BRAF mutation.
Materials and Methods
Ethics and tissue collection
This study was approved by the human ethics committee of the First Affiliated Hospital of Zhejiang University, Zhejiang, China. The patients recruited in this study agreed to the collection of thyroid cancer and normal adjacent tissues and of clinical data to study the genetic pathogenesis of thyroid malignancies. Written informed consent with a signature was obtained from each patient.
A total of 38 paired, fresh-frozen tissue samples (cancer and paired normal adjacent tissues) were collected from Chinese PTC patients undergoing surgery for thyroid cancer from October 2012 to March 2013 at the Department of Surgical Oncology, The First Affiliated Hospital, Zhejiang University, China. Paired normal adjacent tissues were collected by curettage at the same time as cancer tissue collection. All of the tissues were frozen in liquid nitrogen within 30 min of resection and stored at –80°C. The patients did not receive any other forms of therapy. Diagnosis of all of the PTC cases was histologically confirmed by two independent pathologists, and all of the tumor tissues were assessed by hematoxylin and eosin (H&E) staining. Of the PTC cases, 12 paired samples (the RNA-seq group) were randomly selected as a discovery cohort for RNA-seq, and 31 (the validation group) were selected as a validation cohort for qRT-PCR. Five of the patients (T4, T8, T9, T15, and T24) were included in both cohorts. All the clinicopathologic characteristics of the patients are summarized in Table 1.
Five patients were repeated in the Discovery set and in the Validation set.
PTMC is defined as PTC ≤1 cm in diameter.
RNA-Seq, RNA sequencing; qPCR, quantitative polymerase chain reaction; AJCC, American Joint Committee on Cancer; PTMC, papillary thyroid microcarcinoma; PTC, papillary thyroid carcinoma.
Cell culture and transfection
The human PTC-derived cell line KAT5 was a kind gift from Dr. Yang Ankui (Sun Yat-Sen University Cancer Center, Guangzhou, China). KAT5 was routinely cultured at 37°C in RPMI 1640 medium with 10% fetal bovine serum (FBS) and 5% carbon dioxide. A dish of cells was collected for the DNA extraction and BRAF mutation detection.
Cells were transfected 24 h after plating 5 × 10⁵ cells/well in six-well plates, with NC-siRNA and BRAF-specific siRNAs (siRNA1: SASI-HS01-00107705; siRNA2: SASI-HS01-00107704; siRNA3: SASI-HS01-00107703) purchased from Sigma-Aldrich (St. Louis, MO), using Lipofectamine™ 2000 reagent (Invitrogen, Carlsbad, CA) according to the manufacturer's protocol. Transfection was done using 7 μL of Lipofectamine 2000 and 8 μL 20 μM of siRNA. Blank control cells were transfected with RNase free H2O. The cells were collected for RNA extraction and qRT-PCR 48 h after transfecting.
RNA and DNA preparation
Total RNA was extracted from 100 mg of tissue or one well of cells using Trizol (Invitrogen). The aqueous phase of the sample was isolated for RNA extraction, and the interphase or organic phenol-chloroform phase was used for DNA extraction according to the manufacturer's protocol. Then, the RNA was eluted with 100 μL of nuclease-free water. The RNA yield was determined using a Qubit 2.0 or NanoDrop ND1000 (Thermo Fisher Scientific, Waltham, MA), and RNA integrity was assessed with an Agilent 2100 Bioanalyzer (Agilent Technologies, Santa Clara, CA). Only RNA samples with an RNA integrity number (RIN) >8 were used for sequencing.
cDNA library preparation and sequencing
The cDNA libraries were constructed using the TruSeq Stranded mRNA Library Prep Kit (Illumina, Inc., San Diego, CA), following the manufacturer's instructions. In brief, poly-A mRNAs were purified using oligo-dT beads from 5 μg of total RNA from each sample and broken into small fragments with divalent cations at an elevated temperature. The cleaved RNA fragments were reverse transcribed into first-strand cDNA, which was followed by second-strand cDNA synthesis. Short double-stranded cDNA fragments were purified with a QIA quick PCR extraction kit (Qiagen, Shanghai, China) and eluted with elution buffer for end repair. After end-repair processing, a single “A” base was added to the 3′ end of the cDNA fragments, and the fragments were ligated into Illumina sequencing adapters, size selected using a 2% agarose gel, and enriched by PCR to create the final cDNA library. Finally, the amplified library was sequenced on an Illumina HiSeq™ 2500 sequencing machine.
Raw read filtering and mapping reads to corresponding databases
The sequencer-generated images were converted into nucleotide sequences with a base-calling pipeline. The raw reads were saved in fastq format and removed prior to data analysis. Three criteria were used to filter dirty raw reads: (i) reads with sequence adaptors, (ii) reads with >10% “N” bases, and (iii) low-quality reads with >50% QA ≤10 bases. All of the subsequent analysis was based on clean reads, and the reads were mapped to the human genome (hg19) downloaded from the University of California Santa Cruz genome browser Web site. The transcriptome (GRCh37.3) was downloaded from the NCBI Web site, and the noncode database (NONCODE v4 u1_human) (35) was downloaded from the noncode Web site using Tophat (36).
Analysis of lncRNAs and mRNAs expression differences
First, the lncRNA annotation file (NONCODE v4
Hierarchical clustering analysis
Differentially expressed lncRNAs and genes observed in >50% of the samples were selected for clustering analysis. The lncRNA mean expression levels in the 12 paired samples were subtracted, the distance was calculated using the Euclidean distance, and then a pairwise complete-linkage hierarchical clustering method was calculated for clustering. The results are illustrated with a heat map generated with the R program package “ggplot2.”
Validation of lncRNAs and mRNAs by qRT-PCR
Quantification was performed using a two-step reaction process: RT and PCR. Each RT reaction contained 500 ng of RNA, 2 μL of PrimerScript Buffer, 0.5 μL of random 6-mers, and 0.5 μL of PrimerScript RT EnzymeMix I (Takara Bio, Inc., Otsu, Japan) in a 10 μL total reaction. The reactions were performed in an ABI-Veriti™ PCR System (Applied Biosystems, Foster City, CA) for 15 min at 37°C followed by heat inactivation for 5 sec at 85°C. Then, the 10 μL RT reaction mix was diluted 10-fold in nuclease-free water. Real-time PCR was performed using a ViiA7 real-time PCR system (Applied Biosystems) with an 8 μL PCR reaction mixture that included 0.2 μL of cDNA, 4.1 μL of SYBR Premix Ex Taq™ II (Takara Bio, Inc.), 0.06 μL of ROX Reference Dye II (50 × ), 0.48 μL of forward primer (10 μM), 0.48 μL of reverse primer (10 μM), and 2.88 μL of nuclease-free water. The reactions were incubated in a 384-well optical plate (Roche, Branford, CT) at 95°C for 30 sec, followed by 40 cycles at 95°C for 5 sec and 60°C for 34 sec. At the conclusion of the PCR cycles, a melting curve analysis was performed to validate amplification of the expected PCR product. The primer sequences were designed in the laboratory and synthesized by Invitrogen (Thermo Fisher Scientific, New York, NY). The RNA expression levels were normalized to GAPDH and calculated using the 2-ΔΔCT method. All of the primers sequences used in this study are listed in Supplementary Table S1 (Supplementary Data available online at
Analysis and validation of the association between lncRNAs and clinicopathologic characteristics
According to the clinicopathologic characteristics, the patients in the RNA-seq group or validation group were divided into groups with or without lymph node metastases, PTMC (tumor size ≤1 cm) versus non-PTMC (tumor size >1 cm) group, and BRAF positive or wild type. After analyzing the differential expression profile of the lncRNAs in each paired group, those with a frequency ≥75%, a fold-change ≥2, and p < 0.05 were defined as the relevant lncRNAs. The distribution of these lncRNAs was generated using the online algorithm Venny2.1 (
The above clinicopathologic characteristic–related lncRNAs expression profiles were validated by using qRT-PCR, and the differential expression of the lncRNAs between each paired group was analyzed.
Correlation analysis between lncRNAs and genes
The expression levels of the lncRNAs and the genes in each tissue were used to calculate the correlation coefficient R using the Pearson correlation method. An absolute value of R ≥ 0.80 was considered the threshold for a significant correlation between the lncRNAs and the genes. The co-expression network was established with Cytoscape v3.2.1 (37).
Gene function analysis
Genes that were dysregulated in >50% of the tumors were chosen and entered into the Database for Annotation, Visualization and Integrated Discovery (DAVID;
Detection of BRAF mutation
In the discovery cohort, the BRAFV600E mutation was identified by aligning the sequencing reads with the BRAF transcript sequence (NM_004333.4) in the NCBI database.
In the validation set or the KAT5 cell line, the protocol was followed as described above for RNA preparation, and the interphase or organic phenol-chloroform phase was isolated for DNA extraction according to the manufacturer's protocol. A 223-bp fragment was amplified using the primers for BRAF (40) (Supplementary Table S1) and Pfu DNA Polymerase (Promega, Madison, WI) according to the protocol. GADPH was used as an internal control. The PCR products were visualized by electrophoresis on a 1.5% agarose gel, and then resolved, purified, and sequenced with Sanger sequencing by Invitrogen (Thermo Fisher Scientific). The sequencing results were compared with the BRAF sequence (NG_007873.3) in the NCBI database.
Western blot analysis
Cells were lysed in RIPA Buffer (#9806) from Cell Signaling Technology (Danvers, MA), and analyzed quantitatively with the Pierce BCA Protein Assay Kit (Thermo Fisher Scientific). Total cellular proteins were resolved on denaturing polyacrylamide gels, transferred to PDVF membranes, and blotted with specific primary antibodies for BRAF (ab33899; Abcam, Cambridge, United Kingdom) or GAPDH (#2118; Cell Signaling Technology). The antigen–antibody complexes were visualized using the Immobilon™ Western Chemiluminescent HRP Substrate (Millipore Corp., Billerica, MA) after further incubation with a HRP conjugated secondary antibody (HuaAn Biotechnology Limited Company, Hangzhou, China).
Statistical analysis
The statistical significance of the RNA-seq data was analyzed by fold change; a fold change ≥2.0 and a p-value of <0.05 were considered statistically significant. Other statistical analyses were performed using SPSS v17.0 software (SPSS, Inc., Chicago, IL). Clinicopathologic data are presented with descriptive statistical analysis. For comparisons, a Student's t-test, Fisher's exact test, and nonparametric test were performed as appropriate, and a p-value of <0.05 was considered statistically significant. A Pearson correlation was performed to identify the lncRNA correlation with the co-expressed mRNAs.
Results
RNA-seq analysis of lncRNA expression changes in PTC
RNA-seq was performed on 12 PTC tissue samples and paired normal adjacent tissue samples using the IlluminaHiseq 2500. The details of the experiment were as follows: the library size was approximately 200 bp, the average read length was 100 bp, and the sequencing strategy was 2 × 100 bp pair-end sequencing with an average genome sequencing depth of 1.43×. The average transcriptome coverage was 52.6%, and the average lncRNA coverage was 27.6%. The transcript location and coverage map is shown in Figure 1A. Approximately 1 billion (977,500,364) clean reads were generated for the 12 paired samples, averaging 41 million (40,729,182) reads for each specimen. The average numbers alignment reads of the genome, gene, and ncRNA per sample was 30 million (29,900,992), 27 million (26,871,538), and 17 million (16,747,508), respectively. The read statistics are provided in Supplementary Table S2. Briefly, 73.4% of the clean reads were aligned. For each individual sample, approximately 42% of all of the annotated genes, 40% of the mRNA transcripts, and 27% of the ncRNAs were identified.
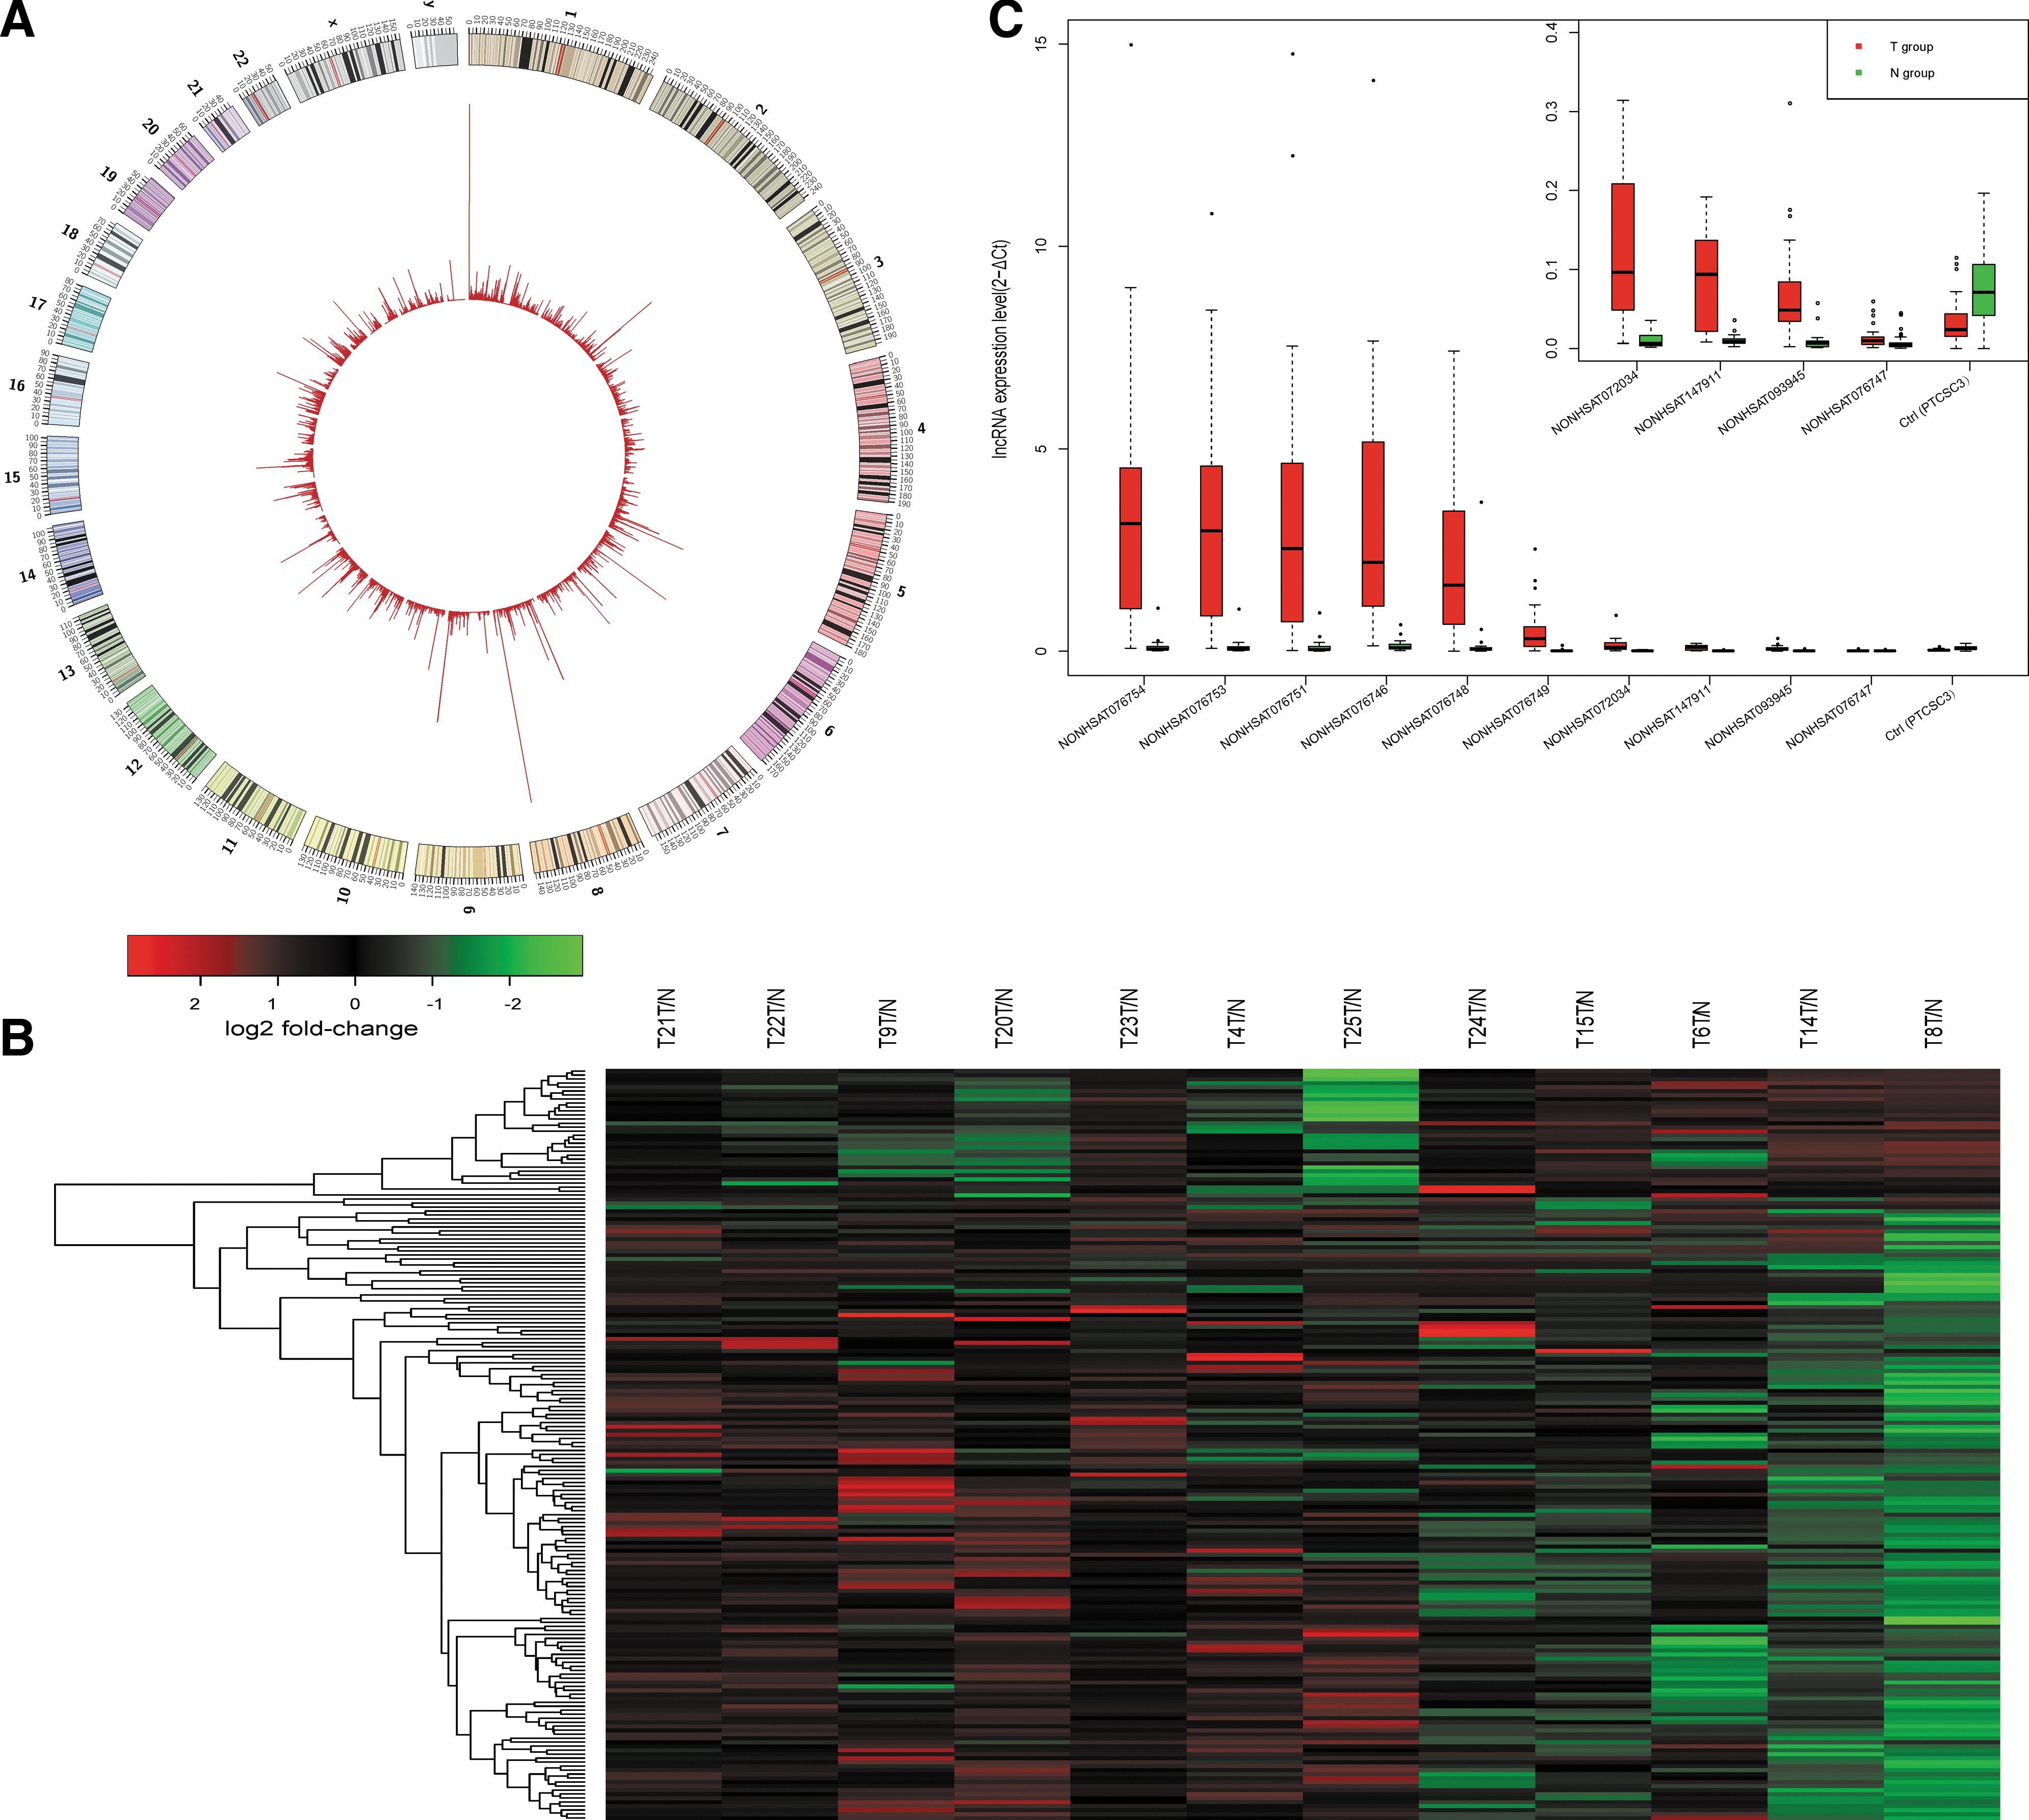
RNA sequencing (RNA-seq) analysis of the lncRNA expression profiles in papillary thyroid carcinoma (PTC). (
Transcriptional profile of lncRNAs in PTC
Genetic changes are the driving force of thyroid tumorigenesis and progression, and lncRNAs are critical for correct genomic function and gene expression (17). It was hypothesized that PTC harbor disease-associated lncRNAs profiles that are specific for molecular subtypes, similar to other cancers. To validate this hypothesis, transcriptome sequencing was applied to a discovery cohort of 12 pairs of PTC and normal adjacent tissues. Compared with the paired normal adjacent tissues, 188 lncRNAs were expressed differentially (fold change ≥2.0, p < 0.05; Supplementary Table S3) in ≥50% (6/12) of the PTC tissues. The heat map of differentially expressed lncRNAs shown in Figure 1B was generated using hierarchical clustering analysis. Among them, 157 lncRNAs were upregulated, and 31 lncRNAs were downregulated. NONHSAG030449 and NONHSAG051310 (failed to pass the verification) were upregulated in all (12/12) of the PTC tissues, whereas NONHSAG051968, NONHSAG018271, and NONHSAG007951 were downregulated in 8/12 PTC tissues. The top 72 lncRNA transcripts (45 lncRNA genes) were selected according to their p-values, and their expression was validated by qRT-PCR, which demonstrated that 47/72 (65.3%) of the lncRNA transcripts were differentially expressed in a similar pattern to the RNA-seq results (up- or down-regulated) with statistical significance (p < 0.05). The expression of PTCSC3 was used as a positive control (Fig. 1C and Supplementary Table S4).
Relationship of differentially expressed lncRNAs and clinicopathologic characteristics of PTC
The biological behavior of PTC varies widely from indolent microcarcinomas that grow slowly and exhibit little or no invasion to invasive tumors. The association of lncRNA expression and various clinicopathologic characteristics was examined, and hundreds of lncRNAs were identified. The various clinicopathologic characteristics are summarized in Table 1. In the RNA-seq group, a total of 117 differentially expressed lncRNAs were only enriched in the lymph node metastasis group compared with 17 lncRNAs in the group without lymph node metastasis, as shown in Figure 2A (upper panel) and Supplementary Figure S1 (fold change ≥2.0, p < 0.05). Furthermore, after verifying the lncRNA expression in the validation group by qRT-PCR, it was found that nine lncRNAs, including NONHSAT076747, NONHSAT122730, and NONHSAT061051, were associated with lymph node metastasis (p < 0.05; Fig. 2B and Supplementary Table S5). Similarly, a skewed distribution was observed with 99 differentially expressed lncRNAs only in the non-PTMC group and 26 lncRNAs in the PTMC group (Fig. 2A, bottom panel; fold change ≥2.0, p < 0.05). Moreover, 18 lncRNAs were identified, including NONHSAT076751, NONHSAT076754, and NONHSAT144479, that were associated with non-PTMC (p < 0.05; Supplementary Table S6). Since the PTMC group and non-PTMC group were divided based on tumor size, the correlation between tumor size and lncRNA expression was further explored using Pearson correlation analysis. Results showed that NONHSAG051968 (NONHSAT130622) expression was correlated with tumor size (Fig. 2C; r = –0.38; p < 0.05) and the expression of some protein-coding genes (Fig. 2D; r > 0.8). Among them, SEMA3D and PTPRQ were the most highly correlated genes (R = 0.94 and R = 0.93, respectively). These genes play roles in cellular proliferation and differentiation. However, the concrete function and underlying mechanism behind this expression pattern require further investigation.
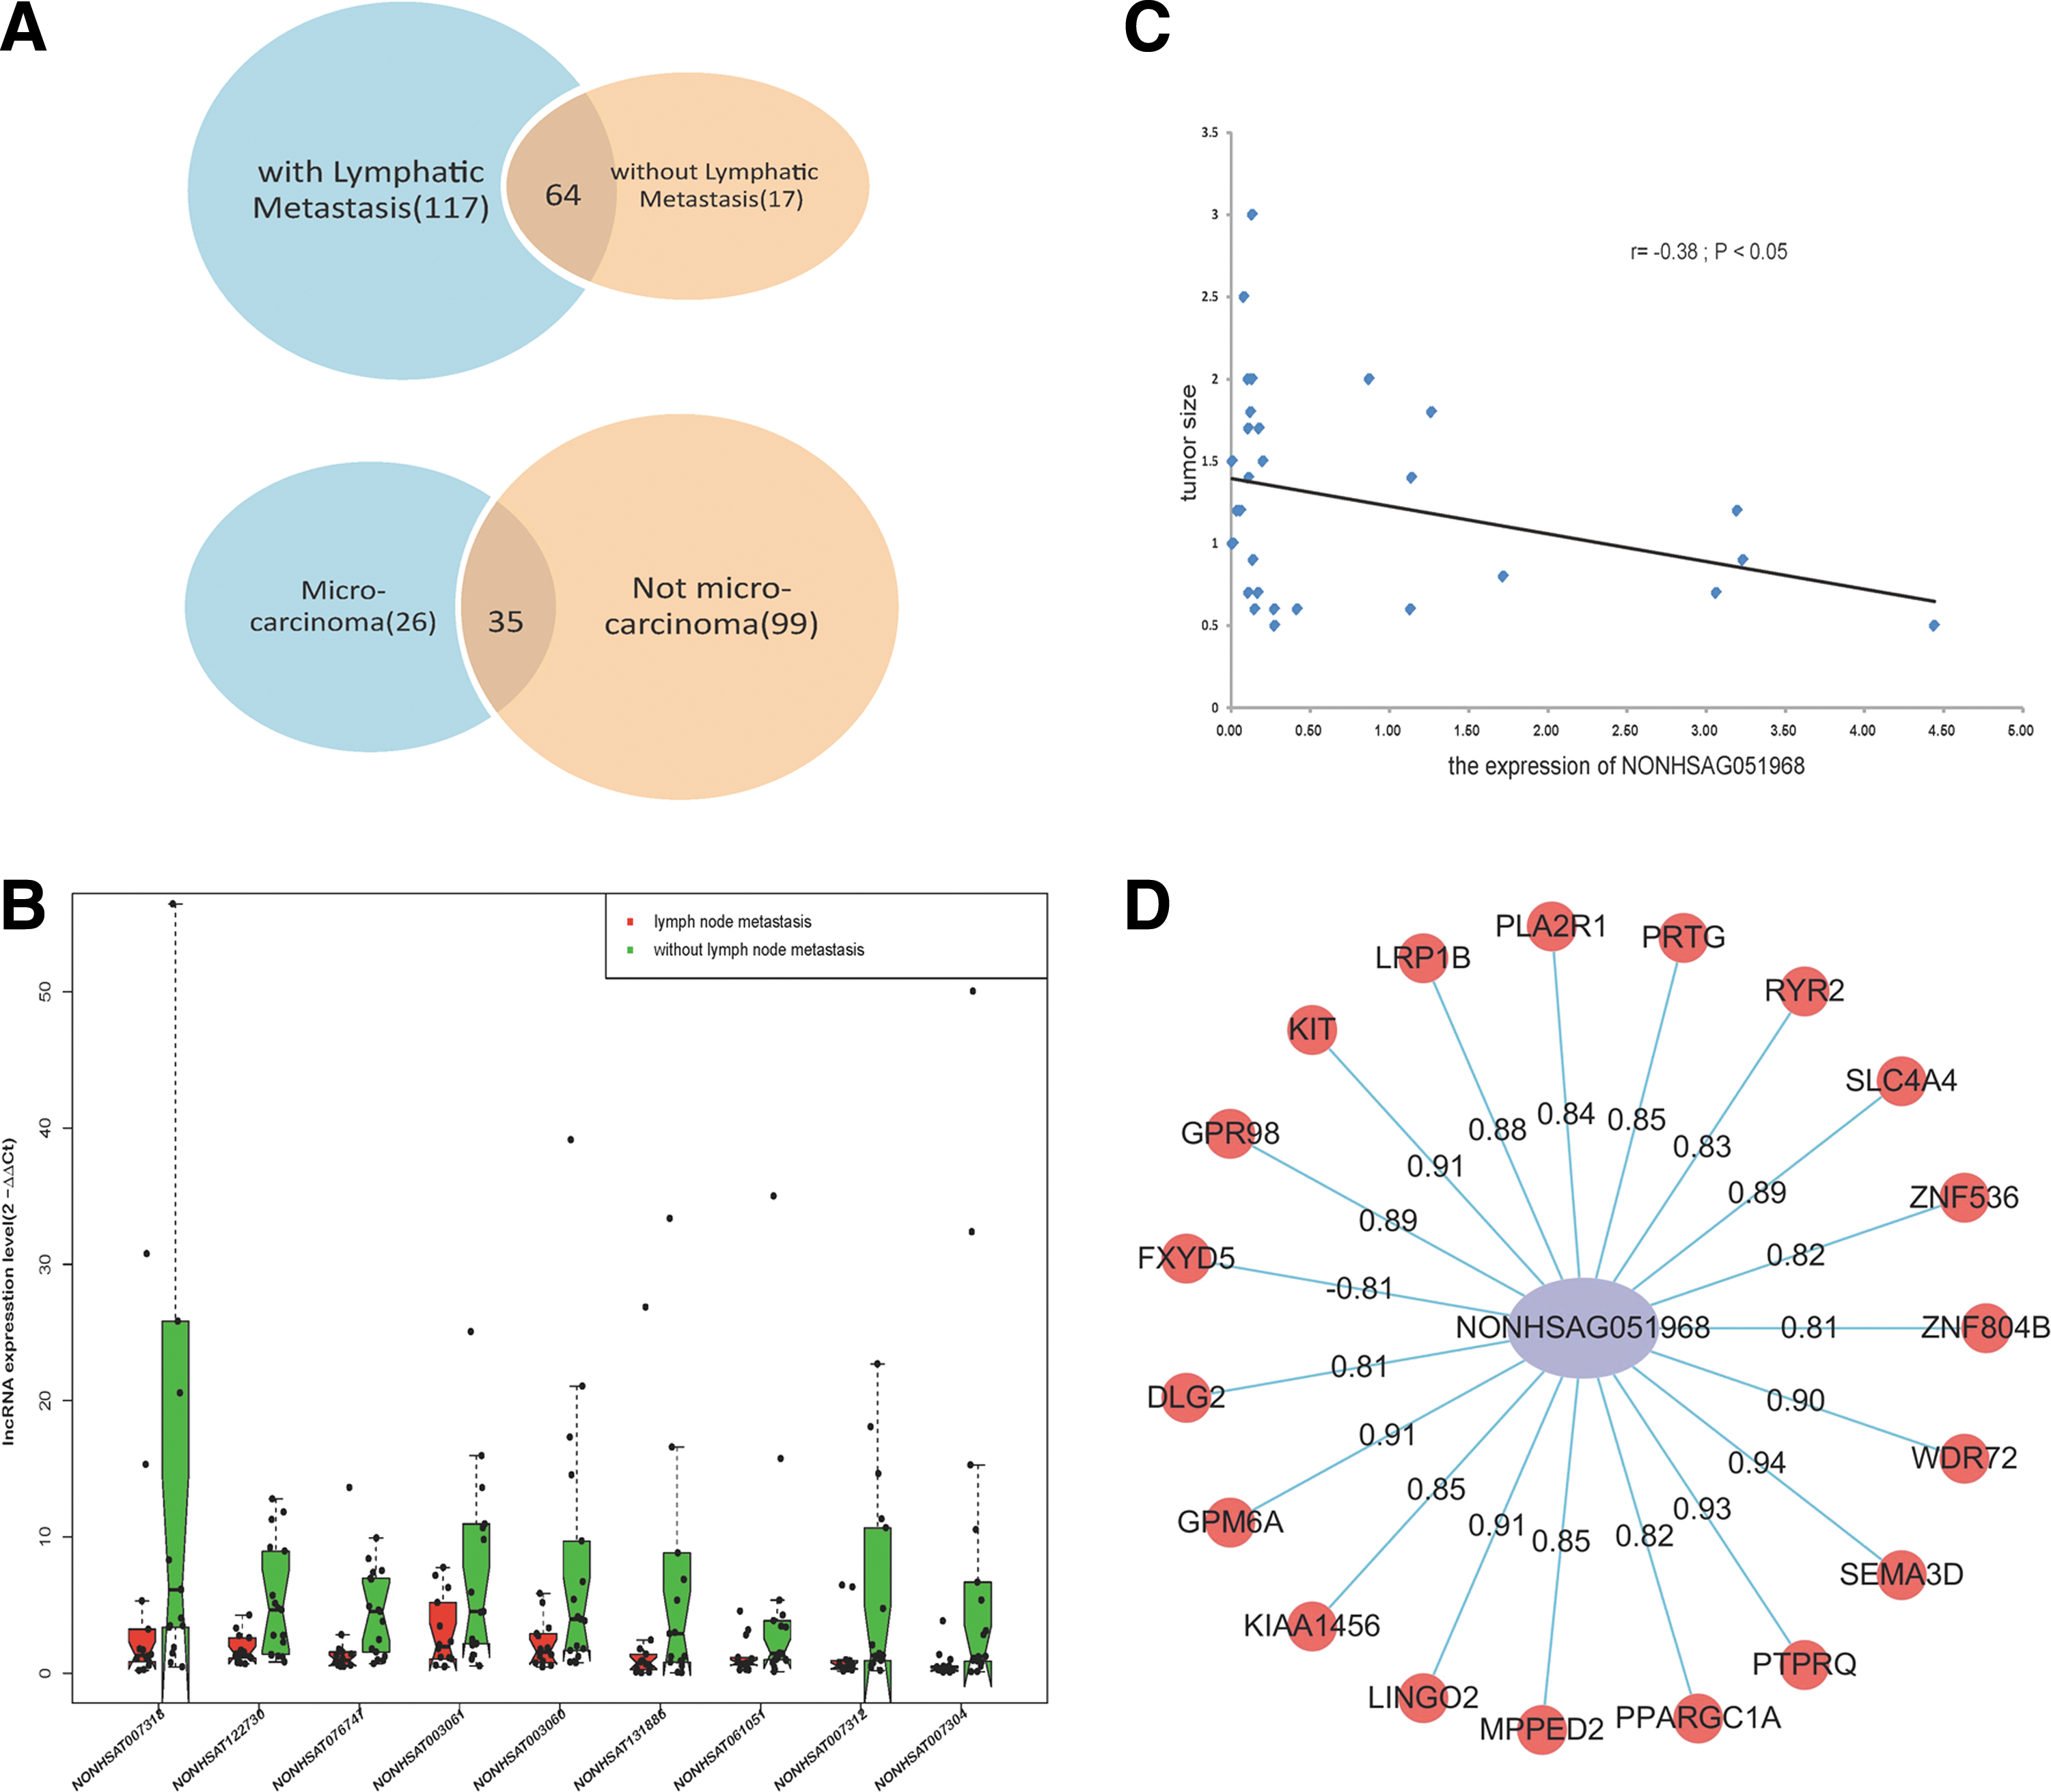
The relationship between lncRNAs and clinicopathologic characteristics in PTC. (
Differentially expressed genes involved in specific molecular pathways
In ≥50% of the patients, 505 mRNAs were differentially expressed, including 426 upregulated genes and 79 downregulated genes (fold change ≥2.0, p < 0.05; Fig. 3A and Supplementary Table S7), using the same method for analysis as used for lncRNAs. SFTPB was upregulated in 12/12 patients, and DPP6 was downregulated in 10/12 tissues.

The differentially expressed genes involved in specific molecular pathways. (
Because the function of lncRNA can be predicted by co-expressed protein-coding genes (27), the expression of co-expressed genes was explored. All 505 differentially expressed genes were mapped using DAVID (38,39), and the KEGG pathway was applied to analyze the potential functions of these genes. The results show that these genes were mainly associated with 10 pathways, as shown in Figure 3B (p < 0.05), especially the ECM–receptor interaction and focal adhesion pathways (Fig. 3C, upper and middle panel; p < 0.05, FDR <0.05). The numbers of differentially expressed cell adhesion and focal adhesion genes were 18 and 21, respectively, and 60 of the genes that are represented in these pathways were validated by qRT-PCR. Thirty-nine of the genes were expressed differentially in tumor tissues compared with paired normal adjacent tissues (p < 0.05; Fig. 3D and Supplementary Table S8). These results were consistent with the RNA-seq data and the study by Huang et al. (41), which identified adhesion and extracellular matrix molecules dysregulated in a genetic profile of PTC.
Co-expression profile for lncRNAs and mRNAs
LncRNAs play a critical role in transcriptional regulation (20,42), and their functions have been predicted based on the functional annotations of co-expressed protein-coding genes (43,44). The correlation between 188 dysregulated lncRNAs and 505 differentially regulated protein-coding genes was analyzed to predict the potential function of these lncRNAs. A total of 10,196 connections (absolute value of R > 0.80) were identified between 487 of the protein-coding genes and 187 of the non-coding genes, indicating that most of the lncRNAs were positively correlated with protein-coding gene expression. Furthermore, several key molecules in the above pathways were selected, analyzed, and integrated into a network with their co-expressed lncRNAs. The co-expression network contained 74 network nodes (included 7 coding genes and 67 non-coding genes) and 187 connections (as show in Fig. 4; absolute value of R > 0.80). Among these, NONHSAG043674 correlated most strongly with CDKN1A (also known as p21; R = 0.995).
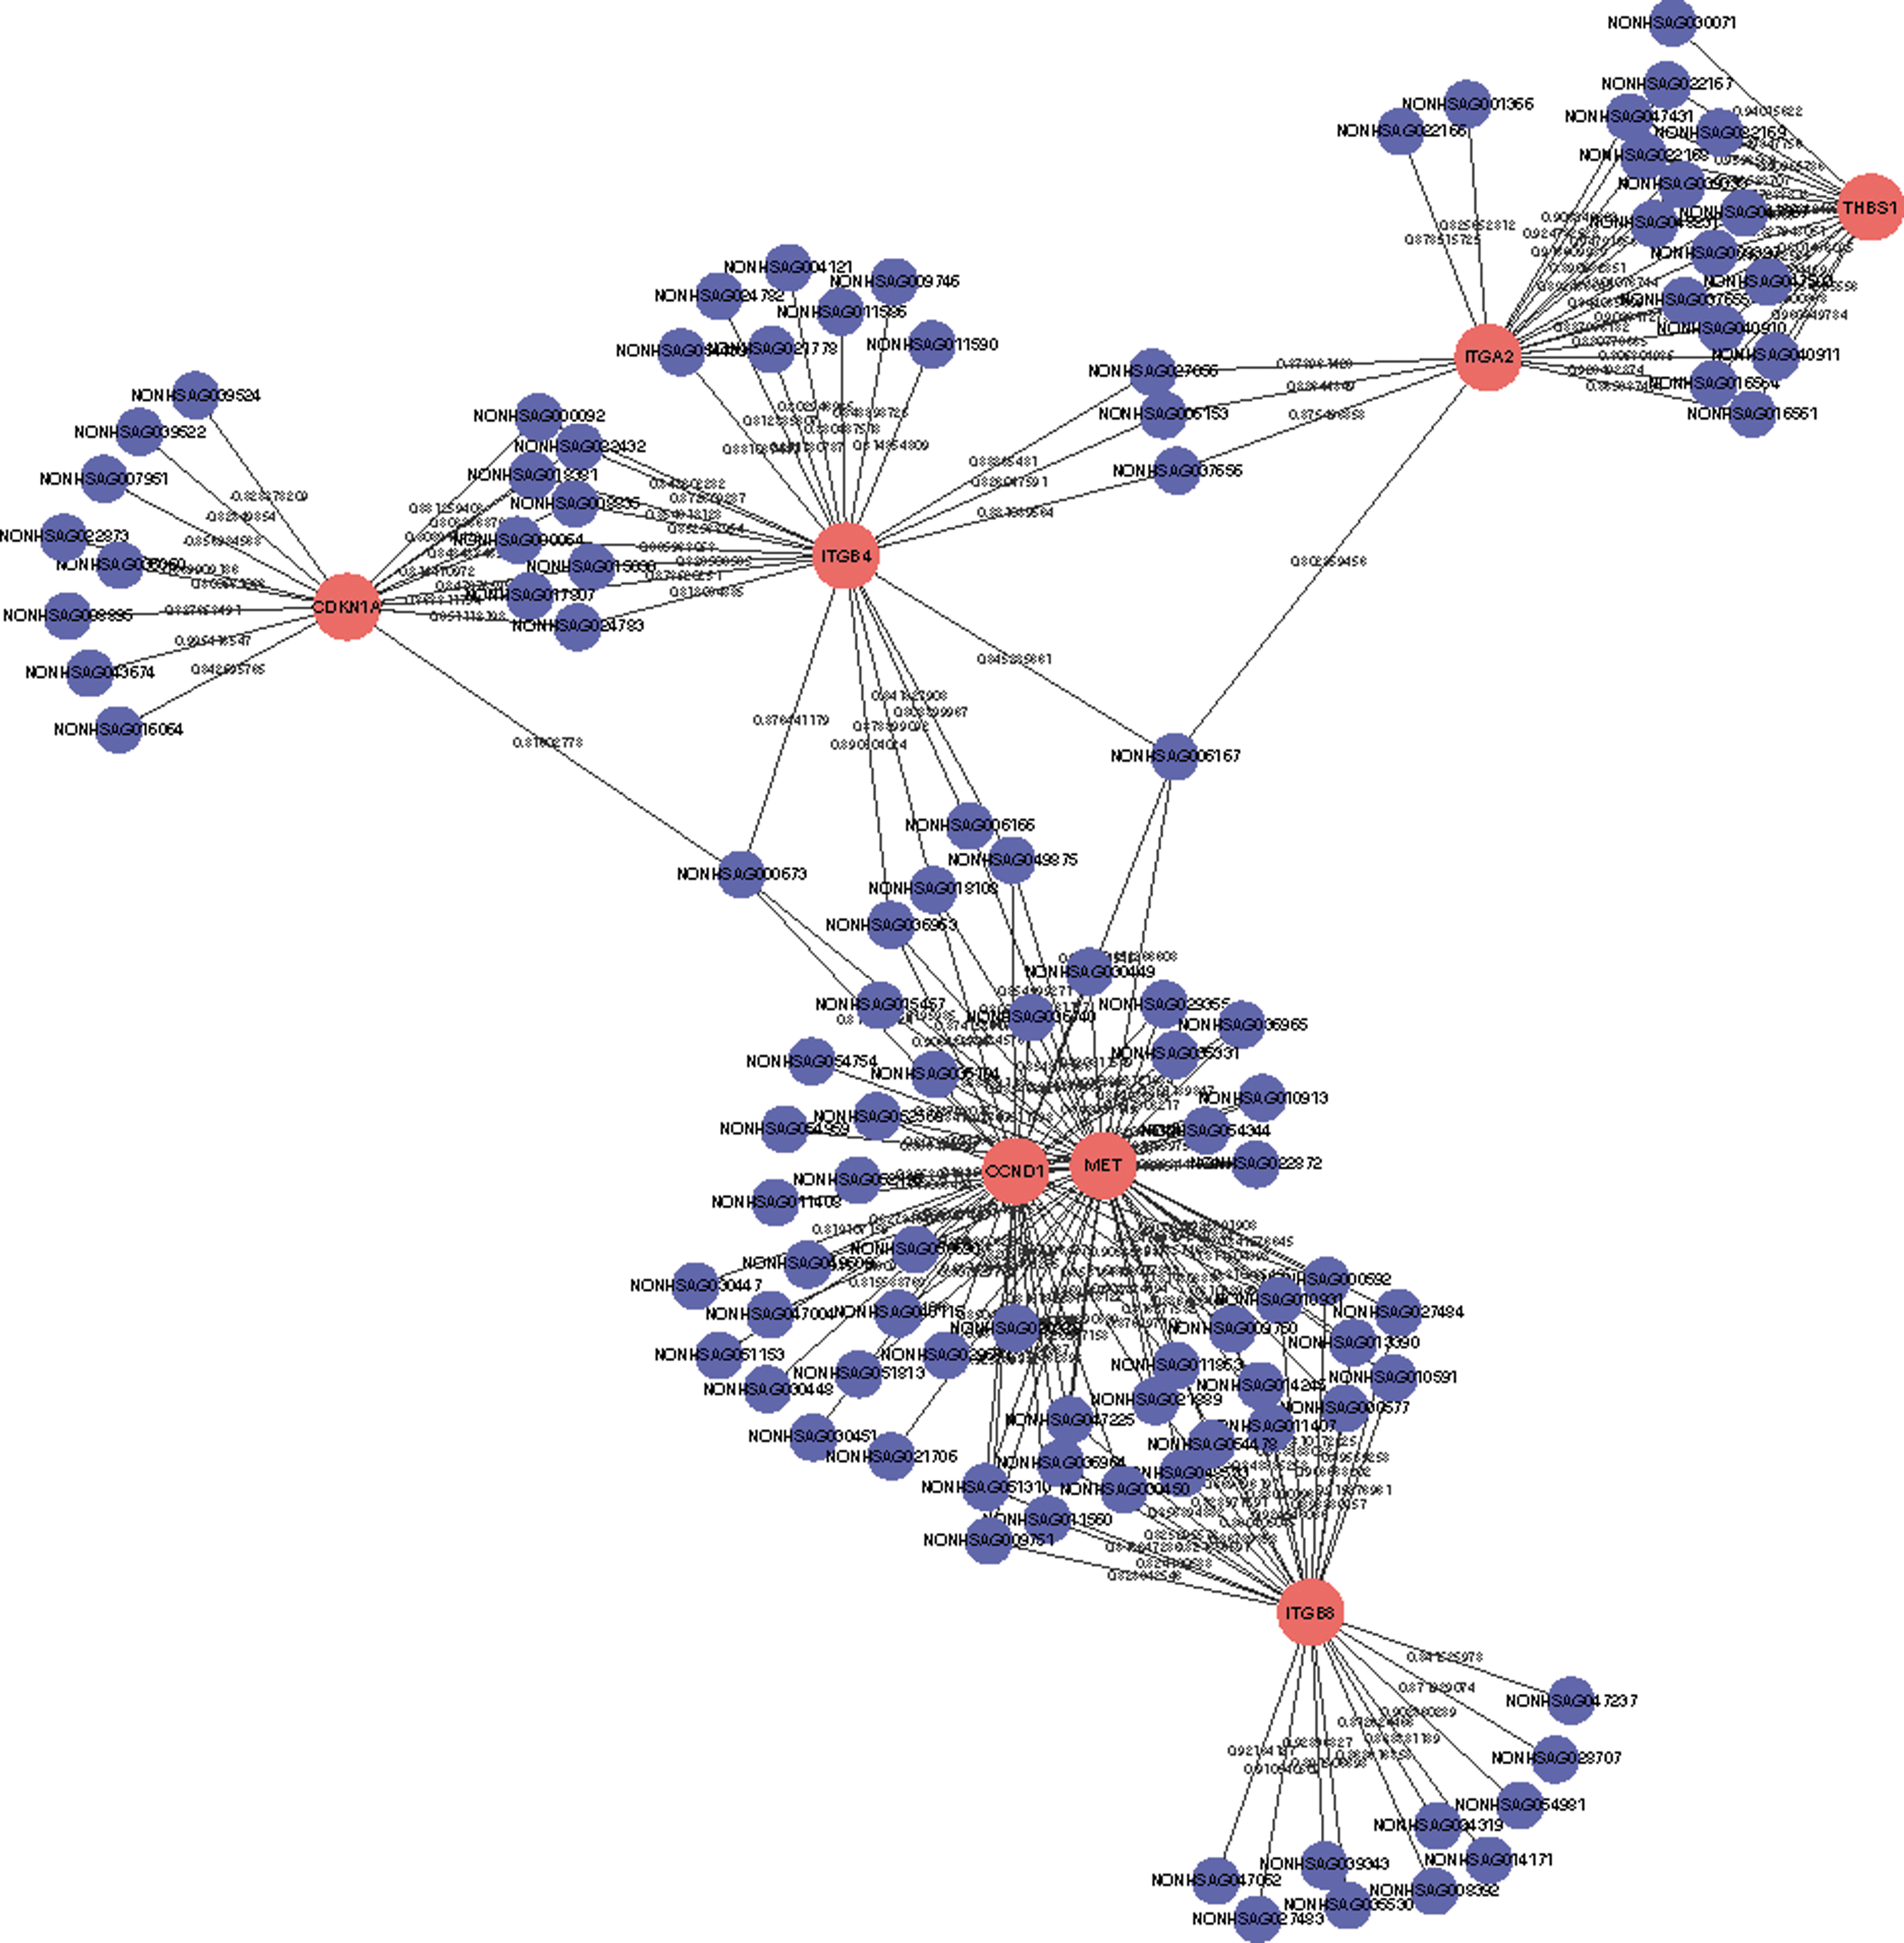
The correlative network between lncRNAs and mRNAs. The co-expression network contained187 connections between seven selective protein-coding genes and 67 co-expressed lncRNAs (absolute value of R ≥ 0.80). This co-expression network suggested that one lncRNA targets four coding genes at most and that one protein-coding gene correlated with 46 lncRNAs at most. The solid red circle represents coding genes, and solid blue circles represent long non-coding RNAs; the edges between them indicate that the coding genes are potentially correlated with the lncRNAs. The edge labels show the correlation coefficient.
lncRNAs stratified by BRAF mutation show a specific subtype pattern
The BRAFV600E mutation has received considerable attention in recent years for its potential in the risk stratification and management of PTC (8,45,46). The recent The Cancer Genome Atlas (TCGA) focused on thyroid cancer using integrated genomic analysis confirmed that BRAF is the predominant driver mutation in PTC and allows a particular molecular subgroup to be distinguished (12). It is essential to determine whether a mutation of BRAF confers a distinct transcriptome profile to PTC. Therefore, the relative influence of the BRAF mutation on lncRNA expression was assessed in 35 pairs of PTC tissues.
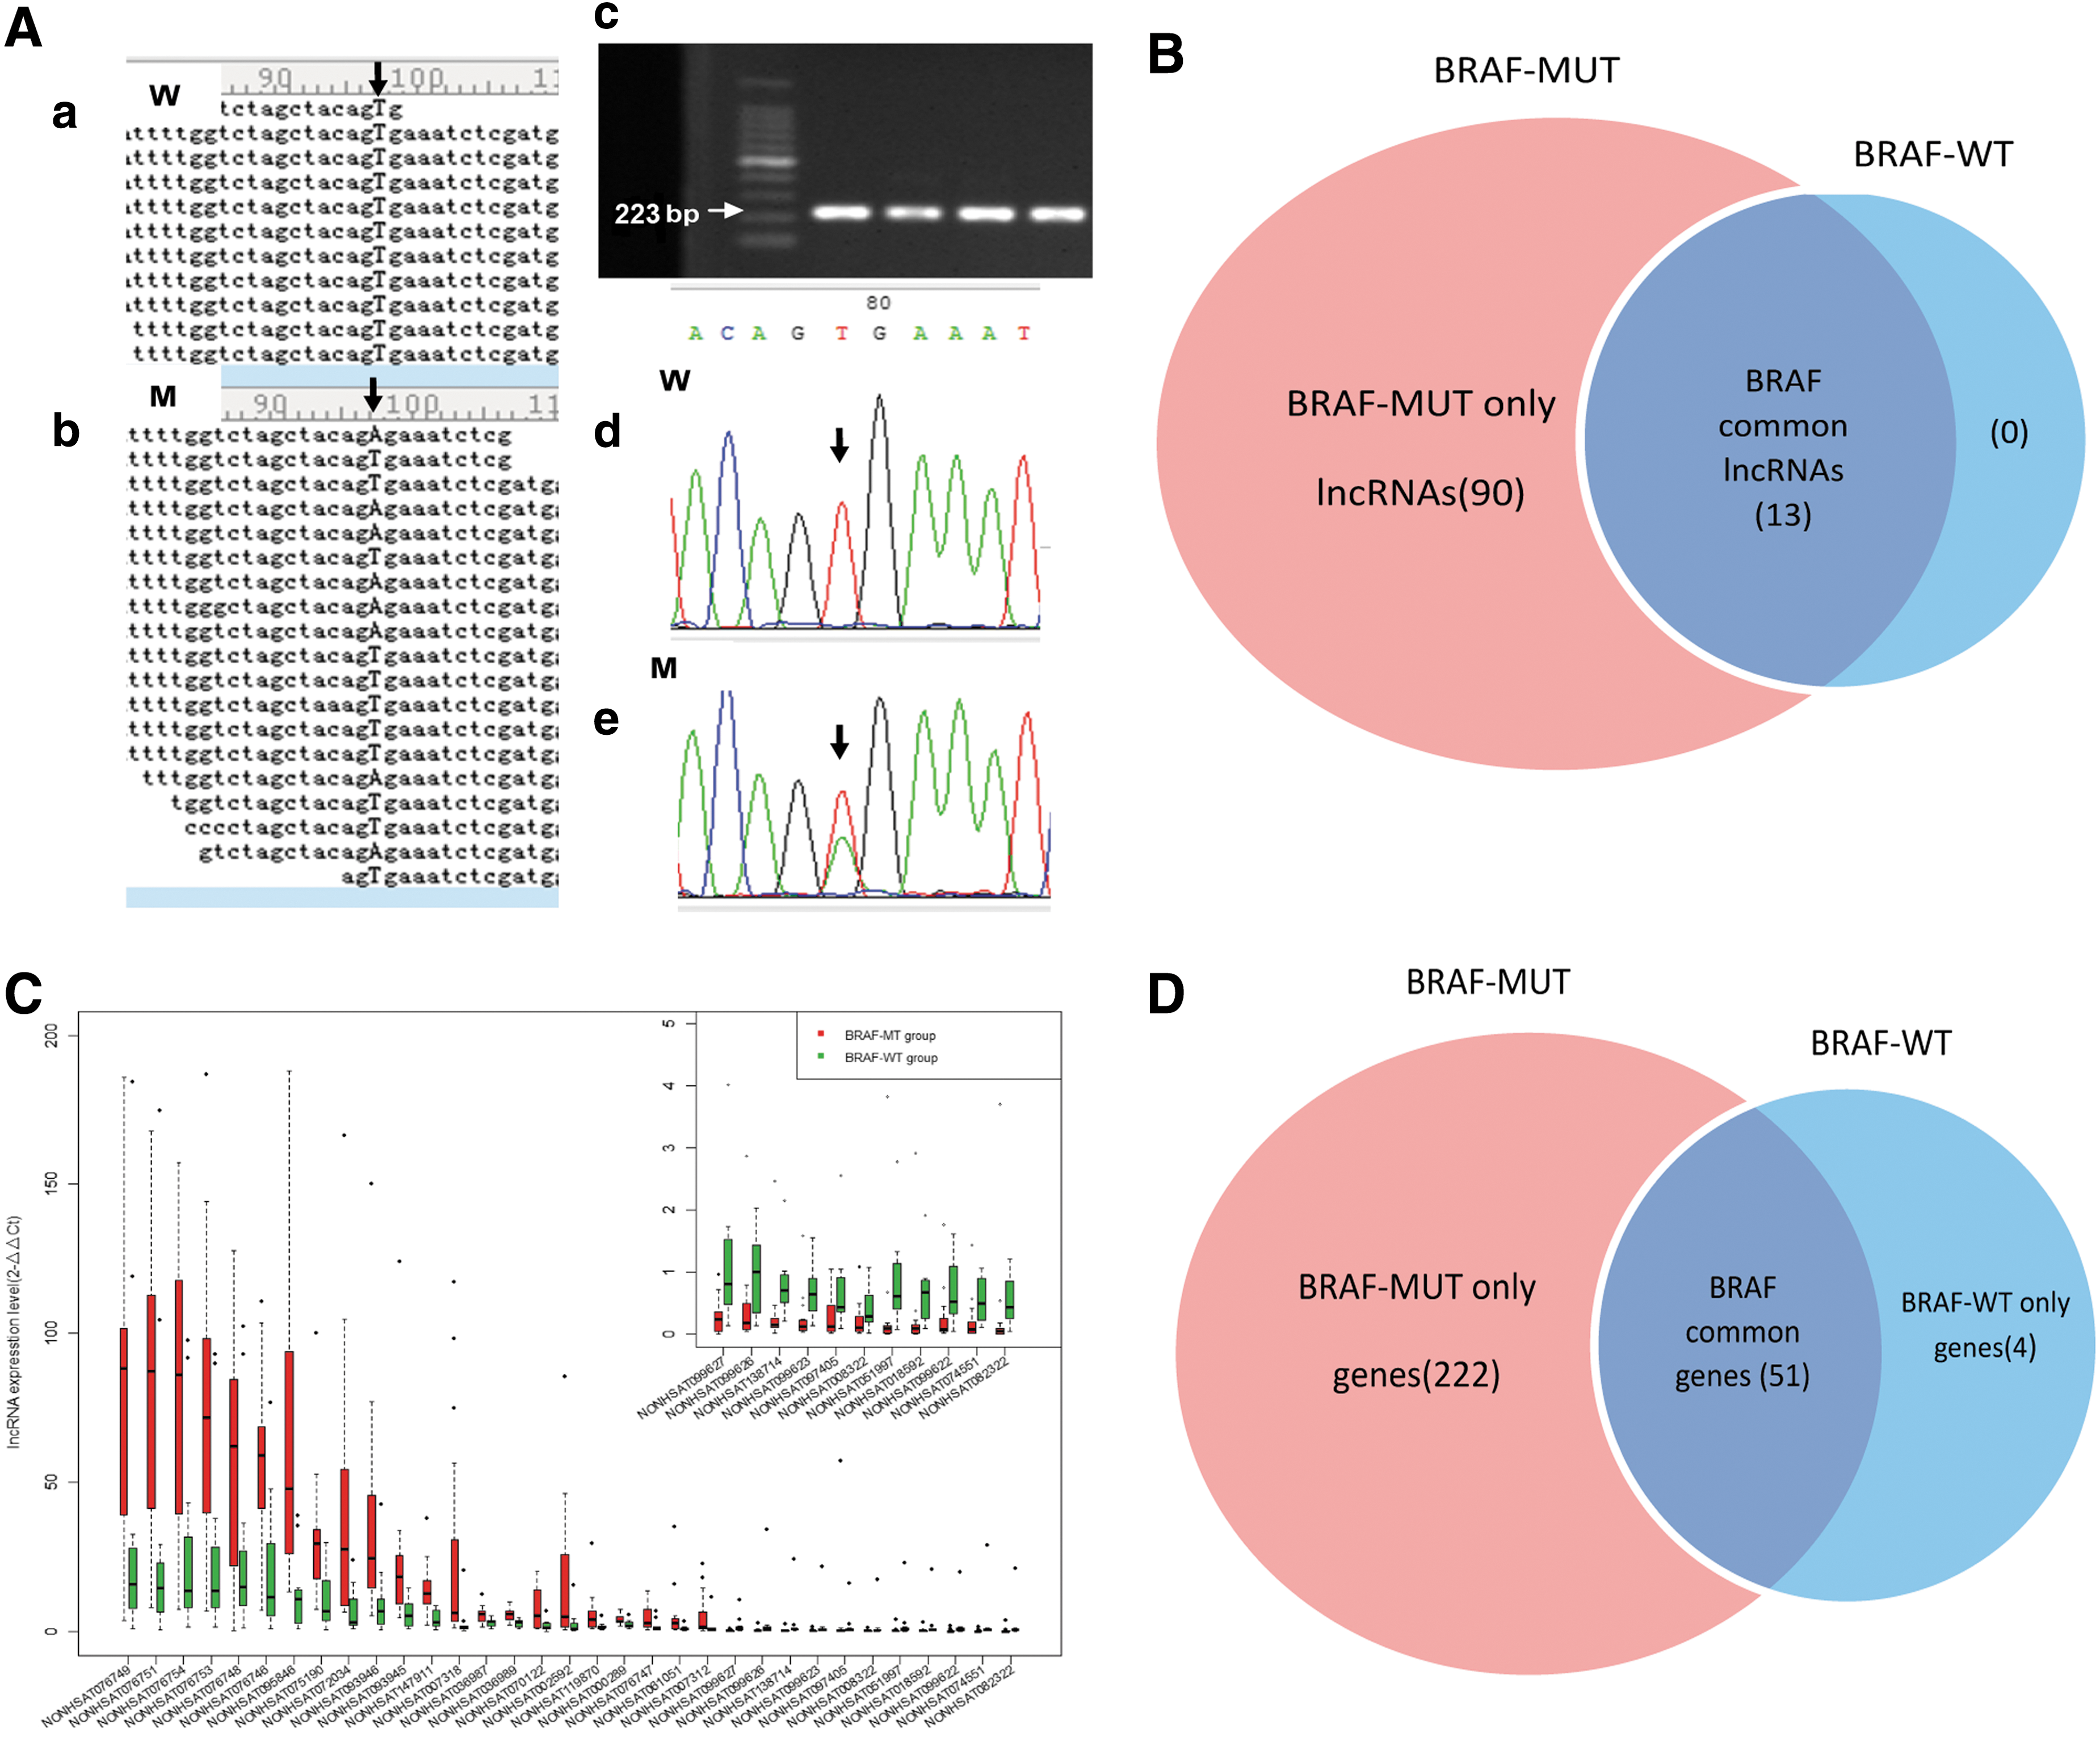
First, in 7 (RNA-seq) and 17 (qPCR) PTC specimens from the discovery and validation set, respectively, the BRAF mutation was detected. These specimens were regrouped into the BRAF mutation (BRAF-MUT) group, whereas the other remaining specimens were classified as the BRAF wild-type (BRAF-WT) group. Three cases (T13, T28, and T31) were excluded because the mutation status was unclear, and no mutation was uncovered in normal adjacent tissues (Fig. 5A and Supplementary Table S9).
LncRNA profile modeled based on the presence of the BRAFV600E
mutation. (
Next, differences in lncRNA expression were analyzed between the two groups. A total of 103 lncRNAs were filtered in 6/7 (85.7%) or more of the BRAF-MUT patients, whereas 13 lncRNAs were observed in 4/5 (80%) or more of the BRAF-WT patients (fold change ≥2.0, p < 0.05), as shown in Figure 5B and Supplementary Figures S1 and S2. Of these lncRNAs, 90 lncRNAs were observed only in the BRAF-MUT group, displaying subtype-specific expression, and were subsequently named BRAF-MUT only lncRNAs. Thirteen of the lncRNAs were common elements observed in both the BRAF-MUT and BRAF-WT groups, and were named BRAF common lncRNAs. None was observed only in the BRAF-WT group. Next, 33 lncRNAs (Fig. 5C) were validated for differential expression using qRT-PCR to compare the BRAF-MUT group with the BRAF-WT group (p < 0.05).
Further, the lncRNAs expression pattern of the PTC cell line KAT 5 was analyzed after BRAF-siRNA interference. The inhibition of BRAF expression by siRNA interference was characterized by qPCR and western blot respectively (Fig. 6B and C). The result shows that most (19/33) of the lncRNAs in the KAT5 cells displayed the same expression trend (Fig. 6D) as in PTC tissue (Fig. 5C) after BRAF-siRNA interference.
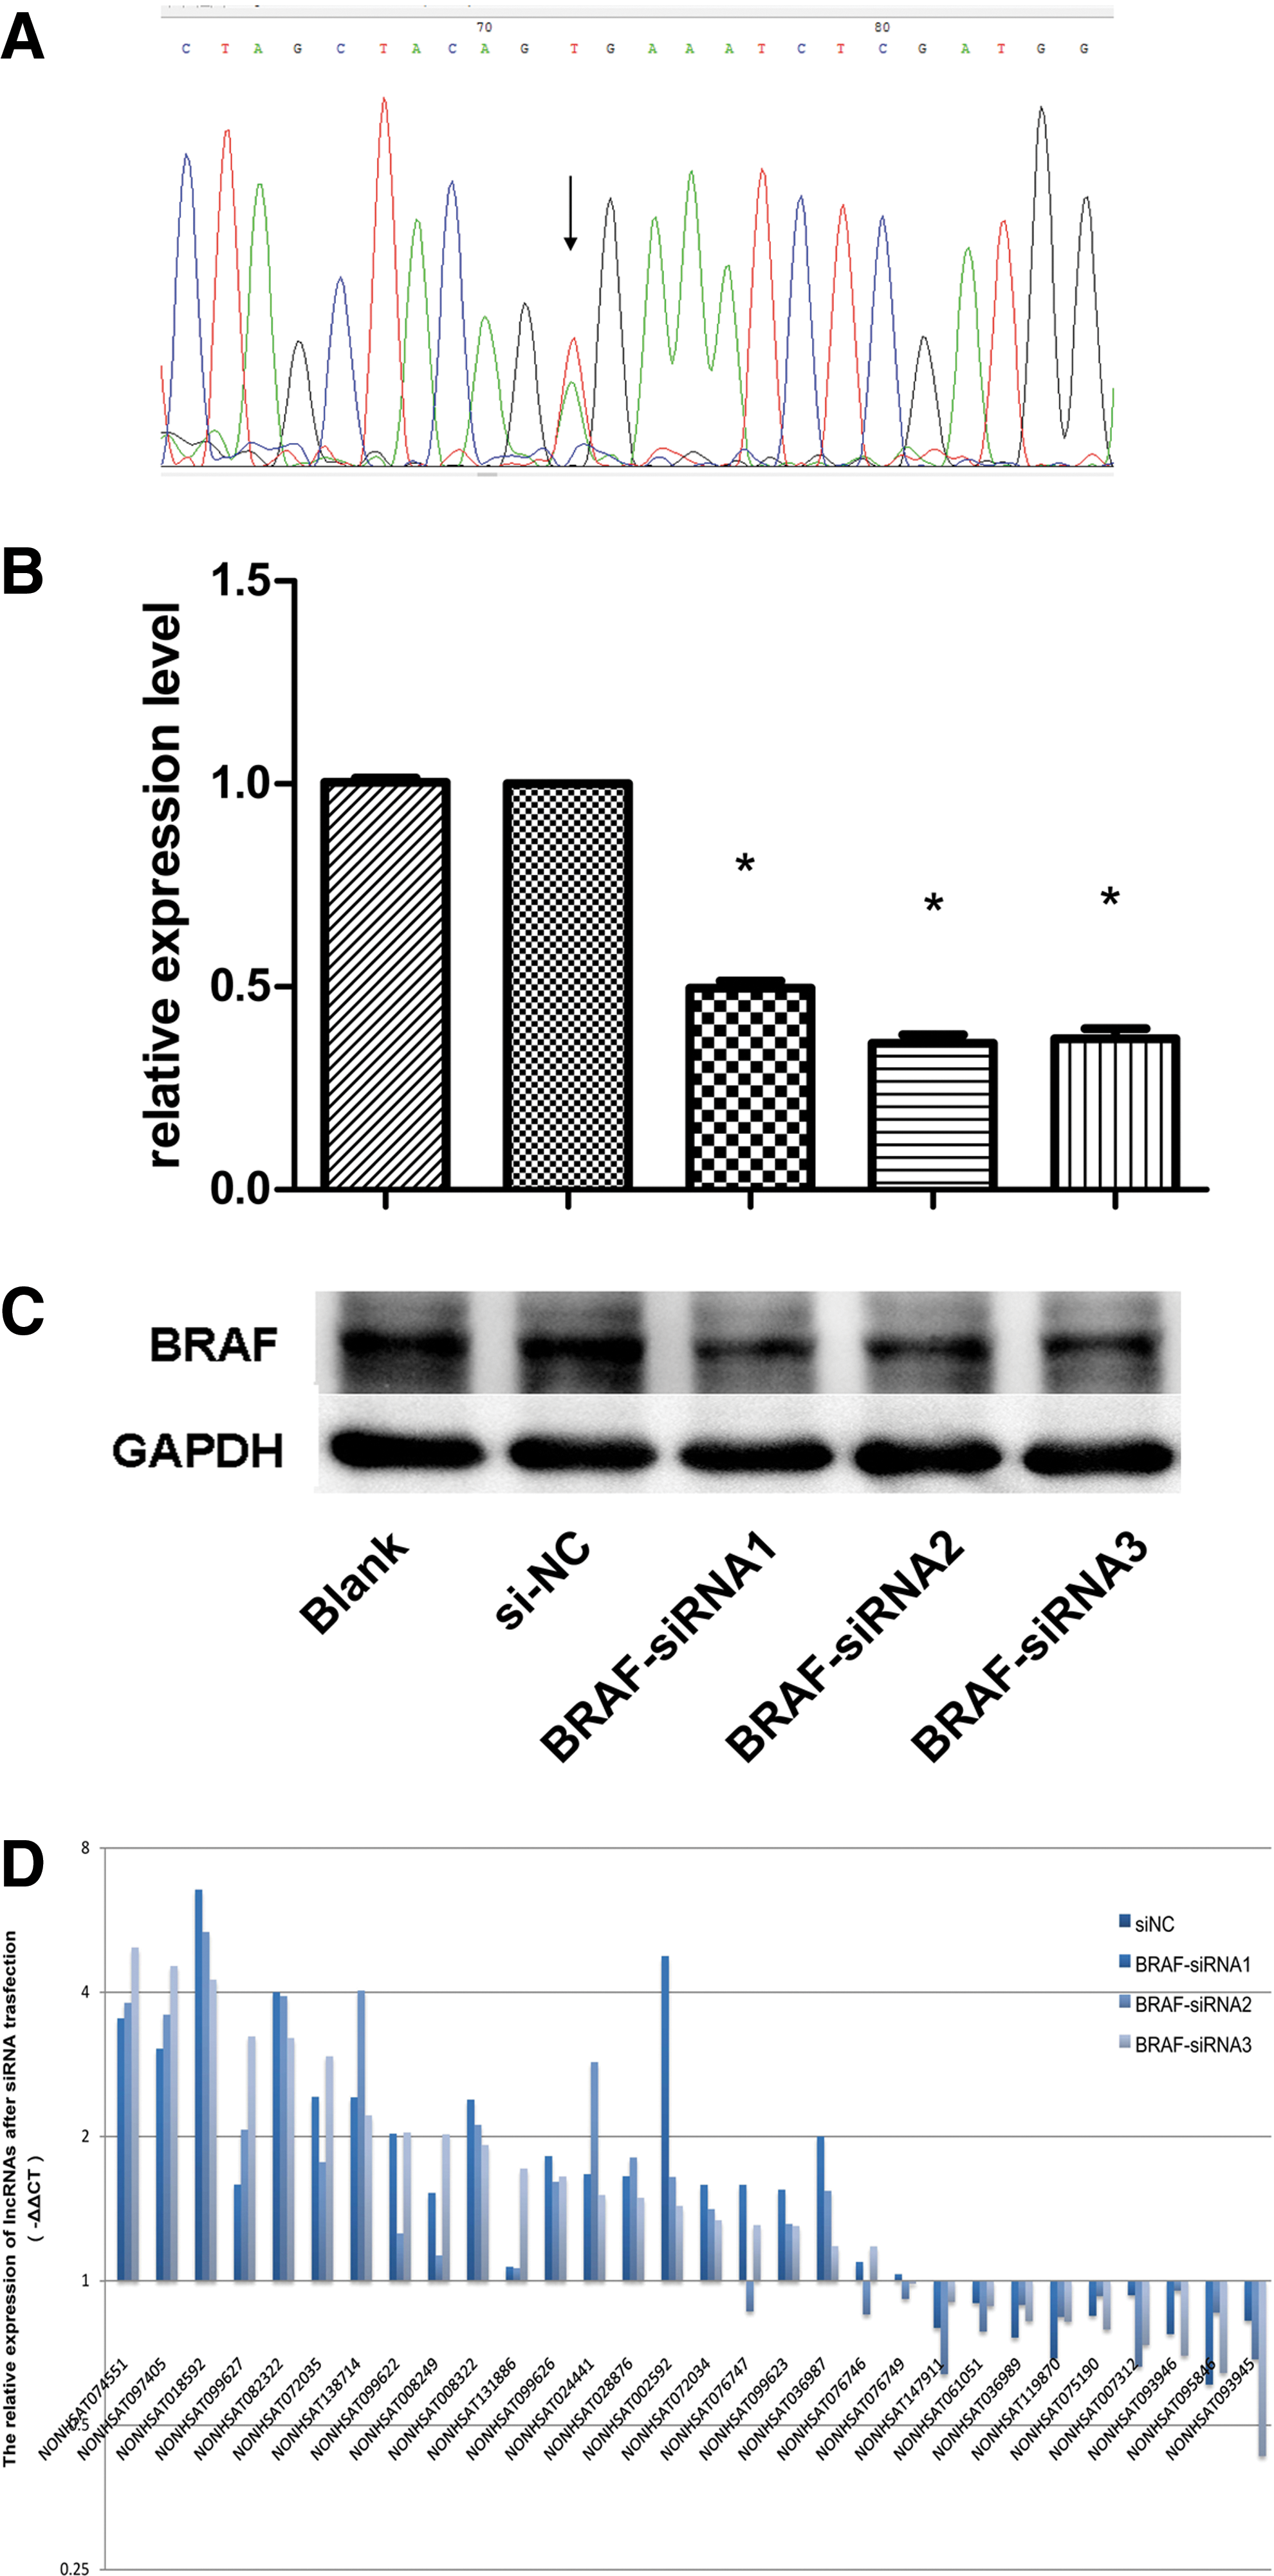
The altered expression pattern of lncRNAs in KAT5 cells after BRAF siRNA interference. (
Finally, the profile and function of the BRAF mutation–related protein-coding genes were analyzed to predict possible lncRNA function further. The results are shown in Figure 5D and Supplementary Figure S3. Most of the genes (222/277; 80%) belong to the BRAF-MUT group, and 51/277(18.4%) genes were identified as BRAF common genes. The presence of a BRAF mutation was uniquely associated with the overexpression of many classical oncogenic molecules in PTC, for example CCND1, CDKN1A, PERP, THBS1, and ZMAT3. Two hundred and twenty-two genes were analyzed according to the KEGG pathway, and they were mainly enriched in the p53 pathway (Supplementary Table S10 and Fig. 3C, bottom panel; p < 0.05, FDR <0.05).
Discussion
LncRNAs have been considered the “dark matter” of the genome because they are not translated into protein. Numerous lncRNAs had been shown to play an important role in cancer biology (47,48). Thyroid carcinoma–associated lncRNAs, including NAMA, PTCSC1, PTCSC2, and PTCSC3, have also been implicated in PTC pathogenesis. NAMA has been associated with the BRAF mutation, the MAP kinase pathway, and growth arrest (32). PTCSC3 was recently identified as a thyroid-specific lncRNA that acts as a tumor suppressor gene and is deactivated by a mutation of the C/EBPα and C/EBPβ binding site caused by SNP rs944289, which predisposes patients to PTC (31). Together with PTCSC3, two other lncRNAs, PTCSC1 and PTCSC2, represent possible candidate PTC susceptibility genes and play significant roles in thyroid cancer carcinogenesis (29,30). Furthermore, lncRNA PVT1, which is upregulated in thyroid cancer tissues as well as in several thyroid cancer cell lines (IHH-4, FTC-133, and 8505C), may contribute to tumorigenesis of thyroid cancer through recruiting zeste homolog 2 (EZH2) and regulating thyrotropin receptor (TSHR) expression (49). LncRNAs ENST00000426615 and ENST00000537266 might be important regulators of PTC cell proliferation and motility by inhibiting TPC-1 cell proliferation and regulating the cell cycle (50). Recently, a genome-wide analysis of lncRNA expression profile in PTC revealed that 1805 differentially regulated lncRNAs have cis or trans target genes. Of thse, 463 of the cis target genes were found to be differentially expressed and might be regulated by lncRNAs in the tumorigenesis of PTC (51). Furthermore, the expression level of NONHSAT037832 and their clinicopathologic significance in PTC were also investigated, and the results show that downregulated NONHSAT037832 is significantly associated with lymph node metastasis and tumor size (52). However, reports on global lncRNAs profiles remain rare.
The present study was performed using RNA-seq with Hiseq 2500, which has the advantage of being a non-biased approach compared with studies using microarrays and qRT-PCR. There was a significant difference between the PTC RNA profile and matched adjacent tissues. One hundred eighty-eight of the lncRNAs and 505 of the mRNAs were differentially regulated in ≥50% of the PTCs, and 47 of the lncRNAs and 39 of the mRNAs were validated as differentially expressed using qRT-PCR methods. These data demonstrate both a significant similarity and heterogeneity among the lncRNAs profiles of different patients with PTC. Furthermore, a total of nine lymph node metastasis–associated lncRNAs contributing to tumor invasion and metastasis were identified. Of particular interest is lncRNA NONHSAG051968, which correlated with PTC tumor size and might influence PTC progression through oncogenic genes such as PTPRQ and SEMA3D, leading to changes in characteristics such as cell cycle, cell differentiation, and cell proliferation. These lncRNAs may have potential as diagnostic and therapeutic targets in PTC. Thus, these data contribute to a growing body of literature supporting the significance of lncRNA species in cancer biology and oncogenesis, and they confirm the utility of RNA-seq for comparing transcriptomes.
Although the number of known lncRNAs is increasing rapidly, only a small fraction of the known lncRNAs have been functionally annotated. LncRNAs have recently emerged as vital transcriptional regulators of gene expression. Therefore, the most common way to predict function is by identifying co-expressed protein-coding genes and the related biological pathways. In this study, the correlation network of non-coding genes and protein-coding genes were analyzed, and 10,196 connections were identified. Most of the lncRNAs were positively associated with gene expression, possibly in an enhancer-like manner (53). The signaling pathways in which these protein-coding genes were involved were explored, and it was found that ECM–receptor interactions and the focal adhesion pathway were the top two pathways that were different in PTC. These data provide clues to understanding the underlying mechanism of differentially expressed lncRNAs. Integrins, collagens, thrombospondins, MET, LAMB3, and COMP were the main genes showing changed expression patterns related to ECM–receptor interactions (54), which are critical components of the tumor microenvironment and are involved in the first steps and prophase of tumorigenesis (55 –57). This was also reported in TCGA data (12). RhoGEF and CCND1 were critical nodes for the focal adhesion pathway. Focal adhesion kinase also integrates signals from the ECM–receptor interaction, activatesPI3K/Akt/CCND1 or RhoGEF/PhoA/Actin (Fig. 3C, upper and middle panel), and regulates the tumor cell cycle, proliferation, and migration, promoting the progression of PTC (58,59). In summary, these lncRNAs likely influence the carcinogenesis and progression of PTC by interacting with their co-expressed protein-coding genes in the ECM–receptor interaction and focal adhesion pathways.
LncRNAs with subtype-specific expression might have significant functional roles in individual molecular cancer subtypes. The BRAF mutation is not only a significant independent molecular diagnostic and prognostic marker in risk evaluation, but also a driver gene in PTC (8,12). Thus, the BRAF mutation has been treated as a target for new therapies to treat high-risk patients with recurrent or metastatic disease who have exhausted conventional therapies (7). However, there are very few studies on the transcriptional regulation of BRAF. Wang et al. reported that BRAF-activated lncRNA (BANCR) levels were upregulated in PTC, and the overexpression of BANCR increased PTC cell proliferation and activated cell autophagy (60). Smallridge et al. (61) reported genes expressed differentially between BRAF-MUT and BRAF-WT PTC, focusing on immune/inflammatory response genes in papillary thyroid cancer tissues with lymphocytic thyroiditis, whereas the present article focused on tumor biology itself. The genes expressed differentially between BRAF-MUT and BRAF-WT PTC were analyzed in this study, and a significant, distinct distribution of genes (lncRNAs and mRNAs) throughout the genome were find to be altered if the BRAFV600E mutation was present. This confirms that the BRAF mutation is a unique and useful marker for PTC at the transcriptional level and that it results in specific lncRNA subgroups (12). In addition, these BRAF-MUT related lncRNAs interact with protein-coding genes and the p53 pathway. For example, NONHSAG043674 was correlated with CDKN1A (also known as p21), which is a key element of the p53 pathway. p53 is a significant independent prognostic factor in PTC (62 –64) and usually becomes mutated or deleted late in the course of tumor progression, such as in PTC lymph node metastases (65) or in poorly differentiated anaplastic tumors (66) that might evolve from PTC (67).
In contrast, the BRAF mutation was not detected in paired normal adjacent tissues, which was repeatedly reported in previous studies. Therefore, it can be inferred that BRAF mutation–related lncRNAs are correlated with aggressive cancer progression but not with the tumorigenesis. In addition, a more detailed genetic characterization will provide a better understanding of this disease, particularly for advanced thyroid papillary carcinoma, and will facilitate the development of new personalized therapeutic strategies.
By applying high-throughput RNA-seq and qRT-PCR, and analyzing the data from the perspective of both systems biology and bioinformatics, this study identified specific lncRNA expression changes in PTC and provides new insights into the integrated genomic characterization of PTC. Some PTC-associated lncRNAs might be used as potential diagnostic and therapeutic targets for PTC patients. LncRNAs with subtype-specific expression patterns stratified by the BRAF mutation might also have functional significance in individual molecular subtypes. However, further studies are required to elucidate the biological functions and the potential mechanisms.
Footnotes
Acknowledgments
We are grateful to all of the patients and families who contributed to this study, and to Ang Li, Kun-Kai Su, Da-Song Hua, and Jia-Wei Zhou at the State Key Laboratory for Diagnosis and Treatment of Infectious Diseases for advice and help with this paper. This study was supported by grants from the National Natural Science Foundation of China (No. 81272354; No. 31401144).
Author Disclosure Statement
None of the authors has any conflicts of interest to declare.