
Abstract
Background:
Studies of thyroid stem/progenitor cells have been hampered due to the small organ size and lack of tissue, which limits the yield of these cells. A continuous source that allows the study and characterization of thyroid stem/progenitor cells is desired to push the field forward.
Method:
A cell line was established from Hoechst-resistant side population cells derived from mouse thyroid that were previously shown to contain stem/progenitor-like cells. Characterization of these cells were carried out by using in vitro two- and three-dimensional cultures and in vivo reconstitution of mice after orthotopic or intravenous injection, in conjunction with quantitative reverse transcription polymerase chain reaction, Western blotting, immunohisto(cyto)chemistry/immunofluorescence, and RNA seq analysis.
Results:
These cells were named SPTL (
Conclusion:
These results demonstrate that SPTL cells have the capacity to differentiate into thyroid to a limited degree. SPTL cells may provide an excellent tool to study stem cells, including cancer stem cells of the thyroid.
Introduction
A
The thyroid gland is a dormant organ with very slow turnover, while it retains the capacity to grow through cell hypertrophy and proliferation in response to stimuli, suggesting the presence of adult stem/progenitor cells (5). The stimuli are those that perturb the pituitary–thyroid axis, including xenobiotics, physiological alterations, alterations in iodine intake, and direct damage to the thyroid gland such as radiation exposure and partial thyroidectomy (6 –8). In recent years, the presence of adult stem/progenitor cells in the thyroid has been described by using thyroid tissues, monolayer cultures, and/or sphere cultures of thyroid tissues or side population (SP) cells from mice and humans (9 –12). However, the origin of these stem/progenitor cells is yet to be determined.
It has previously been demonstrated that the SP cells of the mouse thyroid, ranging from 0.3% to 1.4% of the total population of cells, exhibit stem/progenitor cell–like characteristics (9). SP cells were originally identified as a putative stem-cell population, based on their ability to efflux Hoechst 33342 dye in an ATP-binding cassette transporter-dependent manner (13). Mouse thyroid SP cells are composed of two groups of cells characterized as CD45(–)/CD117(c-kit)(–)/SCA1(+) and CD45(–)/CD117(c-kit)(–)/SCA1(–), each representing approximately half of SP cells. Thyroid SP cells highly express genes involved in cancer and/or cancer invasion/metastasis, as determined by microarray analysis, compared with non-SP cells, suggesting that thyroid SP cells may contain cancer stem cells of the thyroid (14). Further, partial thyroidectomy was established as a model for studying thyroid regeneration (15). In the partial thyroidectomized thyroid, many clear cells due to scantiness of the cytoplasm, indicative of immature cells, were observed that have characteristics of either C cells or follicular cells. It was suggested that these immature cells may participate in the repair and/or regeneration of the thyroid gland (15). The formation of clear cells was considered as one of the pathways for thyroid regeneration (16). By using the β-galactosidase reporter mouse in conjunction with partial thyroidectomy and bromodeoxyuridine (BrdU) long label–retaining cell analysis, it has been demonstrated that stem cell antigen 1 (SCA1)-expressing non-follicular mesenchymal cells are the origin of follicular cells during thyroid regeneration, although it remains unclear where these cells originate from (17). The SCA1-positive cells, initially found in non-follicular areas, were found 35 days after partial thyroidectomy in part of follicles that co-expressed NKX2-1, a critical transcription factor for thyroid development and function (18,19). The SCA1-positive cells accounted for only ≤0.1% of intra-follicular thyroid cells (17). This pathway was suggested to be an alternative for thyroid regeneration (16).
Even though studies on thyroid stem/progenitor cells are slowly emerging, one of the biggest challenges is the availability of a tool, which is currently very limited, partly due to the small size of the mouse thyroid. The study described herein was initiated to obtain a stable continuous cell line that allows the study and characterization of thyroid stem/progenitor cells. A cell line was generated from mouse SP cells that partially exhibited stem/progenitor characteristics based on the expression of various marker genes for stem cells and thyroid differentiation, the formation of follicle-like structure in vitro, and some of these cells being found in part of the follicles in vivo when orthotopically or intravenously injected into mice. RNA seq analysis demonstrated that SP-derived cells are enriched in the expression of genes involved in epithelial–mesenchymal transition (EMT), and have a gene-expression pattern similar to those found in anaplastic thyroid carcinoma (ATC). The SP-derived cell line may provide an excellent tool to study stem/progenitor cells, including cancer stem cells of the thyroid.
Materials and Methods
Cell culture
Thyroid glands of 30–40 C57BL/6NCr mice were used to prepare thyroid cell suspensions and Hoechst 33342 staining, followed by subjection to fluorescence-activated cell sorting (FACS) to obtain thyroid SP cells, as previously described (14), except that fumitremorgin C (Sigma–Aldrich, St. Louis, MO) was used instead of verapamil as an ABC transporter inhibitor at a final concentration of 10 μM. SP cells were continuously cultured in Dulbecco's modified Eagle's medium (DMEM)/F12 50/50 mix medium containing 10% fetal bovine serum (FBS) in a 37°C CO2 incubator, which resulted in the establishment of SPTL (
Three-dimensional Matrigel® culture
After two-dimensional culture for six days with DMEM/F12 50/50 mix medium containing 2% FBS, 1.6 × 10⁵ SPTL cells in 100 μL of Matrigel® were laid onto cover glass, which was then put into 24-well culture plates. The medium containing 2% FBS and 1 mIU/mL of bovine thyrotropin (TSH; Sigma–Aldrich) was added onto the Matrigel®. SPTL cells together with Matrigel® were subjected to hematoxylin and eosin (H&E) staining after 16 days of three-dimensional culture.
Animal procedures
SPTL cells were either directly injected to one of the thyroid lobes or by intravenous injection through the tail vein of non-obese diabetic severe combined immunodeficiency (NOD/SCID) mice. For direct injection, 5 μL of 5 × 10⁴ SPTL cells/μL were injected into one of the thyroid lobes using a Hamilton syringe (Hamilton Company, Reno, NV). For tail-vein injection of SPTL cells, mice were first subjected to partial thyroidectomy where the caudal third of both thyroid lobes were resected. One day later, the SPTL cells (100 μL of 5 × 10⁵ cells/μL) were injected through the tail vein. All animal studies were performed in accordance with the Using Animals in Intramural Research Guidelines (National Institutes of Health Animal Research Advisory Committee, National Institutes of Health, Bethesda, MD) and after approval of the institutional Animal Care and Use Committee.
Immunofluorescence analyses
Immunofluorescence analysis of mouse thyroid tissue was carried out using OCT-embedded (Sakura Finetek USA, Inc., Torrance, CA) thyroid tissue cryo specimens sectioned at 8 μm using a CM1950 cryostat (Leica, Buffalo Grove, IL), followed by brief fixation in 4% paraformaldehyde (PFA) for 10 min at room temperature. The sections were washed three times with Tris-buffered saline (TBS) after each step. Non-specific binding sites were blocked using 1% bovine serum albumin in TBS for 1 h at room temperature before incubation with an antibody. For double labeling using two primary antibodies from the same species, the sections were first incubated with rabbit polyclonal anti-green fluorescent protein (GFP; 598; 1:250; MBL International Corp, Woburn, MA) at 4°C overnight, which was then treated with the secondary antibody, labeled goat anti-rabbit IgG (Dylight 650; 1:200; Abcam, Cambridge, United Kingdom) for 1 h at room temperature. The sections were then incubated with 5% rabbit serum (the same host species) for 1 h at room temperature, followed by incubation with an unconjugated Fab antibody derived from the same host species as the primary antibody (AffiniPure Fab Fragment Goat Anti-Rabbit IgG; Jackson ImmunoResearch Laboratories, West Grove, PA) for 1 h at room temperature. The sections were finally incubated with the second primary antibody, rabbit anti-NKX2-1 (H-190; 1:200; Santa Cruz Biotechnology, Dallas, TX), followed by incubation with a labeled donkey anti-rabbit IgG secondary antibody. DAPI dye (D1306; Molecular Probes/Life Technologies, Eugene, OR) was used to stain the nuclei of cells, and the sections were mounted using Fluoromount-G (SouthernBiotech, Birmingham, AL). Confocal images were obtained with a Zeiss 780 LSM (Carl Zeiss, Oberkochen, Germany).
Sample preparation for RNA seq analysis
Total RNAs were prepared from SP and MP (main population, non-SP) cells immediately after sorting, and SPTL cells using RNAlater (Life Technologies) and TRIzol reagent (Life Technologies), followed by RNeasy Mini Kit (Qiagen, Valencia, CA). Two biological replicates were used for each experimental group. Total RNA was converted to cDNA and amplified using Ovation RNA seq System V2 (NuGEN, San Carlos, CA). Following amplification, 1 μg of cDNA was fragmented using a Covaris S1 ultrasonicator (Covaris, Woburn, MA). The sheared cDNAs (100 ng) were used for library construction using Ovation SP Ultraflow Library System (NuGEN). Library droplets were collected and subjected to library enrichment by low-cycle polymerase chain reaction (PCR). The 250–450 bp gel fragments were size selected by 2% agarose gel electrophoresis and then purified with a Zymo column.
RNA seq
The RNA seq libraries (5 ng) were subjected to sequencing on a Hiseq 2000 (Illumina, San Diego, CA). BWA (Burrows-Wheeler Aligner) software (20) was used to map RNA seq reads to the mm9 mouse reference genome (
Quantitative reverse transcription PCR
Approximately 2 μg of RNA was treated with DNase I (Life Technologies) and then reverse transcribed into cDNA using Superscript III (Life Technologies) and Random Primers (Life Technologies). ES cell cDNA was kindly provided by Dr. Tao Deng (NCI) (24). Real-time PCR was performed in triplicate using Power SYBR Green PCR Master Mix (Life Technologies) and a 7900 HT Fast Real-Time PCR system (Life Technologies). The primers used were:
Nkx2-1 (forward) 5′-ACA GCC AAG CAA ATT CAA CC-3′, (reverse) 5′-GGG TGC ATC CAC AGA AAA GT-3′; Pax8 (forward) 5′-GCC ACC TGT TTG GTC TTC AT-3′, (reverse) 5′-AGC CAC TGG TTG AGA GGC TA-3′; Foxe1 (forward) 5′-GGC GGC ATC TAC AAG TTC AT-3′, (reverse) 5′-GGA TCT TGA GGA AGC AGT CG-3; Tshr (forward) 5′-CAA GGA GCT CCA CCG AAT C-3′, (reverse) 5′-ATT GGG GAG ACT CGA AAA TG-3′; Nis/Scl5a5 (forward) 5′-AGC TGC CAA CAC TTC CAG AG-3′, (reverse) 5′-GAT GAG AGC ACC ACA AAG CA-3′; Tg (forward) 5′-GTC CAA TGC CAA AAT GAT GGT C-3′, (reverse) 5′-GAG AGC ATC GGT GCT GTT AAT-3′; Tpo (forward) 5′-ACA GTC ACA GTT CTC CAC GGA TG-3′, (reverse) 5′-ATC TCT ATT GTT GCA CGC CCC-3′; Gata4 (forward) 5′-CCC TAC CCA GCC TAC ATG G-3′, (reverse) 5′-ACA TAT CGA GAT TGG GGT GTC T3′; Gata6 (forward) 5′-TTG CTC CGG TAA CAG CAGT G-3′, (reverse) 5′-GTG GTC GCT TGT GTA GAA GGA-3′; Sca1/Ly6a (forward) 5′-CAA TTA CCT GCC CCT ACC CT-3′, (reverse) 5′-GGC AGA TGG GTA AGC AAA GA-3′; Oct4/Pou5f1 (forward) 5′-ATC GGA CCA GGC TCA GAG GTA TTG-3′, (reverse) 5′-TTC TCC AAC TTC ACG GCA TTG-3′; Nanog (forward) 5′-AGC CCT GAT TCT TCT ACC AGT CCC-3′, (reverse) 5′-GCT TCT GAA ACC TGT CCT TGA GTG-3′; Rex1/Zfp42 (forward) 5′-CCC TCG ACA GAC TGA CCC TAA-3′, (reverse) 5′-TCG GGG CTA ATC TCA CTT TCA T-3′; Tgfb2 (forward) 5′-CTT CGA CGT GAC AGA CGC T-3′, (reverse) 5′-GCA GGG GCA GTGT AAA CTT ATT-3′; Tgfb3 (forward) 5′-CCT GGC CCT GCT GAA CTT G-3′, (reverse) 5′-TTG ATG TGG CCG AAG TCC AAC-3′; Snai1 (forward) 5′-CAC ACG CTG CCT TGT GTC T-3′, (reverse) 5′-GGT CAG CAA AAG CAC GGT T-3′; Snai2 (forward) 5′-TGG TCA AGA AAC ATT TCA ACG CC-3′, (reverse) 5′-GGT GAG GAT CTC TGG TTT TGG TA-3′; Cdh1 (forward) 5′-GAG GTC TAC ACC TTC CCG GT-3′, (reverse) 5′-AAA AGA AGG CTG TCC TTG GC-3′; Vim (forward) 5′-AGA GAG AGG AAG CCG AAA GC-3′, (reverse) 5′-TCC ACT TTC CGT TCA AGG TC-3′, and Ppia (forward) 5′-GTG TTC TTC GAC ATC ACG GC-3, (reverse) 5′-CAG TGC TCA GAG CTC GAA AGT-3′. The PCR reaction conditions used were: 95°C for 2 min, followed by 40 cycles of 95°C for 15 sec and 60°C for 45 sec. Relative levels of gene expression were calculated using the ΔΔCq method with normalization to peptidylprolyl isomerase A (PPIA, cyclophilin A).
Results
Generation of a mouse thyroid SP cell-derived cell line
Mouse thyroid SP cells were subjected to culture right after FACS. The majority of cells died after several passages as expected, while a few cells remained viable, which eventually started growing and forming an established cell line. They were named SPTL cells. SPTL cells were passaged over 36 generations. SPTL cells were more stellate, elongated, and mesenchymal in shape compared with primary thyroid cells, which were round and tended to cluster (Fig. 1A). The doubling time of SPTL cells was approximately 35 hours. Electron microscopy demonstrated that SPTL cells were generally small and round, and some were elongated with three- or four-pointed star-shaped cells having heterogeneous cytoplasm containing many mitochondria, Golgi apparatus, a dilated endoplasmic reticulum (ER), medium to large vacuoles, phagosomes, and lipid bodies (Fig. 1B). Most mitochondrial matrixes were not enriched, and the cytoplasm, especially in small cells, was slightly granular and less contrasted, suggesting that SPTL cells were not fully differentiated. These characteristics were in contrast to those found in rat thyroid-derived FRTL-424 and FRTL-5 cells, and rat follicular cells, where many enriched mitochondria and well-developed ER were found (25,26). In a previous study, half of the thyroid SP cells were positive for SCA1, a candidate stem
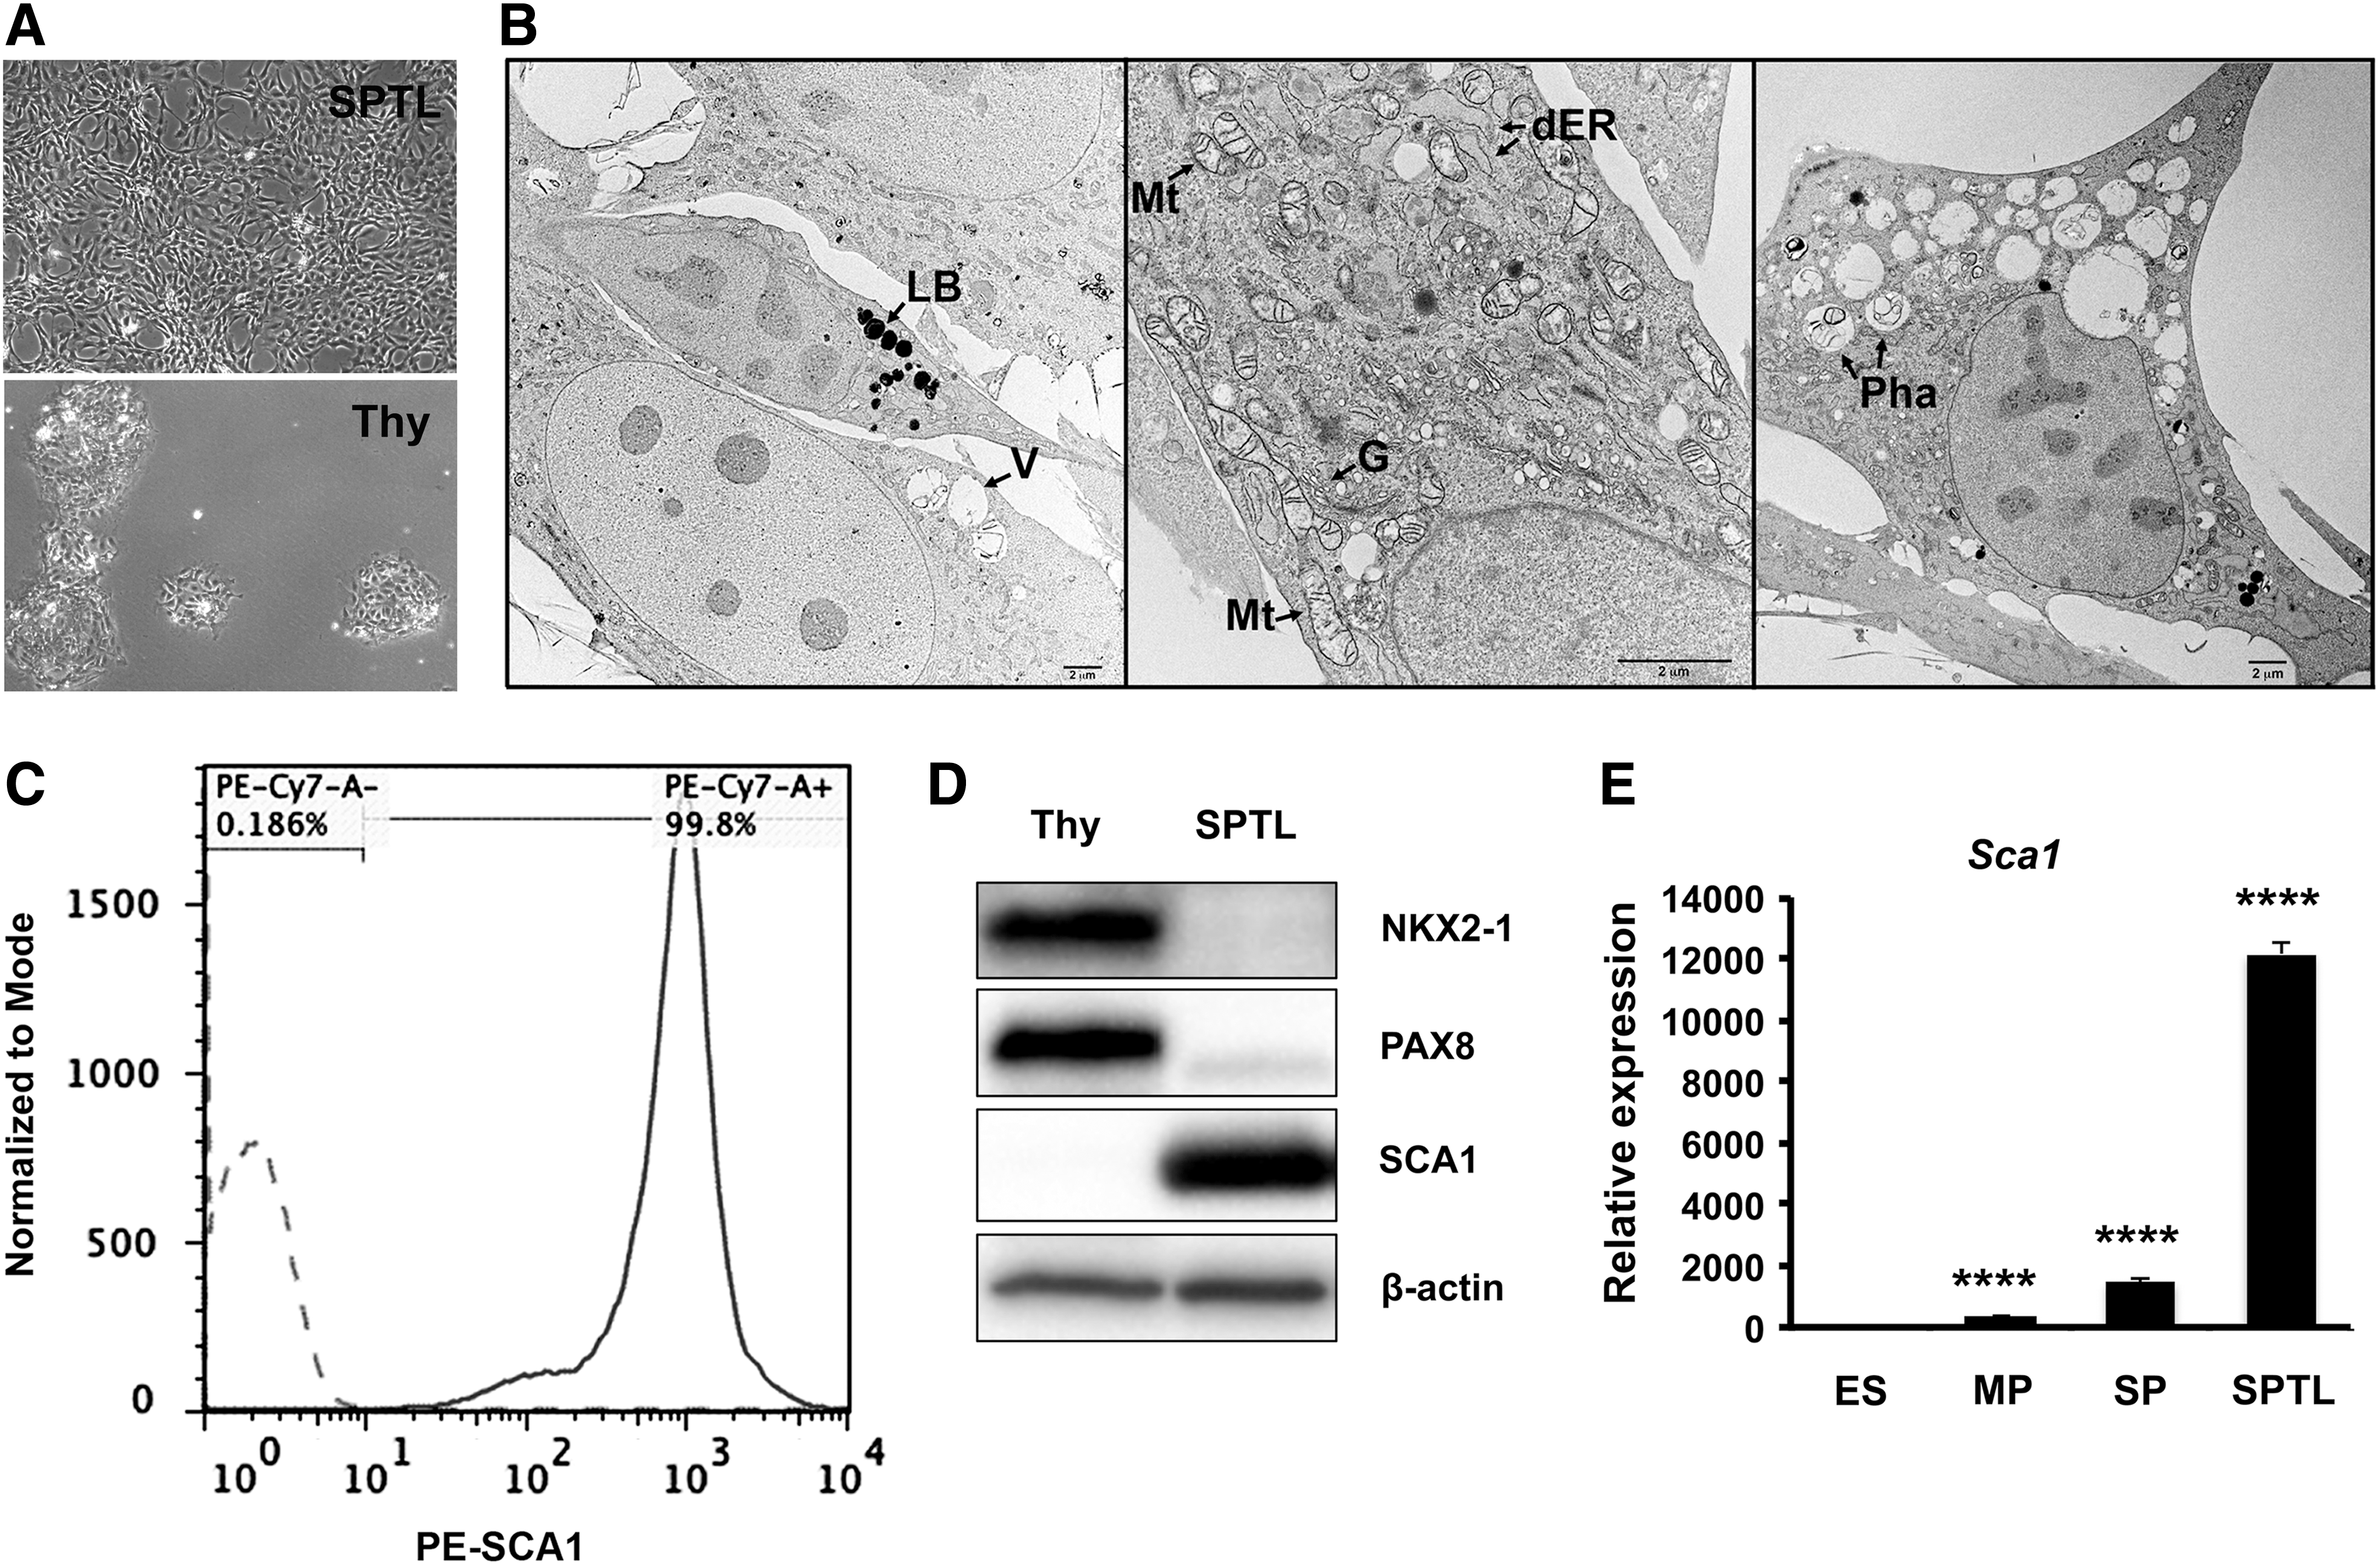
Characteristics of
qRT-PCR analyses of various genes from ES, MP, SP, and SPTL cells. (
Expression of thyroid-specific genes in SPTL cells under low serum conditions
SPTL cells were maintained in media containing 10% FBS. Under this serum condition, SPTL cells did not express three transcription factors critical for thyroid development: NKX2-1, PAX8, and FOXE1 (Fig. 1D and see below). When the serum concentration was changed to 2%, which switches cells from proliferation to differentiation (30,31), the expression of mRNA encoding SCA1 decreased, while mRNAs encoding NKX2-1 increased during 6 days of 2% FBS culture (Fig. 3A). The expression of Foxe1, sodium iodide symporter (Nis;Scl5a5), and thyroid peroxidase (Tpo) mRNAs appeared to have slightly increased, while Pax8 and thyroglobulin (Tg) mRNA levels were not changed. The levels of TSH receptor (Tshr) mRNA at both day 0 and day 6 were too low to be detected. Even though Nkx2-1 expression increased as demonstrated by qRT-PCR, the level was significantly lower compared with that of thyroid primary cells. Immunocytochemistry analysis revealed that some cells clearly expressed NXK2-1 in their nuclei by day 6, but not PAX8 (Fig. 3B, data not shown for PAX8). The NKX2-1 positive cell ratio was calculated as 1.3%, averaged from nine microscopic fields. The addition of other growth factors such as FGFs, EGF, and activin A with and without TSH (32,33) did not enhance expression of Nkx2-1, nor did it induce the expression of other genes. These results demonstrate that under low serum conditions, SPTL cells may start differentiating into thyroid cells, albeit at a limited degree.
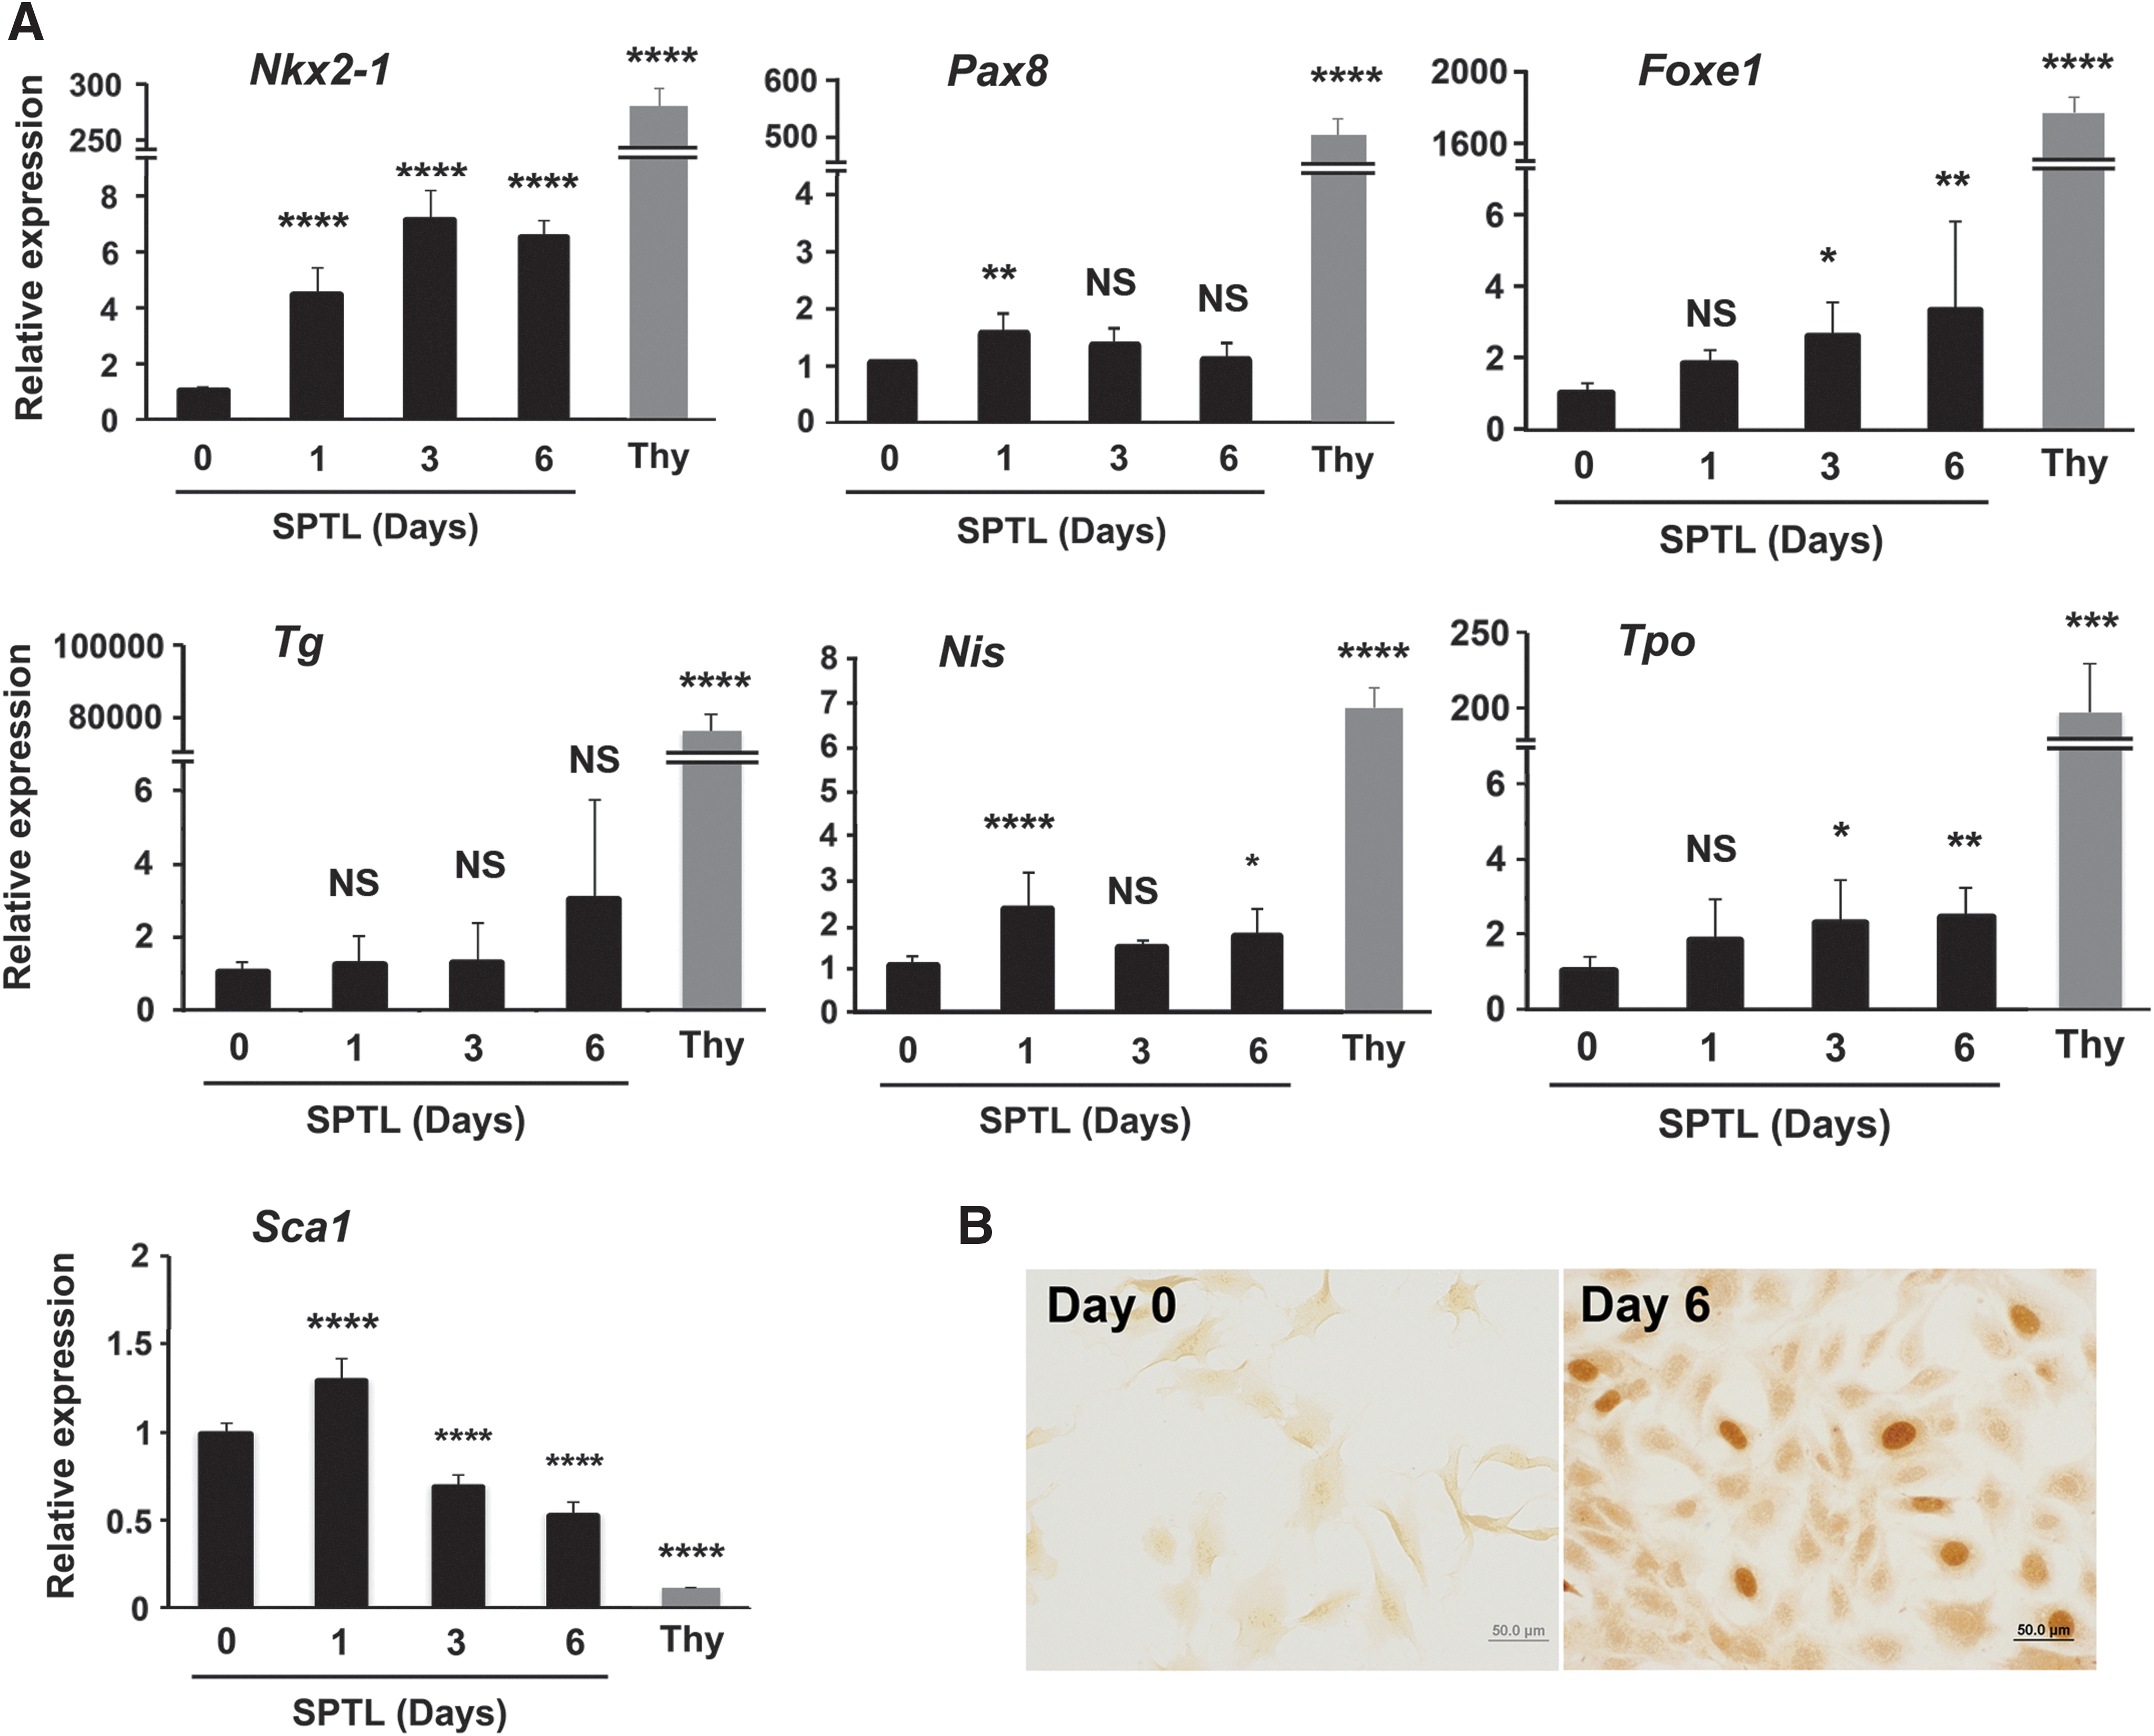
Induction of thyroid differentiation markers in monolayer culture of SPTL cells. (
Three-dimensional culture of SPTL cells
After six days of monolayer culture under low serum conditions, SPTL cells were embedded into Matrigel and further cultured over two weeks. On day 16, the presence of follicle-like structures was noted in H&E-stained sections (Fig. 4A). Immunofluorescence analysis did not show any expression of NKX2-1, PAX8, or thyroglobulin (data not shown). The results suggest that SPTL cells may not differentiate into functional thyroid follicles in vitro.
In vitro and in vivo analysis of SPTL cells. (
Presence of SPTL cells in part of the follicles in vivo
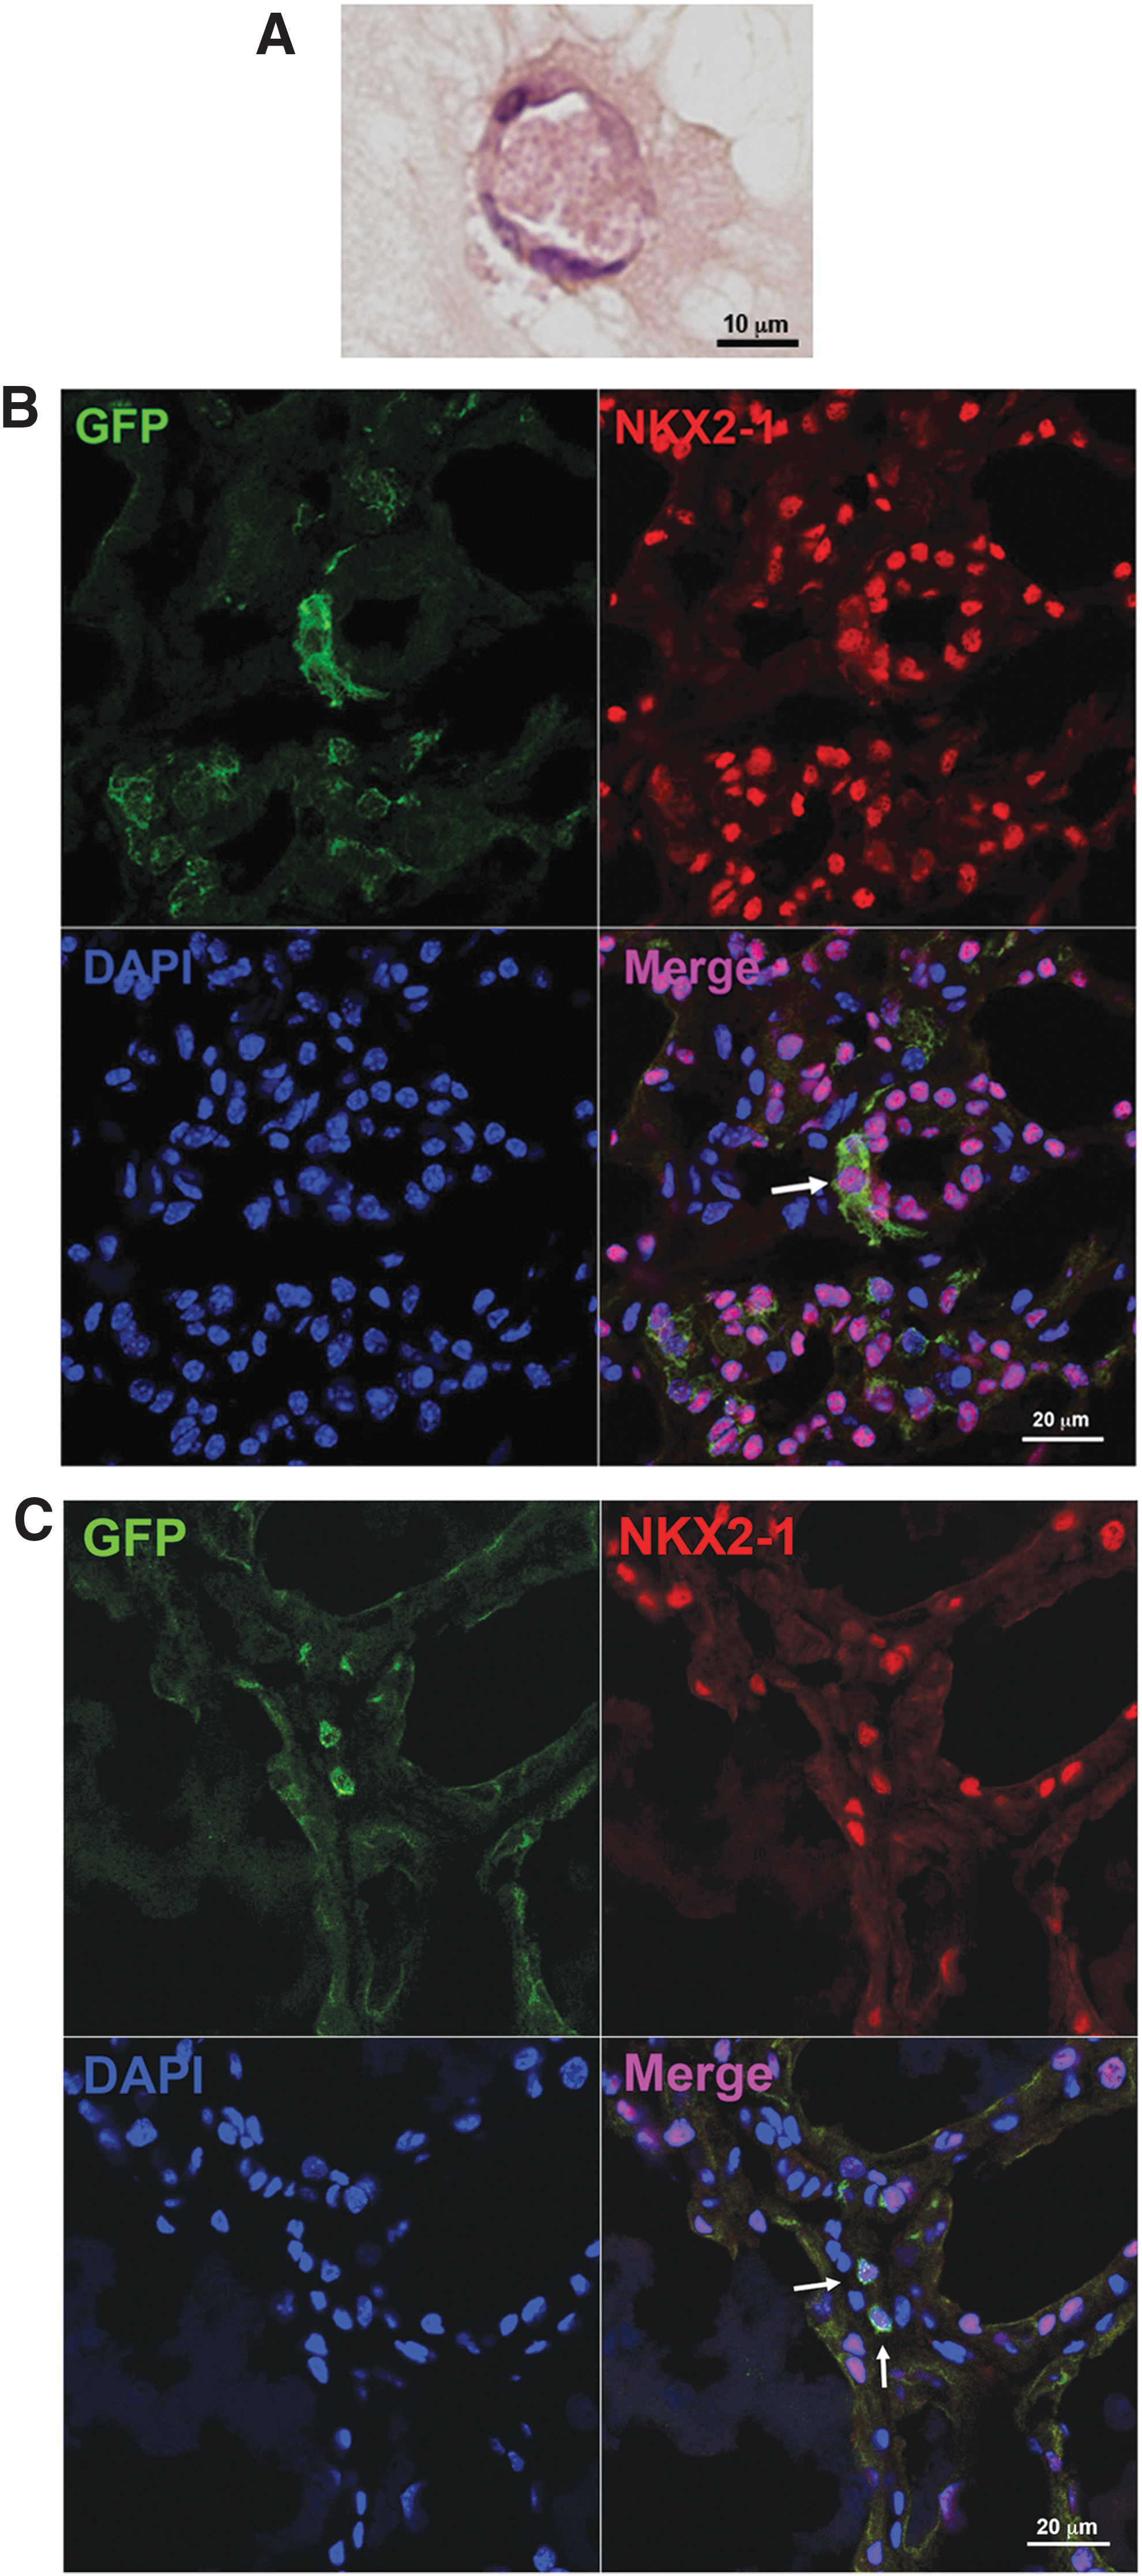
In order to examine how SPTL cells behave in vivo, two methods were used: (i) GFP-expressing SPTL cells were directly injected into one lobe of the thyroid, and (ii) GFP-expressing SPTL cells were injected through the tail vein after mice underwent partial thyroidectomy. For the latter, it was previously demonstrated that partial thyroidectomy can be used as a model for thyroid regeneration (15). When SPTL cells were orthotopically injected into the thyroid, many GFP-positive cells were found outside as well as inside the thyroid (Supplementary Fig. S1; Supplementary Data are available online at
RNA seq analysis of SP and SPTL cells
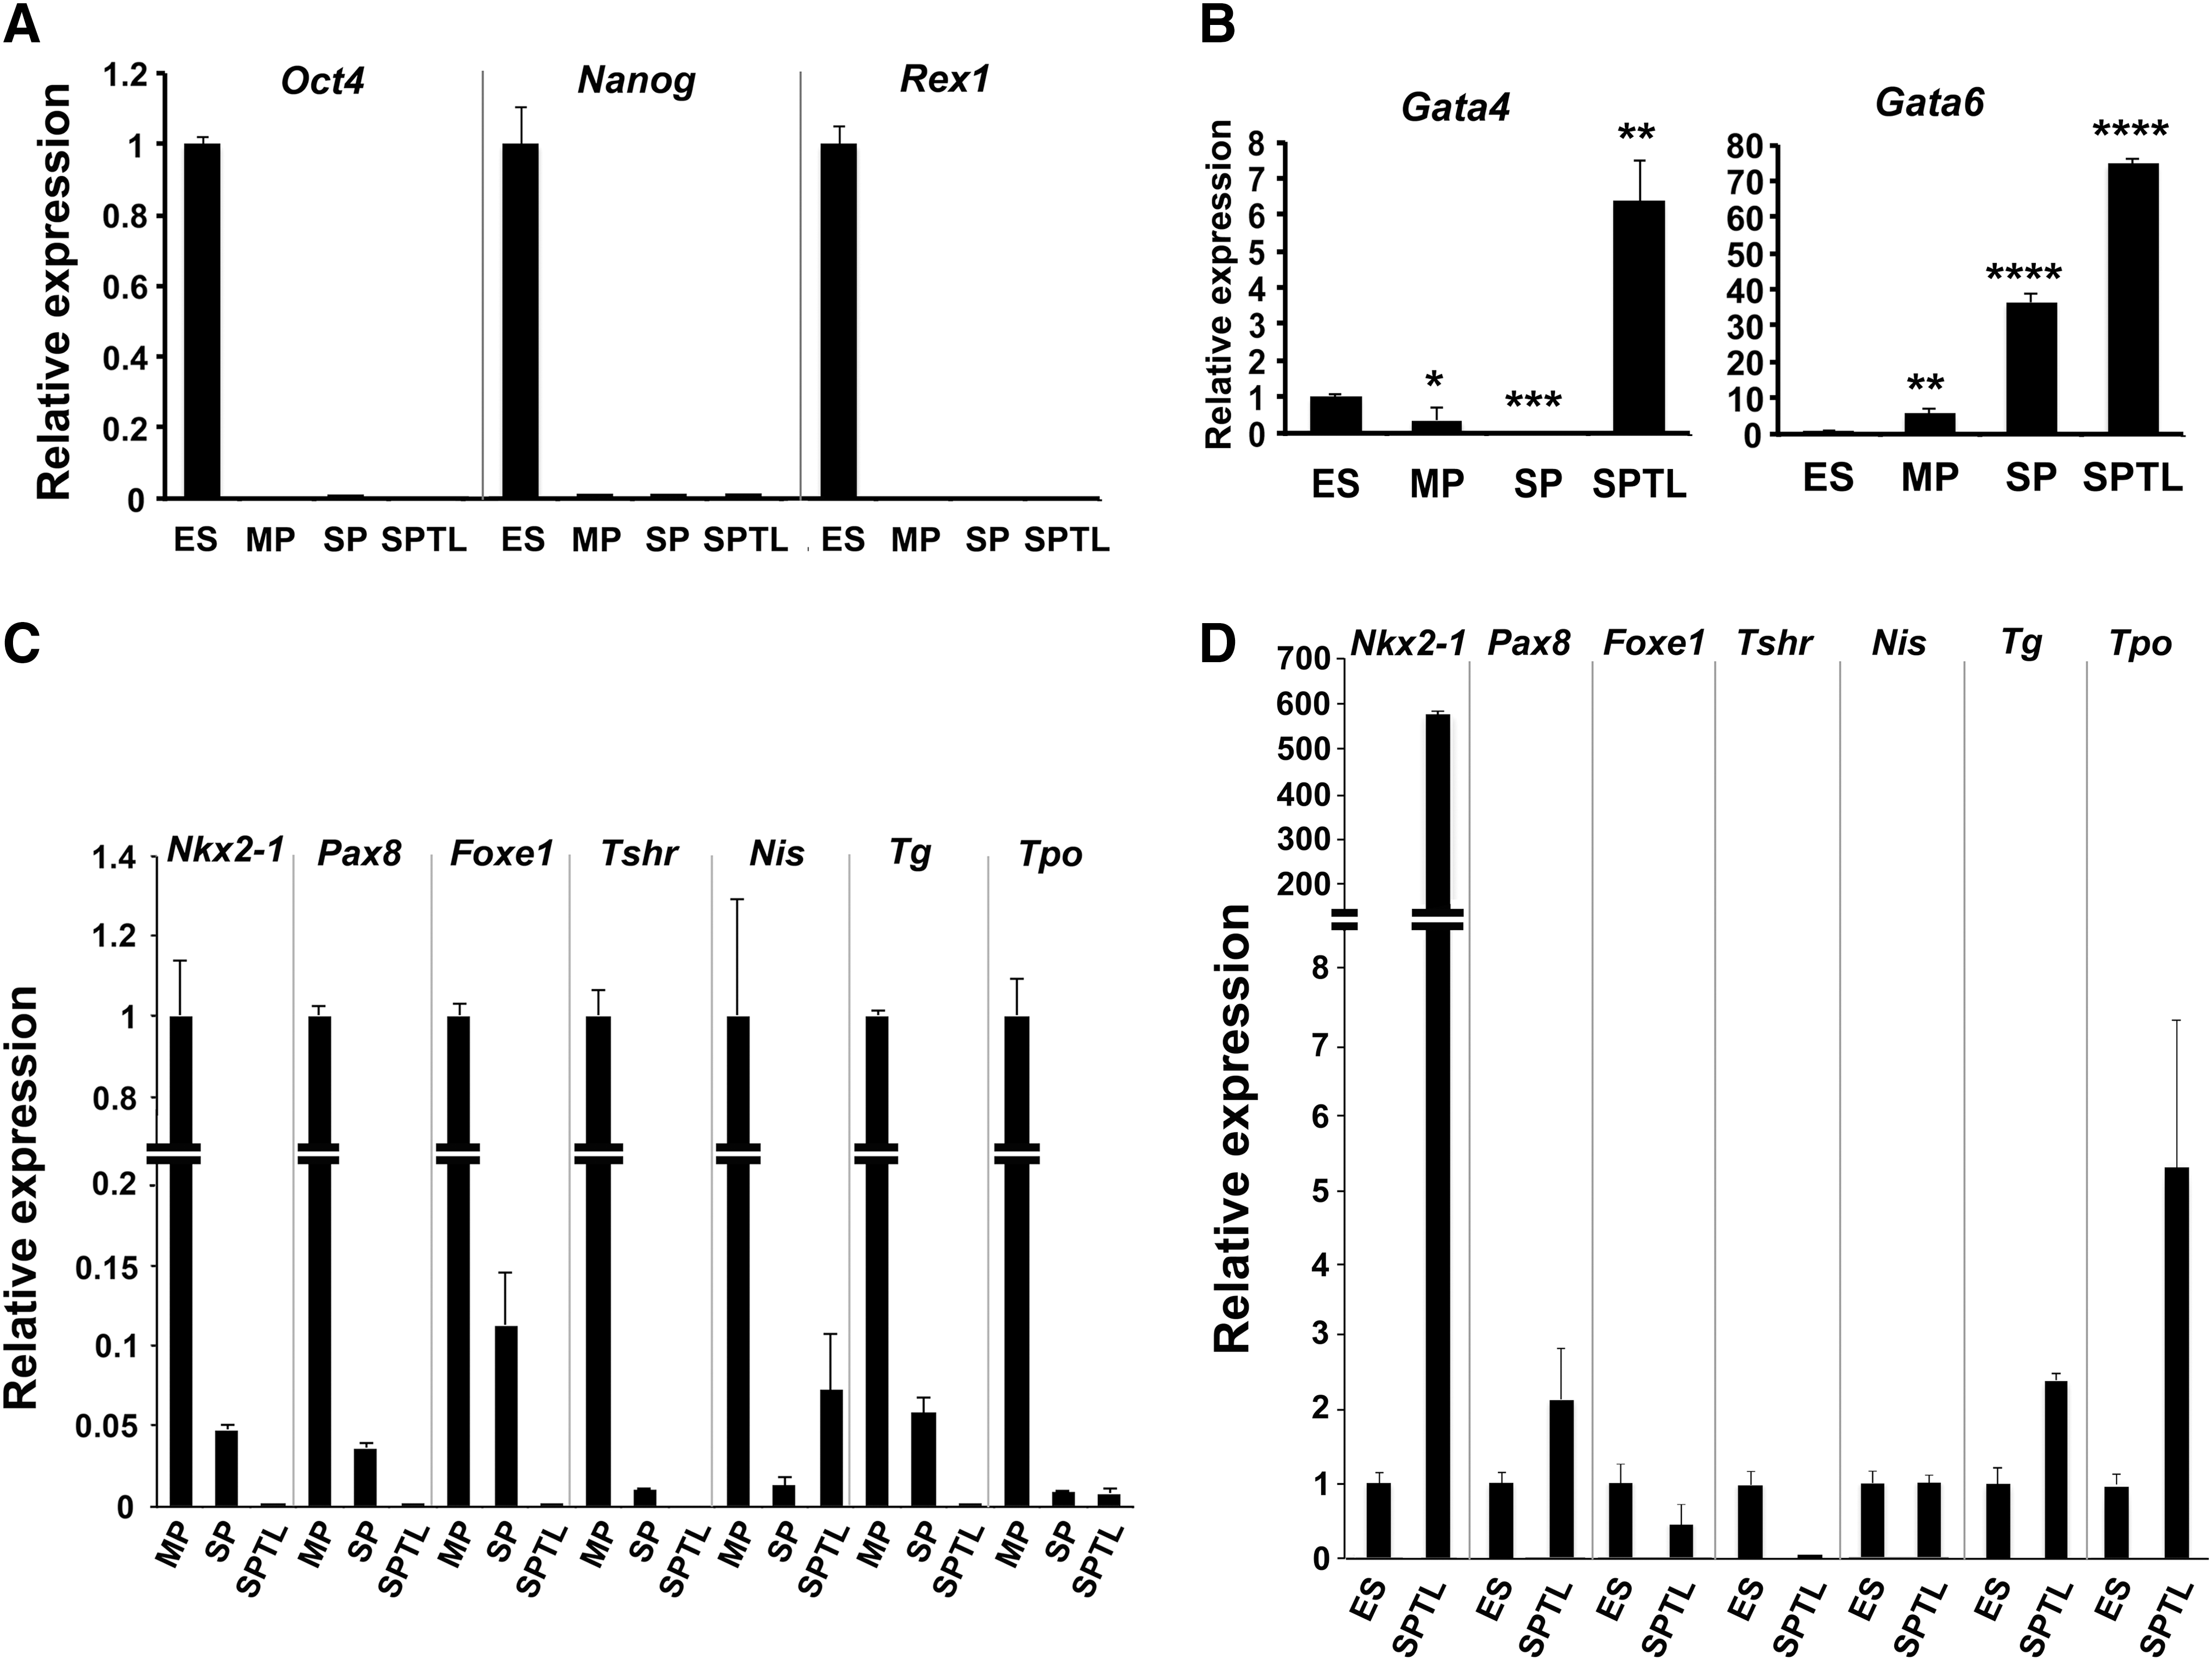
To understand the nature of SPTL cells compared with SP cells in terms of gene-expression patterns, SPTL cells and freshly FACS-sorted SP cells and MP cells in biological duplicates were subjected to RNA seq analysis. A total of 22,194 genes were compared between SPTL, SP, and MP cells (each with two replicates). Reads per kilobase per million mapped reads were used to quantify gene expression levels. SPTL cells had 4269 and 2591 up- and downregulated genes, respectively, compared with MP cells, while SP cells had 1388 and 1020 up- and downregulated genes, respectively, compared with MP cells, with fold changes ≥2 (log2FC ≥1) and a FDR ≤0.01. Hierarchical clustering of gene expression demonstrated very little difference between the three groups of samples (Fig. 5A). In addition, pair-wise correlation analysis showed that the expression in SPTL correlates better with the expression in SP than in MP cells (Supplementary Fig. S3). Among genes altered in SPTL and SP cells, 584 and 940 genes were commonly up- and downregulated respectively (Supplementary Tables S1 and S2). The commonly upregulated genes included Sca1, while commonly downregulated genes included Tg, Tshr, Tpo, Nkx2-1, Pax8, and Foxe1, the genes encoding critical transcription factors and/or proteins for development, homeostasis, and function of the thyroid, and/or thyroid hormone synthesis (Fig. 5B) (18,19). The expression of Tg, Tshr, Tpo, Nkx2-1, Pax8, and Foxe1 when examined by qRT-PCR was indeed downregulated in SP as well as SPTL cells compared with MP cells (Fig. 2C).
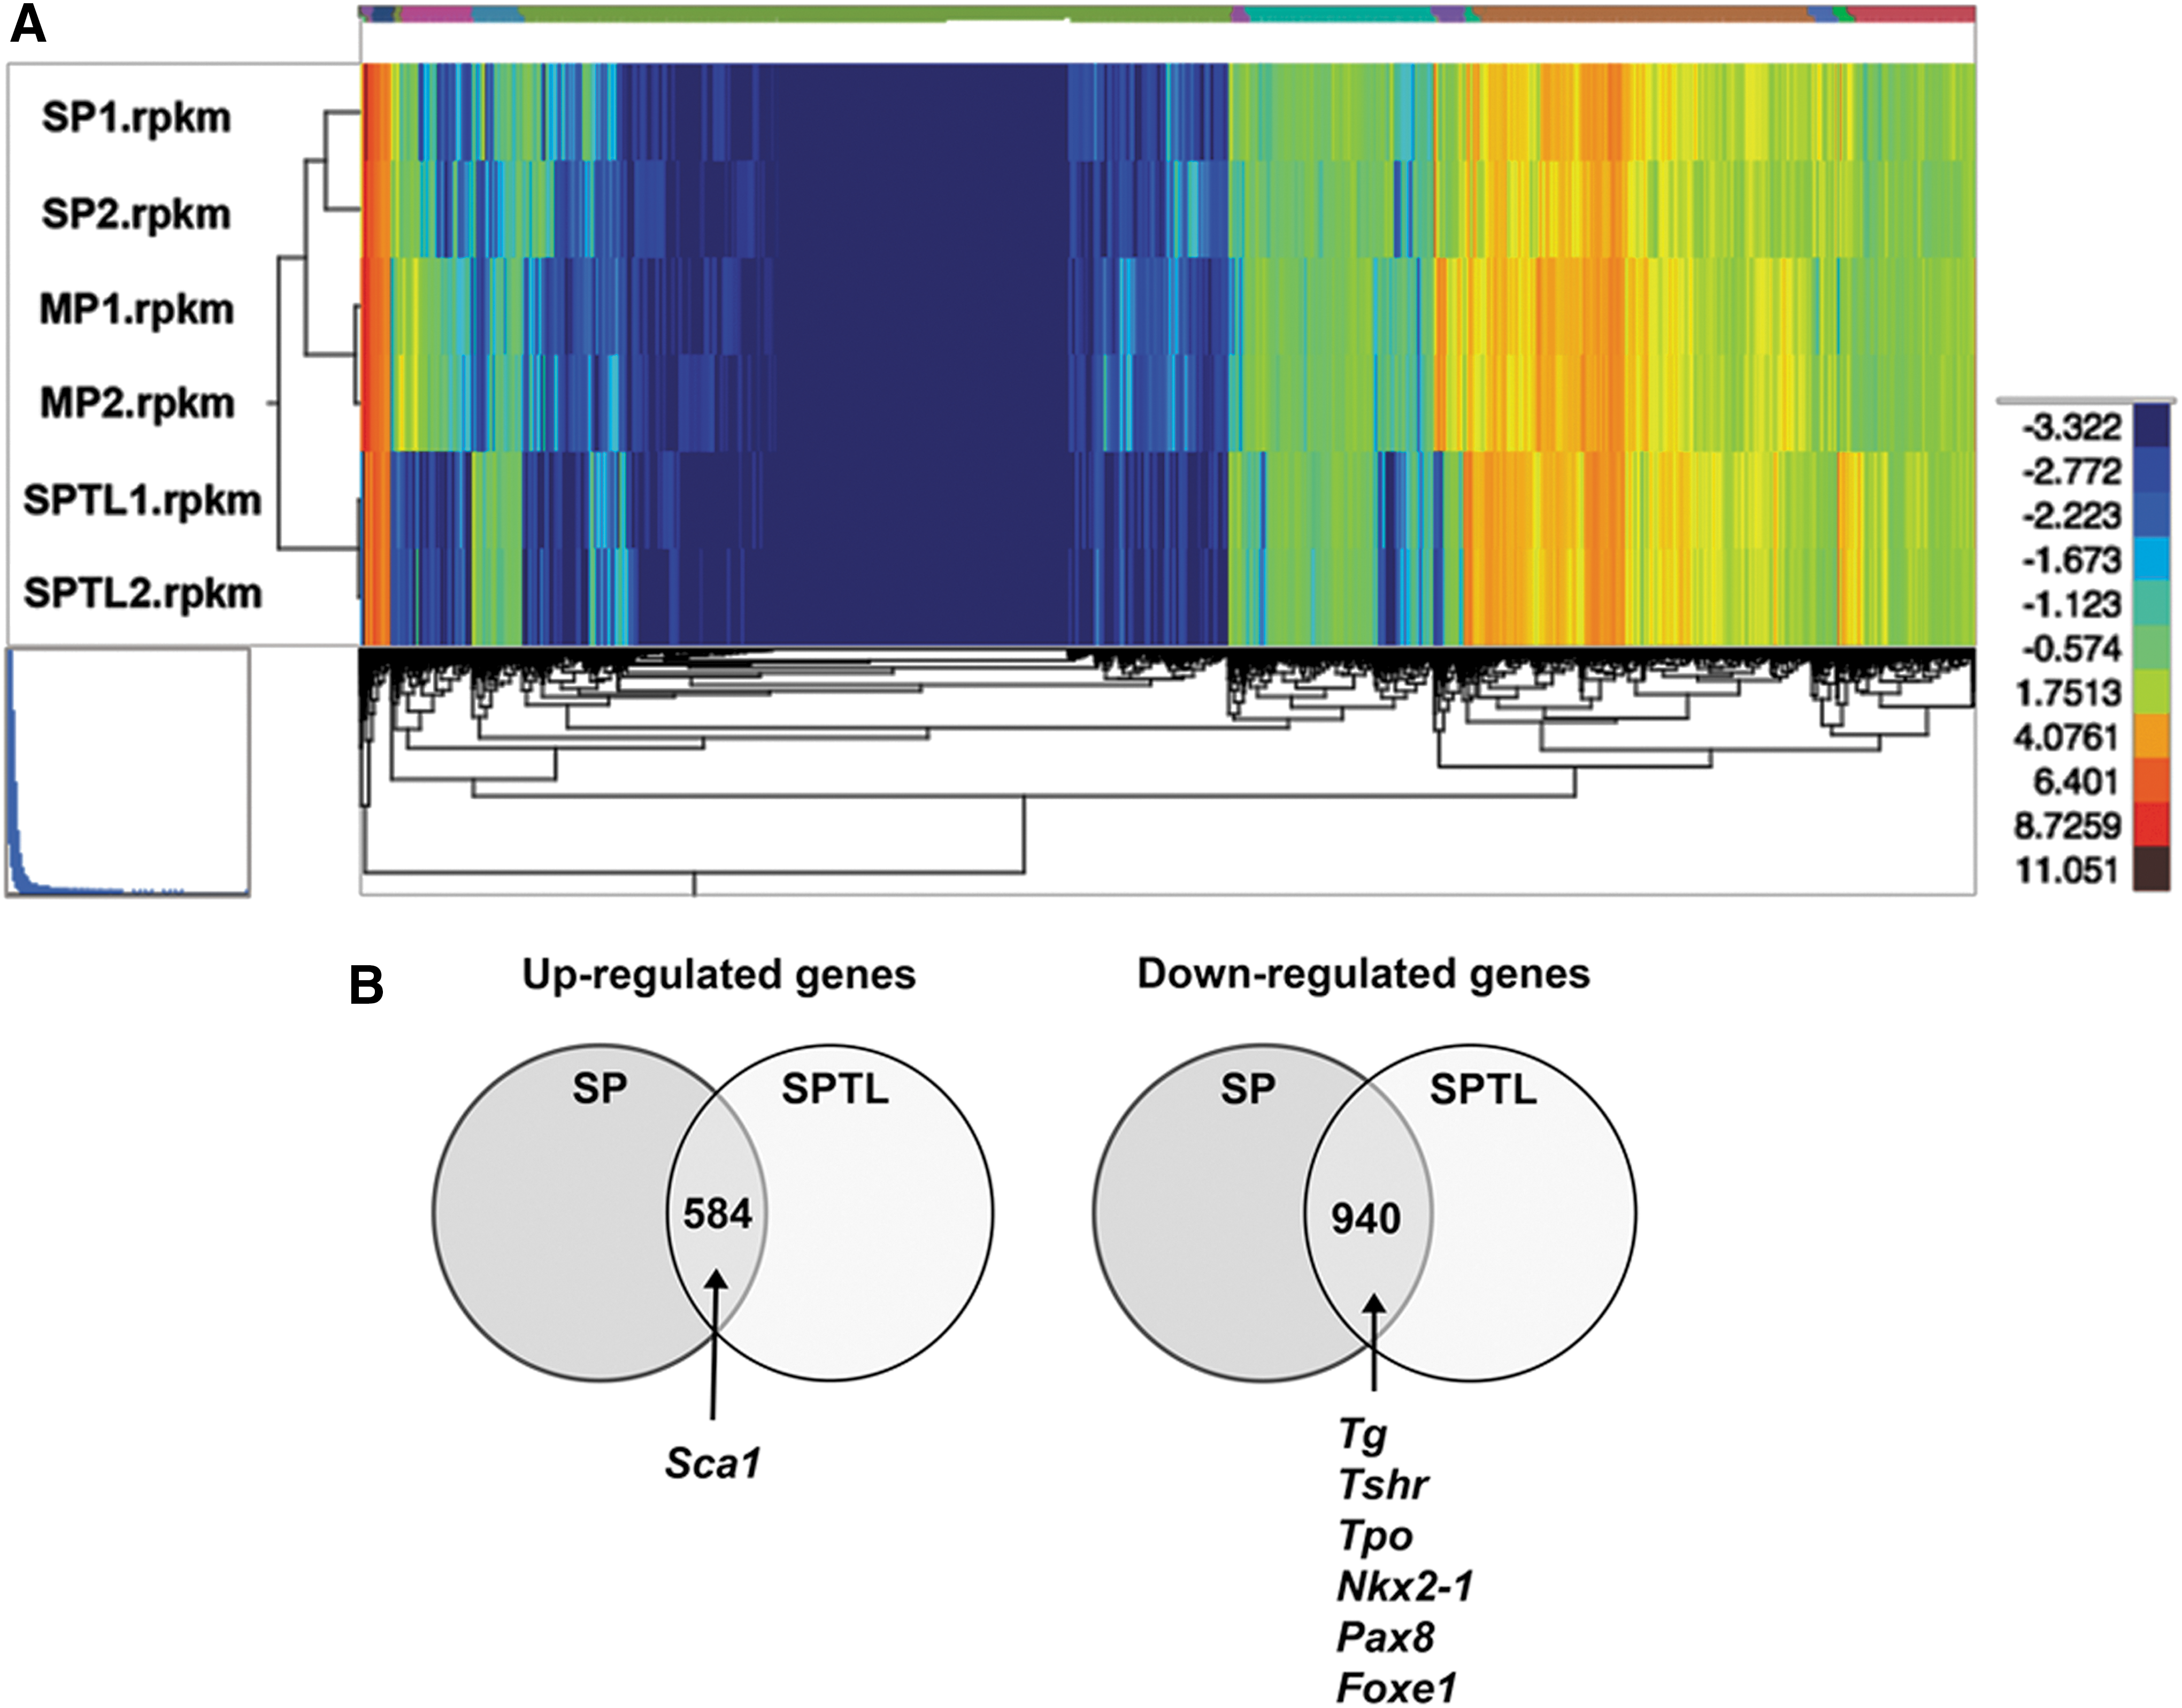
RNA seq analysis. (
GO analysis
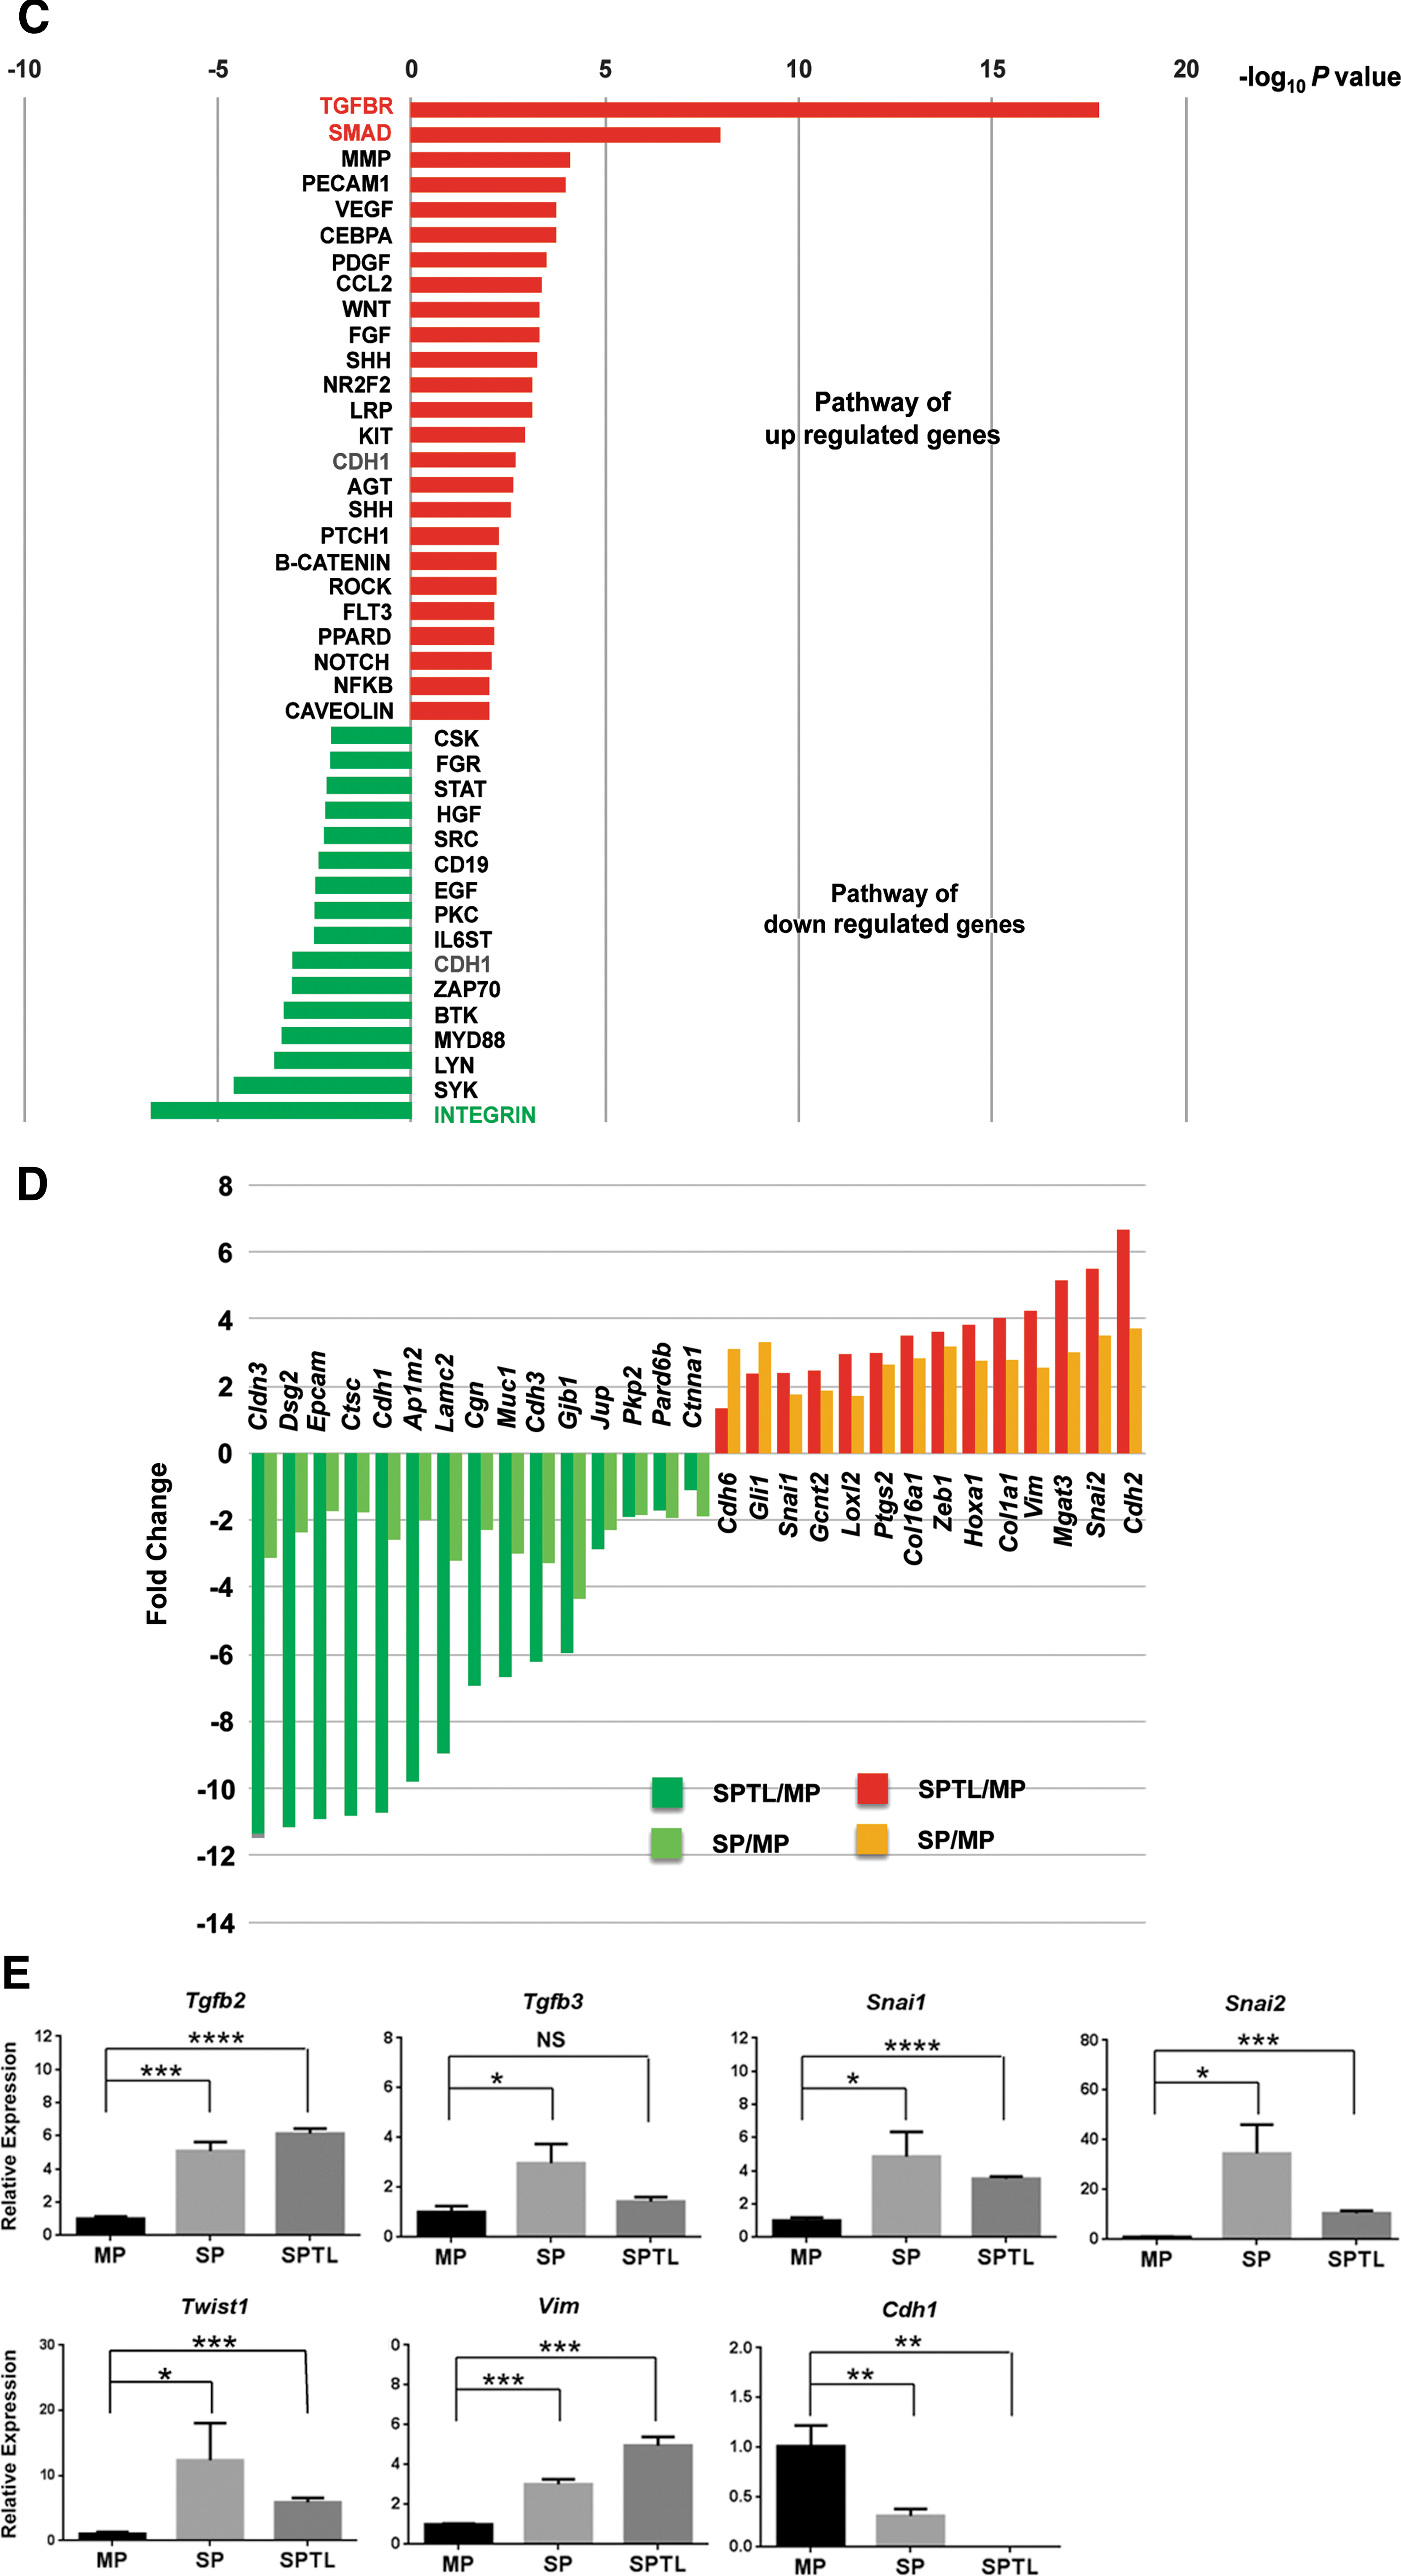
GO analysis for “biological processes” demonstrated that the commonly upregulated genes compared between SP and SPTL cells were involved in morphogenesis and development, while the downregulated genes were involved in adhesion, junction, localization, and transport (Table 1). Various biological and/or cellular processes and their regulation were found in both up- and downregulated genes. GO analysis for “molecular functions” identified genes involved in protein binding, ion binding, and receptor binding for both up- and downregulated genes (Table 2). The list of observed genes in the GO “biological processes” and “molecular functions” share many transcription factors such as Gata2/4, various Hox genes, Meox2, and Tbx1, among others—transcription factors that play critical roles in development. Furthermore, pathway analysis of the commonly up- and downregulated genes for signal transduction pathway association determined using ingenuity pathway analysis revealed that most of the up- and downregulated signal transduction pathways were those related to EMT (Fig. 5C and Table 3). In particular, transforming growth factor beta (TGF-β; p = 0.00000000000000000169) and SMAD pathways (p = 0.0000000106), the two representative pathways of EMT, were the top two upregulated pathways with extremely low p-values, while the third top pathway of MMP had a much lower p value (0.0000790). On the other hand, the integrin pathway was the most downregulated pathway, and the cadherin 1 (E-cadherin) pathway was found in both up- and downregulated pathways. Several genes involved in the E-cadherin pathway were plotted based on fold changes relative to MP cells (Fig. 5D). SP and SPTL cells showed the same up- or downregulation for all the genes listed. The fold changes were in general larger for SPTL cells than SP cells, particularly for the downregulated genes, suggesting that the expression of the listed genes may have been enriched in SPTL cells. The qRT-PCR analysis showed that the expression of EMT-related genes such as Tgfb2, Tgfb3, Snai1, Snai2, Twist1, and Vim was higher in SP and/or SPTL cells compared with MP cells, while the expression of Cdh1, the epithelial marker, was lower in SP and SPTL cells (Fig. 5E). The results demonstrate that the gene-expression patterns obtained by RNA seq correlate well with the actual gene-expression patterns. These results altogether demonstrate that SPTL and SP cells share the common feature representative of EMT.
GO, gene ontology.
Gene-expression patterns of SP/SPTL cells were compared with mRNA profiles of 59 thyroid tumors (11 ATC and 48 papillary thyroid carcinoma [PTC]) obtained by microarray analysis, as described in (35). A Venn diagram was drawn after combining all altered genes together (Fig. 6 and Supplementary Table S3). The SP/SPTL cells and ATC shared 49 commonly up- and 61 commonly downregulated genes, while SP/SPTL cells and PTC shared only six commonly up- and four downregulated genes. The commonly upregulated genes in SP/SPTL cells and ATC included Snai2, Twist1, and Vim, while the commonly downregulated genes included Tshr, Tpo, Nkx2-1, and Foxe1. Pax 8 was found in commonly downregulated genes among all three groups: SP/SPTL, ATC, and PTC cells. Thus, SPTL/SP cells and ATC share enriched EMT markers.
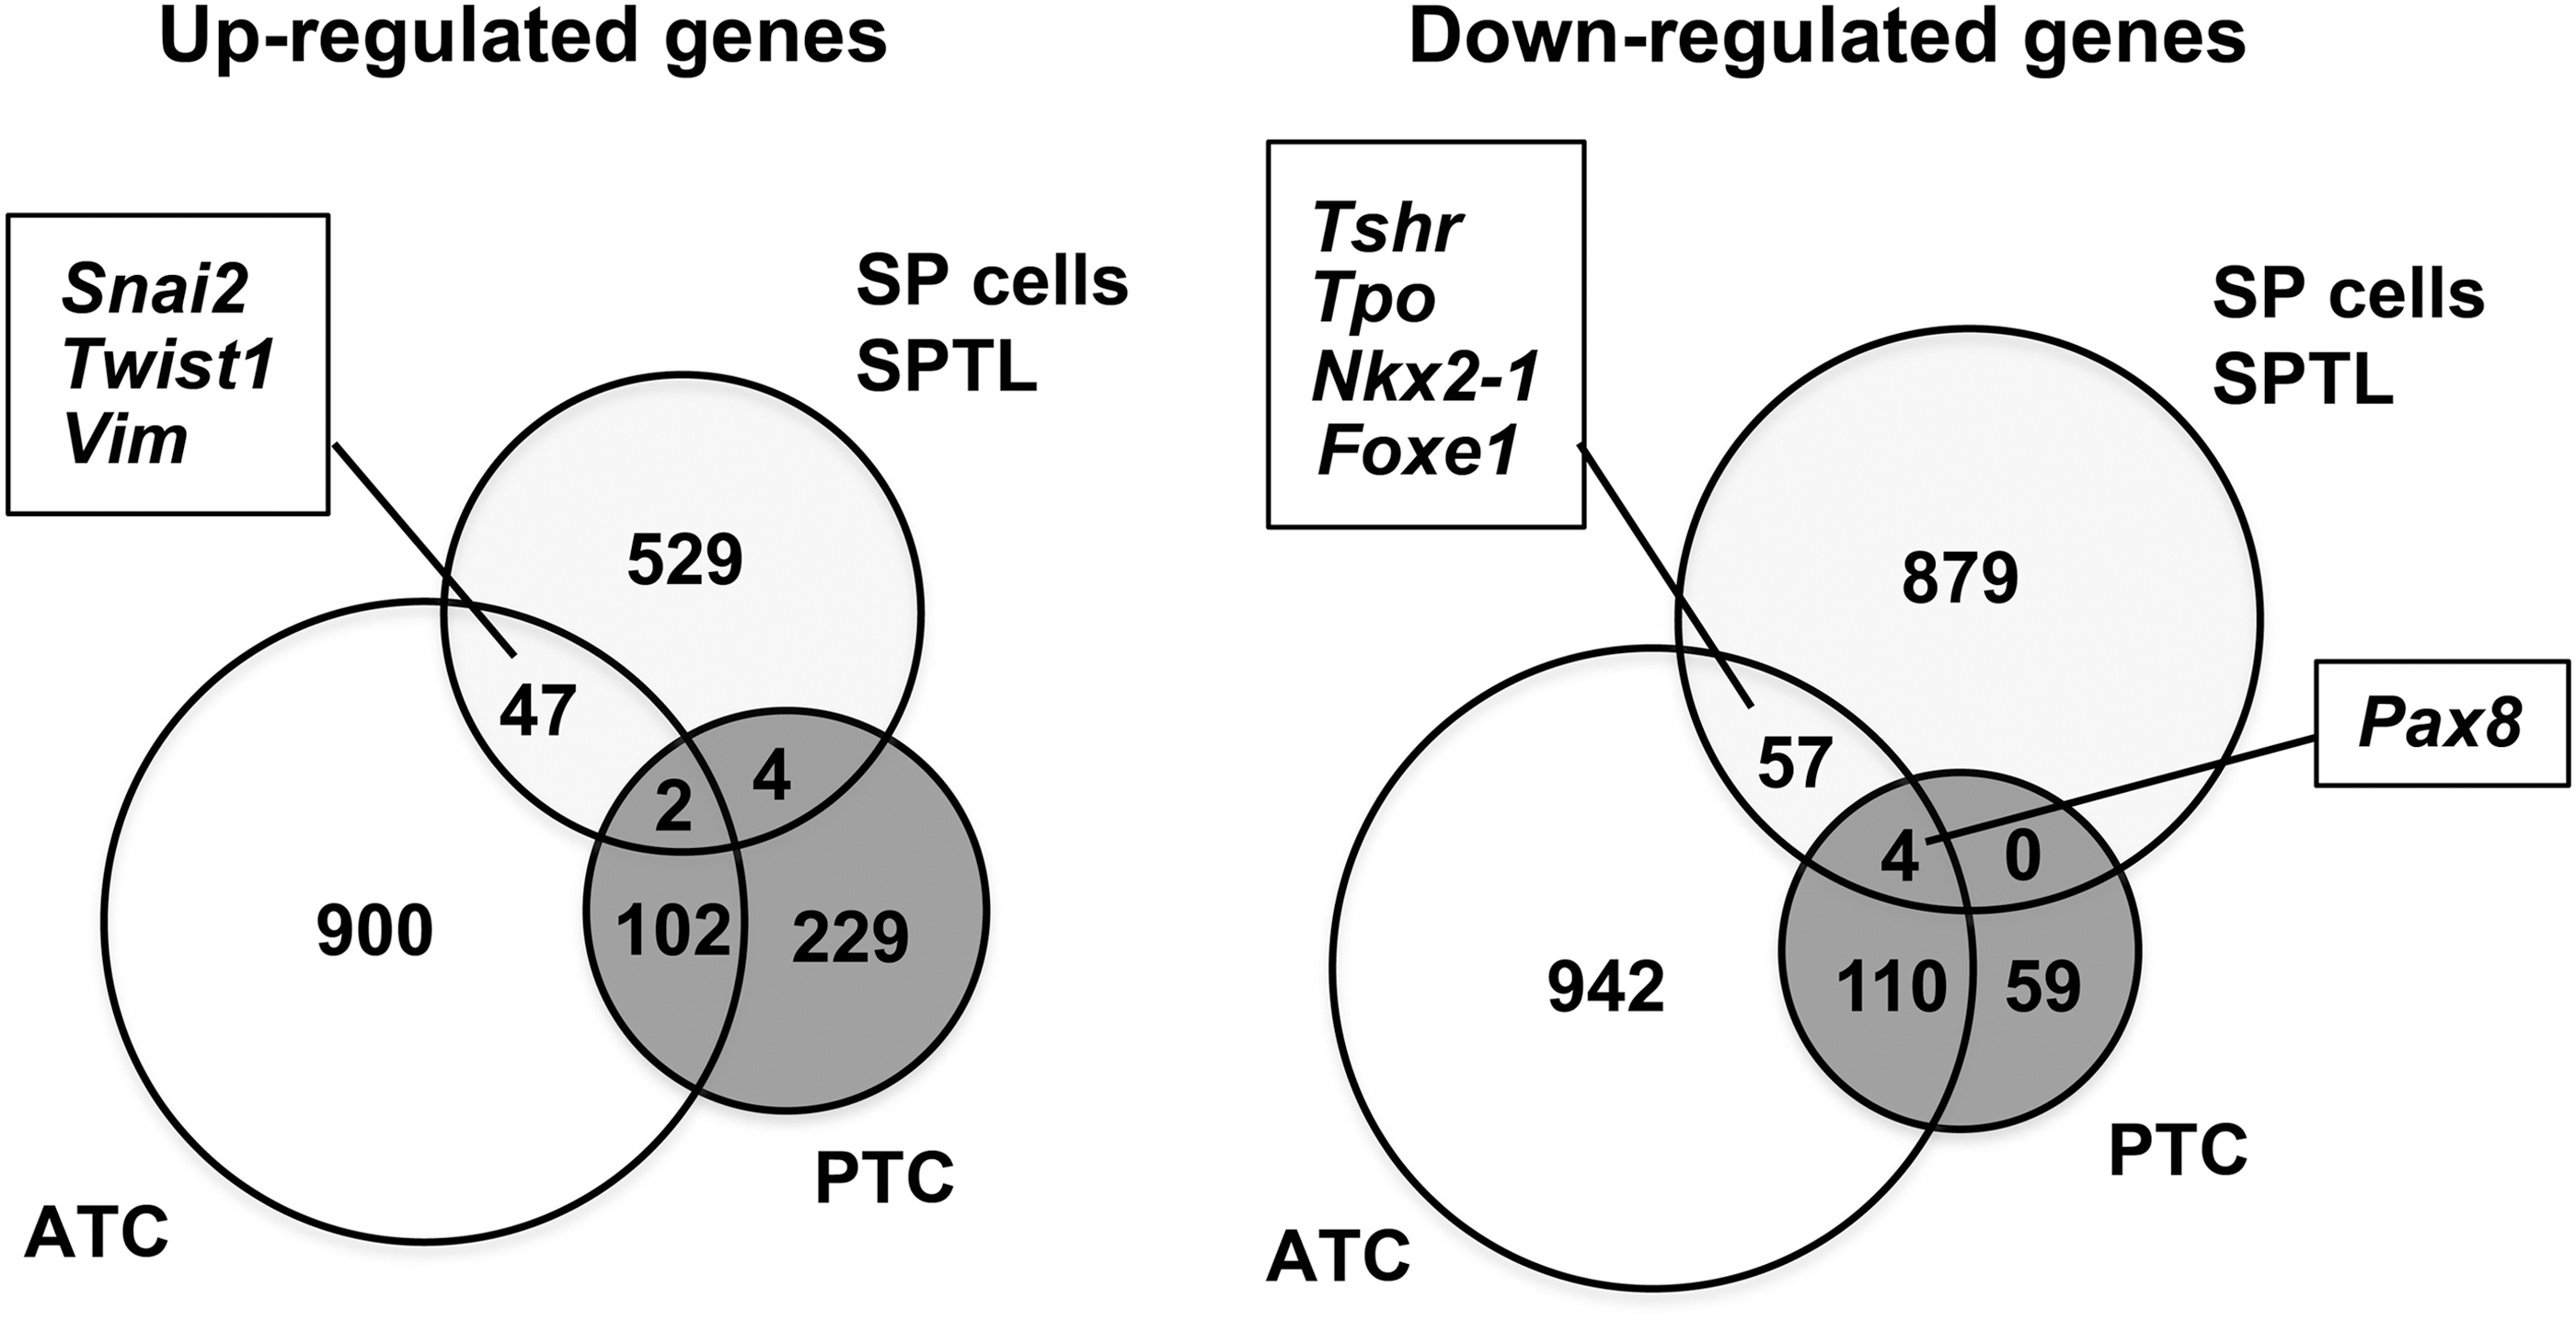
Venn diagram showing the similarity of SP/SPTL cells to anaplastic thyroid carcinoma (ATC) in gene-expression patterns. Data on ATC gene-expression patterns are from Hebrant et al. (35). Commonly up- and downregulated genes between SP/SPTL cells, ATC, and/or papillary thyroid carcinoma are shown.
Discussion
The establishment of a mouse thyroid cell line SPTL, derived from mouse thyroid SP cells that partially exhibit stem/progenitor characteristics, is herein described. This cell line offers a continuous source that can be obtained in large quantities for the study of adult thyroid stem/progeny cells. Previously, it has been demonstrated that approximately half of the thyroid SP cells express SCA1 (9). The newly established SPTL cell line expresses SCA1 at 100%, while SCA1 expression decreases once the SPTL cells start differentiating, thus suggesting that SCA1 could be used as a marker for thyroid stem/progenitor cells. Electron microscopy revealed that SPTL cells are not fully differentiated compared with rat thyroid-derived FRTL-424 and FRTL-5 cells and rat follicular cells (25,26). It is believed that this cell line is not the result of contaminated fibroblasts that overgrew during passages because (i) an increased expression of Nkx2-1 was not observed when NIH3T3 cells as representative mouse fibroblast cells were cultured in low serum; (ii) no fibers were detected in the electron microscope images, which quite often can be seen if the cells are fibroblast; and (iii) the expression of the thyroid-specific transcription factor NKX2-1 was increased when cells were cultured in low serum (see below).
SPTL cells did not express typical stemness genes such as Oct4, Nanog, and Rex1. Instead, they expressed Gata transcription factors, known to be endoderm specification genes (36,37), suggesting that SPTL cells may have already been committed to form endoderm lineage cells. This seems reasonable, given that SPTL cells were established from thyroid SP cells. The stem/progenitor-like characteristics of SPTL cells were clearly demonstrated by their ability to grow continuously and by the induction of transcription factors critical for thyroid differentiation such as NKX2-1 in low serum culture in vitro, and the incorporation into follicles in vivo. It is known that various growth factors contained in serum play a role in the proliferation of cells. Cells continuously proliferate under high serum concentrations (10%), while low serum concentrations (1%) permit their terminal differentiation (30,31,38). Under low serum culturing of SPTL cells, the induction of thyroid differentiation marker genes other than Nkx2-1 was not observed, although the expression of Foxe1, Nis (Scl5a5), and Tpo mRNAs appeared to have slightly increased toward the end of six days in culture. It is felt that this increase may not be biologically meaningful due to the high qRT-PCR Cq values (for Foxe1 and Tpo >32), absent expression of PAX8 (particularly on day 6), and the extremely low relative expression levels of Pax8 and Foxe1 mRNAs compared with primary thyroid cells. PAX8 and FOXE1, in addition to NKX2-1, are the critical transcription factors for the expression of most thyroid differentiation marker genes including Nis and Tpo (39 –41). The addition of other growth factors to the media such as FGFs, EGF, and activin A, with and without TSH (32,33), did not enhance Nkx2-1 expression, nor did it induce the expression of any other thyroid differentiation marker genes. Thus, SPTL cells appear to start differentiating into thyroid-like cells under low serum conditions, but they cannot fully differentiate.
Induced expression of NKX2-1 was found in only 1.3% of SPTL cells, in which no PAX8 expression was observed. Others found that high expression of Nkx2-1 and Pax8 was required and sufficient to induce the expression of all thyroid differentiation marker genes and to form functional follicles from ES cells (42). In follicle-like structures obtained in 3D cultures in vitro, no expression of NKX2-1, PAX8, or thyroglobulin as thyroid differentiation markers were found. Results for the expression of TPO, TSHR, and NIS could not be obtained due to the lack of availability of appropriate antibodies that work in mouse tissues. A number of different techniques/maneuvers, including those to produce spheres before subjection to 3D cultures, and the use of different cell/sphere numbers and culture conditions were tried to obtain a condition that better induces differentiation of SPTL cells in 3D culture. Unfortunately, it was not possible to produce follicles that are positive for the aforementioned thyroid differentiation markers. The low number of NKX2-1-positive cells with no PAX8 expression may be one of the reasons that SPTL cells did not form functional follicles in vitro. It is possible that many differentiated cells, or cells having the capacity to differentiate fully, may be required to produce functional follicles. On the other hand, in the mouse thyroid in vivo, the majority of cells are differentiated follicular cells, which may result in a few GFP-positive SPTL cells with weak expression of NKX2-1 to become part of the follicles through a currently unknown mechanism. Alternatively, folliculogenesis may consist of two steps: NKX2-1 is required for the formation of follicles, followed by the expression of PAX8 that is required for the development of functional follicles, a stage where many thyroid differentiation marker genes become expressed (Fig. 7). It is currently not known whether the NKX2-1-positive cells that were found in mice eventually express PAX8 and differentiate into functional follicular cells. It is also worth noting that SPTL cells when injected through the tail vein, homed to the thyroid, the tissue of their origin. Homing of stem cells to a target tissue has been described for many years, mainly for bone marrow and other source-derived mesenchymal stem cells, as well as other stem cells such as epidermal neural crest stem cells and cardiac progenitor cells (34,43,44). To the authors' knowledge, this is the first report showing that thyroid stem/progenitor-like cells home to the thyroid.
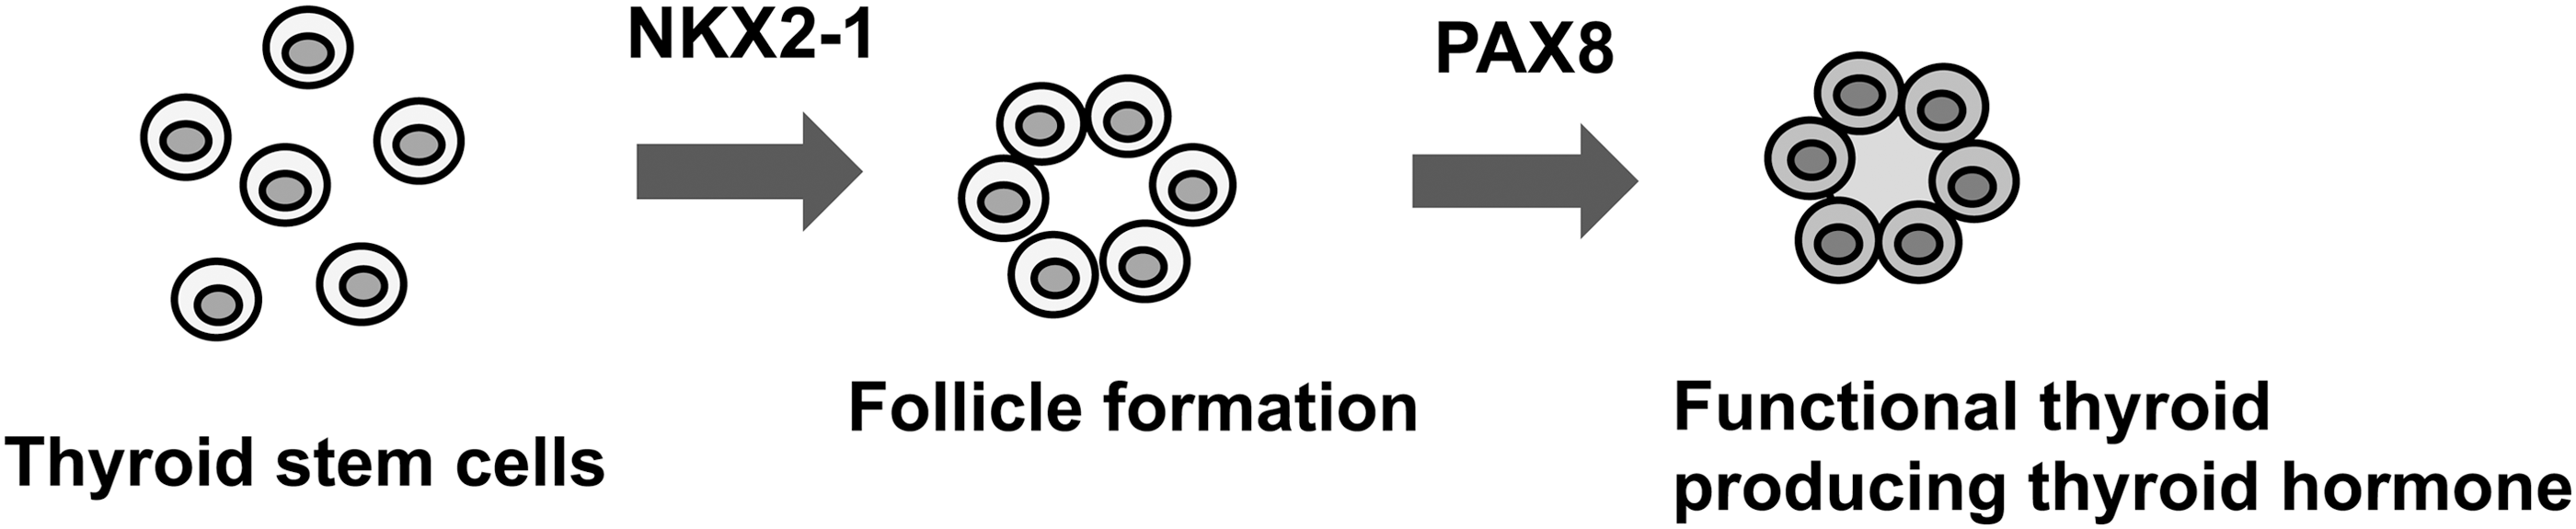
Two-step process of thyroid folliculogenesis. Thyroid follicle formation requires NKX2-1 expression, while the expression of PAX8 is required for the follicle to become functional, resulting in the expression of many thyroid differentiation marker genes and eventual thyroid hormone synthesis.
One of the interesting aspects of the current study is that SPTL and SP cells share common features, representative of EMT compared with MP cells, and that SPTL cells appear to be enriched in the expression of EMT-related genes. EMT is known to play a role in the maintenance of stemness, development, and diseases, particularly cancer (45 –48). In a comparative study of gene-expression patterns between ATC versus PTC and FTC, the TGF-β signaling pathway was among the top identified pathways (49). Further, using human thyroid tissues, the expression of SNAI1, SNAI2, TWIST1, and/or ZEB1 was found only in ATC or ATC-derived cells, but not normal cells or other thyroid tumor tissues or cell lines, whereas CDH1 was expressed only in the latter thyroid tissues/cells, but not in ATC tissues/cells, as examined by immunohistochemistry and/or qRT-PCR (50 –52). Based on these results, it is suggested that SPTL cells have more similarity to ATC than they do to PTC in gene expression profiles. However, it should be noted that there is a possibility that SPTL cells express genes representative of EMT, as found in ATC, simply because they are already in a fibroblastoid mode, as seen in the two-dimensional culture. It was recently demonstrated that mouse thyroid SP cells highly express genes involved in cancer and/or cancer metastasis/invasion compared with non-SP cells by microarray analysis (14). However, the fact that SPTL cells did not develop tumors for at least six months following injection suggests that an EMT-rich condition does not always predispose to carcinogenesis, although there remains the possibility that it may take a longer latency time.
In conclusion, SPTL cells were established from mouse thyroid SP cells that can partially differentiate into thyroid-like cells, and be incorporated as part of follicles in in vivo mouse injection models. SPTL cells have gene-expression patterns enriched in EMT, the main player involved in stemness and cancer. Thus, SPTL cells may provide an excellent tool to study thyroid adult stem/progenitor cells, including thyroid cancer stem cells, and to understand their roles and the mechanisms of thyroid carcinogenesis.
Footnotes
Acknowledgments
We would like to thank Subhadra Banerjee and Karen M. Wolcott (Flow Cytometry Core Facility, Laboratory of Genome Integrity, CCR, NCI) for their help in FACS analysis; Poonam Mannan, Langston Lim, and Susan H. Garfield (CCR Confocal Microscopy Core Facility, Laboratory of Cancer Biology and Genetics, NCI) for their help in confocal microscopy; Jerrold Ward (VetPathology, Montgomery Village, MD) for his advice on electron microscope analysis; and Tao Deng (NCI) for providing us with ES cells cDNA for qRT-PCR analysis.
This work was supported by an Intramural Research Program of National Cancer Institute, Center for Cancer Research ZIABC005522 (to S.K.), National Heart Lung and Blood Institute 1ZICHL006058 (to J.Z.), Federal funds from the National Cancer Institute, National Institutes of Health under contract HHSN26120080001E (to K.N.), and Japan Society for the Promotion of Science Research Fellowship for Japanese Biomedical and Behavioral Researchers at NIH (to T.M.).
Author Disclosure Statement
The authors have nothing to disclose.
References
Supplementary Material
Please find the following supplemental material available below.
For Open Access articles published under a Creative Commons License, all supplemental material carries the same license as the article it is associated with.
For non-Open Access articles published, all supplemental material carries a non-exclusive license, and permission requests for re-use of supplemental material or any part of supplemental material shall be sent directly to the copyright owner as specified in the copyright notice associated with the article.