
Abstract
Background:
Information on determinants and change of thyroid function over time is sparse and conflicting but crucial for clinical interpretation and research. Therefore, our aim was to systematically investigate determinants of thyroid-stimulating hormone (TSH), free thyroxine (FT4) (as markers of thyroid function), their mutual relation (as marker of thyroid function set point) and changes in thyroid function over time.
Methods:
We included 9402 participants from the Rotterdam Study not taking thyroid medication and with available thyroid function measurements. Repeated measurements (6.5-year interval) were available for 1225 participants. The association of selected determinants with TSH, FT4, and their mutual relation (reflecting thyroid function set point) was estimated using linear regression models using restricted cubic splines with three knots. The factors investigated were age, sex, body mass index (BMI), tobacco smoking, alcohol use, thyroperoxidase antibodies (TPOAb), and common genetic factors.
Results:
Most influential determinants of TSH were age, smoking, genetic determinants, and TPOAb levels (p < 0.001). For FT4, most influential determinants were age, BMI, sex, genetic determinants and TPOAb levels (p < 0.001). Older age, female sex, and increased TPOAb levels were associated with a stronger relation between TSH and FT4. TSH levels did not change over time, irrespective of age. FT4 levels increased over time, most prominently in those older than 65 years of age (mean increase of 4.5 pmol/L).
Conclusions:
The main factors that influence the relationship between thyroid hormone and molar concentrations of TSH in our population-based cohort study are age, smoking, BMI, TPOAb levels, and common genetic variants. The set point that determines TSH secretion as it relates to negative thyroid hormone feedback is modified by age, sex and TPOAb positivity. FT4 levels increase over time, with a more pronounced increase in the elderly, while TSH values seem stable over time. Our results question the current notion of an increase of TSH with increasing age.
Introduction
T
The identification of thyroid function determinants and the quantification of the extent of potential effects is important for clinical interpretation and research, yet the evidence on determinants of thyroid function is insufficient and conflicting. Therefore, we aimed to investigate whether and to what extent age, sex, BMI, smoking, alcohol use, TPOAb, and common genetic variants could be determinants of TSH, FT4, and their mutual relationship in a large prospective population-based study. Furthermore, we set out to describe changes in thyroid function over time using repeated measurements.
Methods
The Rotterdam Study
All analyses were performed in the Rotterdam Study (RS), a prospective population-based cohort study that investigates determinants and occurrence of cardiovascular, neurological, ophthalmologic, psychiatric, and endocrine diseases in the middle-aged and elderly population. The aims and design of the RS have been described in detail elsewhere (23). We included participants from three independent cohorts of the RS. The RS Cohort 1 (RS I) includes participants aged 55 years and older, and baseline data were collected during 1990–1993. RS Cohort 2 (RS II) includes participants aged 55 years and older, and baseline data were collected from 2000 to 2001. For the RS Cohort 3 (RS III), all residents aged 45 years and over who had not been invited before were asked to participate and baseline data were collected from 2006 to 2008. The Medical Ethics Committee of the Erasmus University approved the study protocols and by the Ministry of Health, Welfare and Sport of the Netherlands, implementing the “Wet Bevolkingsonderzoek: ERGO (Population Studies Act: Rotterdam Study).” All included participants provided a written informed consent in accordance with the Declaration of Helsinki to participate in the study and to obtain information from their family physicians.
Study population
Participants from study cohorts RS I, visit 3 (RSI-3); RS II, visit 1 (RSII-1); and RS III, visit 1 (RSIII-1) were eligible for the cross-sectional analyses if TSH or FT4 measurements were available (Supplementary Fig. S1A; Supplementary Data are available online at
Thyroid function measurements
TSH, FT4, and/or TPOAb assessment for the cross-sectional analyses (1997–2007, Supplementary Fig. S1A, Assay 1) was performed at the same time in all three cohorts in serum sample stored at −80° C of 9402 participants not using thyroid medication (the electrochemiluminescence immunoassay for thyroxine, thyrotropin, and thyroid peroxidase antibodies; Roche, Mannheim, Germany). TPOAb levels greater than 35 kU/mL were regarded as positive, according to assay manufacturer recommendations.
For the longitudinal analyses, thyroid function measurements were performed in participants of RS I (not using thyroid medication) using a different assay (TSH Lumitest; Henning, Berlin, Germany; TPOAb with ELISA; Milenia, Diagnostic Products Corp, Los Angeles, CA; and FT4; Vitros, ECI Immunodiagnostic System, Ortho-Clinical Diagnostics, Amersham, United Kingdom) and were conducted at two different time points between 1990 and 2000 with this same assay (n = 1255, Supplementary Fig. S1B, Assay 2). In the assay used for the longitudinal analyses, TPOAb levels greater than 60 kU/mL were regarded as positive, according to assay manufacturer recommendations. The measurements performed with the two different assays were highly correlated (Spearman correlation coefficient [r] = 0.96 for TSH, p < 0.0001, r = 0.81 for FT4, p < 0.0001 and r = 0.68 for TPOAb, p < 0.0001).
Other variables
Based on previous studies, biological plausibility and data availability (4,6 –8,19,24), we selected age, sex, tobacco smoking, alcohol intake, BMI, TPOAb, and a genetic risk score (GRS) of TSH or FT4 as potential determinants for thyroid function. Information on smoking was derived from baseline questionnaires and categorized in current, previous, and never smokers. Information on alcohol consumption was acquired from questionnaires where participants were asked for the average daily consumption of alcohol. Alcohol intake was recorded in grams per day and then divided into quintiles of daily intake. BMI was calculated as weight in kilograms divided by height in meters squared.
Genotyping and genetic risk score
Genotyping was conducted, in self-reported white participants, using the Illumina 550 K and 610 K arrays and details are described elsewhere (23). Participants were excluded if they had excess autosomal heterozygosity, mismatch between called and phenotypic sex, or were recognized as being an outlier with identical-by-state clustering analysis. We used MACH to impute SNP dosages based on the phase 1, version 3, reference panel from the 1000 Genomes Project (25,26). For this study, we selected common SNPs previously reported to have an association with TSH or FT4, from the largest multi-center GWAS of >25,000 individuals (6). A GRS was compiled using 20 SNPs that have been associated with TSH and six SNPs that have been associated with FT4 (Supplementary Table S1). We calculated a weighted GRS by multiplying the number of risk alleles at each locus by the corresponding reported β coefficient from the abovementioned GWAS and then summing the products. The total score was then divided by twice the average effect size multiplied by 100 to rescale the scores to a range between 0 and 100. A GRS for TSH and FT4 was available for a total of 7125 participants.
Statistical analyses
We assessed the relation and explained variability (r 2) of the environmental and common genetic determinants with TSH or FT4 and their mutual relation, in univariable and multivariable ordinary least squares linear regression models. Nonlinearity was assessed with restricted cubic splines using three knots at the 10th, 50th, and 90th percentile, and we additionally adjusted the multivariable analyses for cohort. Effect estimates are reported as standardized β (β per SD of the determinant). As a sensitivity analysis, we repeated these models after exclusion of participants within the lowest and highest 2.5-percentile of TSH and FT4. To account for multiple testing we applied a Bonferroni correction, considering 0.05 divided by the number of tested variables multiplied by the number of outcomes as significant [0.05/(7 × 2) = 0.0036]. Furthermore, we assessed changes in TSH or FT4 over time using ordinary least squares linear regression models. For these analyses, we added time between the two measurements and FT4 or TSH at baseline to the multivariable models. Also, we compared participant baseline characteristics for subjects with and subjects without follow-up measurements of TSH and FT4. As a sensitivity analysis, we repeated these models after exclusion of participants receiving thyroid medication during follow-up. Additional sensitivity analyses performed: (1) excluding participants with TPOAb positivity, as defined by the assay manufacturer, and (2) excluding those with self-reported thyroid disease. TSH and TPOAb levels were log-transformed (natural logarithm) for the continuous analyses to approximate a normal distribution and denoted as lnTSH and lnTPO. Multiple imputations were performed in case of missing variables (less than 2% for all variables). Statistical analyses were conducted using R statistical software (rms, Himsc, visreg packages; R-project, Institute for Statistics and Mathematics, R Core Team (2013), Vienna, Austria, version 3.0.2) or SPSS version 21 (SPSS; IBM, New York).
Results
Environmental characteristics as determinants of TSH and FT4
The final study population consisted of 9402 participants for the cross-sectional analyses with a mean age of 65.1 years, of which 55.9% were female (Table 1). The associations of the potential determinants with TSH are shown in Figure 1 and Supplementary Table S2. For TSH levels the most influential non-genetic factors were age (β −0.07), smoking (β −0.07) and TPOAb levels (p < 0.001). For FT4, the environmental determinants with the largest influence were age (β 0.07), BMI (β −0.10), sex (−0.09) and TPOAb levels (p < 0.001) (Fig. 2, Supplementary Table S2). Repeating the analyses after exclusion of participants in the highest and lowest 2.5th percentile, did not change the associations meaningfully except for sex and age (Supplementary Table S3). In these analyses, the association between sex and thyroid function remained significant in all models, while the association between age and TSH lost statistical significance after correction for multiple testing.
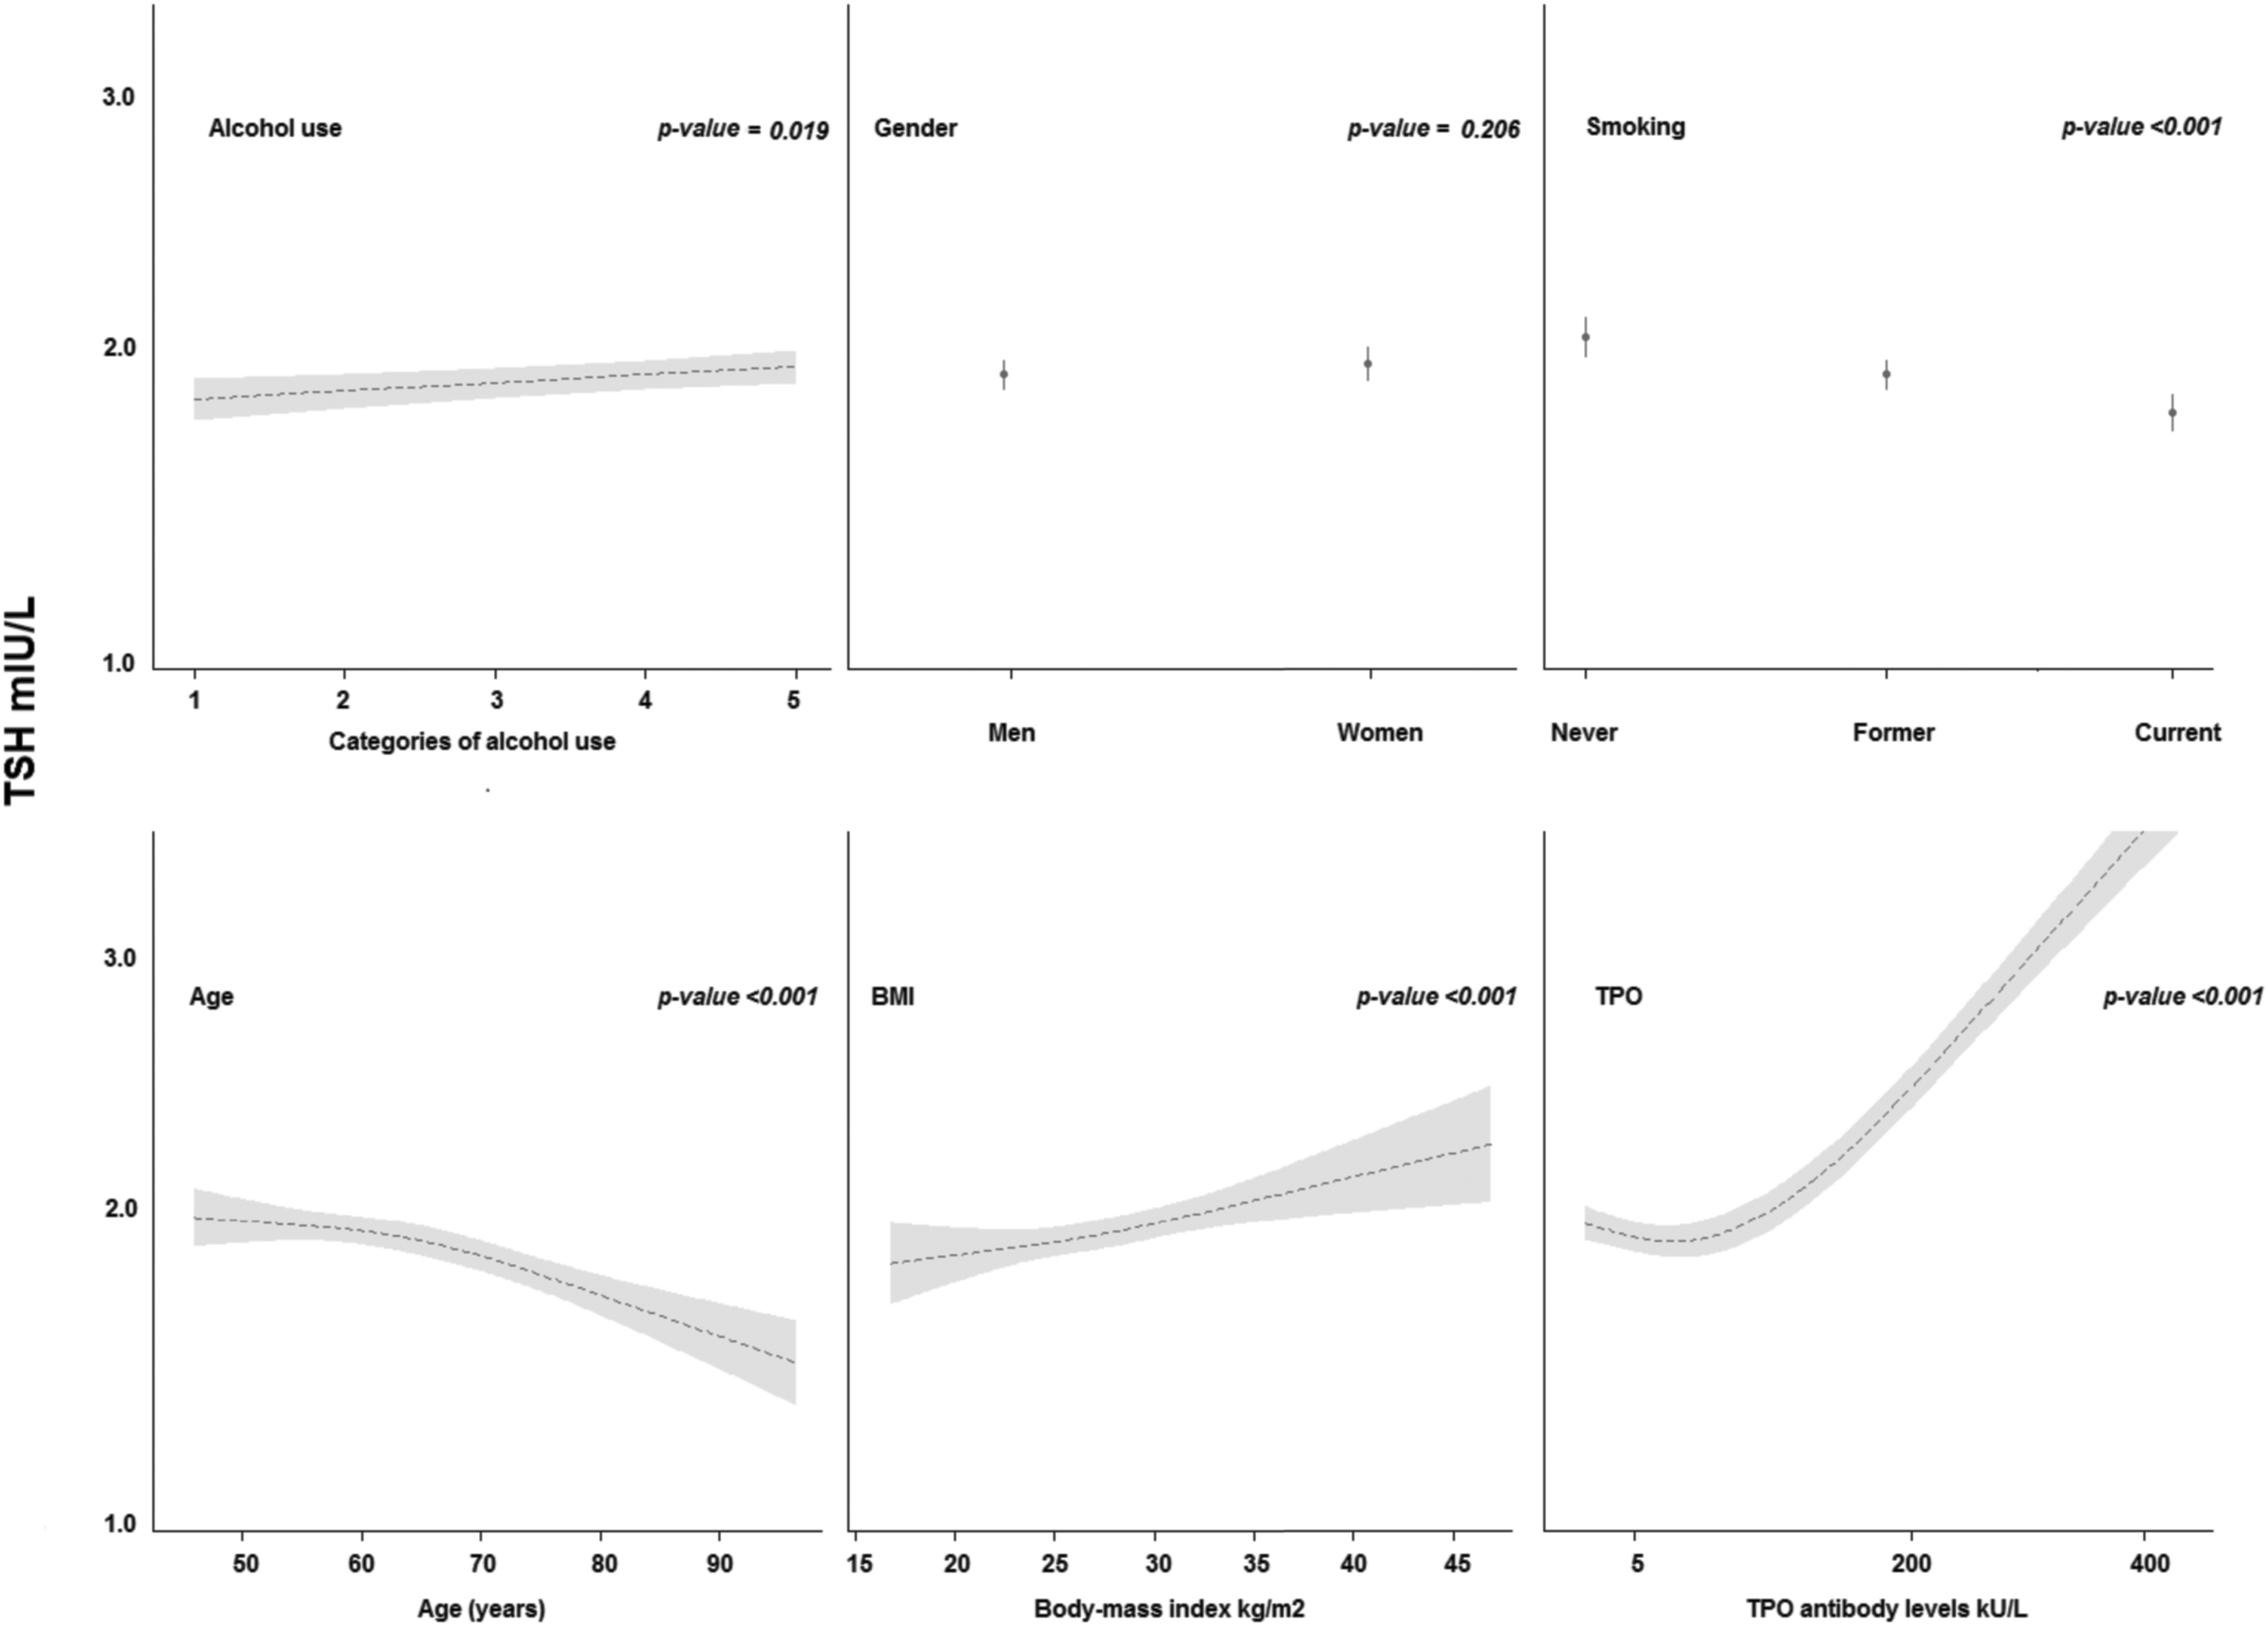
The association of environmental and existential determinants with (TSH) levels. The association of each determinant with TSH is depicted as the regression line using ordinary least square restricted cubic splines regression with three knots or logistic regression and the accompanying 95% confidence interval for the entire population. p-Values are for the plotted association. These associations were evaluated adjusting each determinant for all other determinants. Alcohol categories represent quintiles of alcohol use (grams/day) in the population, where quintile one has an average use of 0.06 grams of alcohol per day; quintile two, 3.5; quintile three, 11.8; quintile four, 16.3; and quintile five, 32.9. TSH, thyroid-stimulating hormone.
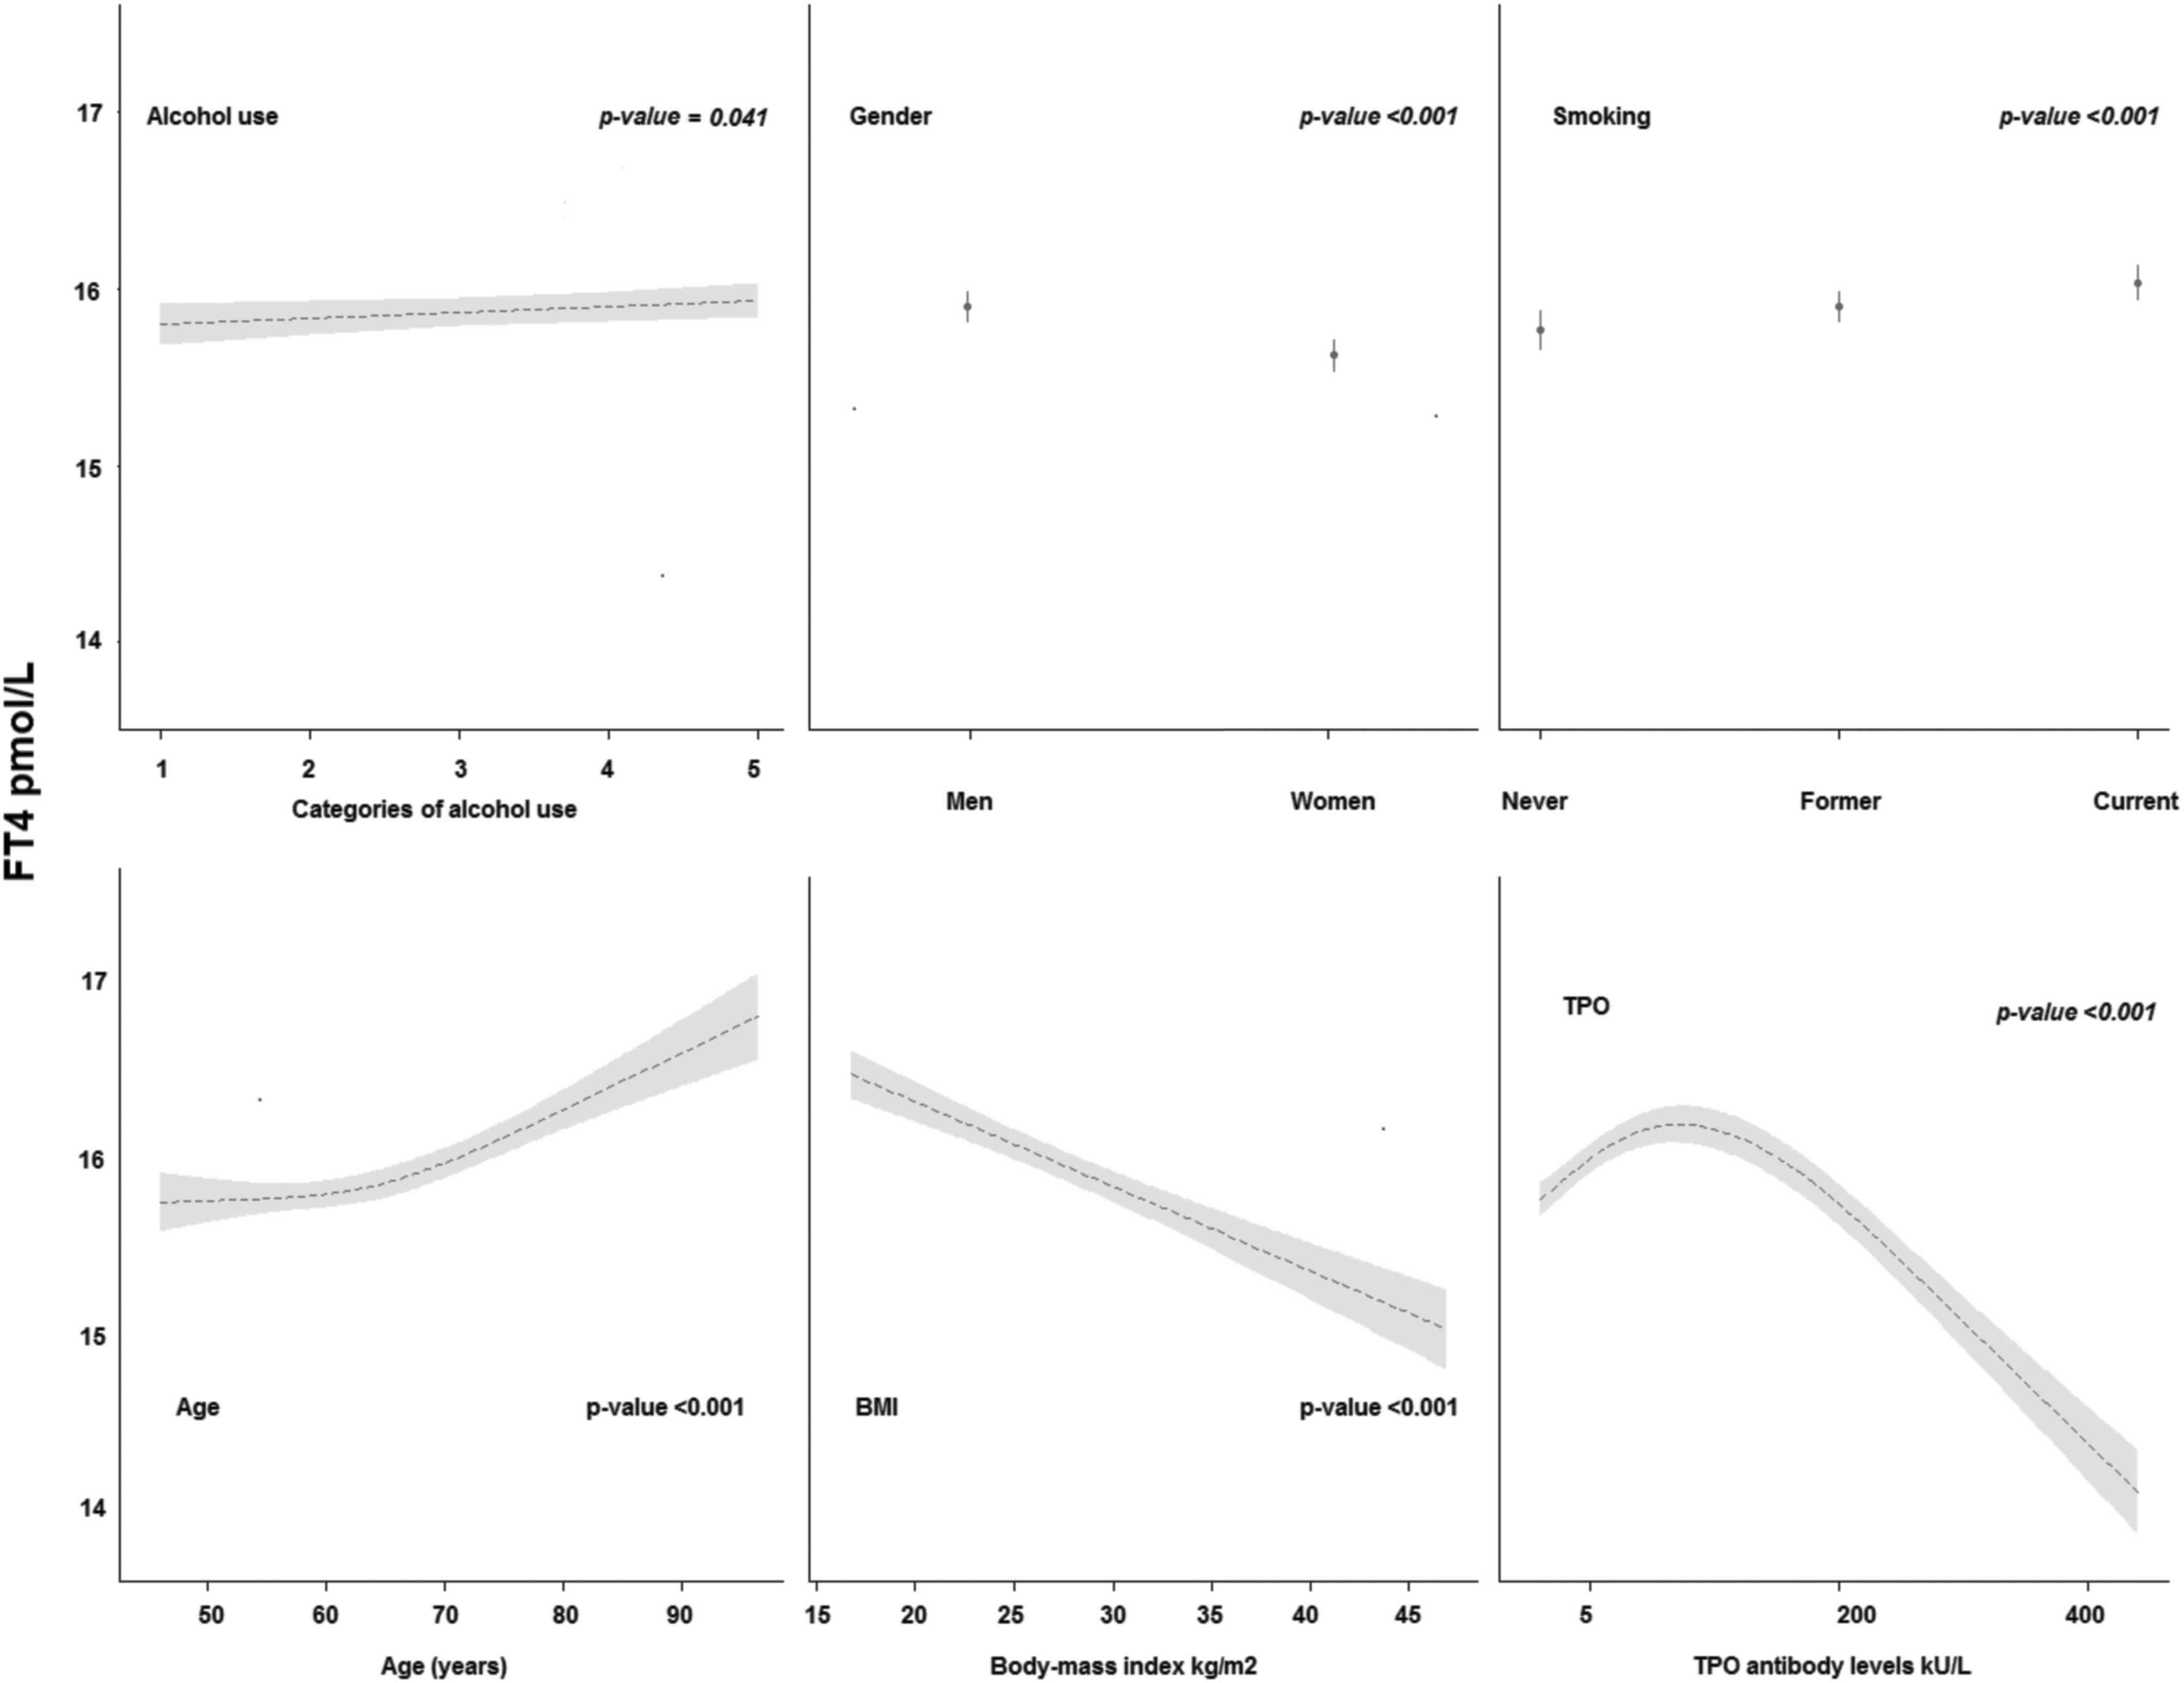
The association of environmental and existential determinants with FT4 levels. The association of each determinant with FT4 is depicted as the regression line using ordinary least square restricted cubic splines regression with three knots or logistic regression and the accompanying 95% CI interval for the entire population. p-Values are for the plotted association. These associations were evaluated adjusting each determinant for all other determinants. Alcohol categories represent quintiles of alcohol use (grams/day) in the population, where quintile one has an average use of 0.06 grams of alcohol per day; quintile two, 3.5; quintile three, 11.8; quintile four, 16.3; and quintile five, 32.9. FT4, free thyroxine.
Values are means and SD unless otherwise specified.
Of the 9402 participants, 9392 had both FT4 and TSH measurements. A total of 9391 participants had TPO measurements.
TPOAb positivity was defined as >35 kU/L.
BMI, body-mass index; FT4, free thyroxine; IQR, interquartile range; SD, standard deviation; TPO, thyroperoxidase; TPOAb, thyroperoxidase antibodies; TSH, thyrotropin.
Genetic risk score as determinant of TSH and FT4
The GRS for TSH explained 4.3% of variance in TSH levels in the population (Supplementary Table S4). The GRS for FT4 explained 2.3% of population variance in FT4 levels. After exclusion of participants in the highest and lowest 2.5th percentile, the r 2 of the GRS for TSH and FT4 was 5.6% and 2.5% respectively. Including both common the GRS and environmental determinants in the model, the r 2 increased to 10.3% (+4.7%) for TSH and 5.1% (+2.6%) for FT4.
Determinants of the thyroid function set point
There was a negative log-linear association between TSH and FT4 (Supplementary Fig. S2). The association between TSH and FT4 differed according to age, sex and TPOAb levels (Fig. 3). Subjects with higher age, women, and subjects with higher TPOAb levels had a stronger log-linear relationship between TSH and FT4 (p for interaction <0.001). As a consequence, for women with TSH levels in the lower range, FT4 levels were higher than in men with the same level of TSH values, whereas in the higher range of TSH women had lower FT4 levels than men. The association of FT4 with TSH was not modified by BMI, smoking or alcohol (p for interaction >0.50). The association and effect modification remained similar after the exclusion of participants in the highest and lowest 2.5th percentile.
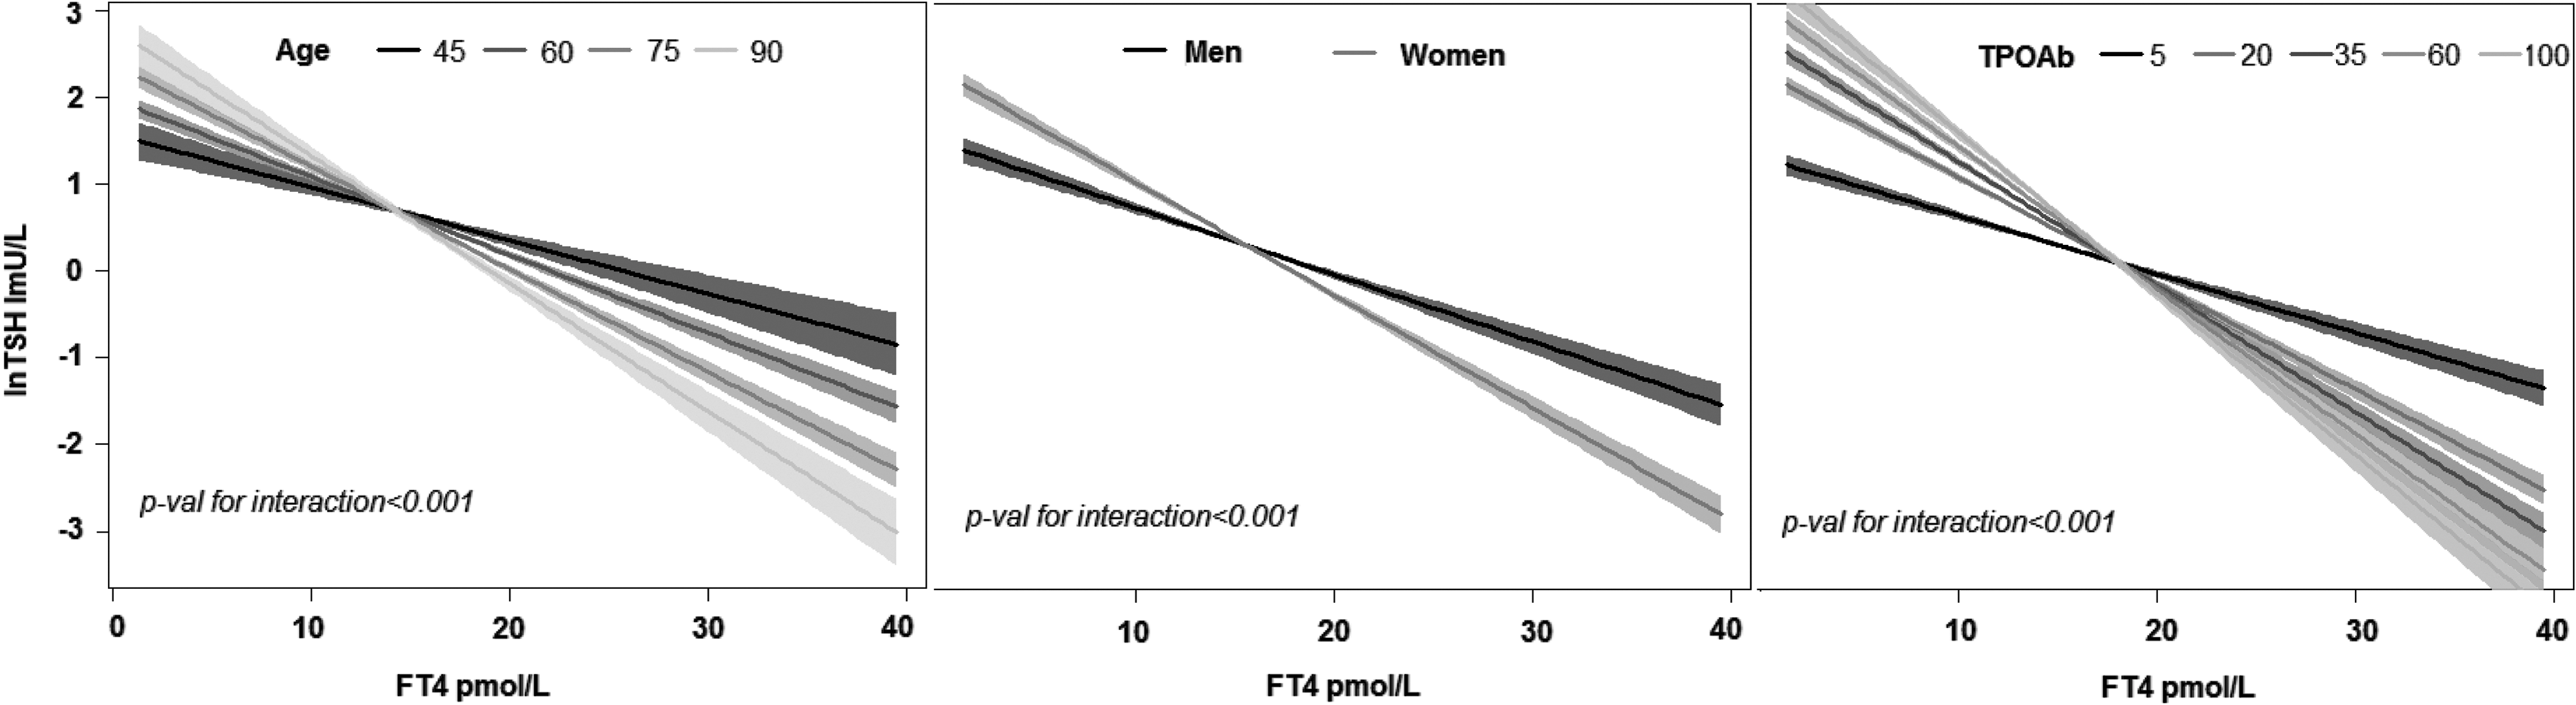
The association of age, sex, and TPOAb on the relation between TSH and FT4. The relation of TSH with F according to age, sex, and TPOAb are depicted. The p-value for interaction are for the continuous variables of age and TPOAb levels and 95% confidence interval per group is depicted. These analyses were adjusted for age, sex, BMI, smoking, TPOAb levels, and alcohol use. The natural logarithm of TPOAb and TSH levels were used for these analyses.
TSH and FT4 changes over time
We included 1225 participants for the longitudinal analyses of which all participants had two TSH measurements and 1002 participants also had two FT4 measurements (Supplementary Table S5). The median time between measurements was 6.5 years (range 6.01–9.71 years). The time between the two measurements was not associated with age of subjects at first measurement. Participants who had a second measurement were on average younger, had lower blood pressure, and were less often diabetics or current smokers. Nevertheless, the TSH and FT4 values were not significantly different between participants who did and those who did not have two measurements (Supplementary Table S5).
Overall, there was no change in TSH levels over time, irrespective of age at first measurement (Fig. 4A). However, changes of TSH in time did depend on the TSH levels at baseline. If TSH levels at baseline were higher than ∼TSH 2.72 mIU/L, TSH decreased over time (Fig. 4B). FT4 levels increased over time where the increase was more prominent in the elderly (increase of 4.5 pmol/L; Fig. 4C) and those with lower FT4 levels (increase of 4 pmol/L; Fig. 4D). In participants with baseline FT4 values higher than ∼22 pmol/L, FT4 levels decreased over time (Fig. 4D). Excluding participants in the lowest or highest 2.5th percentile did not change the association of thyroid function and age. Sensitivity analyses excluding participants using thyroid medication during follow-up, participants with a self-reported history of thyroid disease, or participants with TPOAb positivity did not change the associations meaningfully.
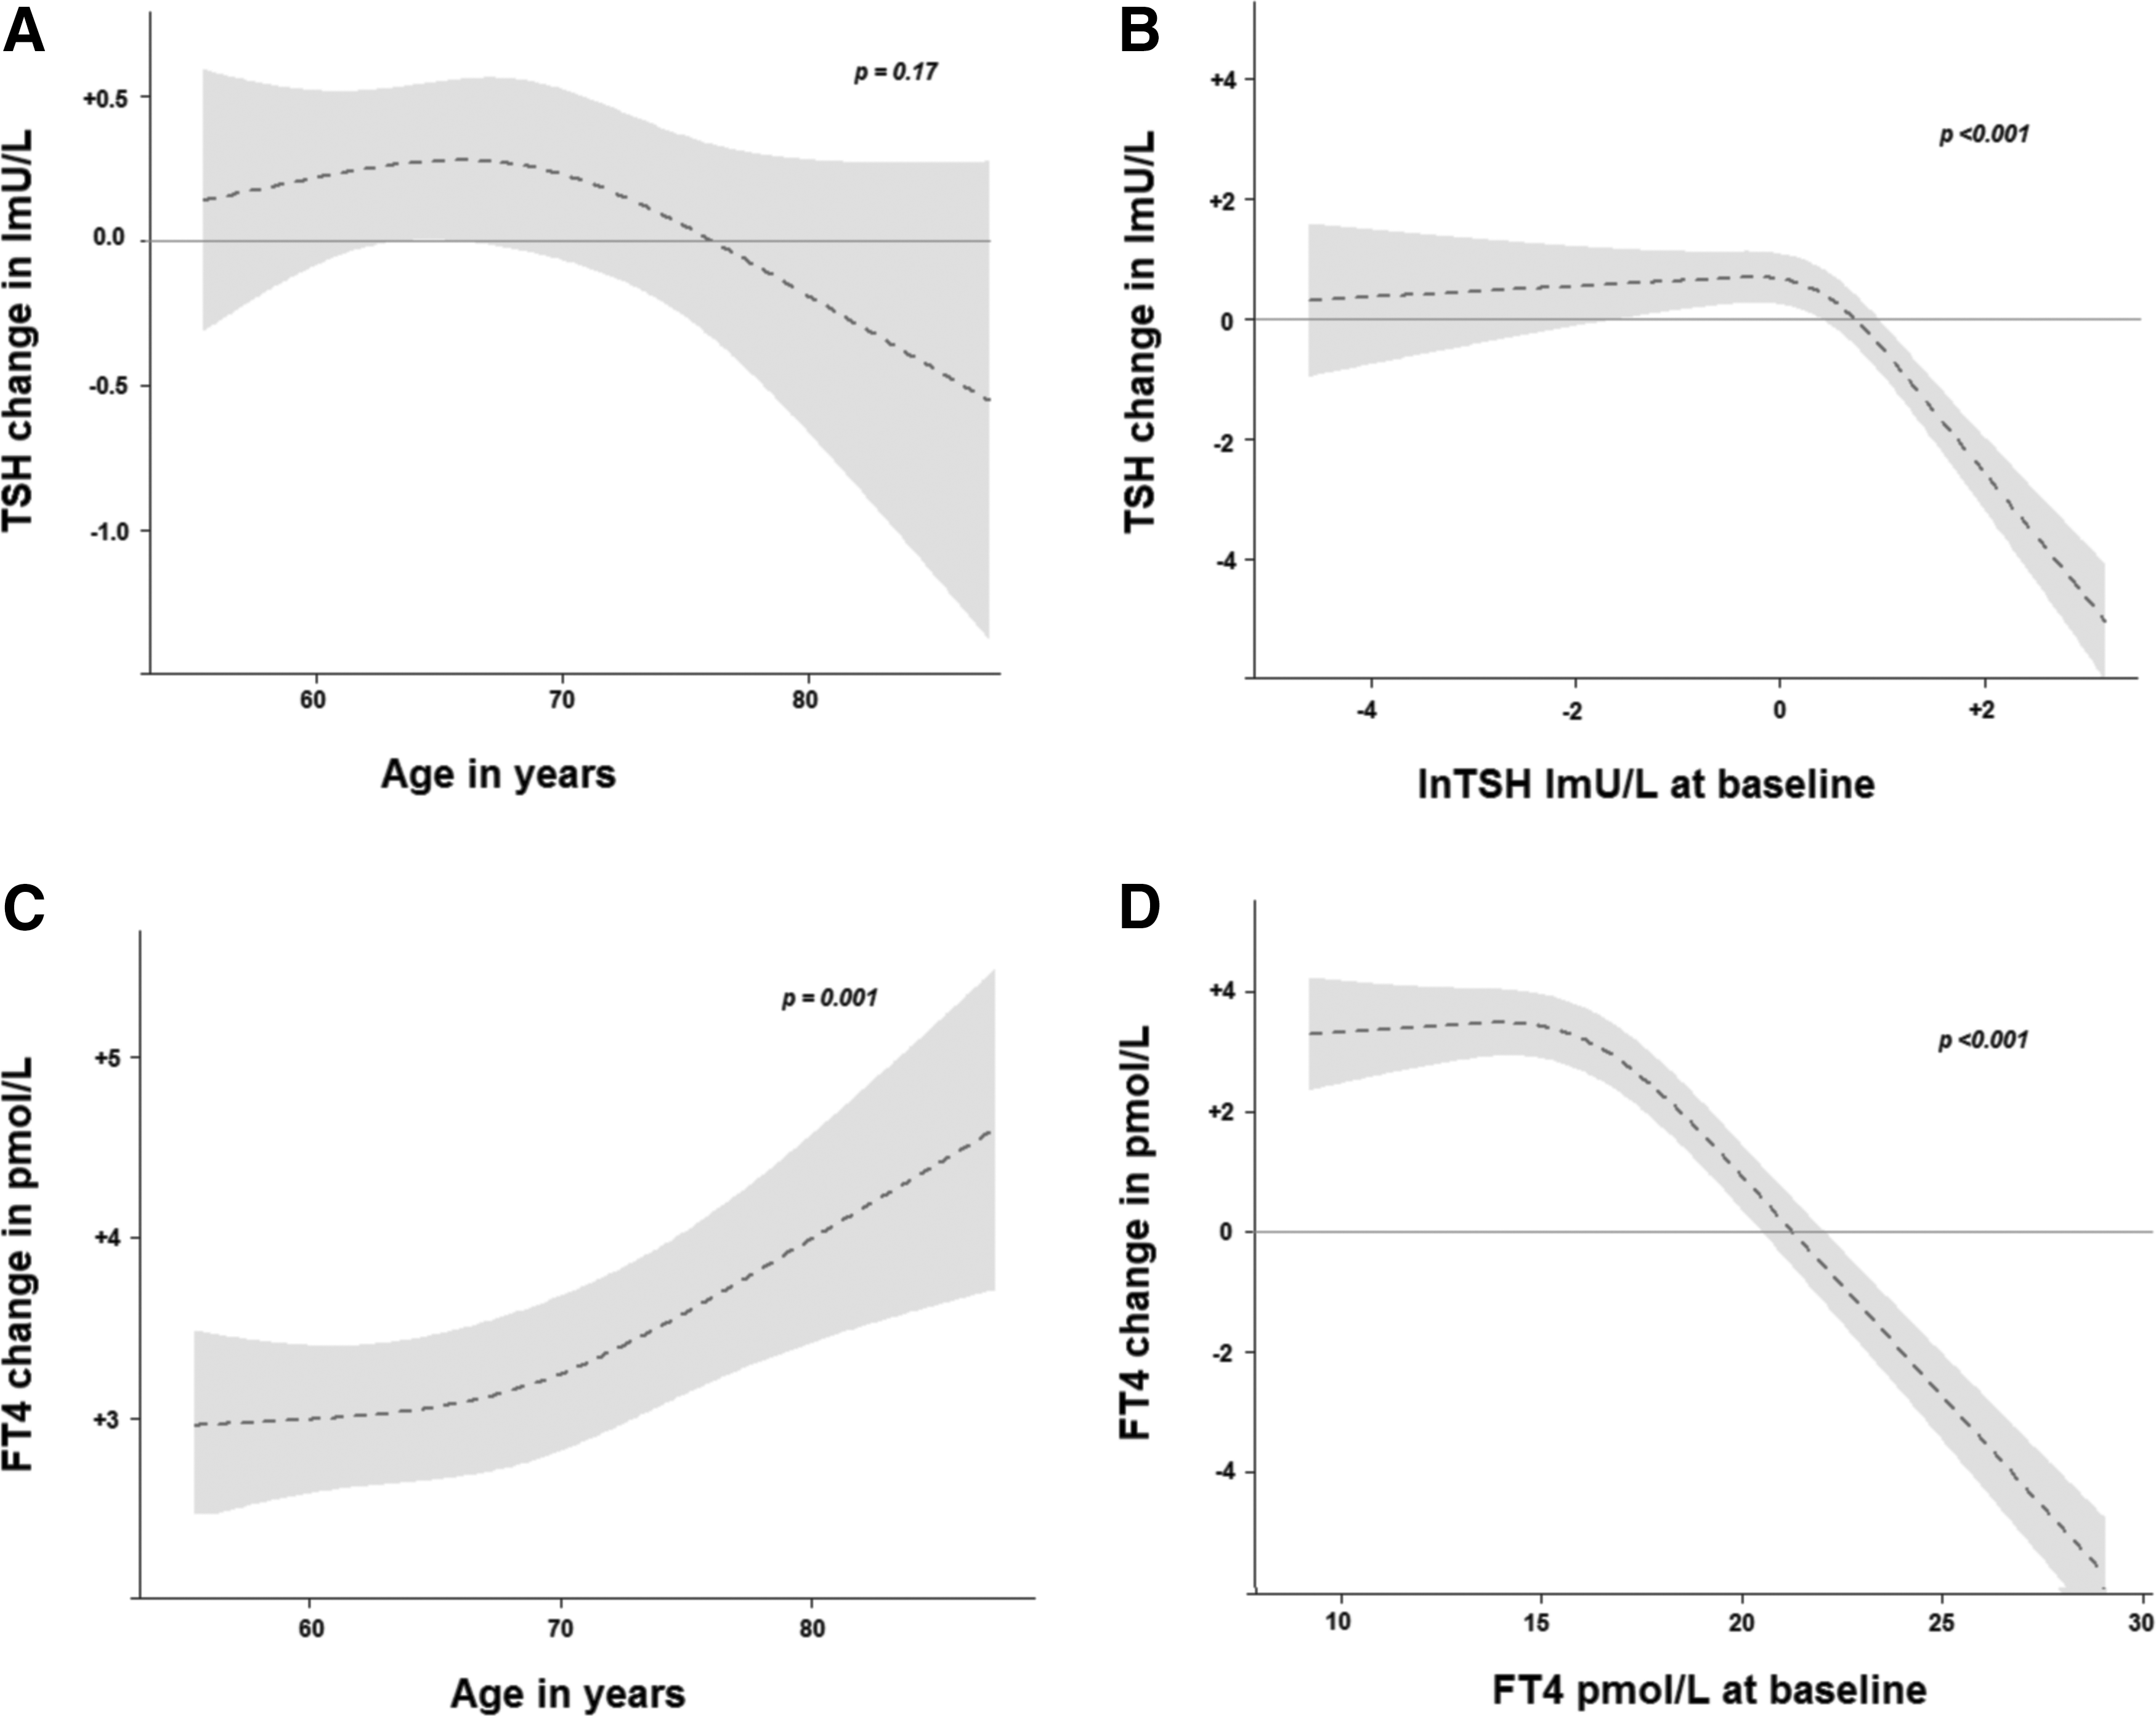
The change in TSH and FT4 levels over time. (
Discussion
In the current study, the main determinants of thyroid function were age, smoking, BMI, TPOAb levels, and common genetic determinants. The mutual relation between TSH and FT4 (i.e., thyroid function set point), was modified by age, sex, and TPOAb positivity. TSH values were fairly stable over time, except in those with higher baseline levels of TSH, where a decrease over time is seen. FT4 levels increase over time, with a more pronounced increase in older subjects and in those with low to average FT4 levels at baseline.
The heritability of thyroid function has been reported to be high, while the GRS for TSH and FT4 in our study only explained 5.6% and 2.5% of the variance respectively. This highlights the need for identification of additional genetic determinants (27). However, the large variability that is left unexplained is not solely due to yet unknown genetic factors but also dependents on environmental determinants.
Most studies to date have focused on a specific determinant (e.g., smoking) in relation to thyroid function (7). In contrast, in the current study we assessed several important environmental as well as genetic determinants in relation to thyroid function. Only two previous smaller cross-sectional studies have analyzed several determinants of thyroid function in the general population, but the direction and extent of the associations differed from ours (3,4). For example, Roef et al. (4) reported that a lower TSH as well as FT4 with higher BMI, while we found a positive association of BMI with TSH and a negative association of BMI with FT4 in our population. Differences between our results and results from these studies could be due to several reasons including; the large sample size of our population compared with previous studies (>9000 vs. <1000), differences in mean age, iodine status, and ethnical backgrounds. Also, the number of genetic variants included in these previous analyses was smaller than in the current study. To our knowledge, no population-based study to date has reported on the association of environmental factors with the relation between TSH and FT4. We could therefore not compare our results with previous literature.
Regarding the association of age with thyroid function, results from cross-sectional studies are conflicting. Data from the National Health and Nutrition Examination Survey showed a shift of the TSH distribution toward higher levels with older age but provided no information on FT4 concentrations in different age groups (12). A study from Scotland reported a significantly higher median and 97.5th centile TSH with higher age (24). However, in contrast with these studies and in line with our results, two studies reported a lower TSH and higher FT4 with higher age, of which the degree is partially dependent on historical iodine intake (13,28). Nevertheless, these are all cross-sectional reports on the association of age with thyroid function. Cross-sectional analyses can provide information on differences in different age groups but cannot provide insight into dynamic changes with aging.
To date, only two prospective population-based cohort studies with longitudinal thyroid function measurements have studied the relation of thyroid function with aging. Although both studies had similar iodine status, their results on the relation of thyroid function with aging (i.e., over time) differ from ours. Whereas both Waring et al. (Cardiovascular Health Study [CHS], United States) and Bremner et al. (Busselton Health Survey, Australia) found an increase in TSH over time and with increasing age, TSH levels did not change over time in our study (9,14). The lack of change in TSH in our study was independent of age at baseline. In participants with the highest levels of TSH at baseline, TSH even decreased over time. This decrease in TSH in the opposite direction of previous reports from CHS and the Busselton Health Survey could reflect a regression to the mean (i.e., normalization). We did not observe this phenomenon in participants with TSH values below 2.72 mU/L; the TSH levels in these participants remained stable over time. Our data show an increase in FT4 values with age, which is in line with the previous report from Waring et al. but in contrast to Bremner et al., who reported no change in FT4 levels with age.
There are different possible explanations for the differences between our results and results from the two previous studies mentioned above. Most importantly, the mean age of the studies differs notably, varying between 49 and 85 years for the Busselton and CHS cohorts respectively, whereas the mean age was 67 years for our longitudinal analyses. Furthermore, even though the current iodine status between the three cohorts of Busselton, CHS, and RS is comparable and can be classified as sufficient on average, the intrastudy variability could still be large. For example, the RS and Busselton cohorts include mainly white participants from one specific community, while CHS is a multicenter cohort study including multiethnic participants from several regions of the United States. This could lead to large variability in iodine intake and status between participants (29 –32). In addition, historical iodine intake is different between all three cohorts. This has been shown to result in differences in age-related thyroid function changes, which is irrespective of current iodine status (13,33).
The observed increase of FT4 with age in our study could represent an increase in autonomous thyroid hormone excretion. In the elderly, hyperthyroidism is more prevalent (15,34,35), with Graves' disease and toxic (multi)nodular goiter as the leading cause of hyperthyroidism in elderly individuals living in iodine-sufficient regions (34,36,37). The increase of FT4 levels with aging would physiologically be expected to result in a concordant decrease in TSH levels. However, the observation that TSH levels remained stable over time in our study, irrespective of age at baseline, suggests a change in the physiological set point of the hypothalamic-pituitary-thyroid axis.
Several age-related changes in pituitary sensitivity to TRH as well as pituitary TSH secretion capacity have been described, which could lead to alterations in the relation between TSH and FT4 (38,39). However, even though we observe effect modification of the TSH–FT4 relation by age, the association is opposite to what we would expect. With older age there seems to be a stronger relation between TSH and FT4 (effect modification) suggesting an increased “sensitivity” of the hypothalamic-pituitary-thyroid–axis set point. This is in line with studies demonstrating that lower doses of LT4 are needed to suppress TSH secretion in elderly subjects (40 –43). Alternatively, and biologically more plausible, this effect modification by age could mainly reflect a marked increase in autonomous thyroid hormone secretion in the elderly, as previously mentioned, with a relatively mild change in the set point. Independent of the mechanisms that lead to these changes, the increase in FT4 without a concomitant change in TSH with increasing age could explain several study results from population-based cohorts, including the Rotterdam Study, reporting on the association of FT4 with different clinical outcomes, while there is no significant association with TSH (44 –51). Lastly, another explanation for changes during aging is a change in TSH bioactivity (52), which was not measured in our study. To date, there are no studies specifically addressing changes in TSH bioactivity and aging in the general population, and thus this topic merits further research.
Strengths of our study include the large number of participants, providing adequate statistical power to investigate the relations of interest. Furthermore, through longitudinal assessment of TSH and FT4, we were able to investigate the changes of thyroid function over time. Also, by evaluating several of the determinants in one model, we were able to investigate the independent effect of each determinant. A limitation of our study is the lack of information on iodine status, TSH bioactivity, and T3 measurements in our participants, which is a limitation in most population-based cohort studies (9,14). Another limitation could be the use of immunoassays for FT4. Studies thus far have shown immunoassays of FT4 to sometimes correlate poorly and equilibrium dialysis or ultrafiltration LC-MS/MS seem to correlate better, especially in certain circumstances such as pregnancy and illness (53,54). However, our population consists of community-dwelling elderly, the correlation of the two immunoassays used in our population was good, and therefore we think this limitation is less applicable to our study. Lastly, the RS consists of a mainly white population of 45 years and older, and results from this study may therefore not be well generalizable to other populations.
Conclusions
Age, smoking, BMI, TPOAb, and genetic influences have the largest impact on TSH and FT4, while age, sex, and TPOAb had the greatest influence on the relation between TSH and FT4. With the included common genetic and environmental factors, we were able to explain 10.3% of TSH and 5.1% of FT4 variability. Our data show that with age, TSH levels remain stable whereas FT4 increases substantially. This could explain why several studies report associations between clinical outcomes and FT4 but not TSH. Differences in findings with other populations could be due to differences in (historical) iodine status or other factors (e.g., ethnicity) and should be investigated. Further research should examine the influence of changes in thyroid function over time on health and disease.
Footnotes
Acknowledgments
The authors are grateful to the study participants, the staff from the Rotterdam Study, and participating general practitioners and pharmacists.
Prof. R.P. Peeters and Dr. Chaker are supported by a Netherlands Organisation for Health Research and Development (ZON-MWTOP) grant (No. 91212044) and an Erasmus Medical Center Medical Research Advisory Committee (MCMRACE) grant. The generation and management of GWAS genotype data for the Rotterdam Study (RS I, RS II, RS III) was executed by the Human Genotyping Facility of the Genetic Laboratory of the Department of Internal Medicine, Erasmus MC, Rotterdam, The Netherlands. The GWAS datasets are supported by the Netherlands Organisation of Scientific Research (NWO) Investments (No. 175.010.2005.011, 911-03-012), the Genetic Laboratory of the Department of Internal Medicine, Erasmus MC, the Research Institute for Diseases in the Elderly (014-93-015), the Netherlands Genomics Initiative/NWO Netherlands Consortium for Healthy Aging, project No. 050-060-810. We thank Pascal Arp, Mila Jhamai, Marijn Verkerk, Lizbeth Herrera, and Marjolein Peters, MSc, and Carolina Medina-Gomez, MSc, for their help in creating the GWAS database and Karol Estrada, PhD, Yurii Aulchenko, PhD, and Carolina Medina-Gomez, MSc, for the creation and analysis of imputed data. This study makes use of an extended dataset of RS II and RS III samples based on Illumina Omni 2.5 and 5.0 GWAS genotype data, imputed to 1KG using the two-phase imputation method (![]() ). This dataset was funded by the Genetic Laboratory of the Department of Internal Medicine, the Department of Forensic Molecular Biology, and the Department of Dermatology, Erasmus MC, Rotterdam, The Netherlands We thank Linda Broer, PhD, for the creation of imputed data, with the support of Marijn Verkerk and Carolina Medina-Gomez, MSc, for the analysis setup.
). This dataset was funded by the Genetic Laboratory of the Department of Internal Medicine, the Department of Forensic Molecular Biology, and the Department of Dermatology, Erasmus MC, Rotterdam, The Netherlands We thank Linda Broer, PhD, for the creation of imputed data, with the support of Marijn Verkerk and Carolina Medina-Gomez, MSc, for the analysis setup.
The Rotterdam Study is supported by the Erasmus MC and Erasmus University Rotterdam, the NWO, the Netherlands Organization for Health Research and Development (ZonMw), the Research Institute for Diseases in the Elderly, the Netherlands Genomics Initiative, the Ministry of Education, Culture and Science, the Ministry of Health Welfare and Sports, the European Commission (DG XII), and the municipality of Rotterdam. The funding sources had no involvement in the collection, analysis, writing, and interpretation, nor in the decision to submit the paper for publication.
Professor O. H. Franco works in ErasmusAGE, a center for aging research across the life course funded by Nestleé Nutrition (Nestec Ltd.), Metagenics Inc., and AXA. Nestleé Nutrition (Nestec Ltd.), Metagenics Inc., and AXA had no role in the design and conduct of the study; collection, management, analysis, and interpretation of the data; or preparation, review, and approval of the manuscript.
Author Disclosure Statement
No competing financial interests exist.
References
Supplementary Material
Please find the following supplemental material available below.
For Open Access articles published under a Creative Commons License, all supplemental material carries the same license as the article it is associated with.
For non-Open Access articles published, all supplemental material carries a non-exclusive license, and permission requests for re-use of supplemental material or any part of supplemental material shall be sent directly to the copyright owner as specified in the copyright notice associated with the article.