
Abstract
Background:
Low thyroid function within the euthyroid range, as well as overt and subclinical hypothyroidism, reportedly increases the risk of cardiovascular disease and mortality. However, the association between low normal thyroid function and mortality remains controversial. This study was performed to elucidate the association between low normal thyroid function and all-cause and/or cause-specific mortalities among U.S. adults.
Methods:
A prospective cohort study was conducted using a nationally representative sample of 12,584 U.S. adults aged ≥20 years with thyrotropin (TSH) levels within the reference range from the National Health and Nutrition Examination Survey (NHANES) III (1988–1994). Associations between TSH tertiles (high, medium, and low normal TSH groups) and mortalities (all-cause, cardiovascular, and cancer) were investigated using multivariable Cox models. Stratum-specific analyses were estimated within subgroups defined according to sex (male or female) and baseline age (age <60 years or age ≥60 years). Further, the same analysis was conducted using continuous NHANES 2001–2002, 2007–2008, and 2009–2010 cohorts, which included data on free thyroxine levels.
Results:
The median follow-up period was 19.1 years, with 3395 all-cause deaths. A significantly higher risk of all-cause mortality (adjusted hazard ratio [HR] 1.27; [confidence interval (CI) 1.10–1.47]), and cardiovascular mortality (HR 1.30 [CI 1.02–1.67]), and cancer mortality (HR 1.43 [CI 1.01–2.01]) was observed in the high normal TSH group than in the medium normal TSH group. Additionally, the low normal TSH group had an increased risk of all-cause mortality. In stratum-specific analyses, a significant association was found between high normal TSH levels and all-cause mortality among males, females, and participants <60 years. Continuous NHANES cohorts demonstrated a non-significant increase in the HR for all-cause mortality in the high normal TSH group.
Conclusions:
High normal TSH levels compared with medium normal TSH levels were associated with increased risk of all-cause, cardiovascular, and cancer mortalities over a long-term follow-up period among U.S. adults. This study indicates that the reference range for TSH levels may require re-evaluation.
Introduction
T
Materials and Methods
Data sources and study population
A prospective cohort study was conducted using the data from the National Health and Nutrition Examination Survey (NHANES) III (1988–1994) and their mortality data through December 2011. The definition of “prospective” studies by Rothman et al. (6) was adopted. As an additional analysis, the data from the continuous NHANES 2001–2002, 2007–2008, and 2009–2010 cohorts were used, which included information on serum free thyroxine (fT4) and thyrotropin (TSH), and associated mortality data through December 2011. NHANES is a stratified, multistage survey using a nationally representative sample of the non-institutionalized civilian population of the United States (7). Participants were selected at random through a complex statistical process each year, and they completed personal structured interviews at home and then performed a physical examination at a mobile examination center (MEC) that included height, weight, and laboratory measurements (7). The NHANES III, NHANES 2001–2002, 2007–2008, and 2009–2010 study protocols were approved by the National Center for Health Statistics (NCHS) Institutional Review Board (8), with all participants providing informed written consent prior to NHANES participation. Among adults in NHANES III, NHANES 2001–2002, 2007–2008, and 2009–2010, the unweighted response rates for the household interview were 86%, 84%, 78%, and 79% and those for the MEC examination were 78%, 80%, 75%, and 77%, respectively (9).
The main analysis of the present study included NHANES III participants aged ≥20 years at enrollment who had serum TSH levels within the reference range, which resulted in a study sample of 14,187 subjects. Pregnant female participants (n = 4) and participants without data on education level (n = 338), body mass index (BMI; n = 29), serum creatinine (n = 90), and death (n = 16) were excluded. Participants with a history of thyroid disease (n = 177), thyroid-related medication use (n = 53), and cancer (n = 896) were also excluded. The final analytical cohort contained 12,584 participants (6115 males). For additional analyses, the data were used from NHANES 2001–2002, 2007–2008, and 2009–2010 participants with fT4 levels within the reference range using the same inclusion and exclusion criteria, resulting in a final study sample of 5257 subjects (2713 males).
Definition of thyroid function
In NHANES III, TSH was measured using a chemiluminescence immunoassay (CLIA; Nichols Institute Diagnostics, San Juan Capistrano, CA), and total thyroxine (TT4) was measured with a radioimmunoassay (RIA; Roche Molecular Biochemicals, Indianapolis, IN). In NHANES 2001–2002, 2007–2008, and 2009–2010, TSH was measured with a microparticle enzyme immunoassay (MEIA), and fT4 was measured with a two-step enzyme immunoassay. Euthyroidism was defined in the present study as a serum TSH level within the reference range (0.39–4.60 mIU/L) in NHANES III (10). To classify the participants with euthyroidism functionally into three groups, NHANES III participants were categorized into tertiles according to TSH concentrations (mIU/L) as follows: Q1, 0.39–1.15 (low normal TSH group); Q2, 1.16–1.89 (medium normal TSH group); and Q3, 1.90–4.60 (high normal TSH group). The reference ranges for TT4 in NHANES III, and TSH and fT4 in NHANES 2001–2002, 2007–2008, and 2009–2010, were defined as 4.5–13.2 μg/dL, 0.34–5.60 mIU/L, and 0.6–1.6 ng/dL, respectively (10,11).
Outcome ascertainment
The primary outcome of the present study was all-cause mortality, and the secondary outcomes were cause-specific mortalities (cardiovascular and cancer). Mortality data were ascertained by the NCHS from National Death Index (NDI) death certificate records (12) matching the following data: social security number, name, date of birth, race/ethnicity, sex, state of birth, and state of residence. The cause of death was determined according to the International Classification of Diseases, Tenth version (ICD-10). Cardiovascular disease was classified using ICD-10 codes I00–09, I11, I13, I20–51, and I60–69. Cancer was classified using ICD-10 codes C00–C97.
Other measurements
Demographic characteristics, history of cardiovascular disease, and prevalence of diabetes, hypertension, and hypercholesterolemia were self-reported. Weight and height were measured and used to calculate BMI.
Chemical analyses of triglycerides (TG), HDL cholesterol, creatinine (Scr), and plasma glucose were performed according to the laboratory procedure manual for NHANES III, NHANES 2001–2002, 2007–2008, and 2009–2010 (13,14). Estimated glomerular filtration rate (eGFR; mL/min/1.73 m2) was calculated using the Chronic Kidney Disease Epidemiology Collaboration equation: GFR = 141 × min(Scr/κ, 1)α × max(Scr/κ, 1)−1.209 × 0.993Age × 1.018 [if female] × 1.159 [if black]; κ = 0.7 for females and 0.9 for males, α = −0.329 for females and −0.411 for males, min indicates the minimum of Scr/κ or 1, and max indicates the maximum of Scr/κ or 1 (15).
MetS was defined as per the modified NCEP/ATP III criteria as the presence of any three of the following five findings: waist circumference ≥102 cm for men or ≥88 cm for women; elevated TG ≥150 mg/dL (to convert triglycerides to mM/L, multiply by 0.0113) or on drug treatment for high TG; reduced HDL cholesterol <40 mg/dL (to convert HDL cholesterol to mM/L, multiply by 0.02586) in men or <50 mg/dL in women or on drug treatment for reduced HDL cholesterol; elevated blood pressure (BP) ≥130 mmHg systolic BP or ≥85 mmHg diastolic BP or on antihypertensive drug treatment for elevated BP; and elevated fasting glucose ≥100 mg/dL (to convert glucose to mM/L, multiply by 0.05551) or on drug treatment for elevated glucose (16).
Statistical analyses
Descriptive statistics for patient characteristics were compared using chi-square tests for categorical variables, and analysis of variance for continuous variables. Unadjusted associations between TSH tertiles and mortality were estimated using Kaplan–Meier plots and unadjusted Cox proportional hazards models. Multivariable Cox proportional hazards models were adjusted for potential confounders of the mortality that included age (categorized by each 10 years), sex (male or female), race/ethnicity (non-Hispanic black, non-Hispanic white, or others), education status (less than high school, high school or General Educational Development, or higher than high school), smoking status (non-smoker, current smoker, or ex-smoker), diabetes, hypertension, hypercholesterolemia, previous cardiovascular disease, BMI (<18.5, 18.5 to <25.0, 25.0 to <30.0, or ≥30.0 kg/m2), and eGFR (<30, 30 to <60, or ≥60 mL/min/1.73 m2). The study adjusted for age, sex, race/ethnicity, education status, and smoking status (Model 1). As a main analysis, the study further adjusted for diabetes, hypertension, hypercholesterolemia, previous cardiovascular disease, BMI, and eGFR in addition to covariates in Model 1 (Model 2). Moreover, two sensitivity analyses were performed. First, the sample was restricted to participants with both TSH and TT4 levels within the reference range in order to focus on euthyroid status. Second, participants were categorized into quintiles according to TSH concentrations (mIU/L) as follows in order to evaluate the relationship between TSH levels and all-cause mortality within the reference range more in detail: X1, 0.39–0.91; X2, 0.92–1.30; X3, 1.31–1.70; X4, 1.71–2.30; and X5, 2.31–4.60. Stratum-specific analyses were estimated within subgroups defined according to sex (male or female) and baseline age (age <60 years or age ≥60 years).
To clarify the association between low normal TSH levels and prevalence of MetS, a risk factor of cardiovascular disease, the study further examined the association between TSH tertiles and prevalence of MetS by logistic regression analysis.
To examine the association between fT4 levels and all-cause mortality, additional analyses were performed in NHANES 2001–2002, 2007–2008, and 2009–2010 cohorts using unadjusted and multivariable Cox proportional hazards models. Participants were categorized into following tertiles according to fT4 concentrations (ng/dL): R1, 0.60–0.70 (low normal fT4 group); R2, 0.71–0.80 (medium normal fT4 group); and R3, 0.81–1.60 (high normal fT4 group). The association between TSH tertiles and all-cause mortality was also tested using the reference range for the assay used in NHANES 2001–2002, 2007–2008, and 2009–2010 (11): S1: 0.39–1.16 (low normal TSH group); S2: 1.17–1.92 (medium normal TSH group); and S3: 1.93–5.60 (high normal TSH group).
All statistical analyses were conducted using Stata v12.1 (StataCorp LP, College Station, TX). An appropriate weight was selected based on variables in each analysis, and it was used in order to account for unequal probabilities of selection and nonresponses to make unbiased national estimates. Sample sizes were reduced by 5705 (45.3%) in the analysis for MetS from NHANES III because a weight was used for fasting blood-sampling examination. p-Values of <0.05 were considered statistically significant.
Results
The clinical characteristics of the present study participants are shown in Table 1. The mean age (±standard deviation [SD]) was 45.4 ± 18.2 years, and 48.6% were male. Significant differences were found between the three groups for the following factors: age, race/ethnicity, education status, smoking status, diabetes, hypertension, hypercholesterolemia, previous cardiovascular disease, BMI, and eGFR.
Data are presented as range (M ± SD) or count (proportions) unless otherwise indicated.
Thyroid functional status was categorized as tertiles: low normal TSH (Q1), medium normal TSH (Q2), and high normal TSH (Q3).
Significance testing was performed by chi-square tests or analysis of variance.
TSH, thyrotropin; NHANES, National Health and Nutrition Examination Survey; TT4, total thyroxine; GED, General Educational Development; HR, hazard ratio; BMI, body mass index; eGFR, estimated glomerular filtration rate.
TSH tertiles and mortality
The median follow-up period was 19.1 years. A total of 3395 all-cause deaths were observed, comprising 1048 cardiovascular deaths, 730 cancer deaths, and 1617 deaths from other causes. Table 2 shows hazard ratios (HRs) calculated by the unadjusted and adjusted (Model 1 and Model 2) analyses for all-cause and cause-specific mortalities (cardiovascular and cancer). Figure 1 shows Kaplan–Meier survival curves according to TSH tertile for each event variable (all-cause mortality, cardiovascular mortality, or cancer mortality). The relationship between HRs in low and medium normal TSH groups (Q1 and Q2) reversed when the outcome was adjusted using covariates, especially age. Both the high and low normal TSH groups (Q3 and Q1) had significantly higher adjusted HRs for all-cause mortality compared with the medium normal TSH group (Q2; Q3 vs. Q2: HR 1.27 [confidence interval (CI) 1.10–1.47]; Q1 vs. Q2: HR 1.17 [CI 1.02–1.35]). HRs for cardiovascular and cancer mortality were significantly higher in the high normal TSH group (cardiovascular: HR 1.30 [CI 1.02–1.67]; and cancer: HR 1.43 [CI 1.01–2.01]), whereas the low normal TSH group was not significantly associated with increased risk of these mortalities compared with the medium normal TSH group. Similar results were observed in 11,890 participants with TSH and TT4 levels within the reference range (Supplementary Table S1; Supplementary Data are available online at
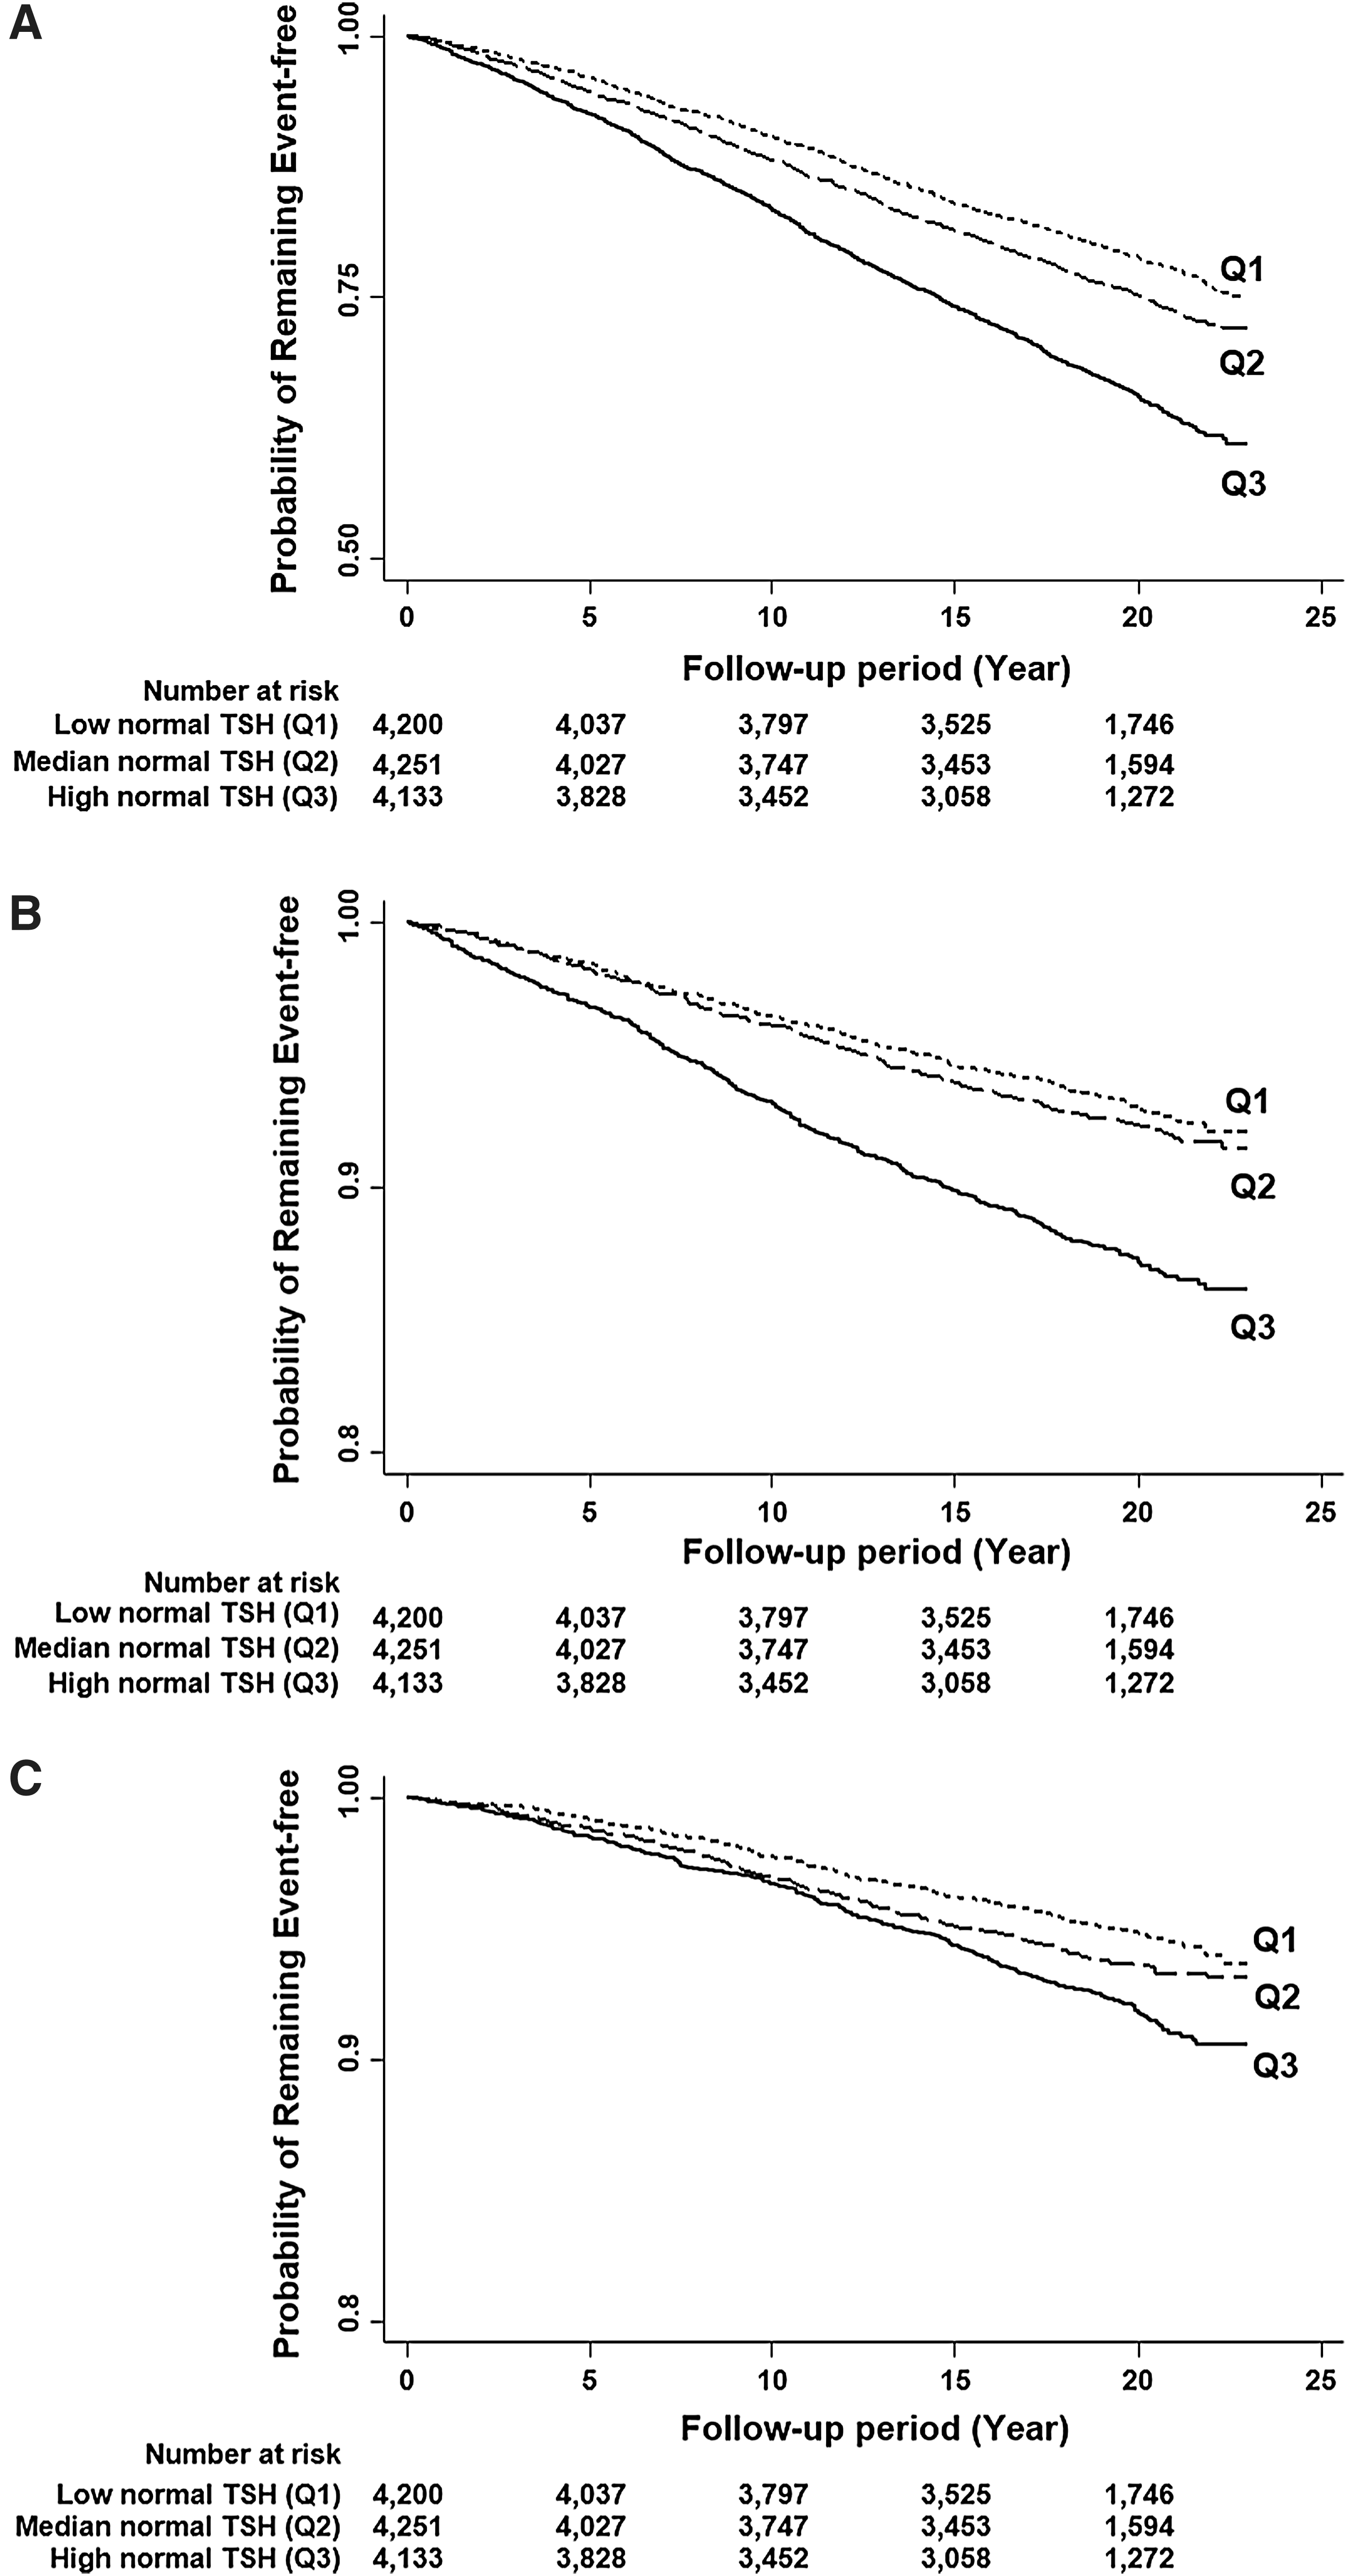
Kaplan–Meier survival curves for the all-cause (
Reference for each cell is medium normal TSH (Q2; HR = 1). Q1: 0.39–1.15 (low normal TSH group); Q2: 1.16–1.89 (medium normal TSH group); Q3: 1.90–4.60 (high normal TSH group).
HR adjusted for age, sex, race/ethnicity, education status, and smoking status.
HR adjusted for diabetes, hypertension, hypercholesterolemia, previous cardiovascular disease, BMI, and eGFR in addition to confounders in Model 1.
HR, hazard ratio; CI, confidence interval.
Table 3 presents HRs for mortality in subgroups stratified according to sex and baseline age, respectively. Among males, HRs for all-cause mortality were significantly higher in the high and low normal TSH groups (Q3 and Q1) compared with the medium normal TSH group (Q2; Q3 vs. Q2: HR 1.29 [CI 1.06–1.58]; Q1 vs. Q2: HR 1.32 [CI 1.08–1.61]). Females in the high normal TSH group had an increased risk of all-cause mortality (HR 1.24 [CI 1.05–1.46]). Among participants <60 years, HRs for all-cause mortality were significantly increased in the high and low normal TSH groups (Q3 and Q1) compared with the medium normal TSH group (Q2; Q3 vs. Q2: HR 1.49 [CI 1.19–1.86]; Q1 vs. Q2: HR 1.29 [CI 1.03–1.60]). There was a trend toward an increased risk of all-cause mortality in participants aged ≥60 years in the high normal TSH compared with the medium normal TSH group. However, this difference was not statistically significant.
Reference for each cell is medium normal TSH (Q2; HR = 1). Q1: 0.39–1.15 (low normal TSH group); Q2: 1.16–1.89 (medium normal TSH group); Q3: 1.90–4.60 (high normal TSH group).
HR adjusted for age, sex, race/ethnicity, education status, and smoking status.
HR adjusted for diabetes, hypertension, hypercholesterolemia, previous cardiovascular disease, BMI, and eGFR in addition to confounders in Model 1.
Logistic regression analysis to evaluate the association between TSH levels and MetS demonstrated a marginally higher prevalence of MetS in the high normal TSH group compared with the medium normal TSH group (odds ratio 1.22 [CI 0.96–1.55]).
fT4 tertiles/TSH groups and all-cause mortality in NHANES 2001–2002, 2007–2008, and 2009–2010
The mean age (±SD) and median follow-up period of 5257 participants in NHANES 2001–2002, 2007–2008, and 2009–2010 were 46.0 ± 17.4 years and 4.3 years, respectively, with 236 all-cause deaths. The high normal fT4 group was found to have an increased risk of all-cause mortality compared with the medium normal fT4 group according to the results of the main analysis, although no significant association was observed between the low normal fT4 group and all-cause mortality (Table 4). A non-significant increase in HR for all-cause mortality was observed in the high normal TSH group (Table 4).
Reference for each cell is medium normal fT4 (R2; HR = 1). R1: 0.60–0.70 (low normal fT4 group); R2: 0.71–0.80 (medium normal fT4 group); R3: 0.81–1.60 (high normal fT4 group).
Reference for each cell is medium normal TSH (S2) (HR = 1); S1: 0.39–1.16 (low normal TSH group); S2: 1.17–1.92 (medium normal TSH group); S3: 1.93–5.60 (high normal TSH group).
HR adjusted for age, sex, race/ethnicity, education status, and smoking status.
HR adjusted for diabetes, hypertension, hypercholesterolemia, previous cardiovascular disease, BMI, and eGFR in addition to confounders in Model 1.
Discussion
The results of the present prospective cohort study indicate that high normal TSH levels (which indicate low normal thyroid function) are associated with an increased risk of long-term mortality, in addition to cardiovascular and cancer mortalities.
To the best of the authors' knowledge, this is the first long-term observational study showing an association between high normal TSH levels and risk of mortality in a population from the United States. Several studies have examined the association between mortality and high normal TSH levels as well as subclinical and overt hypothyroidism (1,2). A study with a 12-year follow-up in Norway showed an association between high normal TSH levels and mortality in women (17), similar to the results observed in both men and women in the present study. On the other hand, some studies have concluded that higher TSH levels within the reference range are not associated with all-cause mortality (18,19). Considering these studies had a shorter follow-up period than the present study and the above-mentioned study from Norway, it is supposed that a longer follow-up period is required to differentiate the mortalities between those with high normal TSH levels and those with medium normal TSH levels. In the present stratum-specific analysis, no significant association was found between high normal TSH levels and all-cause mortality among participants aged ≥60 years, despite the observation of a significantly increased risk of mortality among participants aged <60 years with high normal TSH levels. The difference in TSH distribution according to age (20) and the higher mortality rate in the elderly subgroup might affect the results. In addition, there are some pathological explanations for this discrepancy. First, sensitivities to adrenergic stimulation and the hypothalamic-pituitary feedback system are reduced in the elderly (21,22). Second, their metabolic rate and energy expenditure are slow (23). These factors might mitigate the mortality risk for high TSH levels among participants aged ≥60 years. Further pathological and stratified epidemiological studies are required to elucidate the reason underlying the differences observed between these results.
Higher hazards were found for cardiovascular mortality in high normal TSH levels compared with medium normal TSH levels in the present study, as well as that for all-cause mortality. There are several mechanisms that may explain this increase in the risk of cardiovascular death. Pathologically, a deficiency of thyroid hormone weakens cardiac function by regulating calcium uptake and the expression of several contractile proteins in cardiomyocytes (24,25), and induces endothelial dysfunction and decreases nitric oxide levels (26). High TSH levels have also been reported to be associated with decreased cardiac contractility and increased systemic vascular resistance (26). Moreover, it has been reported that low normal thyroid function is associated with MetS due to an increase in insulin resistance (3,4) and may contribute to the associated increase in cardiovascular risk (27). A trend toward increased prevalence of comorbid MetS was observed in subjects with high normal TSH levels, which may contribute to the increased risk of cardiovascular mortality. However, of interest, a meta-analysis of 14 cohorts concluded that high normal TSH levels had no association with ischemic heart disease mortality (28). Considering several studies that found a positive relationship between subclinical hypothyroidism and heart failure (2,29,30), it is predicted that heart failure and other cardiovascular disease, rather than ischemic heart disease, would mainly contribute to the significantly increased risk of cardiovascular mortality in the present study.
Furthermore, high normal TSH levels were found to be associated with cancer mortality. Hypothyroidism has previously been reported to be a possible risk factor of liver cancer (31). First, hypothyroidism decreases apoptosis and increases the potential for carcinogenesis because T3 mediates apoptosis in hepatocytes through a mitochondrial mechanism (19). Second, hypothyroidism causes oxidative liver damage through obesity, hyperlipidemia, and insulin resistance, which were related to MetS. Several previous studies have evaluated cancer risk in euthyroid subjects. For example, free triiodothyronine and fT4 levels were reported to be significantly negatively associated with the risk of cancer mortality, particularly liver cancer mortality in euthyroid subjects in Korea (19). In addition, low normal fT4 levels have been reported to be associated with an increased risk of breast cancer in post-menopausal women (32), although the mechanism underlying this association was not established, and an another study showed no relationship between hypothyroidism and breast cancer (33). Further epidemiological and molecular biological studies are required to clarify the association between hypothyroidism and carcinogenesis and the potential mechanisms.
The results of the present study highlight the importance of reconsidering the reference range for TSH levels. The reference range is obtained by measuring TSH levels in a large population and calculating the range that represents healthy levels in the studied population. However, the validity of this range in reflecting thyroid function remains controversial (20). In addition to high normal TSH levels, an association was found between low normal TSH levels and increased all-cause mortality, corroborating the results of previous studies (34 –36). These associations were also confirmed by the sensitivity analysis using quintiles. It is also believed that low normal TSH levels might be associated with cardiovascular and cancer mortality because the adjusted HRs for cause-specific mortalities in the low normal TSH group were almost the same as that for all-cause mortality. Considering these results, higher and lower TSH levels within the reference range may affect health status over long-term durations. Accordingly, the reference range of TSH levels and the rationale on which the “normal” range is based may require re-evaluation.
The present study has several limitations. First, fT4 levels were not included in the main analysis to define thyroid status. Both TSH and TT4 levels were used to define euthyroidism as a sensitivity analysis (2), and almost identical results were observed compared to the main analysis. Further, as an additional study, both TSH and fT4 levels were employed to define euthyroidism using data from NHANES 2001–2002, 2007–2008, and 2009–2010, which included measurements of fT4 levels. We observed a non-significantly higher mortality risk in the high normal TSH group, which support the results of the main analysis. However, no association was found between the low normal fT4 group and all-cause mortality of interest. Although TSH is considered to be the most sensitive and specific biochemical marker of thyroid function (37), further studies with longer follow-up periods and larger sample size for fT4 levels are required to explain this discrepancy. Second, the reference range for TSH was defined as 0.39–4.60 mIU/L for every age category (10) because the study aimed to analyze the validity of a non-age-adjusted TSH cutoff. However, it has been reported that there is a difference of TSH distribution according to age, sex, and race/ethnicity (38). For reference, an analysis wes performed that includes three age-specific TSH cutoffs for each age category (38) instead of a single TSH cutoff. In this analysis, similar results were obtained as in the main analysis. A unique TSH reference range was used according to previous studies (2,28) because the data set of the age-specific category was complex. Although there were not enough participants to assess the result for each age category separately in this study, further prospective studies using age-specific reference limits with a much larger sample size are needed. Third, the NDI death certificate records were used. However, the NDI is not a perfect database for mortality ascertainment (39). Other death records should also be used in further epidemiologic or clinical studies in order to obtain complete and accurate ascertainment of mortality. However, the misclassification by the NDI is considered to be independent of TSH levels. Given that this non-differential misclassification generates a bias toward the null, this limitation would not deny the significant results in this study. Fourth, residual confounding and competitive risk may have biased the observed results, as this was an observational study of mortality. Fifth, the trend of thyroid function over the study follow-up period was not evaluated in individual participants. Finally, the present study did not provide sufficient evidence to inform evaluations regarding the importance of medication. Further interventional and molecular studies of the nonfatal cardiac and carcinogenic effects of low normal thyroid function are required to overcome these limitations.
In conclusion, the results of the present study indicate that high normal TSH levels are associated with an increased risk of all-cause, cardiovascular, and cancer mortality over a long-term period in U.S. adults. Furthermore, low normal TSH levels were found to be associated with increased all-cause mortality. As differences in TSH levels within the current “normal” range may affect long-time mortality, re-evaluation of the reference range of TSH levels may be required.
Footnotes
Acknowledgments
This work was supported in part by the Yokohama Rosai Hospital and National Center for Global Health and Medicine. We thank Tetsuo Nishikawa, MD, PhD, and Masao Omura, MD, PhD (Yokohama Rosai Hospital) for their helpful advice. A part of this study using data from NHANES 2001–2002 was presented at 15th International Thyroid Congress in Florida in October 2015.
Author Disclosure Statement
The authors have nothing to disclose.