
Abstract
Background:
Thyroid hormones are important regulators of glucose homeostasis. However, the association between thyroid hormones within the reference range and type 2 diabetes mellitus (T2DM) remains unclear. The aim of this study was to clarify the incidence of T2DM according to the baseline levels and changes of thyrotropin (TSH) and thyroid hormones (free thyroxine and triiodothyronine) in euthyroid subjects.
Methods:
Among the participants who consecutively underwent thyroid function tests between 2006 and 2012 through a yearly health checkup program, 6235 euthyroid subjects (3619 men and 2616 women) without T2DM were enrolled in the study. The change in each hormone was calculated by subtracting the baseline value from the level at the end of follow-up or one year before the diagnosis of diabetes.
Results:
During 25,692 person-years of follow-up, there were 229 new cases of T2DM. After full adjustment for potential confounders including HbA1c and fasting glucose in Cox proportional hazards models, the individuals in the highest tertile of TSH change (2.5–4.2 μIU/mL) had a greater risk of incident T2DM (hazard ratio [HR] = 1.44 [confidence interval (CI) 1.04–1.98], p = 0.027) in comparison with individuals in the lowest tertile (−4.1 to −0.5 μIU/mL). Simultaneously, the highest tertile of triiodothyronine change (16.3–104.7 ng/dL) and free thyroxine change (0.2–1.6 ng/dL) conferred protective effects against diabetes (HR = 0.60 [CI 0.43–0.85], p = 0.002, and HR = 0.34 [CI 0.24–0.48], p < 0.001, respectively) compared with those in the lowest tertile (−76.5 to −1.8 ng/dL and −0.6 to 0.0 ng/dL, respectively). These associations remained significant when each of the hormones was analyzed as a continuous variable. However, baseline levels or tertiles of TSH and thyroid hormones were not associated with the risk of diabetes.
Conclusions:
Individual changes in TSH and thyroid hormones, even within the normal reference range, were an additional risk factor of incident T2DM.
Introduction
I
Although emerging evidence suggests that overt and/or subclinical thyroid dysfunction is concordantly associated with hyperglycemia and increased insulin resistance (4 –6), the existence of the same association between thyrotropin (TSH) and thyroid hormones within the normal reference range and type 2 diabetes mellitus (T2DM) remains controversial. In euthyroid subjects, TSH was positively associated with hyperglycemia (7) and insulin resistance (8,9), whereas in another study, TSH had no relationship with either hyperglycemia or insulin resistance (10 –13). In some reports, free thyroxine (fT4) is positively (13) or inversely (14) associated with hyperglycemia, whereas there was a positive (15), negative (8,9,16), or no correlation (7,13,17) between fT4 and insulin resistance. Free triiodothyronine (fT3) and/or total triiodothyronine (TT3) showed a positive correlation with hyperglycemia (14,18) and insulin resistance (13,15,17) in prior research. However, an inverse correlation has been reported as well (2,19).
While most of the studies have focused on the influence of baseline measures of thyroid hormones and/or TSH with a cross-sectional approach, no studies have prospectively assessed changes in thyroid hormones and/or TSH in order to evaluate associations with the risk for T2DM. Therefore, the aims of this study were to elucidate the associations of baseline concentrations of TSH, T3, and fT4 with T2DM in a large cohort of euthyroid subjects, and to analyze whether changes (increasing or decreasing) in TSH and/or thyroid hormones might be associated with metabolic alterations leading to T2DM.
Methods
Study population
This study included adults aged ≥18 years who participated in voluntary comprehensive health checkups at the Samsung Medical Center. The annual or biennial checkup programs included anthropometric data, laboratory data, and questionnaires about medical history and life-style. Initially, 24,184 participants who participated in at least four health checkups between January 2006 and December 2012 were assessed for eligibility (Supplementary Fig. S1; Supplementary Data are available online at
This study was approved by the Institutional Review Board (IRB) of Samsung Seoul Hospital, and was carried out in accordance with recommendations of the Declaration of Helsinki.
Definitions
Euthyroidism was defined as TSH within the reference range of 0.4–4.2 μIU/mL, T3 within the reference range of 76–190 ng/dL, and fT4 within the reference range of 0.78–1.85 ng/dL. Changes in TSH, T3, and fT4 were determined by subtracting the baseline level from the final level. The final level of each hormone was defined as the concentration measured one year before the date of diagnosis of diabetes or measured at the end of follow-up in subjects who did not develop diabetes. T2DM was diagnosed by fasting glucose ≥126 mg/dL, HbA1c ≥6.5%, or taking antidiabetic drugs. Hypertension was defined as a systolic blood pressure ≥140 mmHg, a diastolic blood pressure ≥90 mmHg, or taking antihypertensive medications.
Clinical and laboratory measurements
Demographic characteristics were assessed using a structured questionnaire at the first medical checkup. Serum TSH levels were measured using an immunoradiometric assay kit (Immunotech, Marseille Cedex, France). Serum T3 and fT4 levels were measured using a commercialized radioimmunoassay kit (T3 and fT4 RIA KIT; Immunotech). TSH and thyroid hormones were sampled in the morning (8am to 9am) to minimize the effect of diurnal variation. Coefficients of variation were as follows: TSH ≤3.7%, T3 ≤ 6.3%, and fT4 ≤ 10.3%.
Blood pressure was measured at each visit by trained nurses using a mercury sphygmomanometer on the right arm of participants in a comfortable sitting position after at least five minutes of rest. Height (cm) and weight (kg) were measured with participants wearing light clothing and no shoes. Body mass index (BMI) was calculated by dividing the body weight by the square of the height (kg/m2), and BMI change was determined by subtracting the baseline level from the final level. Total body fat percent was measured using a foot-to-foot bioimpedance analysis scale (InBody Body Composition Analyzer; InBody [720], Biospace, Korea), and plasma insulin values were derived using an immunoradiometric assay (DIAsource Co., Louvain-la-Neuve, Belgium). The homeostasis model assessment index for insulin resistance (HOMA-IR) was calculated from the following formula: fasting insulin (μIU/mL) × fasting glucose (mmol/L)/22.5 (20). At the time of the study, patients maintained their usual unrestricted diet. After more than eight hours of fasting, venous blood samples were obtained. The enzymatic methods were used to measure glucose, total cholesterol (TC), triglyceride (TG), and low-density lipoprotein cholesterol (LDL-C) levels. The elective inhibition assay was used to measure high-density lipoprotein cholesterol (HDL-C) levels.
Statistical analysis
Normally distributed data were expressed as the mean ± standard deviation. Unevenly distributed data were presented as the median (interquartile range [IQR] 25th to 75th percentile) for continuous variables. Percentages were used for categorical variables. A t-test or Mann–Whitney U-test was used to analyze the differences between subjects with and without diabetes. Multivariate Cox proportional hazards analysis was used to assess the relative risk of incident T2DM according to the tertile of baseline level of hormones and their change, also as continuous variables. The validity of the proportional hazards assumption was evaluated by inspection of Schoenfeld residuals versus time, and no significant associations between the residuals and time were present. Each Cox regression model was adjusted for potential confounders affecting thyroid function and for traditional risk factors of diabetes. To avoid multicollinearity, the variable inflation factor (VIF) was assessed for all the covariates included in each of the regression models. All variables had a VIF of <2.0, indicating no relevant multicollinearity among the covariates. Model 1 was adjusted for age, sex, and BMI. Model 2 was additionally adjusted for fasting glucose, HbA1c, HDL-C, TG, LDL-C, smoking status, use of lipid lowering drugs, and prevalence of hypertension at baseline. Model 3 was additionally adjusted for BMI change over time with covariates of Model 2.
The participants were divided into two groups according to the numbers of metabolic risk factors at baseline. Group 1 (the low-risk group) has fewer than two metabolic risk factors, and group 2 (the high-risk group) has two or more metabolic risk factors. Metabolic risk factors include BMI ≥25 kg/m2, TG ≥150 mg/dL, HDL-C <40 mg/dL in males or 50 mg/dL in females, fasting glucose ≥100 mg/dL, and HbA1c ≥5.7%. Groups 1 and 2 were classified as “improved,” “stable,” or “ aggravated” according to the change in numbers of metabolic risk factors during follow-up. Subjects who had a decreased number of metabolic risk factors at last follow-up were included in the improved group. If there was no change in numbers of risk factors, the subjects were included in the stable group. Subjects who had an increased number of metabolic risk factors at the last follow-up were included in the aggravated group.
Correlation analysis was performed to evaluate the association between baseline hormone levels and metabolic parameters. Cumulative time-to-event curves were analyzed using the Kaplan–Meier method. All statistical tests were two-sided, and analyses were executed using SPSS Statistics for Windows v14.0 (SPSS, Inc., Chicago, IL). A p-value of <0.05 was considered statistically significant.
Results
Baseline characteristics between subjects with or without development of T2DM
During 25,692 person-years of follow-up, there were 229 (168 men and 61 women) incident cases of T2DM. Baseline clinical and biochemical characteristics of the study population are summarized in Table 1. Subjects with incident T2DM had less favorable metabolic parameters. Both men and women were more likely to be older, obese, hypertensive, and to have higher levels of TG, fasting glucose, HbA1c, and insulin, lower levels of HDL-C, and increased HOMA-IR at baseline. In baseline thyroid function tests, TSH was significantly increased only in women with incident T2DM. Higher T3 levels were found in the incident T2DM group of both sexes. However, there was no significant difference in fT4 levels between the two groups.
Data are presented as mean ± standard deviation (SD), median (25th to 75th percentile), or percentages.
Data were available for the analysis of 3178 men and 1903 women.
T2DM, type 2 diabetes mellitus; BMI, body mass index; CCB, calcium channel blocker; ACE I, angiotensin converting enzyme inhibitor; ARB, aldosteron receptor blocker; LDL-C, low-density lipoprotein cholesterol; HDL-C, high-density lipoprotein cholesterol; HOMA-IR, homeostasis model assessment index for insulin resistance; TSH, thyrotropin; T3, triiodothyronine; fT4, free thyroxine.
Effects of baseline TSH and thyroid hormones on the risk of developing T2DM
The proportion of participants developing T2DM increased across the T3 (p < 0.001) and fT4 tertiles (p = 0.041), but not across the TSH tertiles (p = 0.078), as shown in Table 2. In the Cox proportional hazard model (Table 2), the hazard ratio (HR) for incident T2DM significantly increased as T3 tertiles increased in the crude model (p < 0.001) and in multivariate model 1, which was adjusted for age, sex, and BMI (p = 0.006). However, tertiles of baseline TSH, T3, and fT4 could not predict the incidence of T2DM after adjustment of all possible confounders (Table 2, model 2).
Model 1: HRs have been adjusted for age, sex, and BMI.
Model 2: HRs have been adjusted for Model 1 variables and additional covariates such as fasting glucose, HbA1c, HDL,TG, LDL, smoking status, use of lipid lowering drugs, and hypertension at baseline.
Analyses were computed by including TSH and thyroid hormones as continuous variables (per 1 SD).
p < 0.05; ** p < 0.01; *** p < 0.001.
HR, hazard ratio; CI, confidence interval.
When TSH and thyroid hormones were analyzed as continuous variables, TSH and T3, but not fT4, were significantly associated with an increased risk of incident T2DM in the crude model (p = 0.035 and p < 0.001, respectively) and in age-, sex-, and BMI-adjusted models (p = 0.026 and p = 0.010, respectively). However, baseline TSH and thyroid hormones as continuous variables were not significant after adjustment of all possible confounders, which was concordant with hormone tertile results (Table 2, model 2).
Effect of TSH, dT4, and T3 changes over time on the risk of developing T2DM
At the last follow-up, the change in thyroid function from euthyroid status was classified as follows: 5691 (91.3%) subjects were euthyroid, 73 (1.2%) subjects had subclinical hyperthyroidism, 27 (0.4%) subjects had overt hyperthyroidism, 417 (6.7%) subjects had subclinical hypothyroidism, 1 (0.01%) subject had overt hypothyroidism, and 26 (0.4%) subjects had normal TSH with elevated T3 or fT4. Subjects with incident T2DM had a significantly higher proportion of subclinical hypothyroidism (n = 29; 12.7%) compared with subjects without incident T2DM (n = 389; 6.5%). Median measurements of TSH, T3, and fT4 levels occurred four times (IQR 4–5) during the median observation of 5.0 years (IQR 4.0–6.0) in each subject. Linear regression analysis demonstrated that the absolute change in TSH (standardized β = 0.842; p < 0.001), T3 (standardized β = 0.859; p < 0.001), and fT4 (standardized β = 0.842; p < 0.001) showed strongly positive associations with each of their slopes in the linear regression model from consecutive measurements.
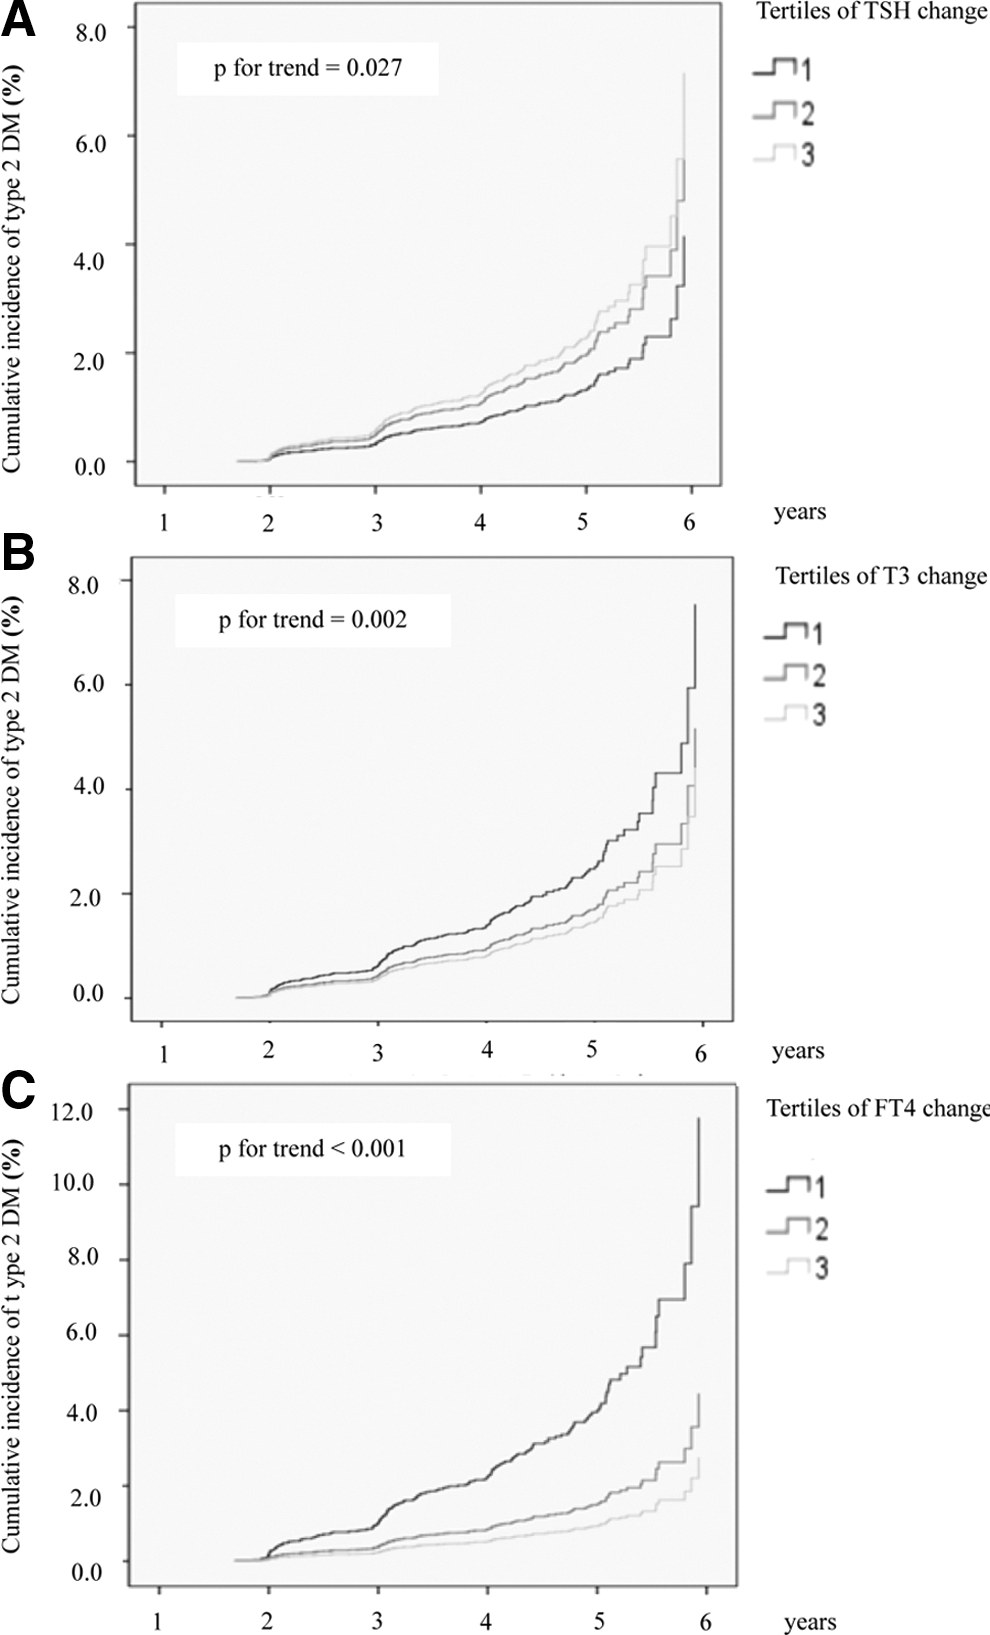
The proportion of participants with incident T2DM decreased across tertiles of T3 change (p < 0.001) and fT4 change (p < 0.001), but not across tertiles of TSH change (p = 0.148). In the Cox proportional hazard model (Table 3), HR for incident T2DM significantly decreased with changes in the tertiles of both T3 and fT4 in a crude model (p < 0.001). After adjustment of all possible confounders, including BMI change (Table 3, model 3), the highest tertile of TSH change (0.3–12.3 μIU/mL) was independently associated with an increased risk of incident T2DM (HR = 1.44 [confidence interval (CI) 1.04–1.98]; p = 0.027) compared with the lowest tertile (Fig. 1A). However, the highest tertile of T3 change (16.3–104.7 ng/dL) and fT4 change (0.2–1.6 ng/dL) showed remarkable protective effects against incident T2DM (HR = 0.60 [CI 0.43–0.85]; p = 0.002; and HR = 0.34 [CI 0.24–0.48]; p < 0.001, respectively) compared with the lowest tertile of each (Fig. 1B and C). When changes in TSH and thyroid hormones were analyzed as continuous variables per 1 SD, the same associations were observed before and after adjustment of all confounders (Table 3). In both men and women, the results were the same; higher TSH change increased T2DM risk, while higher T3 change and fT4 change decreased T2DM risk in a fully adjusted model (Table 4).
All were adjusted for age, sex, body mass index (BMI), BMI change, fasting glucose, HbA1c, high-density lipoprotein, triglyceride, low-density lipoprotein, smoking status, use of lipid lowering drug, and hypertension. (
Model 1: HRs have been adjusted for age, sex, and BMI.
Model 2: HRs have been adjusted for Model 1 variables and additional covariates such as fasting glucose, HbA1c, HDL,TG, LDL, smoking status, use of lipid lowering drugs, and hypertension.
Model 3: HRs have been adjusted for Model 2 variables and additional BMI change during follow-up period.
Analyses were computed by including TSH and thyroid hormones as continuous variables (per 1 SD).
p < 0.05; ** p < 0.01; *** p < 0.001.
CI, confidence interval; HR, hazard ratio.
Adjusted HR: HRs have been adjusted for age, BMI, fasting glucose, HbA1c, HDL, TG, LDL, smoking status, use of lipid lowering drugs, hypertension, and BMI change.
Analyses were computed by including TSH and thyroid hormones as continuous variables (per 1 SD).
p < 0.05; ** p < 0.01; *** p < 0.001.
Together with baseline levels and the change in TSH, T3, and fT4 (Supplementary Fig. S2), an increasing tendency of the proportion of subjects with incident T2DM remained apparent across the tertiles of TSH change. Moreover, a decreasing tendency in the proportion of subjects with incident T2DM was also apparent across the tertiles of T3 change and fT4 change.
Subgroup analysis
An additional Cox regression analysis was done in euthyroid subjects (n = 5691) whose final levels of TSH and thyroid hormones were within the normal reference range. When TSH change was analyzed as a continuous variable per 1 SD increase, HR for incident diabetes was 1.09 ([CI 1.01–1.31]; p = 0.046) in the fully adjusted model including BMI change. When T3 and fT4 change were analyzed as continuous variables, HR for incident diabetes decreased in the fully adjusted model (HR = 0.74 [CI 0.63–0.86]; p < 0.001; and HR = 0.54 [CI 0.46–0.63]; p < 0.001, respectively) per 1 SD of each hormone increase.
Among 5084 subjects in whom anti-microsomal antibodies (AMA) were measured, 310 subjects had positive results (definition of positivity: >60 IU/mL). The proportion of hypothyroidism at last follow-up was significantly higher in AMA-positive individuals (16.8%; p < 0.001) compared with antibody-negative individuals (5.4%). However, TSH increase (HR = 1.23 [CI 1.09–1.39]; p = 0.001) with T3 decrease (HR = 0.81 [CI 0.69–0.95]; p = 0.008) and fT4 decrease (HR = 0.56 [CI 0.47–0.66]; p < 0.001) as continuous variables remained significant risk factors of incident T2DM among AMA-negative individuals (n = 4763) after adjusting for age, sex, BMI, BMI change, lipid profile, HbA1c, fasting glucose, smoking, use of lipid-lowering drugs, and hypertension.
Correlation between metabolic parameters and TSH and thyroid hormones
Correlations between baseline metabolic parameters and baseline TSH, T3, or fT4 are shown in Table 5, according to sex. The level of fT4 did not change, but T3 and TSH levels increased with age in women. In contrast, there was a decrease in T3 and fT4 but not TSH levels with increasing age in men. Unfavorable metabolic parameters such as higher fat distribution, higher lipid levels, fasting glucose, and HbA1c correlated with baseline T3 levels in both men and women. Fasting insulin (r = 0.116; p < 0.001) and HOMA-IR (r = 0.132; p < 0.001) were also positively associated with baseline T3 levels. Baseline fT4 levels were positively associated with LDL-C and HDL-C and inversely associated with BMI and HbA1c in men and women.
Data shown are correlation coefficients (r).
Analysis of a random sample of 1903 female and 3178 male subjects.
p < 0.05; ** p < 0.01; *** p < 0.001.
After dividing by the numbers of metabolic risk factors that the subjects had at baseline, group 2 (the high-risk group; n = 2755) showed a significantly higher incidence of T2DM (7.0% vs. 1.0%; p < 0.001) than group 1 (the low-risk group; n = 3480) did. While baseline TSH level did not vary between the groups, baseline T3 (115.4 ± 18.7 vs. 110.6 ± 18.3 ng/dL; p < 0.001) and fT4 (1.27 ± 0.19 vs. 1.23 ± 0.18 ng/dL; p < 0.001) were significantly higher in group 2. In all groups, an increase in TSH concentration with a decrease in T3 and fT4 concentration was associated with T2DM (Table 6).
Metabolic risk factors included BMI ≥25 kg/m2, TG ≥150 mg/dL, HDL-C <40 mg/dL in men or <50 mg/dL in women, fasting glucose ≥100 mg/dL, and HbA1c ≥5.7%.
Improved: decrease in numbers of metabolic risk factors at last follow-up.
Stable: no change in numbers of metabolic risk factors at last follow-up.
Aggravated: increase in numbers of metabolic risk factors at last follow-up.
Discussion
This seven-year longitudinal study suggests that changes in TSH and thyroid hormones before diagnosis of diabetes are associated with the incidence of T2DM. A pattern of gradual increase in TSH with a decrease in T3 and fT4, rather than baseline hormone levels, was independently associated with the risk of developing T2DM regardless of sex and thyroid autoimmunity. Although the significance of changes in thyroid hormones for predicting T2DM did not surpass that of traditional risk factors such as HbA1c and fasting glucose, a decline in fT4 and an increase in TSH were better predictors of T2DM than BMI or BMI change were (Supplementary Table S1). Thus, this study suggests that subtle changes in thyroid hormones, a previously unrecognized risk factor, could be an additional risk factor for developing T2DM, even in euthyroid subjects.
Until now, little information has been available on factors associated with changes into low-normal thyroid function, which are defined as either increments in TSH level or decrements in fT4 level. Emerging evidence suggests that low-normal thyroid function also plays a pathogenetic role in the metabolic syndrome (4,8,12,16,21) and the development of atherosclerotic cardiovascular disease (22,23). Since overt and subclinical hypothyroidism are associated with decreased glucose transport in myocytes mediated by glucose transporters (24), it is possible that low-normal fT4 may be associated with higher fasting plasma glucose levels (8). Concordantly, baseline fT4 in this study was inversely correlated with HbA1c, which is a parameter of long-term glycemic control.
In addition, low-normal thyroid function is likely related to modest increases in TC, LDL-C, TG, and obesity, but its effects on HDL-C remains controversial (23). This study shows the same positive correlations between TSH and TG, and an inverse correlation between fT4 and BMI, while the positive association of fT4 with LDL-C was unexpected. Two studies on euthyroid Asians (19,21) yielded similar results, while an inverse correlation between fT4 and LDL-C was observed in two studies from Western Europe (8,16). Since body-fat distribution could have a stronger impact on LDL-C than BMI does (Supplementary Table S2), the inverse correlation between fT4 and LDL-C might be induced by the sex ratio in each study. The proportion of females with a higher fat distribution than males (25) was relatively higher (54.8% and 51.2%, respectively) in the two European studies (8,16), while it was lower (0.0% and 43.2%, respectively) in the two Asian studies (19,21). The proportion of females overall (42.0%) was also lower in the current study. However, it is possible that the inverse correlation is caused by the racial/ethnic difference because one Asian study (19) including only males had similar findings, and a postive correlation in males was also found in this study. Asians appear to have more central fat, upper body fat, and subcutaneous and visceral abdominal adipose tissue than Caucasians, even with the same BMI (26). Serum lipid concentrations are more closely related to total body fat than with BMI in healthy Asians as well (27,28).
This study additionally demonstrates that a decreasing trend in T3 levels is associated with an enhanced risk of incident T2DM. When considered with increased TSH and decreased fT4 levels, a decreased T3 level over time might indicate a progressive decline of thyroid function. However, the positive correlation between changes in T3 and TSH (r = 0.064; p < 0.001) does not support this underactive thyroid hypothesis, while a negative correlation between changes in fT4 and TSH (r = –0.104; p < 0.001) can be explained by a feedback mechanism. Although insulin is the primary hormone responsible for glycemic control, there is biological evidence that the synergistic effects of T3 and insulin modulate glucose and lipid metabolism (29). Several studies have reported that high-normal T3 (free or total) is independently associated with higher levels of fasting glucose (14,18,30) and insulin resistance (15,17). A significant decline in serum T3 levels has been observed in diabetic patients (31,32) due to hyperinsulinemia, which suppresses the level of T3 by inhibiting hepatic conversion of T4 to T3 (32), and an impairment in peripheral conversion of T4 to T3 via deiodinase activity (29,33). The activity of each type of deiodinase enzyme changes in response to different physiologic conditions, and this local control of intracellular T4 and T3 levels results in different tissue levels of T4 and T3 under various conditions (34). Obesity (35) and insulin resistance (36,37) suppress deiodinase type 1 (D1), which converts inactive T4 to active T3 in the body. Deiodinase type II (D2) in the pituitary responds differently and its regulation is often opposite to that of D1. Therefore, weight gain or increased insulin resistance causes intracellular hypothyroidism in most of the tissues except the pituitary gland, and also stimulates deodinase type III (D3), which converts T4 to reverse T3. Since reverse T3 inhibits D1 and D2, this increase in reverse T3 further suppresses T4 to T3 conversion, worsening intracellular hypothyroidism (38).
However, the present results demonstrate that both increased T3 levels and insulin resistance were observed at baseline in the subjects without incident T2DM who had two more conventional risk factors. T3 was decreased or stable in subjects who developed T2DM, while T3 was prominently increased in subjects who did not develop T2DM (Table 6). T3 levels decreased over time in subjects with incident T2DM, even in the improved metabolic status group whose hyperinsulinemia is expected to be improved (Table 6). Conversely, T3 levels increased over time in the aggravated metabolic status group whose hyperinsulinemia may have worsened (Table 6). Serum T3 level gradually increased according to the aggravation of metabolic status (Supplementary Fig. S3). Since T3 may play a role in stimulating insulin secretion and protecting islet β-cells from apotosis (39,40), the present results are in line with a compensatory increase in serum T3 level against the aggravation of insulin resistance. T3 increment as a compensatory mechanism is supported by the fact that T3 levels had strong positive correlations with various metabolic parameters such as obesity, hyperlipidemia, hyperglycemia, and HOMA-IR in this study. In fact, T3 administration actually counteracts streptozotocin-induced diabetes in rats, acting as a pro-survival, anti-apoptotic factor for β-cells, and thus preserves glucose sensing mechanisms (41). Therefore, T3 might directly control serum glucose levels via peripheral tissues such as skeletal muscle, and increased T3 levels could be an adaptive mechanism to counteract for fat accumulations and hyperglycemia in order to enhance energy expenditure (1,42,43).
The strengths of this study are that both baseline values and concurrent changes in TSH and thyroid hormones were analyzed in a relatively large number of subjects. The observations accurately reflect thyroid function during the early stage of diabetes by applying each hormone levels measured one year before diagnosis, because thyroid function could be affected by oral hypoglycemic agents such as metformin after abrupt onset of T2DM. Additionally, the cutoff value of normal TSH was defined as 0.4–4.2 μIU/mL in order to exclude subjects with slight subclinical hypothyroidism at baseline, although the normal TSH range was defined as 0.3–6.5 μIU/mL for females and 0.3–6.0 μIU/mL for males according to the laboratory reference ranges of commercial immunoradiometric kits.
The main limitation of this study is that the subjects may not be representative of the general population. Second, data on insulin were only available in a subsample of the total participants. Serum insulin levels were not measured repeatedly during the follow-up. Moreover, fT3, total T4, and T3/T4 ratio were not measured in this study. Third, changes in TSH and thyroid hormones could have been underestimated in subjects who developed T2DM due to the shorter observation time. Lastly, sex hormones, which can affect thyroid function (44), could not be evaluated.
In conclusion, this study demonstrates that individual changes in TSH and thyroid hormones, even within the normal reference range, are a more significant risk factor of incident T2DM than baseline hormone levels. A pattern of increasing TSH with decreasing fT4 over time, representing a progressive decline in thyroid function, is associated with an aggravation of hyperglycemia. Simultaneously, decreasing T3 might imply the failure of adaptive mechanisms to counteract the detrimental effects of unfavorable metabolic risk factors on insulin resistance.
Footnotes
Author Disclosure Statement
The authors have nothing to disclose.