
Abstract
Background:
The association of changes in thyroid hormone values over time with the incidence of metabolic syndrome (MetS) has not yet been evaluated. For the first time, this study assessed the effect of thyroid hormone variations in the subclinical and euthyroid range on the incidence of MetS and its components over a 10-year follow-up in an adult population.
Methods:
Data were analyzed from the prospective population-based Tehran Thyroid Study. Of 5786 randomly selected subjects aged ≥20 years, after excluding subjects with MetS (n = 1403), those with serum thyrotropin (TSH) >10 or <0.1 mIU/L (n = 104), those taking thyroid drugs (n = 85) or corticosteroids (n = 97), those with a body mass index (BMI) <18.5 kg/m2, those with a glomerular filtration rate <30, and those with a history of cancer (12), data for 2393 subjects were analyzed. Body weight, waist circumference, and blood pressure were measured, and serum concentrations of lipids and lipoproteins, fasting blood glucose, insulin, free thyroxine (fT4), and TSH were assayed at baseline and during three follow-up studies at three-year intervals. MetS was determined using definition of the Joint Interim Statement, adjusted for the Iranian population.
Results:
An increase in fT4 values overtime was associated with lower odds of abdominal obesity (odds ratio [OR] = 0.49 [confidence interval (CI) 0.35–0.69]) and hypertriglyceridemia (OR = 0.57 [CI 0.41–0.78]), and with higher odds of hypertension (OR = 1.35 [CI 1.05–1.74]), adjusted for age, sex, smoking, BMI, and Homeostasis Model Assessment Index for Insulin Resistance. fT4 was associated with lower odds of MetS in the crude model, and after adjustment for age, sex, and smoking (OR = 0.59 [CI 0.39–0.9]). This association lost its significance after further adjusting for BMI. In a subgroup analysis of obese (i.e. BMI ≥30 kg/m2) and non-obese (i.e., BMI <30 kg/m2) subjects, fT4 was a significant predictor of MetS only in non-obese subjects after adjusting for age, sex, and smoking (β = 0.49 [CI 0.29–0.83], p = 0.007) and also after further adjustment for Homeostasis Model Assessment Index for Insulin Resistance (β = 0.57 [CI 0.34–0.96], p = 0.03). Serum TSH variations over time were not associated with any of the MetS components or with odds of MetS.
Conclusion:
A decrease in serum fT4 values is associated with an increased risk for MetS, especially in non-obese adults.
Introduction
M
Thyroid hormones have multiple effects on lipid and glucose metabolism, energy homeostasis, and blood pressure (1,7), and they act as both insulin agonists and antagonists in different organs (8). Epidemiological studies have demonstrated increased cardiovascular events and mortality in subjects with subclinical as well as overt hypothyroidism (9), data that are supported by associations observed between thyroid insufficiency (even within physiological ranges) and clusters of metabolic abnormalities (10 –12). Hence, variations in thyroid hormone levels may be associated with metabolic abnormalities similar to those seen in MetS (6,7), suggesting insulin resistance as a potential link in the pathogenesis. However, data regarding thyroid function and insulin resistance are controversial (8).
Available studies exploring the association of subclinical thyroid dysfunction and MetS are limited and show inconsistent results. Some recent studies showed that any slight increase in thyrotropin (TSH) levels, as in subclinical hypothyroidism, or even high normal TSH levels in euthyroid patients are associated with higher risk of MetS (10). In contrast, others reported no association between TSH and MetS in euthyroid subjects or associations limited to peripheral thyroid hormones (2,5,12). The variability in the available data may be due to different study designs, sample sizes, and the definitions of MetS used. Larger epidemiological studies with appropriate design are needed to resolve these controversies.
MetS and obesity have a high prevalence in Iran (13). However, there are limited data on the effect of thyroid hormone variations over long periods and the incidence of metabolic abnormalities, especially MetS or its components. This population-based study aimed to investigate the association of changes in thyroid hormones in euthyroid and subclinical ranges with incident MetS and its components within a 10-year follow-up in a cohort of the Tehran Thyroid Study (TTS).
Materials and Methods
Study design
The TTS is a community-based cohort study (14) conducted with the residents of district-13 of Tehran with the aim of evaluating the incidence and natural course of thyroid diseases and their long-term outcomes in the urban, iodine-sufficient population of Tehran, the capital of Iran. This study was conducted within the framework of the Tehran Lipid and Glucose Study (TLGS), a long-term integrated community-based study initiated in 1997 for the identification and prevention of non-communicable disorders. Data collection is ongoing, designed to continue for at least 20 years, at three-year follow-up intervals (15).
Study population
In the TLGS, a total of 15,005 individuals aged ≥3 years, under coverage of three medical health centers in Tehran, were selected by multistage stratified cluster sampling with a crude response rate of 57.5% and no significant differences between responders and non-responders. Of 10,368 subjects aged ≥20 years, those who were assessed at baseline and at three follow-ups (n = 5786) between March 1997 and March 2009 participated in the TTS.
Baseline measurements were documented, and participants were invited for three follow-up studies every three years. Participants were excluded based on the following criteria: MetS (n = 1403), intake of thyroid drugs (n = 85), corticosteroids (n = 97), history of cancer (n = 12), TSH >10 mIU/L (n = 47) or TSH <0.1 mIU/L (n = 57), body mass index (BMI) <18.5 kg/m2 (n = 79), glomerular filtration rate <30 (n = 1), and missing data (n = 77). Finally, data for 2316 subjects remained for the study analysis. The median follow-up time was 9.73 years at the end of this study.
Medical history and clinical examination
At the first visit, the study was explained to subjects, and demographic data were obtained. All clinical examinations were performed at the beginning of the study. All participants invited to the TTS unit were referred to trained physicians after providing written informed consent.
Participants were interviewed to obtain past medical history and detailed personal and family history regarding possible thyroid diseases such as goiter, hyperthyroidism, or hypothyroidism and current medication. Information on radioactive iodine intake, smoking habits, physical activity levels, and any medication that may interfere with thyroid function test results were also obtained. Physical examinations including anthropometric measurements were performed.
Participants remained seated for 15 minutes, when a qualified physician measured blood pressure twice with a standard mercury sphygmomanometer, calibrated by the Iranian Institute of Standards and Industrial Researches. Anthropometric measurements were taken with shoes removed, with participants wearing light clothing. Weight and height were measured according to the standard protocol. Waist circumference (WC) was measured at the narrowest level over light clothing, using an upstretched tape meter, without any pressure to body surface, and measurements were recorded to the nearest 0.1 cm (16). Hip circumference was measured at the widest girth of the hip in centimeters. BMI was calculated by dividing the weight in kilograms by the square of the height in meters.
Laboratory measurements
Fasting blood samples were drawn from all participants between 7:00 and 9:00am, and the 75 g oral glucose tolerance test (OGTT) was done in participants who did not take glucose-lowering drugs. Fasting and two-hour glucose concentrations were determined using the enzymatic colorimetric method with glucose oxidase. Serum total cholesterol (TC) and triglycerides (TGs) were measured using the enzymatic calorimetric method with cholesterol esterase and cholesterol oxidase and glycerol phosphate oxidase, respectively. High-density lipoprotein cholesterol (HDL-C) was measured after precipitation of the apolipoprotein B containing lipoproteins with phosphotungistic acid. Low-density lipoprotein cholesterol (LDL-C) was calculated from the serum TC, TGs, and HDL-C concentrations expressed in mg/dL using the Friedwald formula if the TG concentration was <400 mg/dL. All biochemical tests were performed on the day of sampling using commercial kits (Pars Azmoon Inc., Tehran, Iran) by the Selectra 2 auto-analyzer (Vital Scientific, Spankeren, The Netherlands), and samples were analyzed only when quality control met the acceptable criteria. Both inter- and intra-assay coefficients of variation were <2.3% for glucose, <2.1% for TG, <2% for TC, and <3% for HDL-C.
Serum concentrations of free thyroxine (fT4) and TSH were determined in one run using samples stored at −70°C by an electrochemiluminescence immunoassay (ECLIA) method with a Roche Diagnostics kit and a Roche/Hitachi Cobas e-411 analyzer (Roche GmbH, Mannheim, Germany). Intra- and inter-assay coefficients of variability (CVs) were 1.3% and 3.7% for fT4, and 1.5% and 4.5% for TSH determinations, respectively. Thyroid peroxidase antibodies (TPOAb) were determined by an immunoenzymometric assay (IEMA) using kits (Monobind, Costa Mesa, CA) and the Sunrise ELISA reader (Tecan Co., Salzburg, Austria); the intra- and inter-assay CVs were 3.9% and 4.7%, respectively.
Definitions
Euthyroidism was defined as a TSH within the reference range while not taking any thyroid medication or agent interfering with thyroid function test results. The TSH reference range was 0.32 ≤ TSH ≤5.06 and defined for the present population (17).
The Homeostasis Model Assessment Index for Insulin Resistance (HOMA-IR) was calculated by the following formula: fasting glucose (mmol/L) × fasting insulin (mIU/L)/22.5.
MetS was defined according to the Joint Interim Statement (18), with WC defined for the Iranian population. The Iranian National Committee of Obesity considered the identical cut point of WC for both females and males in Iran, as well as the abovementioned harmonizing definition of MetS, and proposed a unified clinical and epidemiological study of MetS among Iranians, which is defined as the presence of at least three of the following (19): (i) WC >95 cm in both sexes; (ii) serum TGs ≥150 mg/dL or on specific treatment; (iii) HDL-C <40 mg/dL in males and <50 mg/dL in females or on specific treatment; (iv) systolic blood pressure (SBP) ≥130 mmHg or diastolic blood pressure (DBP) ≥85 mmHg or on specific treatment for previously diagnosed hypertension; and (v) a fasting blood glucose (FBG) ≥100 mg/dL or on treatment for diabetes.
Statistical analysis
Baseline characteristics are presented as mean (standard deviation) for numerical variables, and number (percentage) for the categorical measures. Differences in descriptive baseline characteristics were explored using Student's independent t-test between the independent groups; for categorical variables, the chi-square test or Fisher's exact test were used. To investigate the association of changes in thyroid hormones in incident MetS and its components such as TC, LDL-C, TG, WC, SBP, and DBP, the generalized estimation equation (GEE) method was undertaken. The GEE developed by Liang and Zeger is a widely used estimation method for marginal (i.e., population averaged) modeling of repeated data (20). In brief, GEEs use the generalized linear model to estimate more efficient and unbiased regression parameters relative to ordinary least squares regression, in part because they permit specification of a working correlation matrix that accounts for the form of within-subject correlation of responses on dependent variables of many different distributions, including normal, binomial, and Poisson. All analyses were done using Stata v13 (StataCorp, College Station, TX). There was no interaction between thyroid hormones and sex in MetS′ incidence (p > 0.05). Subgroup analysis was also conducted on the data of euthyroid subjects negative for TPOAb.
Approval
This study was approved by the National Research Council of the Islamic Republic of Iran (no. 121), and was performed in accordance with the principles of the Declaration of Helsinki and with the approval of the ethics Human Research Review Committee of the Endocrine Research Center, Shahid Beheshti University of Medial Sciences.
Results
A total of 2393 subjects were included in the study (61% female). Baseline characteristics of the study population are presented in Table 1. The mean age was 39.9 ± 13.7 and 36.4 ± 11.7 years for men and women, respectively. Men and women were similar in terms of diastolic BP, TC, and LDL-C. Men had higher values of WC, systolic BP, TG, fasting blood sugar (FBS), and fT4, whereas women had higher values for BMI, HDL-C, fasting insulin, and TSH. During 9.7 years of follow-up, 393 (16.48%) developed MetS in 2002–2005, 237 (9.94%) in 2006–2008, and 320 (13.42%) in 2009–2011.
BMI, body mass index; WC, waist circumference; BP, blood pressure; TC, total cholesterol; LDL-C, low-density lipoprotein cholesterol; HDL-C, high-density lipoprotein cholesterol; TG, triglycerides; FBS, fasting blood sugar; TSH, thyrotropin; fT4, free thyroxine.
The correlation of metabolic markers with serum TSH and fT4 levels is shown in Table 2. Serum TSH was positively correlated with TC (β = 0.14 [confidence interval (CI) 0.08–0.2], p < 0.001), LDL-C (β = 0.12 [CI 0.08–0.14], p < 0.001), and TG (β = 0.0013 [CI 0.003–0.002], p = 0.005) after adjusting for age, sex, smoking, BMI, and HOMA-IR. TSH was also positively correlated with WC (β = 0.027 [CI 0.017–0.037], p < 0.001) after adjusting for age, sex, smoking, and HOMA-IR. There were no significant associations of TSH with HDL-C, systolic BP, diastolic BP, and FBS. Serum fT4 was negatively correlated with TC (β = −4.27 [CI −7.57 to −0.96], p = 0.0110) and LDL-C (β = −2.4 [CI −4.1 to −0.69], p = 0.006), and positively correlated with systolic BP (β = 2.56 [CI 1.93–3.2], p < 0.001) after adjusting for age, sex, smoking, BMI, and HOMA-IR. fT4 was negatively correlated with WC (β = −1.27 [CI −2.34 to −0.2], p = 0.019) following adjustment for age, sex, smoking, and HOMA-IR. Correlation of fT4 with HDL-C, TG, diastolic BP, and FBS was not significant.
Model 1: after adjusting for age, sex, and smoking. Model 2: after adjusting for age, sex, smoking, and BMI. Model 3 after adjusting for age, sex, smoking, BMI, and HOMA-IR.
Model 3 for WC does not include BMI and adjusted for age, sex, smoking, and HOMA-IR.
HOMA-IR, Homeostasis Model Assessment Index for Insulin Resistance.
Table 3 shows the association of serum TSH and fT4 levels with incidence of MetS and its components. fT4 was associated with lower odds of high WC (odds ratio [OR] = 0.49 [CI 0.35–0.69]) and high TG (OR = 0.57 [CI 0.41–0.78]), and higher odds of high BP (OR = 1.35 [CI 1.05–1.74]) after adjusting for age, sex, smoking, BMI, and HOMA-IR. There were no associations of fT4 with high FBS and low HDL-C components. Serum TSH levels were not associated with any of the MetS components.
Model 1: after adjusting for age, sex, and smoking. Model 2: after adjusting for age, sex, smoking, and BMI. Model 3: after adjusting for age, sex, smoking, BMI, and HOMA-IR. Model 2 for high WC not including BMI.
Odds ratio [95% CI].
TSH and fT4 entered as continuous variables.
TSH was neither associated with odds of MetS in the crude model nor after adjusting for age, sex, BMI, and smoking. fT4 was associated with lower odds of MetS in the crude model, and after adjusting for age, sex, and smoking (OR = 0.59 [CI 0.39–0.9), an association that lost significance after adjusting for age, sex, smoking, and BMI. Figure 1 presents the association of fT4 levels with MetS incidence with CI holding age sex, BMI, smoking, and HOMA-IR at their sample means. Data were reanalyzed based on the WC cutoff value of 89 cm for men and 91 cm for women, as reported in the study by Delavari et al. (21), and WC of 90 cm for both sexes, as reported by Esteghamati et al. (22) and Gharipour et al. (22,23), and the results were identical. The mean difference of fT4 and TSH values in those who developed MetS was −0.05 ± 0.14 (p < 0.001) and 0.95 ± 2.2, respectively.
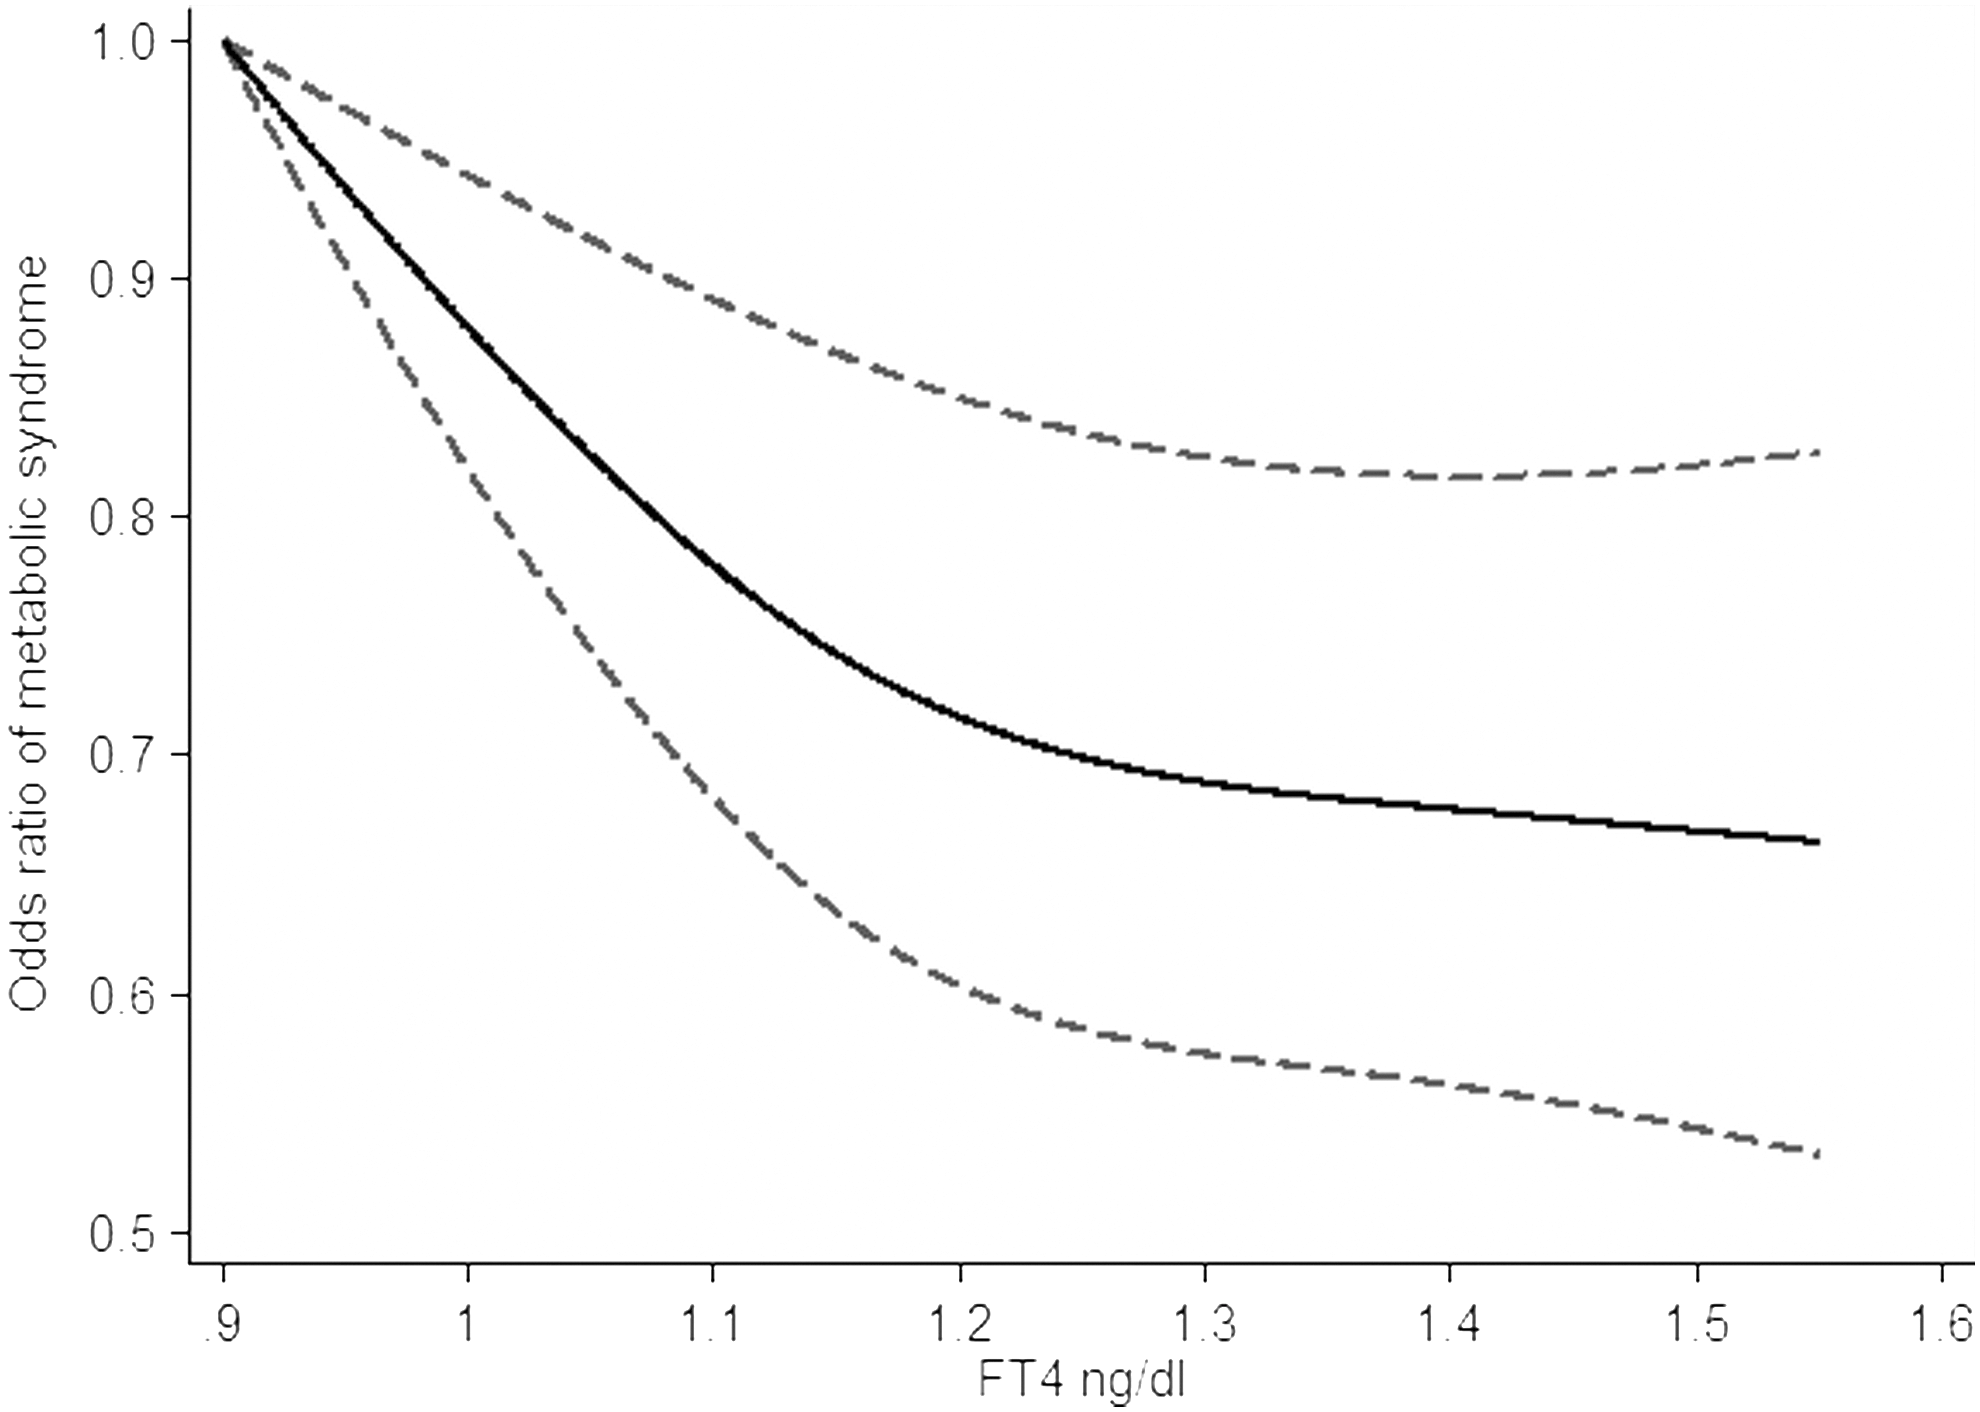
Odds ratio of metabolic syndrome as a function of free thyroxine levels with confidence intervals holding age, sex, body mass index, smoking, and Homeostasis Model Assessment Index for Insulin Resistance at their sample means.
A subgroup analysis was also run in obese (BMI ≥30 kg/m2; n = 354) and non-obese subjects (BMI <30 kg/m2; n = 2039). fT4 was a significant predictor of MetS only in non-obese subjects after adjusting for age, sex, and smoking (β = 0.49 [CI 0.29–0.83], p = 0.007) and also after further adjustment for HOMA-IR (β = 0.57 [CI 0.34–0.96], p = 0.03).
Discussion
The present population-based cohort study shows for the first time that decreasing fT4 values (not TSH) over time are associated with MetS in euthyroid and subclinical hypothyroid subjects (TSH <10 mIU/L); that is, the effects of thyroid hormone variation on metabolic abnormalities over a long time may extend into euthyroid and subclinical thyroid function. The cumulative effect of fT4 reduction over 10 years, determined at three follow-ups, was predictive for abdominal obesity, higher TG values, and high blood pressure after adjustment for age, sex, BMI, and HOMA-IR. Therefore, it seems that mechanisms other than BMI and insulin resistance may be responsible for the association of these metabolic abnormalities and fT4.
The effects of thyroid hormones on synthesis, mobilization, and degradation of lipids could explain lipid abnormalities in thyroid dysfunction, especially hypothyroidism (24). Higher BMI and even WC values, another MetS feature, were also observed in clinical and subclinical hypothyroid subjects. Lower fT4 values, such as those observed in hypothyroidism, may lead to increased systemic vascular resistance in association with decreased arterial compliance, resulting in elevated diastolic blood pressure. In the present study, the higher risk of hypertriglyceridemia, hypertension, and abdominal obesity observed in lower normal values of fT4 (low normal thyroid function) is consistent with findings of overt and subclinical hypothyroidism. Therefore, it seems that the underlying pathophysiological mechanisms behind the influence of thyroid dysfunction on lipid metabolism, weight, and blood pressure may extend into the euthyroid ranges.
There are controversial data regarding the association of TSH and fT4 with MetS and its components, mostly from studies with a cross-sectional design, which are limited in detecting cause-and-effect relationships. Results of a baseline survey showed that fT4, rather than TSH, was associated with prevalent MetS in euthyroid subjects (25), findings in line with those of Roos et al. (5) and Line et al. (12). However, neither of the two studies was adjusted for age, despite its importance in the prevalence of MetS and the negative association between fT4 and age. Kim et al. reported a positive correlation between FBG and fT4, and found no predictive value of fT4 for prevalent MetS (7). There are only two longitudinal studies from the United States and Korea, with 1779 and 5998 participants and six- and two-year follow-up periods, respectively, and both document controversial results. Warning et al. in the United States (26) in a cohort of community-dwelling subjects aged >70 years reported that TSH was associated with prevalent (not incident) MetS. However, fT4 was not measured, and the settings and subjects were quite different. In another cohort study by Park et al. from Korea (11), TSH but not fT4 was associated with either prevalent or incident MetS. However, fT4 and TSH were both associated with insulin resistance. Both cohorts were different in design, setting, race/ethnicity, and inclusion–exclusion criteria, and the MetS definition compared to the present survey, which assessed subjects at three follow-ups, not just at initiation and final follow-up within a population-based cohort design. As it is evident from Figure 1, the slope of the curve at the lower end of the fT4 reference range is steeper than at the upper end. This suggests that a decrease in fT4 values in the lower reference range is more predictive for MetS than a decrease in the upper reference range. Moreover, the confidence intervals in the lower reference range are narrower, which implies that the estimation is more precise at lower fT4 levels.
The main underlying cause of MetS is insulin resistance (4). Existing data addressing thyroid function and insulin resistance are inconsistent. A negative association of fT4 with insulin resistance was found. Obesity per se is known to produce slight changes in the thyroid hormone profile, and the observed associations in this cross-sectional study might have been primarily driven by excess weight. To determine whether these associations are driven by excess weight or insulin resistance, the study further adjusted for BMI and HOMA-IR. Each ng/mL decrease in fT4 was associated with a 40% increased risk of MetS within 10 years after adjustment for age, sex, and smoking, an association that disappeared after BMI adjustment. Therefore, a subgroup analysis was run on subjects with a BMI ≥30 kg/m2 and a BMI <30 kg/m2. It was found that in obese subjects (BMI ≥30 kg/m2), fT4 was no longer predictive for MetS, which may be due to alterations in thyroid hormone levels in obesity. Huggett et al. (27) reported that MetS is a state of sympathetic hyperactivity. Most obese humans have increased sympathetic activation, especially in subjects with central obesity due to a stimulatory effect of insulin (28), which may be one of the mechanisms of MetS development in obese subjects. Depegrola et al. recently showed that progressive central fat accumulation is associated with an increase in free triiodothyronine (T3) independent of insulin resistance as an adaptive thermogenic mechanism (1). In obese individuals, both TSH and peripheral thyroid hormones are increased due to a decrease in thyroid hormone receptors (29), resulting in decreased negative feedback between TSH and peripheral thyroid hormones.
Excess leptin secreted from greater amounts of adipose tissue may stimulate the hypothalamic–pituitary–thyroid axis, increasing thyrotropin secretion. An adaptation process to increase energy expenditure in obese subjects as normalization of elevated TSH in obese subjects has been reported after weight loss (30). This study found fT4 to be a significant predictor of MetS in non-obese subjects, independent of age, sex, and insulin resistance, indicating that other mechanisms may be involved in pathogenesis of association of fT4 and MetS in non-obese subjects.
TSH was not associated with the incidence of MetS or any of its components in the crude or adjusted models, except for TG and WC. For TG, this was even after further adjustment for HOMA-IR and BMI, which shows that the effect of TSH on TG may be modified by mechanisms other than insulin resistance and BMI. Variations in TSH levels were not associated with HOMA-IR either, findings in line with those of cross-sectional studies by Roos et al. (5) and Ruhla et al. (10) reporting weak but significant associations of TSH and insulin resistance, which disappeared after excluding subjects with impaired glucose tolerance. Roos et al. (5), Lai et al. (2), and Mehran et al. (25) found no association between TSH and MetS in euthyroid subjects in cross sectional studies. In contrast to the present study, Ruhla et al. (10), Oh et al. (31), and Park et al. (11) reported that the risk of MetS in the upper normal TSH values was higher than the lower normal TSH values. The discrepancies between these reports may be due to different inclusion criteria, settings, ethnicity, adjustments in the analyses, and iodine status of the population.
Interestingly, the current study demonstrates a divergent association for fT4 and TSH with MetS, which is consistent with other studies reporting a significant association between fT4 but not TSH with various clinical outcomes (5,32 –35). Although TSH has been considered as a highly sensitive measure of thyroid dysfunction, fT4 could be a more reliable marker of thyroid status, as peripheral thyroid activity ultimately depends on circulating fT4, its cellular uptake, deiodination of T4 into active T3, and binding of T3 to nuclear receptors (36). TSH has complex responses to deviations in fT4 levels, which could be disproportionately related to the extent of the deviations from an optimum set point, challenging the simple inverse log-linear TSH–fT4 relationship (37). In contrast to narrow intra-individual variations of TSH, there are wide variations of the fT4/TSH ratio between individuals, suggesting that the individual set point of the HPT axis could be inherited as a genetic trait (38).
This study adds new insights to the field, as the effect of thyroid hormone deviations within a long-term period on the incident MetS and its components have been investigated for the first time, applying suitable adjustments and complex statistical analyses. Strengths include the large sample size, the population-based design, suitable exclusion criteria, and assessment of both fT4 and TSH. However, the lack of T3 levels is a limitation. A recent study by Roof et al. (39) in a middle-aged population reported that higher fT3 and lower fT4 levels, and thus a higher fT3-to-fT4 ratio, are consistently correlated with various unfavorable metabolic profiles and a risk of cardiovascular disease; Moreover, the results cannot be generalized to other populations due to different cutoffs defined for WC in MetS definition and distinct demographic and geographical factors.
To conclude, a lower normal fT4 was associated with incident MetS and a few of its components in an iodine-sufficient Iranian population. The current survey has clinical implications, as the detection of low normal fT4 levels could indicate metabolically unhealthy subjects with combined risk factors who could benefit from early screening and medical intervention. Lower normal fT4 values in non-obese subjects, especially in the presence of other risk factors, may be associated with the development of MetS in the future. More well-designed studies should definitely be conducted to confirm these findings, and in case of similar findings, implementation of clinical trials are warranted to ascertain whether maintaining fT4 values within upper normal ranges could manage insulin resistance and metabolic abnormalities in euthyroid subjects.
Footnotes
Acknowledgments
We would like to acknowledge the personnel of the laboratory of Research Institute for Endocrine Sciences for their collaboration and assistance. We also thank Ms. Niloofar Shiva for English editing of the manuscript.
Author Disclosure Statement
None declared.