
Abstract
Background:
Lenvatinib (Lenvima®) and sorafenib (Nexavar®) are the two most recently Food and Drug Administration–approved drugs for treating radioiodine-refractory differentiated thyroid cancer (RR-DTC). Both demonstrated superior progression-free survival over placebo in their respective Phase III clinical trials. This study compared the cost-effectiveness of the two treatments with placebo from a limited societal perspective.
Methods:
A Markov model was developed to estimate the costs and health benefits for treatment of RR-DTC. The probabilities and survival rates were obtained from two Phase III trials: the SELECT trial comparing lenvatinib to placebo, and the DECISION trial comparing sorafenib to placebo. A bimonthly cycle length and half-cycle correction were used for a lifetime time horizon. Medical costs and utility data were obtained from RedBook, Healthcare Cost and Utilization Project, and the published literature. All costs were adjusted to US$2015, discounted at 3% annually. Then second-order Monte Carlo simulation with distributions was conducted to obtain the acceptability curve to address the uncertainty around model inputs.
Results:
In the base case, lenvatinib was the most cost-effective treatment compared to sorafenib (incremental cost-effectiveness ratio [ICER] = $25,275/quality-adjusted life year [QALY]) and placebo (ICER = $40,869). Sorafenib is also cost-effective compared to placebo (ICER = $64,067/QALY). The treatment decisions were found to be sensitive to the treatment costs and the health utility associated with lenvatinib and its side effects. The acceptability curve showed lenvatinib optimal 80% of time at WTP of $100,000/QALY.
Conclusions:
This study suggests that lenvatinib is the optimally cost-effective treatment for RR-DTC, although both lenvatinib and sorafenib are cost-effective compared to placebo.
Introduction
T
Until recently, there were few treatment options available for patients with RAI-refractory DTC (RR-DTC). In 2013, the U.S. Food and Drug Administration (FDA) approved sorafenib (Nexavar®), an oral tyrosine kinase-inhibitor (TKI), for treatment of locally recurrent or metastatic, progressive RR-DTC. This was followed in 2015 with the approval of another oral TKI, lenvatinib (Lenvima®), for the same indication. Both treatments demonstrated superior progression-free survival (PFS) over placebo in their respective Phase III clinical trials (3,4). The relative hazard for overall survival (OS) of both lenvatinib and sorafenib was also shown to be numerically superior to placebo but not statistically significantly different in these trials (3,4).
The introduction of a new treatment requires practicing physicians to evaluate the efficacy advantages against the best available alternative treatments, and this is made more difficult when the clinical trials testing efficacy are compared against placebo instead of the alternatives. In addition, physicians and practice settings must evaluate the cost efficiency of the new treatments compared to the alternatives, and in some countries (the United Kingdom and Australia), this comparison is required prior to drug approval. The “gold standard” for comparing efficiency of new treatments is the cost-effectiveness analysis (CEA), which calculates an incremental cost effectiveness ratio (ICER) by taking the ratio of the difference in costs over the difference in effectiveness (life years) of the two treatments being compared. The ICER is expressed as the additional costs of the new versus the old treatment for each additional quality-adjusted life year (QALY) that this new treatment can provide. This ICER number is compared against a threshold amount that society is willing to pay (WTP) for new treatments—somewhere between $50,000 and $150,000 in the United States. If the ICER falls under this WTP threshold, then the treatment is considered efficient to adopt. The ICER provides addition information to the clinical treatment decision that physicians are making with their patients.
There is one published abstract comparing the CEA of lenvatinib and sorafenib in the United States, which suggests an ICER of $103,925 per QALY favoring lenvatinib (5). An additional abstract compared sorafenib to best supportive care in Turkey, showing an ICER of US$30,485/QALY (6). A CEA was performed to compare two TKIs, lenvatinib and sorafenib, with each other and with placebo in the setting of RAI-refractory DTC to help inform value-based decision making.
Methods
A Markov model was developed using Treeage Pro 2014® (7) to estimate the cost-effectiveness of lenvatinib compared to sorafenib, and of both lenvatinib and sorafenib compared to placebo for the treatment of patients with RR-DTC from a U.S. ‘limited’ societal perspective. A “limited” societal perspective reflects that the intent of the analysis is to include all costs using opportunity costs, but that drug acquisition costs were actually used rather than true opportunity costs, as do most CEA (8).
Model inputs were obtained from the two pivotal Phase III trials of patients with RR-DTC whose disease had progressed. Updated PFS data were not included, since they were available only as an abstract (9). The DECISION trial compared the safety and efficacy of sorafenib treatment compared to placebo (3), and the SELECT trial studied safety and efficacy of lenvatinib compared to placebo (4). The study protocols for DECISION and SELECT were similar. Both were Phase III trials enrolling patients with progressed thyroid cancer within the last 14 months, determined through use of imaging and the Response Evaluation Criteria in Solid Tumors (RECIST). The DECISION trial enrolled 417 patients allocated on a 1:1 basis, and the SELECT trail enrolled 392 patients allocated 2:1 treatment to control. The median duration of follow-up was 16.2 and 17.1 months, and the median age was 63 and 64 years (3) in the DECISION and SELECT trials, respectively. However, the placebo group in DECISION (sorafenib) had a longer median PFS compared to SELECT's (lenvantinib) placebo group (5.8 vs. 3.6 months), indicating that the DECISION study population may have been healthier.
The Markov model included three health states: stable, further progression, and death (Fig. 1). The decision tree had three branches at the decision node comparing the treatment strategies, lenvatinib and sorafenib to placebo, respectively. The study used 2015 costs in U.S. dollars, a lifetime time horizon, and adjusted for time preference using a 3% discount rate for costs and effectiveness. Cycle lengths were set as two months because the data for PFS, the primary outcome in this trial, were available every two months. A half-cycle correction was performed to account for overestimates when outcomes are counted at the beginning of the cycle. Each simulation cycle represents the transition between health states. Patients enter the study if they have progressed within the past 14 months (stable). Then they may stay stable or progress further. Patients may die from either stable or progressed states. The simulation terminates when all patients die of the disease.
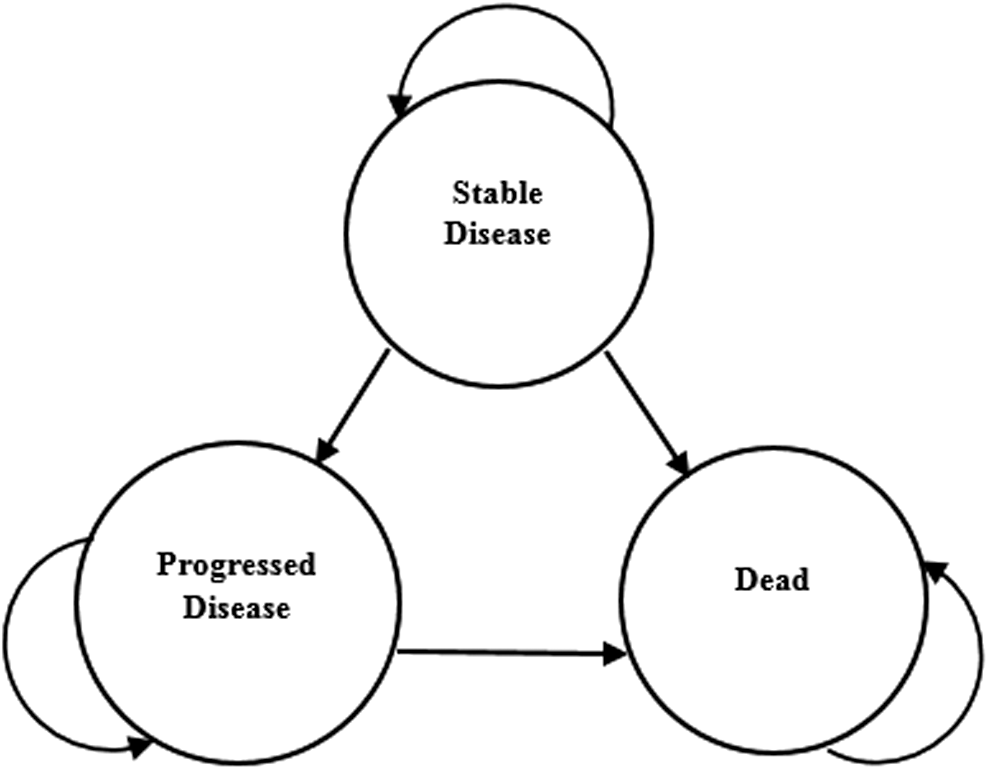
Markov model with three health states and five transitions.
The ICER was compared among each pair of the three treatments using cost per QALYs as the primary outcome. The ICER is defined as (CostDrug1 – CostDrug2)/(EffectivenessDrug1 – EffectivenessDrug2). A willingness-to-pay threshold of $100,000/QALY was used to determine cost-effectiveness (10).
State transition probabilities
Transition probabilities for stable disease to progressed disease and stable disease to death were extracted from the Kaplan–Meier PFS and OS curves from the DECISION and SELECT trials (3,4).
The placebo groups had a median age (61 and 63 years), male sex (75% and 45%), and Eastern Cooperative Oncology Group (ECOG) performance status 0 to 1 (98.5% and 96.5%) for lenvatinib and sorafenib, respectively. ECOG 2 or 3 was allowed for 1.5% of lenvatinib patients enrolled, and only ECOG 2 was allowed for 2.9% of patients. Some patients in the lenvatinib trial received prior vascular endothelial growth factor (VEGF) treatment, which may indicate more severe disease, while no pretreatment was allowed in the sorafenib trial. To obtain one placebo group from two trials, the placebo hazard rates from DECISION and SELECT were averaged. The new lenvatinib and sorafenib hazard rates were obtained by applying their original hazard ratio from the trials to the newly averaged placebo hazard rate. Finally, the averaged placebo hazard rates and new sorafenib and lenvatinib hazard rates were converted into transition probabilities: (t) = 1 – e –h(t).
Survival Kaplan–Meyer curve probabilities for PFS and OS from DECISION and SELECT were read using WebPlotDigitizer®. Survival curve probabilities were converted into bimonthly survival probabilities for each cycle (t) = p(Survivalmonth2)/p(Survivalmonth0), then converted into hazard rates h(t) = –log[S(t)]/cycles. Hazard rates for stable to progression were calculated by subtracting the hazard rate for OS by PFS. The last OS value carried forward was used to extrapolate the tails after study cutoff until all patients entered the death state. Figures 2 and 3 show the model's adjusted PFS and OS.
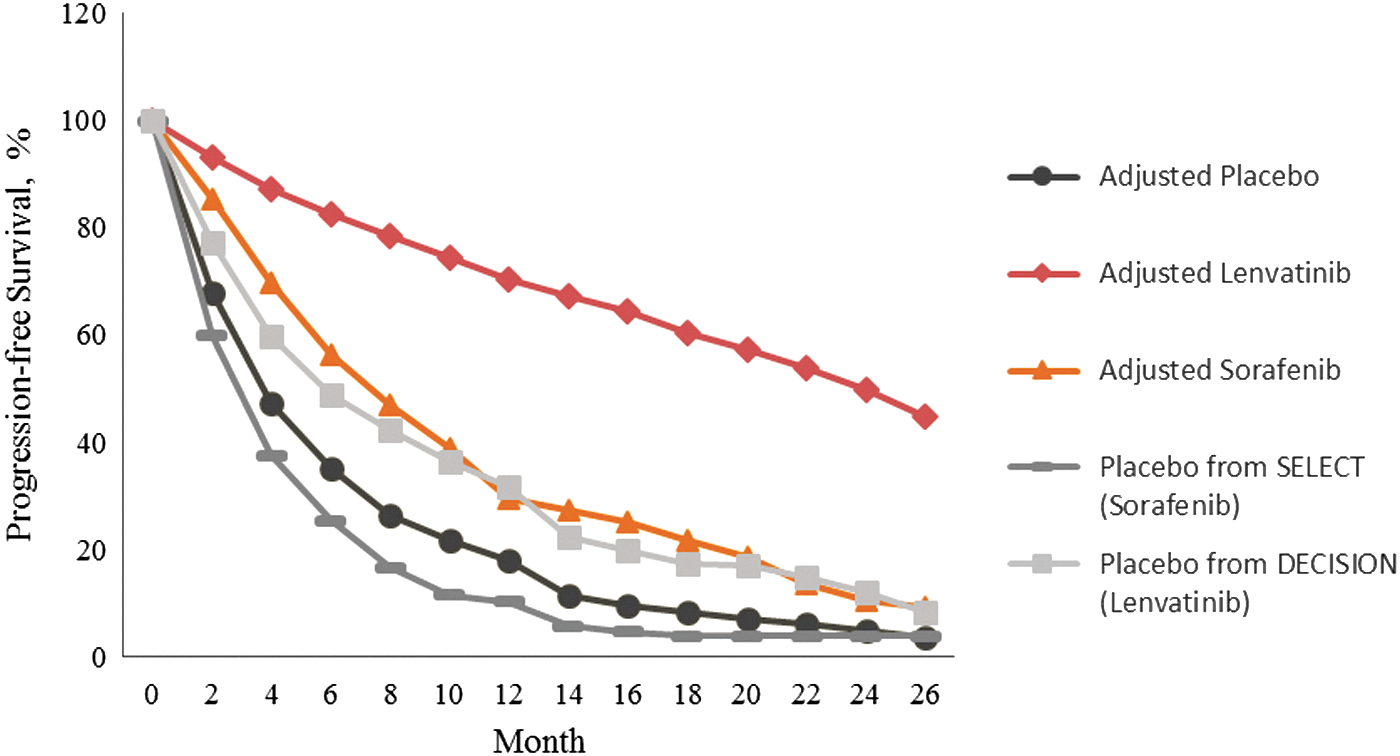
Adjusted progression-free survival (PFS) Kaplan–Meier curve for sorafenib, lenvatinib, and placebo for treatment of radioactive iodine (RAI)-refractory differentiated thyroid cancer (DTC).
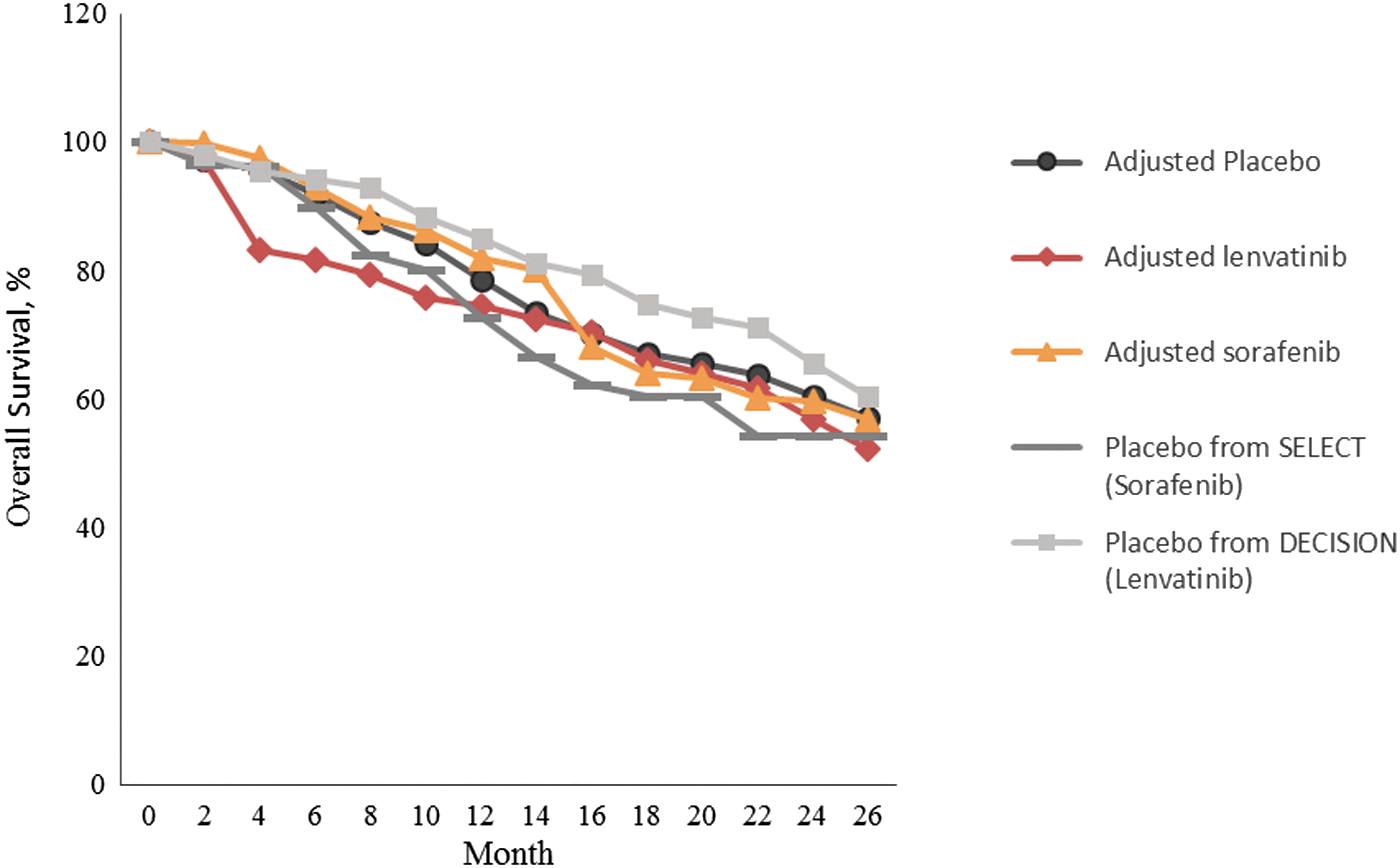
Adjusted overall survival (OS) Kaplan–Meier curve for sorafenib, lenvatinib, and placebo for treatment of RAI-refractory DTC.
The proportion of patients with disease progression was obtained by subtracting the proportion of patients who progressed and/or died (PFS) from the OS. It was assumed that progressed individuals could only either remain progressed or die.
Costs
The total cost for lenvatinib and sorafenib treatment branches included cost of the drug, cost of monitoring and treating drug side effects, and cost of disease management after disease progression (Table 1). The placebo group received palliative care costs for their disease management and end-of-life costs.
Drug costs of sorafenib and lenvatinib were obtained using 83% of average wholesale price (AWP) to reflect contract pricing, which is the common standard, but does not use the marginal costs of production and distribution of the drug as is the goal of a true societal approach (8). To account for treatment interruptions, dose, reductions, and treatment discontinuations, total drug costs were calculated using mean daily dose and median duration of treatment reported in DECISION (651 mg sorafenib for 10.6 months) and SELECT (17.2 mg lenvatinib for 13.8 months). Since patient-level data were not available, it was not possible to use dynamic treatment duration analysis (11). DECISION patients in both treatment arms who progressed were allowed open-label sorafenib in both treatment arms. There was no mention of other treatment types. SELECT patients in the placebo arm were allowed open-label lenvatinib, while those in the treatment arm subsequently received additional anticancer therapies, which were unspecified. These second-line treatment costs were not accounted for because specific data on amount and type of second-line treatment were not well specified.
The cost of monitoring and treating side effects was obtained using micro-costing (Table 1) of guideline-directed treatment for each type of side effect, and the methods were comparable across the three treatments. Side effects included in the model were those that had ≥25% incidence or those that resulted in death or were likely to incur high treatment expense even if <25% incidence from the DECISION or SELECT active drug arms. Grade 3 or 4 side effects were assumed to have incurred both outpatient and inpatient costs, while Grade 1 and 2 only incurred outpatient costs. The monitoring and treatment of each side effect was compiled from published guidelines and expert opinion if no guidelines were available (12) (Table 1). Physician visits and hospitalizations needed to treat each side effect were based on the expected duration and the grade of each. Side-effect costs were then multiplied by the estimated utilization of each item of treatment. Treatments costed included drug costs again as 83% of AWP from the Redbook (13), hospitalization costs from HCUP data (14), and physician fees and cost of lab tests from Medical Fee 2013 (15). A total cost of side effects for each treatment was weighted by side-effect incidence from the clinical trials (Table 1).
The stable state for placebo included cost of palliative disease management and end-of-life costs to reflect the care needed for patients with progressed disease forgoing these TKI treatments. For all branches, the cost incurred in the progressed state included cost of end-of-life palliative care only, assuming no additional active drug treatment would be given, since data on open-label treatments were not adequate to cost fairly across groups.
The total costs of lab monitoring over the median duration of treatment with lenvatinib or sorafenib were derived from Carhill et al. (12) (Table 1). Costs of the stable health state included the cost of thyroid cancer monitoring, and cost of the progressed health state included end-of-life care for thyroid cancer, as reported by Lubitz et al. (16). Lastly, cost of death included a hospitalization cost.
Utility
Utility is a measure from 0 (worst health) to 1 (best health) of one's preference for living in a particular health state. Utility weighting is used in CEA to decrease the value of a year of survival to reflect how sick one is feeling during that year. Utility was used to weight the impact of disease-specific health states such as with a progressive thyroid cancer, with a response to treatment and states, and for living with each type of adverse effect. The DECISION and SELECT clinical trials did not collect utility information, so Fordham's progressive disease state utility (0.5) was used as our base state utility for the two treatment arms and for the placebo group health state, since patients enrolled already had progressive disease (28).
Utilities of side effects were also obtained from the literature (Table 1). To obtain the initial utility on either drug treatment, the base state utility was increased by a utility gain to reflect a treatment response and by a utility decrement to reflect each specific side effect: diarrhea, fatigue, hand-foot skin reaction (HSFR), alopecia, hypertension, weight loss, hypocalcemia, dyspnea, and rash weighted by their incidence from the respective Phase III trials (3,4). To determine how long to apply a side-effect disutility, it was assumed that some side effects were long lasting throughout the treatment, including fatigue, HFSR, alopecia, hypertension, weight loss, and rash, and that some would respond to treatment and therefore resolve after two weeks (diarrhea, hypocalcemia, and dyspnea). To account for the utility of the health state after patients experienced a protocol-defined progression, the lower bound of confidence intervals of the progressive disease utility was used from Fordham et al. to reflect that this was a second disease progression for these patients (Table 1).
Sensitivity analysis
One-way and probabilistic sensitivity analyses were conducted to validate the model robustness. Sensitivity to drug price was tested using 100 price intervals to obtain transition points where the cost-effectiveness decisions would change among the three treatment comparisons. The model was run with and without utilities in order to test the uncertainty in these estimates. The probabilistic sensitivity analysis used 1000 Monte Carlo iterations to estimate the uncertainty surrounding all the model inputs together. Gamma distributions were assigned to costs and beta distributions to transition probabilities and health-state utilities. A cost-effectiveness acceptability curve was calculated, given different WTP thresholds (10). The net monetary benefit (NMB) of our comparisons was also calculated, given a $100,000 WTP threshold using the formula: NMB = (W × ΔC) – ΔQ, where W = WTP amount. NHB overcomes the problems associated with parametric tests of the ratio used in an ICER calculation and is always defined and continuous. Programs should be adopted when the net benefit is >0.
Results
Base-case CEA analysis
In the base case (Table 2), placebo was the least costly ($139,695) followed by sorafenib ($155,948), leaving lenvatinib as the most costly treatment strategy ($165,487). The largest contributor to costs for the lenvatinib and sorafenib branch was drug costs ($137,037 vs. $114,831, respectively). Lenvatinib had higher total drug cost compared to sorafenib due to a longer median treatment, despite having a lower cost per milligram. Lenvatinib also had a higher cost of side-effect treatments than sorafenib did ($8,712 vs. $7,151 respectively; Table 2).
ICER, incremental cost-effectiveness ratio; QALY, quality-adjusted life year.
However, lenvatinib provided the most QALYs (1.34 QALYs)—more than sorafenib with 0.96 QALYs and placebo with 0.71 QALYs (Table 2). Given the WTP threshold of ≥$100,000/QALY, lenvatinib was the most cost-effective treatment among the three comparators. Although both lenvatinib and sorafenib are cost-effective compared to placebo, lenvatinib is more cost-effective (ICER = $40,869/QALY) than sorafenib is (ICER = $64,067/QALY) when each is compared to placebo.
One-way sensitivity analysis
The most sensitive metrics in this model were cost of lenvatinib and sorafenib, and utility associated with lenvatinib and its side effects.
Table 3 shows the one-way sensitivity for the drug cost of lenvatinib. When the cost of lenvatinib per episode of treatment was <$111,024 (a 19% decrease in cost), it showed absolute dominance over both sorafenib and placebo. When the cost was <$112,395 (an 18% decrease), lenvatinib dominated sorafenib and was highly cost-effective compared to placebo. When the price of lenvatinib was $128,843, which is 6% lower than the base-case price ($137,067), lenvatinib no longer dominated sorafenib but was very cost-effective compared with sorafenib (ICER = $3,483/QALY). It is not until the drug price of lenvatinib reaches $165,851 (21% higher) that it starts to become less cost-effective than sorafenib, given the $100,000 WTP threshold.
The base-case lenvatinib drug price = $137,067.
The strategies were ranked from the least costly to the most costly, and comparisons were with the next least costly option.
The one-way sensitivity analysis (not shown) for the drug cost of sorafenib showed that an 8% decrease in drug price of sorafenib per episode ($105,455) led to sorafenib becoming cost-effective compared to lenvatinib.
Utility is the other most influential factor on the results. Therefore, the model ICERs were estimated without any utility adjustment. Although these ICERS were lower, the conclusions are the same: lenvatinib is still the most cost-effective option (Table 4).
LYS, life year saved.
Probabilistic sensitivity analysis
The cost-effectiveness acceptability curve was generated from the probabilistic sensitivity analysis and shows that at a WTP of $100,000/QALY, lenvatinib is the optimal treatment 80% of the time, with only 15% for sorafenib and <1% for placebo (Fig. 4). Placebo is the optimal choice under a WTP of $40,000/QALY but only for 35–62% of the time. Sorafenib is never the most cost-effective choice (Fig. 4).
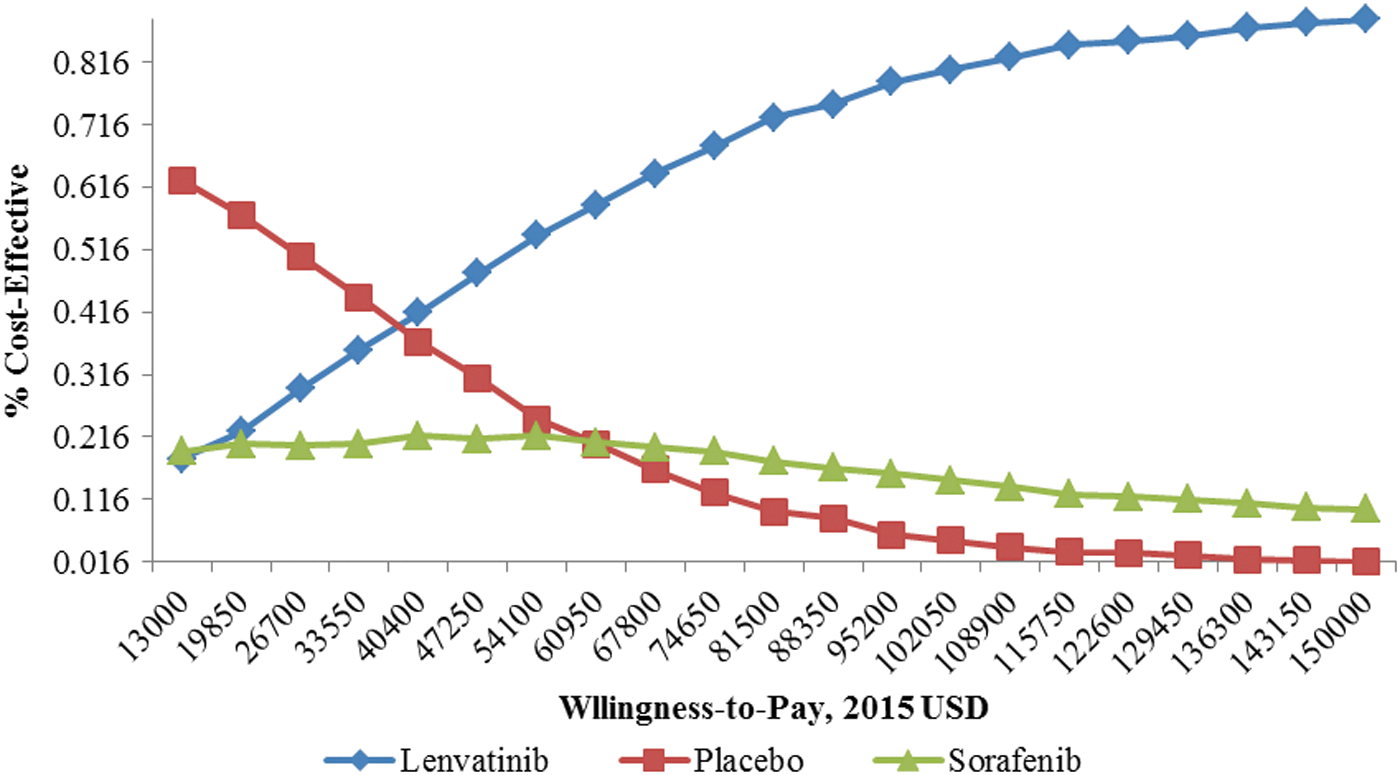
The cost-effectiveness acceptability curve for lenvatinib, sorafenib, and placebo.
Discussion
The present analysis shows that lenvantinib is the most cost-effective treatment strategy compared to sorafenib and placebo in patients with RR-DTC. Treatment options have historically been limited for patients with RR-DTC, but have improved with the recent approval of the two TKIs compared here: sorafenib and lenvatinib. Each of these drugs was approved based on PFS compared to placebo in separate trials, making it much more difficult but essential to compare each with the other for both outcome and cost. A Markov model was used to compare the cost-effectiveness of these two treatments across trials using an adjusted baseline PFS and OS. In the base-case analysis, lenvantinib is the most cost-effective option compared to both sorafenib (ICER = $25,275/QALY) and placebo ($40,869/QALY) and given a WTP threshold of ≥$100,000/QALY. There is some variation of the accepted WTP threshold, ranging in the United States from $50,000 to $160,000 per QALY, with the use of higher values especially for cancer treatments (34). However, in these treatment comparisons, all the ICERS are below both $100,000 and $160,000/QALY. Although lenvantinib is more costly, its strong improvement in life years saved results in its cost-effectiveness compared to the alternatives. The Monte Carlo acceptability curve indicates that at this WTP, lenvatinib is the preferred strategy 80% of the time, indicating the robustness of this result.
While lenvatinib is the most cost-effective option given current costs and outcomes, small decreases in the cost of sorafenib (<8% decrease) switches the decision and begins to favor sorafenib as cost-effective over lenvatinib and placebo at a WTP of $100,000. Likewise, it takes a 21% increase in the price of lenvatinib before it begins to become less cost-effective than sorafenib. Side effects are different but frequent between the two treatments, and the utility decrements associated with these side effects also are sensitive in this model. However, the conclusions to favor lenvatinib as the most cost-effective treatment do not change, even when the inclusion of utilities is eliminated in the model completely.
This analysis is not without limitations. First, the study used the main PFS and OS outcomes of the pivotal Phase III clinical trials for approval for the major outcomes in the cost-effectiveness model. The updated PFS data published later in a scientific poster were not used to update the outcomes because these data are still considered preliminary. However, further analyses should consider updating outcomes as they reach the publication stage. Second, since there was no head-to-head trial comparing sorafenib and lenvatinib, and since the patients in the placebo group of the lenvatinib trial appeared healthier than those in the sorafenib trial, the PFS and OS outcomes had to be adjusted so that they could be compared across trials. While the PFS and OS curves of the two treatments were adjusted based on a combined placebo group, it was not possible to determine the actual compared outcomes without a head-to-head trial. Others have used a matching-adjusted indirect treatment comparison of sorafenib and lenvatinib (35). They used individual patient-level data available from the SELECT trial and adjusted this to match the published summary data from the DECISION trial closely to result in hazard ratios for PFS and OS superior for lenvatinib versus sorafenib. Patient-level data were not available in the present study, but the adjustment across trials explained earlier also resulted in higher life-year saved and QALYs for lenvatinib than for sorafenib. Third, it was not possible to use dynamic treatment duration when determining the exact length of drug treatment for determination of drug costs because patient-level data were not available. The median treatment duration was used instead, which is the next best option. The choice of a two-month cycle length might miss some of the changes occurring monthly at the beginning of the treatment period. However, other points in the treatment cycle seemed to fit the two-month treatment cycle that we used better.
Finally, the treatment costs may be underestimated because no open-label follow-up drug treatment costs were included in the analysis. Patients with a protocol-defined progression were allowed to begin open-label sorafenib in both the treatment and control groups in the sorafenib clinical trial, but if they failed sorafenib, the next treatment was not specified. In the lenvatinib trial, patients with progression were allowed to receive open-label lenvatinib in the placebo group, but the treatment group patients were allowed an unspecified anticancer treatment. Therefore, the published trials did not provide enough detailed information about the amount, type, and length of open-label treatment for all groups to allow inclusion of these costs without access to patient-level data. However, exclusion of these data might contribute to the lower ICER than the results published in the abstract by Tremblay et al., which had access to patient-level data and included these cross-over drug costs. The conclusions from both ICER analyses were, however, the same (5,35). Despite these limitations, to the authors' knowledge, this is one of the first economic models comparing lenvatinib, sorafenib, and placebo in the treatment of RR-DTC. The model indicates that in a population of progressed RR-DTC, lenvatinib is preferred to sorafenib and placebo. With lenvatinib's strong PFS and OS outcomes, and its similar side-effect costs compared to sorafenib, the ICER estimates indicate that lenvatinib is the most cost-effective choice of TKI treatment.
The one published CEA study is an abstract comparing lenvatinib to sorafenib in the United States and reports that lenvatinib costs an additional $103,925/QALY (5). An additional abstract compared Sorafenib to best supportive care in Turkey, showing an ICER of US$30,485/QALY (6). The ICER in the present study comparing lenvatinib and sorafenib ($25,275/QALY) is lower than the one reported by Tremblay et al. ($103,925/QALY), but the present ICER outcomes give the same result (5,35). Several factors could have contributed to the lower measures of cost. First, costs not charges were used as much as possible. Patient-level data were not available, as they were in the abstract by Tremblay et al. (5), and therefore the costs of secondary open-label treatments or best supportive care treatments were not taken into account. It was assumed that the placebo patients and the patients with progression on treatment had chosen palliative treatment, since they were not receiving a TKI, and the average palliative-care treatment costs might be lower than the best supportive care treatment cost used in the abstract reported by Tremblay et al. (5). The type and duration of side-effect treatments were also modeled based on guidelines, rather than using trial-based information on hospitalizations used in the study by Tremblay et al. (5). Hence, the costs in the present study may be lower here as well. Neither study included any indirect or societal costs. Finally, the present study had detailed utility weights to reflect the presence of side effects, and this may have contributed to the lower ICER compared to Tremblay et al. (5), who may not have included as many side-effect disutilities in their model. Despite differences in costing and utility measurement of some factors, the present study applied the same costing methods to all groups being compared, so although the ICER is lower, the conclusion of both CEA comparisons is that lenvatinib was the most cost-effective treatment.
Access to patient-level data collected in clinical trials is only available to those that have proprietary access, and these can provide more accurate data. However, for the study by Tremblay et al. (5), the detailed data available to them from the lenvatinib clinical trial were not also available to them from the sorafenib clinical trial. So assumptions still had to be made for cost and outcomes assessments for this trial. The estimates in the present study, although less detailed, were based on clinical guidelines and carefully applied across all groups, leading perhaps to lower ICER estimates but accurate comparative results. The cost-effectiveness model presented here is a validated approach based on modeling, and the probabilistic sensitivity analysis confirms the results. Clinicians can use these results to evaluate the economic value of each treatment option they are considering based on Phase III clinical trial treatment efficacy comparisons. The study shows that lenvantinib is the most cost-effective option compared to both sorafenib and placebo. Sorafenib is also cost-effective compared to placebo, but lenvatinib is still the most cost-effective choice. Final treatment decisions are based on many clinical factors, including efficacy and risk for side effects. CEA results are meant to support these choices based on the cost-efficiency of these choices. The present results will also be useful to healthcare systems making decisions among these TKIs for treatment, especially in the current era of limited healthcare budgets. Further cost-effectiveness studies should compare utilization and costs of treatments in the real-world setting and with longer-term outcome data as these become available.
Footnotes
Author Disclosure Statement
No competing financial interests exist.