
Abstract
Background:
The follicular variant (FV) of papillary thyroid cancer (PTC) is one of the most common variants of PTC. Clinically, non-infiltrative FVPTC is considered a low-risk variant of PTC, and the non-invasive encapsulated forms of FVPTC represent a group of thyroid tumors with a particularly good prognosis. Consequently, these neoplasms have been very recently reclassified as non-invasive follicular neoplasms with papillary-like nuclear features (NIFTP). From a molecular standpoint, NIFTP appears to be similar to follicular neoplasms. However, only limited data are currently available regarding their gene expression profile.
Methods:
The aim of this study was to identify specific molecular signatures of 26 NIFTPs compared to those of 19 follicular adenomas (FAs) and 18 infiltrative FVPTCs (IFVPTCs). A nanoString custom assay was used to perform mRNA expression analysis. All cases were also genotyped for BRAF, N-, H-, and K-RAS mutations. Samples were grouped on the basis of gene expression profiles by Pearson's correlation and non-negative matrix factorization clustering analysis. Finally, the uncorrelated shrunken centroid machine-learning algorithm was used to classify the samples.
Results:
The results revealed distinct expression profiles of FAs and IFVPTCs. NIFTP samples can exhibit different expression profiles, more similar to FAs (FA-like) or to IFVPTCs (IFVPTC-like), and these different expression profiles largely depend on the presence of different mutations (RAS or BRAF).
Conclusion:
In conclusion, although further validation of the model is required by using a larger group of prospective cases, these data reinforce the hypothesis that IFVPTC-like NIFTPs might represent precursors of IFVPTC.
Introduction
T
The encapsulated forms of FVPTC (EFVPTC) represent a group of thyroid tumors with an overall good prognosis (12) in terms of an indolent disease course with an extremely low recurrence rate, likely to be <1% within the first 15 years. Therefore, EFVPTC with encapsulation or clear demarcation, follicular growth pattern with <1% of papillae, no psammoma bodies, <30% of solid/trabecular/insular growth pattern and a nuclear score of 2–3, absence of vascular or capsular invasion, absence of tumor necrosis, and low mitotic activity have been recently reclassified as non-invasive follicular neoplasm with papillary-like nuclear features (NIFTP) (13).
The objective of the present study was to identify a specific NIFTP molecular signature distinct from that of follicular adenomas (FAs) and infiltrative FVPTCs (IFVPTC) by using the nanoString mRNA expression analysis and the uncorrelated shrunken centroid (USC) machine-learning algorithm.
Materials and Methods
Study group
The study included 62 patients with diagnoses of FA and FVPTC who underwent total/near-total thyroidectomy at the Department of Surgical, Medical, Molecular Pathology and Critical Area of the University of Pisa, Italy, between 2013 and 2015. Hematoxylin and eosin–stained sections of neoplasms obtained from the archives of the University of Pisa, Section of Pathology, were re-evaluated independently by two pathologists (C.U. and F.B.). For all cases, the eventual capsular and/or vascular invasiveness and the infiltration of thyroid and extrathyroidal tissues were evaluated. A diagnostic concordance rate of 98% was achieved between the two investigators. Discordant cases were rejected. The tumors were diagnosed and classified according to World Health Organization 2004 histopathological criteria (2).
To avoid contamination with other cellular types, cases with any grade of thyroiditis were excluded, and only neoplasms with approximately 50% of neoplastic cellularity were considered for examination. This retrospective study was conducted anonymously and in compliance with the principles of the Helsinki Declaration of 1975. Informed consent for the molecular analysis was obtained one day before surgery, together with the surgical consent.
NIFTP selection criteria
Thirty cases already diagnosed as EFVPTCs were selected. At the time of diagnosis, all these cases were in toto sampled. All paraffin-embedded blocks were recut, independently reevaluated by the same two pathologists (C.U. and F.B.), and reclassified as NIFTPs. Diagnoses were made according to the morphological criteria reported by Nikiforov et al. (13), which include encapsulation or clear demarcation, follicular growth pattern with <1% of papillae, no psammoma bodies, <30% of solid/trabecular/insular growth pattern and a nuclear score of 2–3, absence of vascular or capsular invasion, absence of tumor necrosis, and mitotic activity <3 per 10 high power fields. Among the 30 selected cases, four did not match the above criteria and were therefore excluded.
RNA purification
Total RNA was purified from 18 FAs, 26 NIFTPs, and 18 IFVPTCs. After a standard deparaffinization procedure was performed, two to three formalin-fixed, paraffin-embedded (FFPE) tissue sections (5 μm in thickness) were submitted to manual microdissection. Then, RNA was extracted and purified using a Qiagen RNeasy FFPE kit (Qiagen, Hilden, Germany), according to the manufacturer's recommendations. RNA concentrations were measured using an Xpose instrument (Trinean, Gentbrugge, Belgium).
nanoString nCounter assay
The nCounter custom code set used in this study was designed and synthesized by nanoString Technologies (nanoString Technologies, Seattle, WA). A total of 75 genes were included in the code set based on their observed differential expression between both FAs versus FVPTCs/PTCs and FAs versus FTCs (Table 1) (14 –25). Four housekeeping genes were also included in the code set for normalization purposes (beta actin [ACTB], b2-microglobulin [B2M], hypoxanthine phosphoribosyl transferase [HPRT], and glyceraldehyde-3-phosphate dehydrogenase [GAPDH]). Total RNA (125 ng) from FFPE tissue was analyzed using the nanoString nCounter Analysis System (nanoString Technologies). All procedures related to mRNA quantification, including sample preparation, hybridization, detection, and scanning, were performed following the manufacturer's instructions. Gene expression profiling using nanoString was performed on RNA extracted from the 62 thyroid neoplasms. Raw data normalization was performed in two steps, as previously reported (26).
Compared to follicular adenoma (FA).
FTC, follicular thyroid carcinoma; FVPTC, follicular variant of papillary thyroid carcinoma; PTC, papillary thyroid carcinoma.
DNA extraction and BRAF and RAS gene family mutational analyses
Two unstained 10 μm paraffin sections from each sample were first deparaffinized with xylene prior to DNA purification using a DNeasy FFPE kit (Qiagen), according to the manufacturer's instructions.
DNA was eluted in 40 μL TE buffer and then immediately processed for polymerase chain reaction (PCR) amplification. Detection of mutations in N-, H-, and KRAS exons 2–3 and BRAF exon 15 was performed according to standard procedures (27 –29) using direct DNA sequencing on a 3130 Genetic Analyzer (Thermo Fisher Scientific, Waltham, MA).
Unsupervised sample clustering by Pearson's correlation and non-negative matrix factorization
All the gene expression profiles were used as input for both Pearson and non-negative matrix factorization (NMF) methods. To group the samples by related gene expression profiles, cluster analyses were performed using Pearson's correlation by the average linkage method between samples and genes on the normalized data (26). NMF was employed to identify stable sample clusters. The NMF parameters were as follows: rank, k = 2 to k = 6 clusters; number of runs to build consensus matrix = 15; error function = divergence; and maximum interactions = 1000. The optimal clustering result was determined using the higher cophenetic correlation value between the clusters.
Sample classification by USC
The samples were classified by expression profiling from the normalized counts for each analyzed gene using the USC algorithm (30). This algorithm includes two steps: the training step and the test step. The aims of this algorithm are to build a “classifier” using the given training set and to use the classifier to predict the classes of the test set.
The first step, or training set, cross-validated the capability of the model to classify the samples correctly regarding the fixed reference classes of samples over a range of parameters (shrinkage threshold Δ and correlation threshold ρ). The second step involved the use of the classifier to predict the class to which the unknown samples belonged or to identify the most similar class based on phenotypic characteristics.
In this study, the data sets of the FA and IFVPTC samples were considered as the two reference classes in the training set. The test set included the NIFTP samples, for which the classes were assumed to be unknown to the algorithm. For computing purposes, a maximum Δ threshold of 10 and a minimum ρ threshold of 0.5 (correlation step 0.1) were fixed, and a 10-fold cross-validation was performed. The cross-validation was run 15 times to obtain a reliable quantification of errors. Hence, the chosen training sets were tested on the test set.
Results
Study group
A total of 62 cases were eligible for study inclusion: 18 adenomas, 18 IFVPTCs (Fig. 1A), and 26 NIFTP (Fig. 1B) (3). All cases exhibited a complete follicular growth pattern and a total absence of thyroiditis. Each tumor had >60% neoplastic cells.

(
Sample genotyping
Overall, mutations were identified in 13/26 (50.0%) NIFTPs and 10/16 (62.5%) IFVPTCs (two IFVPTCs could not be analyzed). Specifically, among the NIFTPs, the 13 mutated samples included one BRAFV600E , three BRAFK601E , six NRASQ61R , and three HRASQ61R mutations. Finally, among the IFVPTCs, the 10 mutated samples had five BRAFV600E , four NRASQ61R , and one HRASQ61R mutations.
Data normalization and sample clustering
None of the samples were excluded after data normalization. Figure 2 shows the sample clusters obtained using the entire code set without data reduction. NMF analysis showed a higher cophenetic correlation (0.9844) for rank 2 than for the two-cluster model, indicating the former to be more stable (data not shown). Specifically, by Pearson clustering, the two sample clusters showed correlations of r = 0.23 for the left-sided cluster (C1) and r = 0.30 for the right-sided cluster (C2). The C1 cluster consisted of 28 samples: 15 FAs, 11 NIFTPs, and 2 IFVPTCs. The C2 cluster consisted of a total of 34 samples: 16 IFVPTCs, 15 NIFTPs, and 3 FAs. Within the C1 cluster, one NIFTP sample harbored a HRASQ61R mutation. In contrast, in the C2 cluster, 22/34 (64.7%) samples harbored mutations. Specifically, 12/15 (80%) NIFTPs had two HRASQ61R , six NRASQ61R , one BRAFV600E , and three BRAFK601E mutations, whereas 10/14 (71.4%) IFVPTCs had one HRASQ61R , four NRASQ61R , and five BRAFV600E mutations.

Pearson unsupervised hierarchical clustering of follicular adenoma, NIFTP, and IFVPTC samples are illustrated according to gene expression levels as measured by the nCounter System (nanoString). Each column represents a single sample, and each row represents a single gene. Red indicates a high level of expression relative to the mean expression, and green indicates a low level of expression relative to the mean expression. C1 and C2 indicate the two main samples clusters. RCC is the file extension. WT indicates the absence of mutations; H Q61R indicates a HRASQ61R
mutation; N Q61R indicates a NRASQ61R
mutation; B K601E indicates a BRAFK601E
mutation; B V600E indicates a BRAFV600E
mutation; NE indicates genotype not available. Color images available online at
USC training set
The training set cross-validation generates a list of results that report the accuracy (i.e., the number of errors) of the classification and the average number of genes used for the classification, together with the shrinkage threshold (Δ) and the correlation threshold (ρ).
Briefly, the 27-gene classifier was selected because it generated the lowest number of average classification errors. Specifically, the 27-gene classifier produced 0.7 average errors (Δ = 1, ρ = 1). The following is an alphabetical list of the 27 gene symbols pertaining to the selected classifier: CITED1, CKBB, COL9A3, CSGALNACT1, DGKI, DIO1, DIO2, FN1, IPCEF1, LRP4, LRRK2, MET, NPC2, ODZ1, PROS1, QPCT, RXRG, SCEL, SDC4, SERPINA1, SLC26A4, SLC5A8, TFCP2L1, TFF3, TG, TIMP1, and TPO.
USC test set
The NIFTP samples were classified using the previously described classifier. Table 2 includes a summary of the classification results, indicating the class assigned, the discriminant score for the assignment (e.g., sample x is assigned to class k with the minimum discriminant score), and the sample genotypes. In brief, the 27-gene model classified the 26 NIFTPs as 13 IFVPTCs and 13 FAs. With regard to genotype, 11/13 (84.6%) harbored mutations in the IFVPTC group, and 2/13 (15%) had mutations at the four analyzed loci of the FA group.
DS, discriminant score; IFVPTC, infiltrative follicular variant of papillary thyroid carcinoma; NIFTP, non-invasive follicular tumor with papillary-like nuclear features; WT, wild type.
Discussion
Recently, morphological and molecular studies have redefined the diagnostic, clinical, and surgical approaches to thyroid tumors. In particular, EFVPTCs have been extensively evaluated, and considering the criteria established by Nikiforov et al., the non-invasive form of EFVPTC has been reclassified as NIFTP (13). From a molecular standpoint, follicular-pattern thyroid neoplasms are associated with RAS gene mutations (10,31,32). Furthermore, Yoo et al. reported the association between encapsulated forms of FVPTC and RAS gene family alterations (33). Nikiforov et al. demonstrated that the NIFTPs analyzed in their study harbored clonal molecular alterations (78% of the cases), with RAS mutations being the most common, thus proposing RAS-mutated NIFTPs as the putative precursors of invasive malignancies (13).
In the past decade, gene expression profiles of different thyroid lesions have been analyzed, with particular attention to the differential diagnosis between benign and malignant lesions.
In 2003, Barden et al. analyzed the gene expression signature of 10 FAs and seven follicular thyroid cancers, showing that the expression profiles of 105 genes were significantly different between benign versus malignant lesions (22). More recently, in 2010, Borup et al. analyzed global transcriptome signatures and found a strong correlation between downregulation of genes involved in growth arrest, apoptosis, and follicular carcinoma. Based on these results, a gene expression panel that represents a strong genetic signature in the differential diagnosis of FA or carcinoma has been proposed (14). In 2004, Mazzanti et al. built two panels of 10 and 6 genes able to discriminate benign from malignant thyroid tumors, although they were unable to detect significant differences among different malignant tumor subtypes (PTC and FVPTC) (17).
Interestingly, a meta-analysis by Griffith et al. identified 12 genes (MET, TFF3, SERPINA1, TIMP1, FN1, TPO, TGFA, QPCT, CRABP1, FCGBP, EPS8, and PROS1) that may form a gene panel for the differential diagnosis of thyroid tumors (20). In 2011, Vierlinger et al. conducted a meta-analysis of four microarray data sets on PTCs and nodular goiters and identified a single gene (SERPINA1) as a potent mRNA marker for PTC diagnosis with 99% accuracy (19).
More recently, a comparison of microarray expression profiles between FVPTCs and FAs was reported in 2015 by Schluten et al. (16). These authors analyzed whole-transcript arrays of six FVPTCs, seven FAs, and seven normal thyroid tissues, identifying 55 genes differentially expressed (40 upregulated and 15 downregulated) in FVPTCs versus FAs. Among the most significantly “deregulated” genes, eight (GABBR2, NRCAM, ECM1, HS6ST2, RXRG, IPCEF1, GPR155, PCP4, GRIP1) appear to be the most promising (16).
In addition, Yoo et al. reported a study including FAs, minimally invasive FCs, and PTCs (classical and follicular variant) in which gene expression analysis revealed three molecular subtypes, regardless of their histological types (non-BRAF–non-RAS, BRAF-like, and RAS-like). In the same study, the authors showed that the transcriptome of miFTCs or encapsulated FVPTCs was indistinguishable from that of FAs (33).
To date, few data are available regarding the gene expression profile of NIFTPs. Wong et al. reported an evaluation of 63 cases of Afirma GEC-suspicious thyroid nodules, previously diagnosed by fine-needle aspiration (FNA; 34/63) as atypia of undetermined significance/follicular lesion of undetermined significance (AUS/FLUS) or suspicious for follicular neoplasm (SFN; 29/63) (34). Interestingly, at histopathological follow-up, 16 cases were classified as FVPTCs, and 14 (88%) of them were eventually classified as NIFTPs. According to these results, the authors suggested that Afirma-suspicious cases (with a preoperative FNA diagnosis of AUS/FLUS or SFN) should be treated only by diagnostic lobectomy (34).
The present study investigated the expression profile of NIFTPs in comparison to those of FAs and IFVPTCs. The aim was to describe the expression signature of this new class of neoplasm by defining a list of genes that may be able to characterize it from a molecular standpoint. In particular, customized nanoString expression analysis was applied, which does not require retro-transcription or amplification.
The results revealed distinct expression profiles for FAs and IFVPTCs that resulted in the separation of cases into two clusters (C1 and C2), with only a few exceptions. The NIFTP samples were equally subdivided within the two above-mentioned clusters because half of the samples exhibited expression profiles similar to those of FAs and the other half had profiles comparable to those of IFVPTCs. Notably, the samples within the C1 cluster did not harbor mutations at the four studied loci, except for one HRASQ61R -mutated NIFTP. In contrast, the majority of the samples within the C2 cluster, including the NIFTP samples, harbored a BRAFK601E , HRASQ61R , or NRASQ61R mutation. In general, this finding is in accordance with the lower oncogenic potential and risk of malignancy of these mutations (35) than that of BRAFV600E , which has been associated with infiltrative and more aggressive tumors (36,37).
Surprisingly, in this series, a NIFTP with a BRAFV600E mutation was also found. For this reason, the case was restudied by two additional trained pathologists in an independent manner. The case was sampled in toto. The entire lesional capsule was reevaluated but appeared intact. New sections from paraffin blocks were prepared, but the tumor capsule was not infiltrated (Fig. 3). No clear papillae or wide solid areas were found. This unusual observation could be explained by taking into account two different considerations: (i) in rare cases, NIFTP could harbor a BRAFV600E mutation as a pre-infiltrative lesion; or (ii) there is an important technical limitation for pathologists with regard to the identification of capsular and/or vascular invasion, as it is essentially impossible to evaluate the tumor capsule completely (1,38).
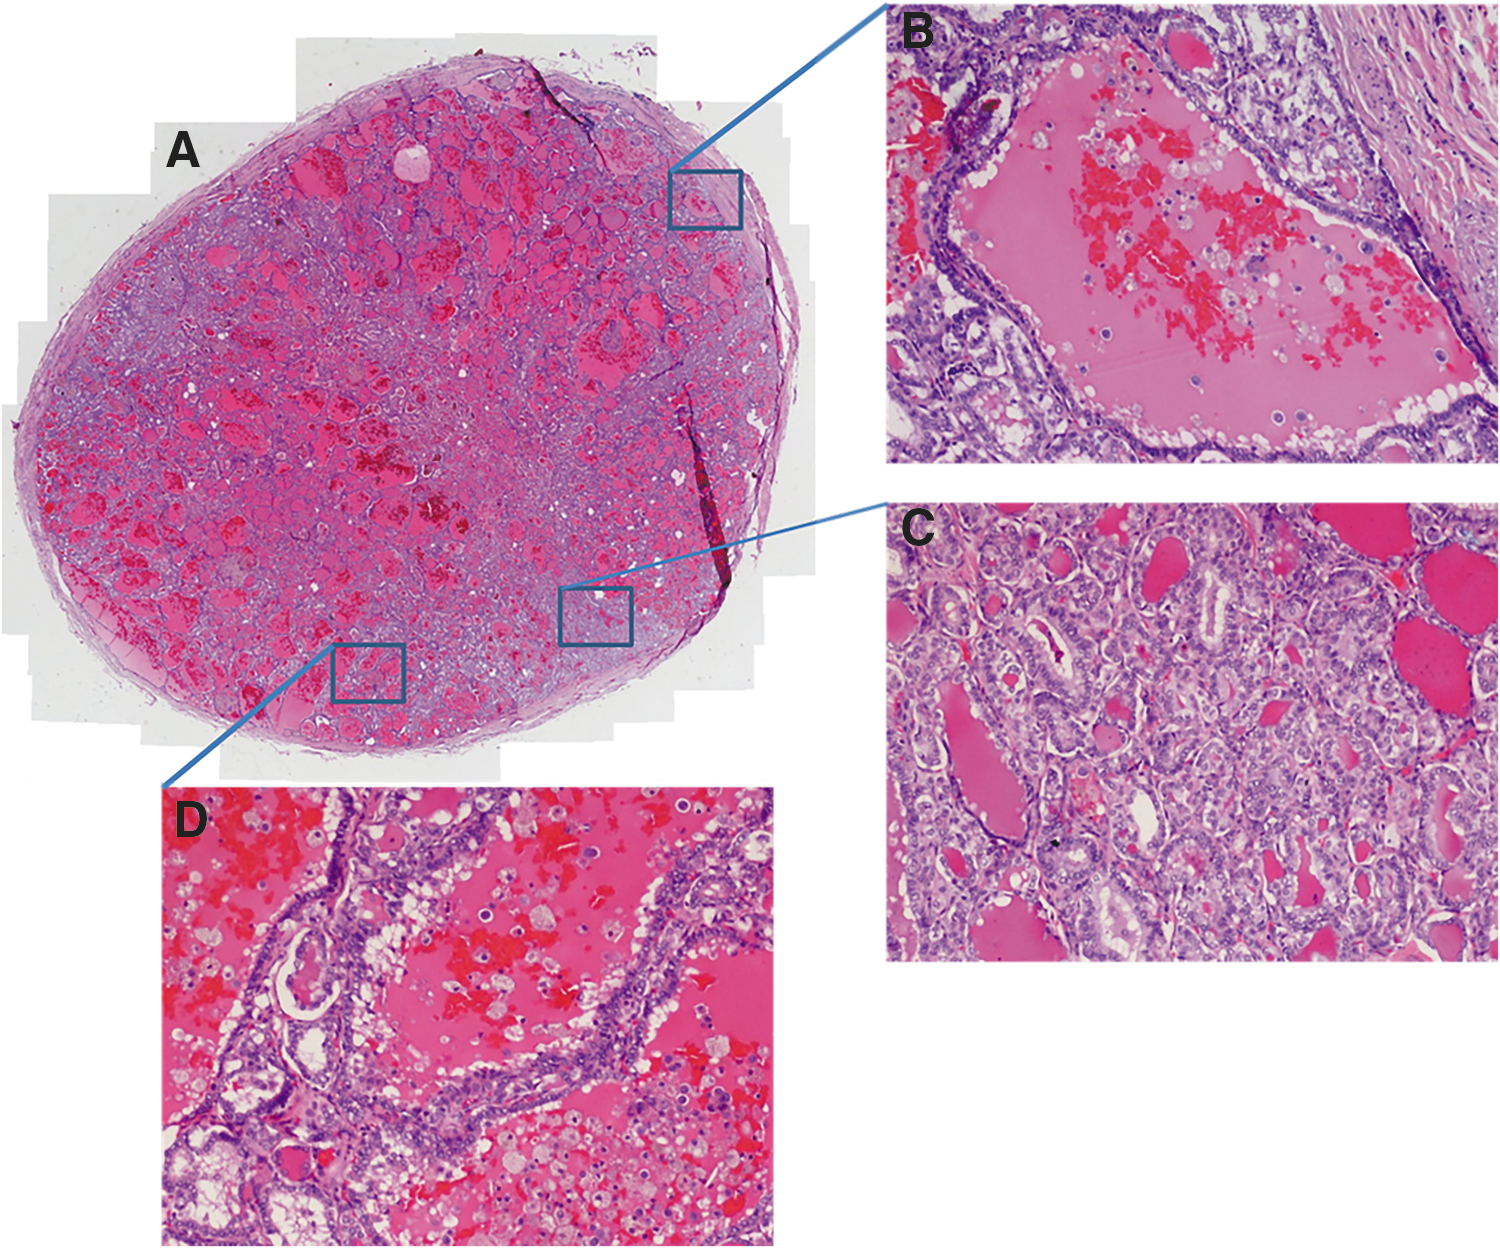
NIFTP harboring a BRAFV600E
mutation. (
Once the genetic and mRNA heterogeneity of NIFTPs was apparent, an attempt was made to validate the results further with a machine-learning classification approach using the USC algorithm (30). This algorithm allows the identification of small subgroups of genes and is capable of discriminating between classes without making any preliminary assumptions from the data. In this manner, a 27-gene classifier was chosen because of its good performance on the training set of samples. Next, the study tested the NIFTP (test) set and the 27-gene classifier, which assigned 50% of NIFTPs as IFVPTCs and 50% of NIFTPs as FAs. Therefore, 13 NIFTPs were classified as IFVPTCs by a molecular/statistical tool. Furthermore, the majority (84.64%) of the IFVPTC-assigned samples were mutation positive.
As reported in the study by Nikiforov et al. (13) in which NIFTPs with mutations in BRAF, RAS, or other genes were considered precursors of infiltrative lesions, the present data support that mutated NIFTPs also exhibit a likely malignant expression profile (NIFTP-LM). These data reinforce the hypothesis that they might represent a precursor of IFVPTC. In contrast, wild-type NIFTP with an adenoma-like gene expression profile (NIFTP-LA) might represent the so-called benign counterpart of these neoplasms (Fig. 4).
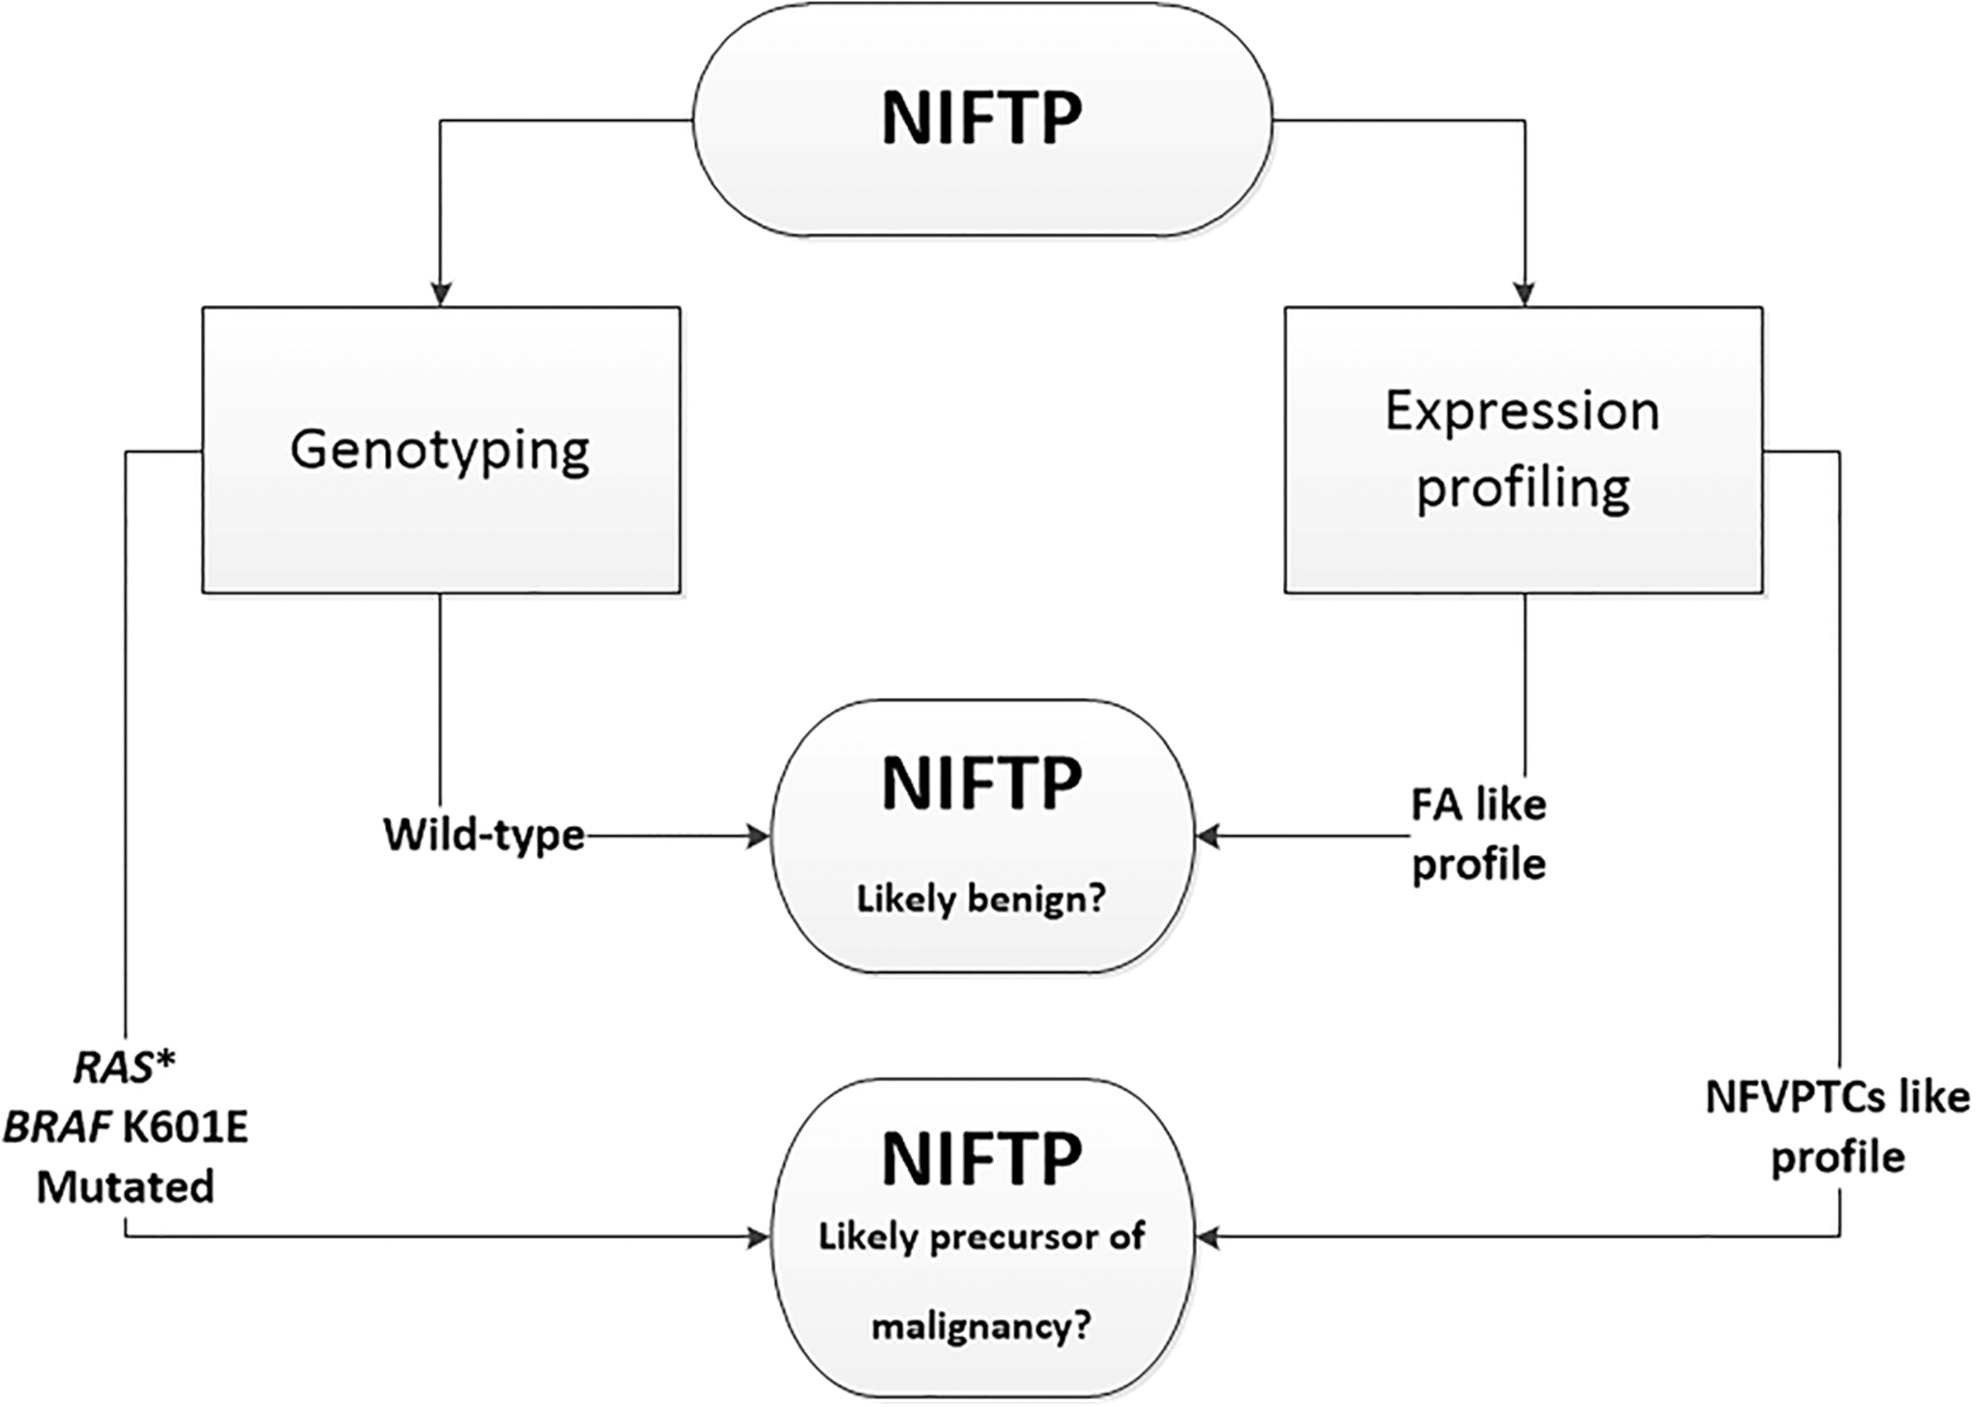
Schematic representation of putative “molecular classification” of NIFTP.
From a pragmatic standpoint, these results could be prospectively applied in clinical practice, with particular regard to presurgical FNA biopsy. In fact, it is widely accepted that NIFTPs cannot be identified with certainty by FNA cytology because their nuclear features are quite similar to those of IFVPTC (39).
In conclusion, it is suggested that this classifier, in addition to a genotyping analysis (34), could be used for nodules with indeterminate diagnoses by cytology to obtain additional data that might be useful for the diagnostic and prognostic characterization of these tumors. In fact, because of the benign clinical behavior of NIFTPs, preoperative recognition of these neoplasms would have important implications for the therapeutic and surgical strategies employed to avoid patient overtreatment (39,40).
Footnotes
Acknowledgments
This work was supported by AIRC (grant no. 549999_AIRC_IRG_10316_2013_Basolo); the University of Pisa (grant no. PRA_2016_19); and MIUR (Italian Ministry of Education, Universities and Research; PRIN no. 2015HPMLFY_003). Language assistance was provided by American Journal Experts.
Author Disclosure Statement
No competing financial interests exist.