
Abstract
Background:
The possibility that the intrinsic genomic activity of thyroxine (T4) is of physiological relevance has been frequently hypothesized. It might explain gene expression patterns in the brain found in type 2-deiodinase (Dio2)-deficient mice. These mice display normal expression of most thyroid hormone–dependent genes, despite decreased brain triiodothyronine (T3).
Methods:
The relative effects of T4 and T3 on gene expression were analyzed in mouse neuro-2a (N2a) cells stably expressing the thyroid hormone receptor α1, and in primary mouse cerebrocortical cells enriched in astrocytes or in neurons. Cortical cells were derived from Dio2-deficient mice to prevent conversion of T4 to T3. T4 and T3 were measured in the media at the beginning and end of incubation, and T4 and T3 antibodies were used to block T4 and T3 action.
Results:
In all cell types, T4 had intrinsic genomic activity. In N2a cells, T4 activity was higher on negative regulation (1/5th of T3 activity) than on positive regulation (1/40th of T3 activity). T4 activity on positive regulation was dependent on the cell context, and was higher in primary cells than in N2a cells.
Conclusion:
T4 has intrinsic genomic activity. Positive regulation depends on the cell context, and primary cells appear much more sensitive than neuroblastoma cells. In all cells, negative regulation is more sensitive to T4 than positive regulation. These properties may explain the mostly normal gene expression in the brain of Dio2-deficient mice.
Introduction
M
The biological activity of T4 through non-genomic pathways is recognized in some in vitro assays (3), but direct actions through the nuclear receptor pathway have not been totally discarded. A recent article provides an extensive historical review on this topic (4). An indirect action of T4 through the TR not involving binding but post-translational modifications was proposed in the modulation of MAPK-dependent TR phosphorylation and activity (5). It has also recently been described that TR activity might be modulated by T4 by binding directly to the TR but to sites located on the surface of the TR and different from the T3 binding pocket (6).
Additionally, a few studies in the past have addressed the question of whether T4 has intrinsic genomic activity mediated by the TR and similar to that exerted by T3. Surks and Oppenheimer (7) found that of the total TH present in rat liver nuclei, 87% was in the form of T3 and 13% in the form of T4, and they concluded that T4 might contribute up to 15% of the effects of TH in vivo. Samuels et al. (8) showed that T4 increased growth hormone synthesis in cultured GH1 cells with a potency of 1/10th relative to T3, which correlated with their relative affinities for the TR. Bogazzi et al. (9) found that T4 was able to stimulate or inhibit the activity of reporter genes under the control of positive or negative T3 responsive elements, respectively. More recently, Sandler et al. (10) re-examined this question and found that when T4 binds to the TR, the T4–TR complex adopts a conformation different to that of the T3–TR complex in some respects. In cultured cells, T4 had about 1/10th the activity of T3, with somewhat higher activity through TRα than through TRβ (10). Direct T4 activity on gene expression has also been claimed in cultured preosteoblasts (11) and in premetamorphic tadpoles (12).
It is clear therefore that T4 has a relatively weak TR agonistic activity in comparison to T3. The question is whether in certain pathophysiological settings this weak T4 activity might compensate at least partially for T3, or even modulate T3 action. One clear example is the situation present in the Dio2 knockout (KO) mice (13). Despite the importance of Dio2 in generating local T3 from T4 in the brain, the KO mice only present subtle behavioral alterations. In these mice, the brain T3 concentrations are in the range of hypothyroid mice, but the patterns of gene expression are not the same as in hypothyroidism. It might be possible that the increased brain T4 concentrations in the Dio2 KO mice contribute to the maintenance of normal gene expression patterns (14,15).
The question of whether the weak T4 agonistic activity is physiologically relevant has remained unsettled for several reasons. One is the possibility of small but significant contamination of the T4 with T3, and another is the possibility of uncontrolled conversion of T4 to T3 in the experimental systems used to analyze T4 activity. The present study compared the effects of T3 and T4 on gene expression in primary cerebrocortical cells and in the N2a mouse neuroblastoma cell line expressing TRα1. The primary cells were derived from mice deficient in type 2 deiodinase (Dio2 KO mice) (13). The amounts of T4 and T3 present at the start and the end of the experiments were carefully measured by radioimmunoassay. In addition, T4 and T3 antibodies were used to block the effects of the hormones. The results indicate that the relative activity of T4 compared to T3 is unexpectedly high on negatively regulated genes. On the positively regulated genes, the activity of T4 appears dependent on the cell type, a finding that is in agreement with other groups (16).
Methods
Cell cultures
N2a mouse neuroblastoma cells expressing the chicken TRα1 isoform (clone CA3) (17) were seeded in six-well plates with Dulbecco's modified Eagle's medium (DMEM) containing 10% fetal calf serum (FCS) deprived of TH (18) and grown until 80% confluence. The cells were washed and incubated in DMEM containing 0.1% TH-deprived serum in the presence of the indicated concentrations of T4 or T3. Homozygous Dio2 KO mice (13) and wild-type (WT) mice were used for the studies on primary cerebrocortical cultures.
Primary cultures were established from mouse cerebral cortex. Protocols for animal handling were approved by the local institutional Animal Care Committee, according to European Union rules. Neuron-enriched cultures were established from embryonic day 17.5 (E17.5) cerebral neocortex as described (19,20) in poly-L-ornithine-coated (Sigma–Aldrich) 12-well plates (Costar®). The cells were first incubated for 9 days at 37°C under 5% CO2 in NB medium (Neurobasal®, Gibco® Thermo Fisher Scientific) containing 2% B27® (Gibco® Thermo Fisher Scientific), supplemented with glutamine and antibiotics. Since B27® contains T3 (21), the cells were washed with NB medium and incubated in the absence of B27® 24 h before adding the hormones. Astrocyte-enriched cultures were established from P3 mice. The cerebral cortices were disaggregated in culture medium (DMEM containing 10% FCS deprived of TH, and supplemented with glutamine and antibiotics). After 5 min of centrifugation at 150 g, the pellet was suspended in culture medium. The cells were cultured for 7 days in poly-L-ornithine-coated wells (Costar®). Then, the cells were washed in DMEM with 10% or 0.1% serum before adding the hormones.
T4 and T3 solutions
Starting solutions of 1 mg/mL of T4 (sodium salt pentahydrate, cat # T2501; Sigma–Aldrich) or T3 (sodium salt, cat # T6397; Sigma–Aldrich) were prepared in 5 mM of NaOH and diluted in culture medium containing 0.1% of newborn calf serum deprived of TH (18). Cells were harvested 24 h after addition of the hormones. The cells were lysed to isolate RNA and for gene expression quantification by quantitative polymerase chain reaction (qPCR) as described (19,20). The medium was used for T4 and T3 determinations by radioimmunoassay (RIA) (22,23). The sensitivity limit of the RIA was 0.01 nM. T3 was also measured in aliquots of 10 and 100 nM of T4, giving 0.01 and 0.12 nM of T3, respectively. Therefore, the T4 solution provided a maximum of around 0.12% T3.
Cross-reactivity of T4 and T3 antibodies
To analyze the specificity of T3 and T4 actions, the cells were incubated in the absence and presence of highly specific T3 and T4 antibodies raised in rabbits using T4, and T3 ethyl-esters conjugated to bovine serum albumin as antigens (provided by Henning Berlin). The validation and cross-reaction of these antibodies were reported previously (24). The T3 and T4 antibodies gave 1% cross-reactivity at the dilutions used in the RIA (1:315,000 for T3 and 1:75,000 for T4). However, to inhibit the action of T4 or T3 at the concentrations used in the cultures, it was necessary to employ much higher concentrations: 1:200 for the T4 antibody and 1:500 for the T3 antibody. The amount of antibody-bound hormone and the cross-reactivity were measured at concentrations of 1 nM of T4 and 0.5 nM of T3 in the presence of radioactive tracers (in vitro labeled 125I-T4 or 125I-T3, SA >3.000 μCi/μg) under the incubation conditions used to analyze hormone activity. The T3 antibody bound 86% of the T3 present in the medium, and cross-reactivity with T4 was 30%. With the T4 antibody, 71% of the T4 was complexed, and cross-reactivity with T3 was 27%. These data were used to estimate the amounts of T4 and T3 remaining in the unbound form in the presence of the antibodies.
Real-time PCR
Two hundred and fifty nanograms of RNA was used as template for cDNA synthesis with the high-capacity cDNA reverse transcription kit (Applied Biosystems). QPCR assays were performed using TaqMan probes (Applied Biosystems) on a 7900HT fast real-time PCR system. The PCR program consisted in a hot start of 95°C for 10 min, followed by 40 cycles of 15 s at 95°C and 1 min at 60°C. For analysis, the 2-Ct method was used. As internal control, 18 S RNA was included. Data were expressed relative to the values obtained for the control cells, which was given a value of 1.0 after correction for 18S RNA. One-way analysis of variance with Tukey or Dunnet post hoc tests was used to calculate statistical significance. Calculations were done using GraphPad Prism software.
Results
Relative activities of T4 and T3 in TRα1-expressing N2a mouse neuroblastoma cells
To compare T4 and T3 activity in a homogeneous cell preparation, N2a neuroblastoma cells expressing the T3 receptor TRα1 subtype were used. These cells have low Dio2 expression and no expression of Dio1 or Dio3 ((14) and the authors' unpublished transcriptomic data). To analyze the effects of increasing T4 and T3 concentrations, several genes regulated positively or negatively by T3 were selected based on previous transcriptomic analysis of N2a performed in the authors' laboratory (unpublished). These included Hr, Flywch2, and Fxyd6 as positive genes, and Rgs4, Zcchc12, and Nrp1 as negative genes. Hr was very sensitive to T3 in the N2a cells, with an almost 150-fold induction (Fig. 1). The half-maximal effect of T3 was achieved at around 0.5 nM. T4 was much less active, with no effect below 1 nM, and the half-maximal effect around 20 nM, 1/40th the activity of T3. Identical results were obtained for Flywch2 and Fxyd6 (Supplementary Fig. S1A and B; Supplementary Data are available online at
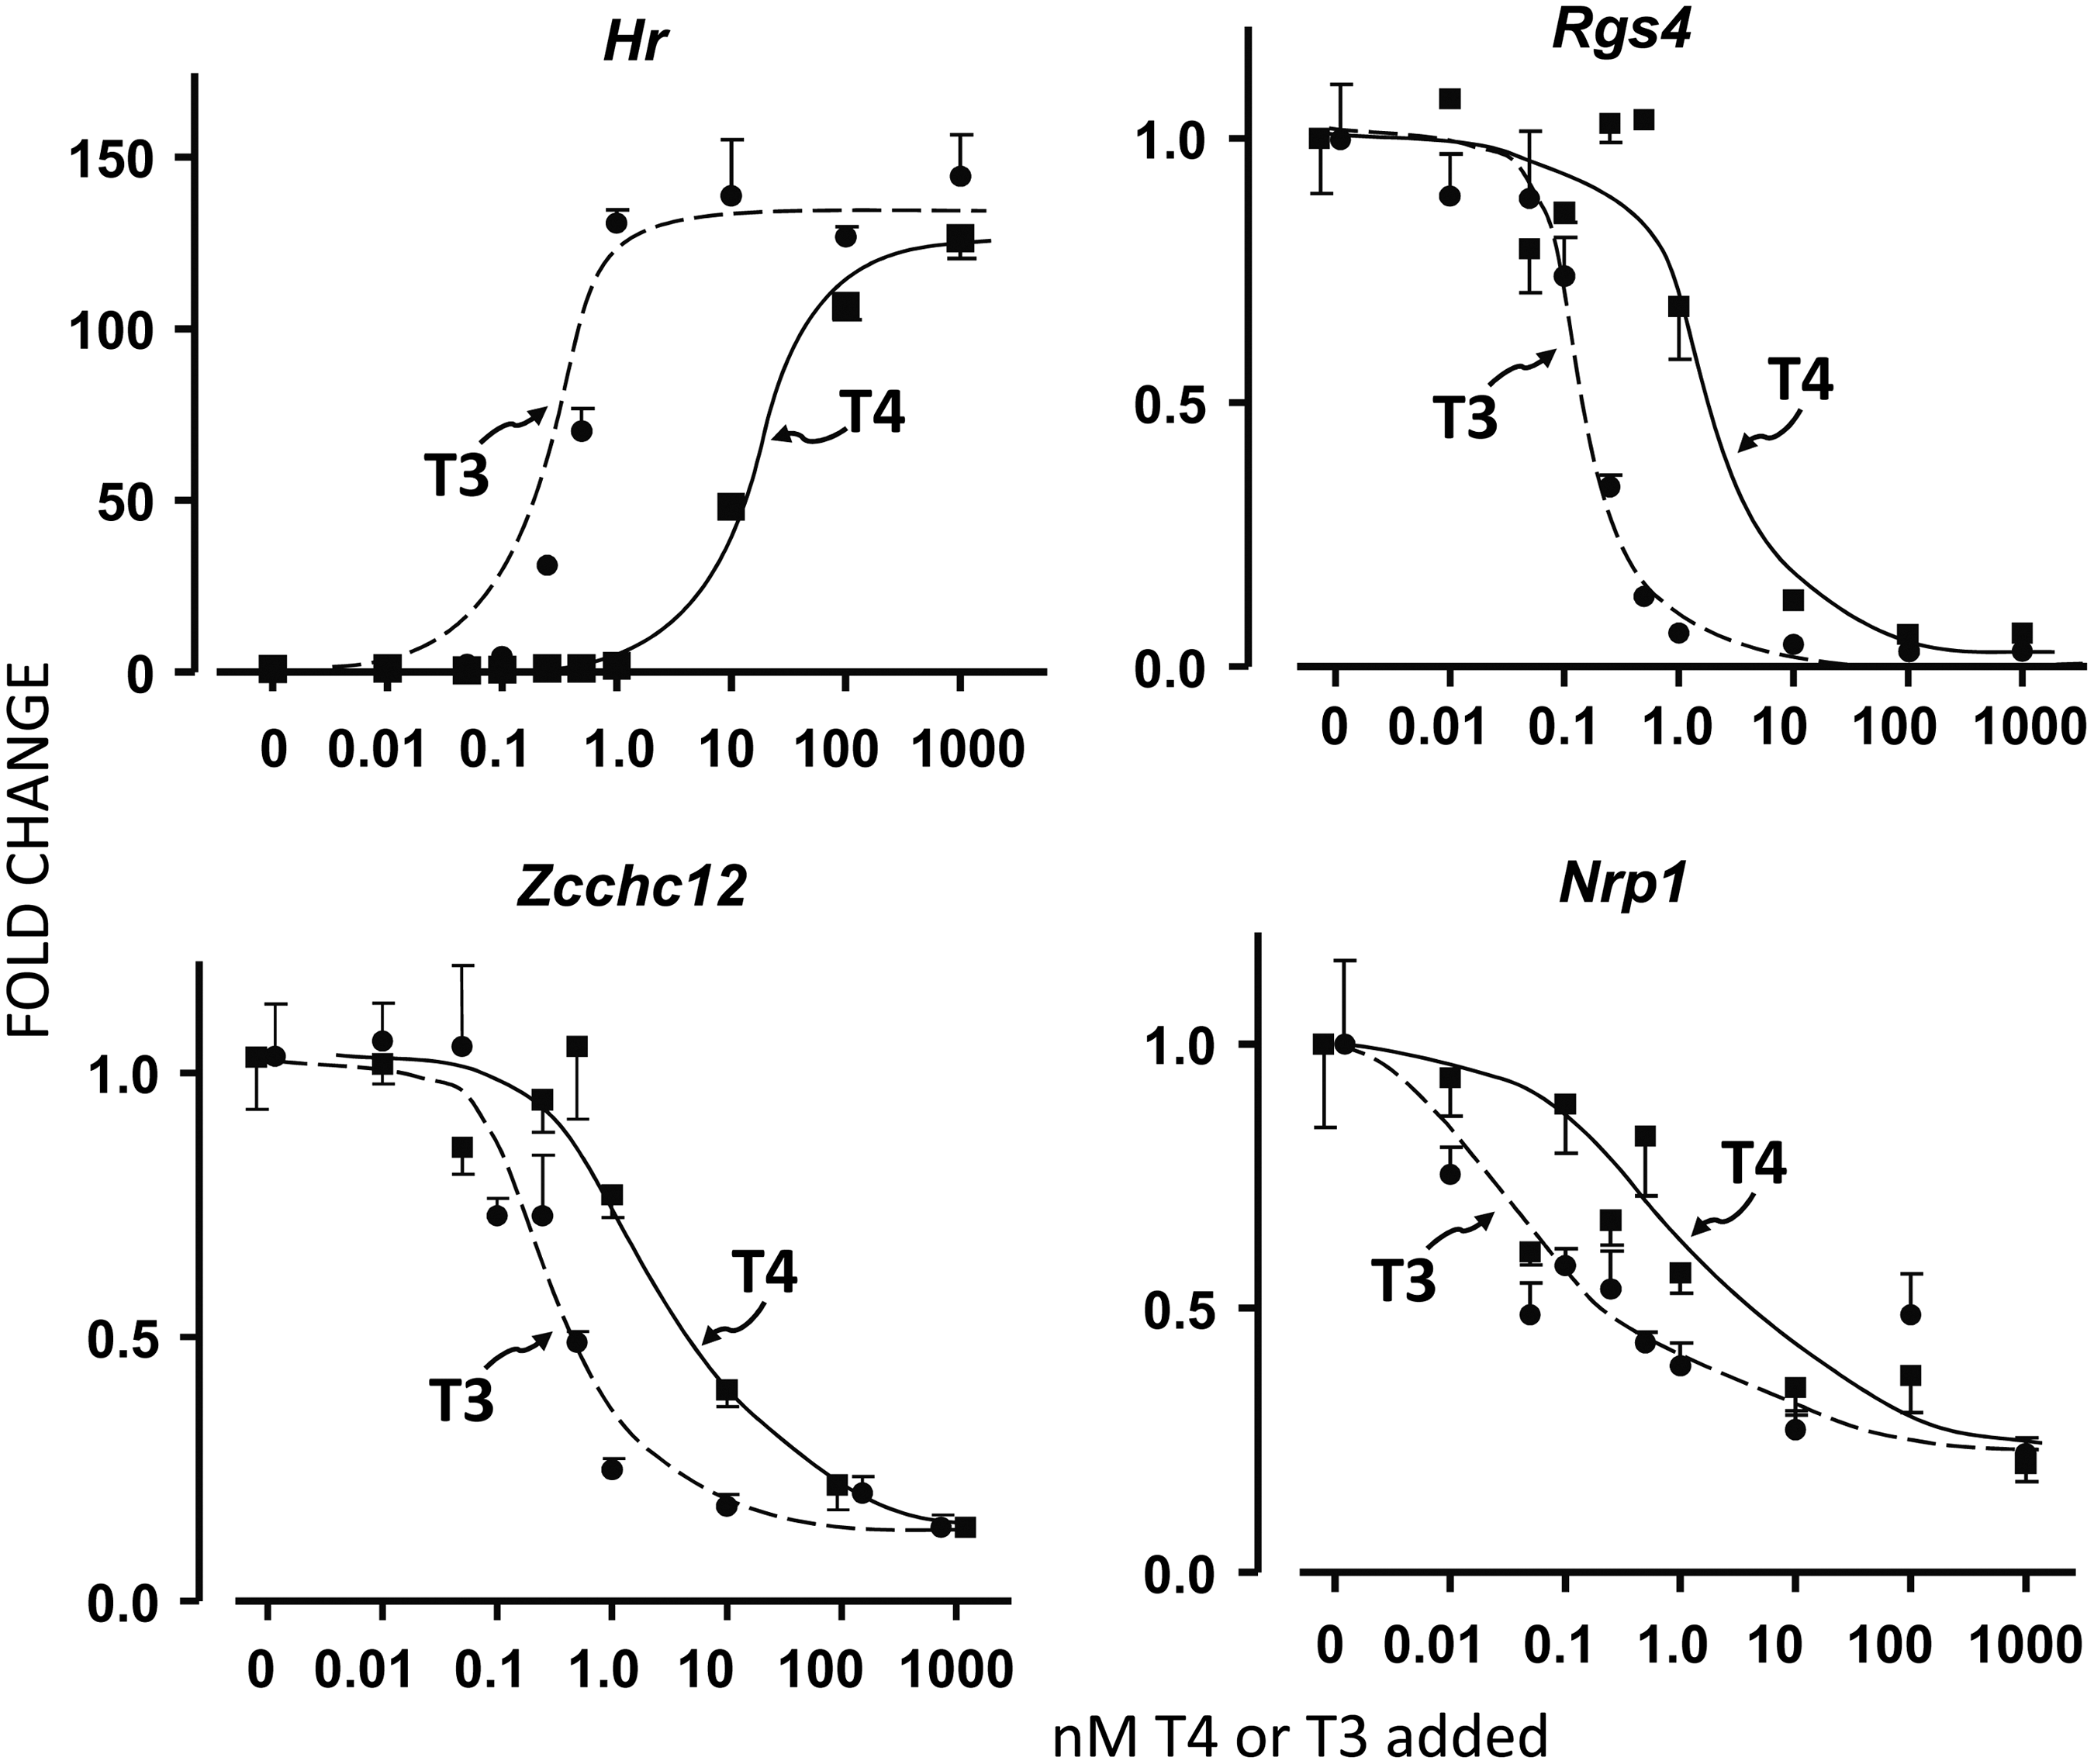
Effects of thyroxine (T4) and triiodothyronine (T3) on positive (Hr) and negative (Rgs4, Zcchc12, Nrp1) regulation in N2a mouse neuroblastoma cells expressing the TRα1 receptor subtype. Cells were incubated in the presence of the indicated concentrations of T4 and T3 for 24 h in the presence of 0.1% thyroid hormone–depleted newborn calf serum. Each point is the mean ± standard error (SE) of triplicate determinations.
T4 and T3 action in primary cerebrocortical cultures
To analyze T4 and T3 actions in a cellular system more representative of physiological settings, primary cerebrocortical cells were used that were enriched in astrocytes or in neurons. To compare T4 and T3 activity in the presence and absence of Dio2 activity, primary astrocytes were used, which are cells highly enriched in Dio2, from P3 mouse brain. As a TH target, the expression of Aldh1a1, a gene expressed in astrocytes sensitive to TH in vivo and in vitro, was measured. In WT astrocytes and in the presence of 10% serum (Fig. 2A), 1 nM of T3 increased Aldh1a1 expression by 3.2-fold and 1 nM of T4 by twofold. The effect of T4 could be due to Dio2-mediated deiodination to T3. In astrocytes derived from Dio2 KO mice in the presence of 10% serum (Fig. 2B), 1 nM of T3 increased Aldh1a1 by 2.9-fold, whereas 1 nM of T4 had no effect. In these cells, 100 nM of T4 had a similar effect as 1 nM of T3. Therefore, the lack of T4 to T3 conversion strongly inhibited the action of T4, as did the presence of serum, because the free T4 fraction is roughly 10-fold lower than the free T3 fraction under similar incubation conditions (22,23). In Dio2 –/– astrocytes incubated in 0.1% serum, Aldh1a1 was induced 7.5-fold by 1 nM of T3 and 5.5-fold by 1 nM of T4. Proper comparisons of the relative activity of T4 versus T3 cannot be made because the effect of 1 nM of T3 is probably not at its maximum, but the result of these experiments indicate that the observed effect of T4 at the relatively low concentration of 1 nM is intrinsic to T4, and at a concentration that may be considered within a physiological range.
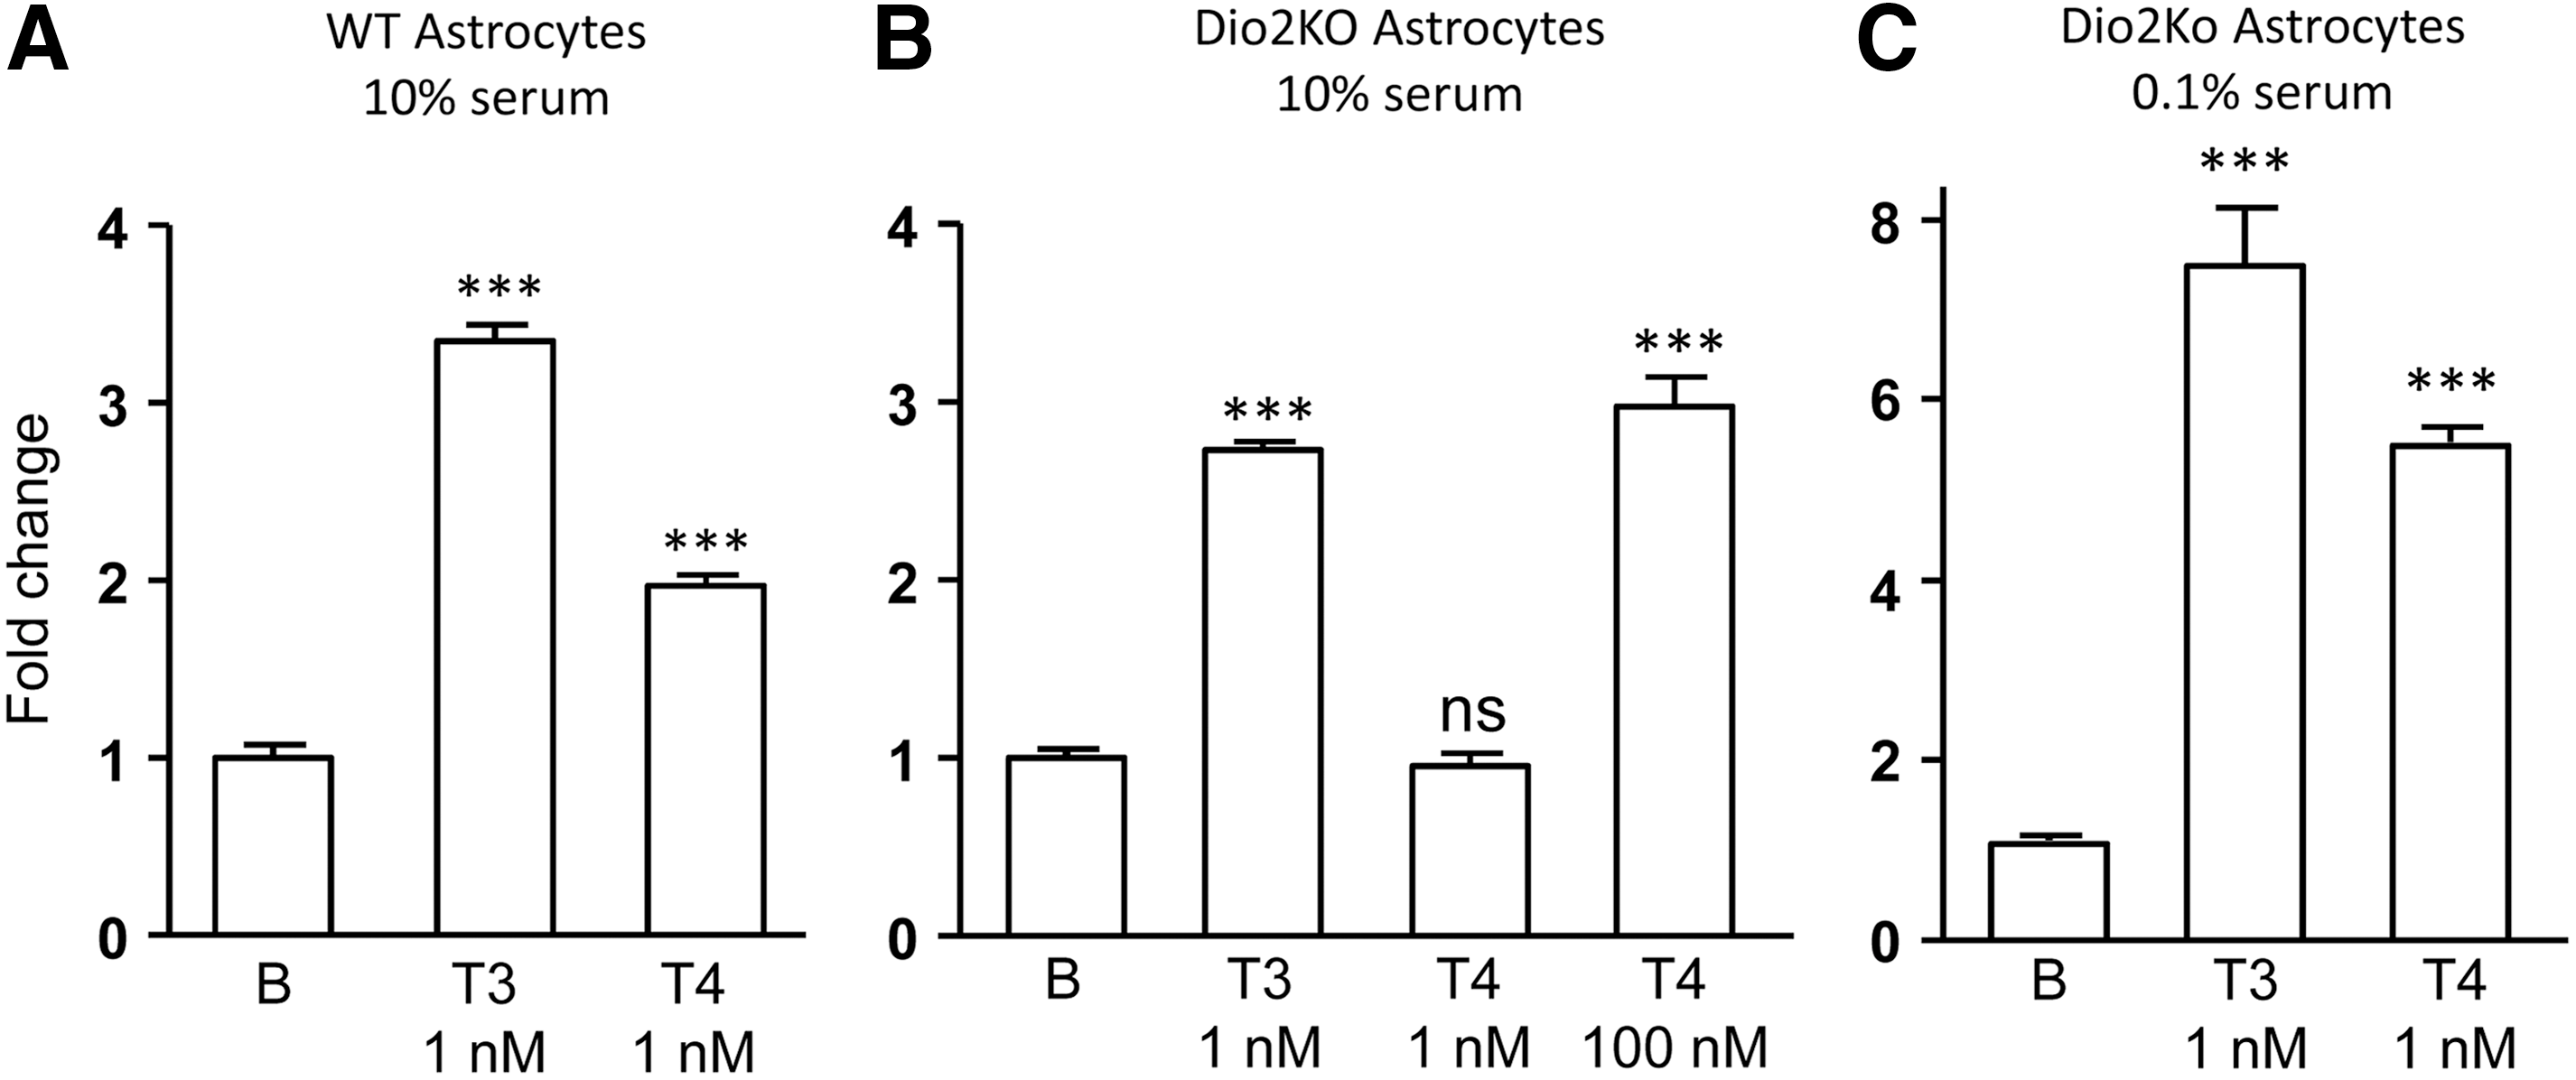
Effects of T4 and T3 on Aldh1a1 expression in primary cerebrocortical astrocytes isolated from P3 wild-type (WT) mice
These experiments indicated that in the astrocytes, T4 was more active than in the neuroblastoma cells on positive regulation, since 1 nM of T4 was without effect on Hr induction in the N2a cells, whereas it elicited almost a similar effect as T3 on Aldh1a1 in the primary astrocytes. This could be due to uncontrolled conversion to T3, even in cells not expressing Dio2, or to different relative sensitivities of astrocytes and neurons to T4 and T3. For these reasons, T4 and T3 activity was examined in cerebrocortical cells enriched in neurons, isolated from E17.5 Dio2 –/– mice. The objective of this experiment was to correlate T4 and T3 effects on gene expression with the real concentrations of T4 and T3 in the culture medium, and to check the effects of specific T4 and T3 antibodies. Cells were incubated with T4 or T3 at predicted final concentrations of 0.9 nM and 0.5 nM, respectively. The actual hormone concentration present in the medium was measured by RIA at the start and the end of incubation (Fig. 3 and Table 1). The medium of cells incubated with T3 contained 0.48 nM of T3 at the start and 0.27 nM of T3 at the end of incubation. The medium of cells incubated withT4 contained 0.93 nM of T4 at the start and 0.58 nM of T4 at the end of incubation. T3 was also measured in the cells incubated with T4 to account for the presence of artificially produced or contaminating T3. At the end of the incubation, T3 in the medium from the cells incubated with T4 was 0.02 nM (M ± SD = 0.017 ± 0.003 of four different wells). These measurements indicated that during incubation, there was degradation of 34% T4 and 44% T3, probably due at least in part to the Dio3 expressed by the neurons. The T3 concentration present in the medium of cells incubated with T4 was slightly higher than the contaminating T3, indicating some artificial generation of T3 during incubation.
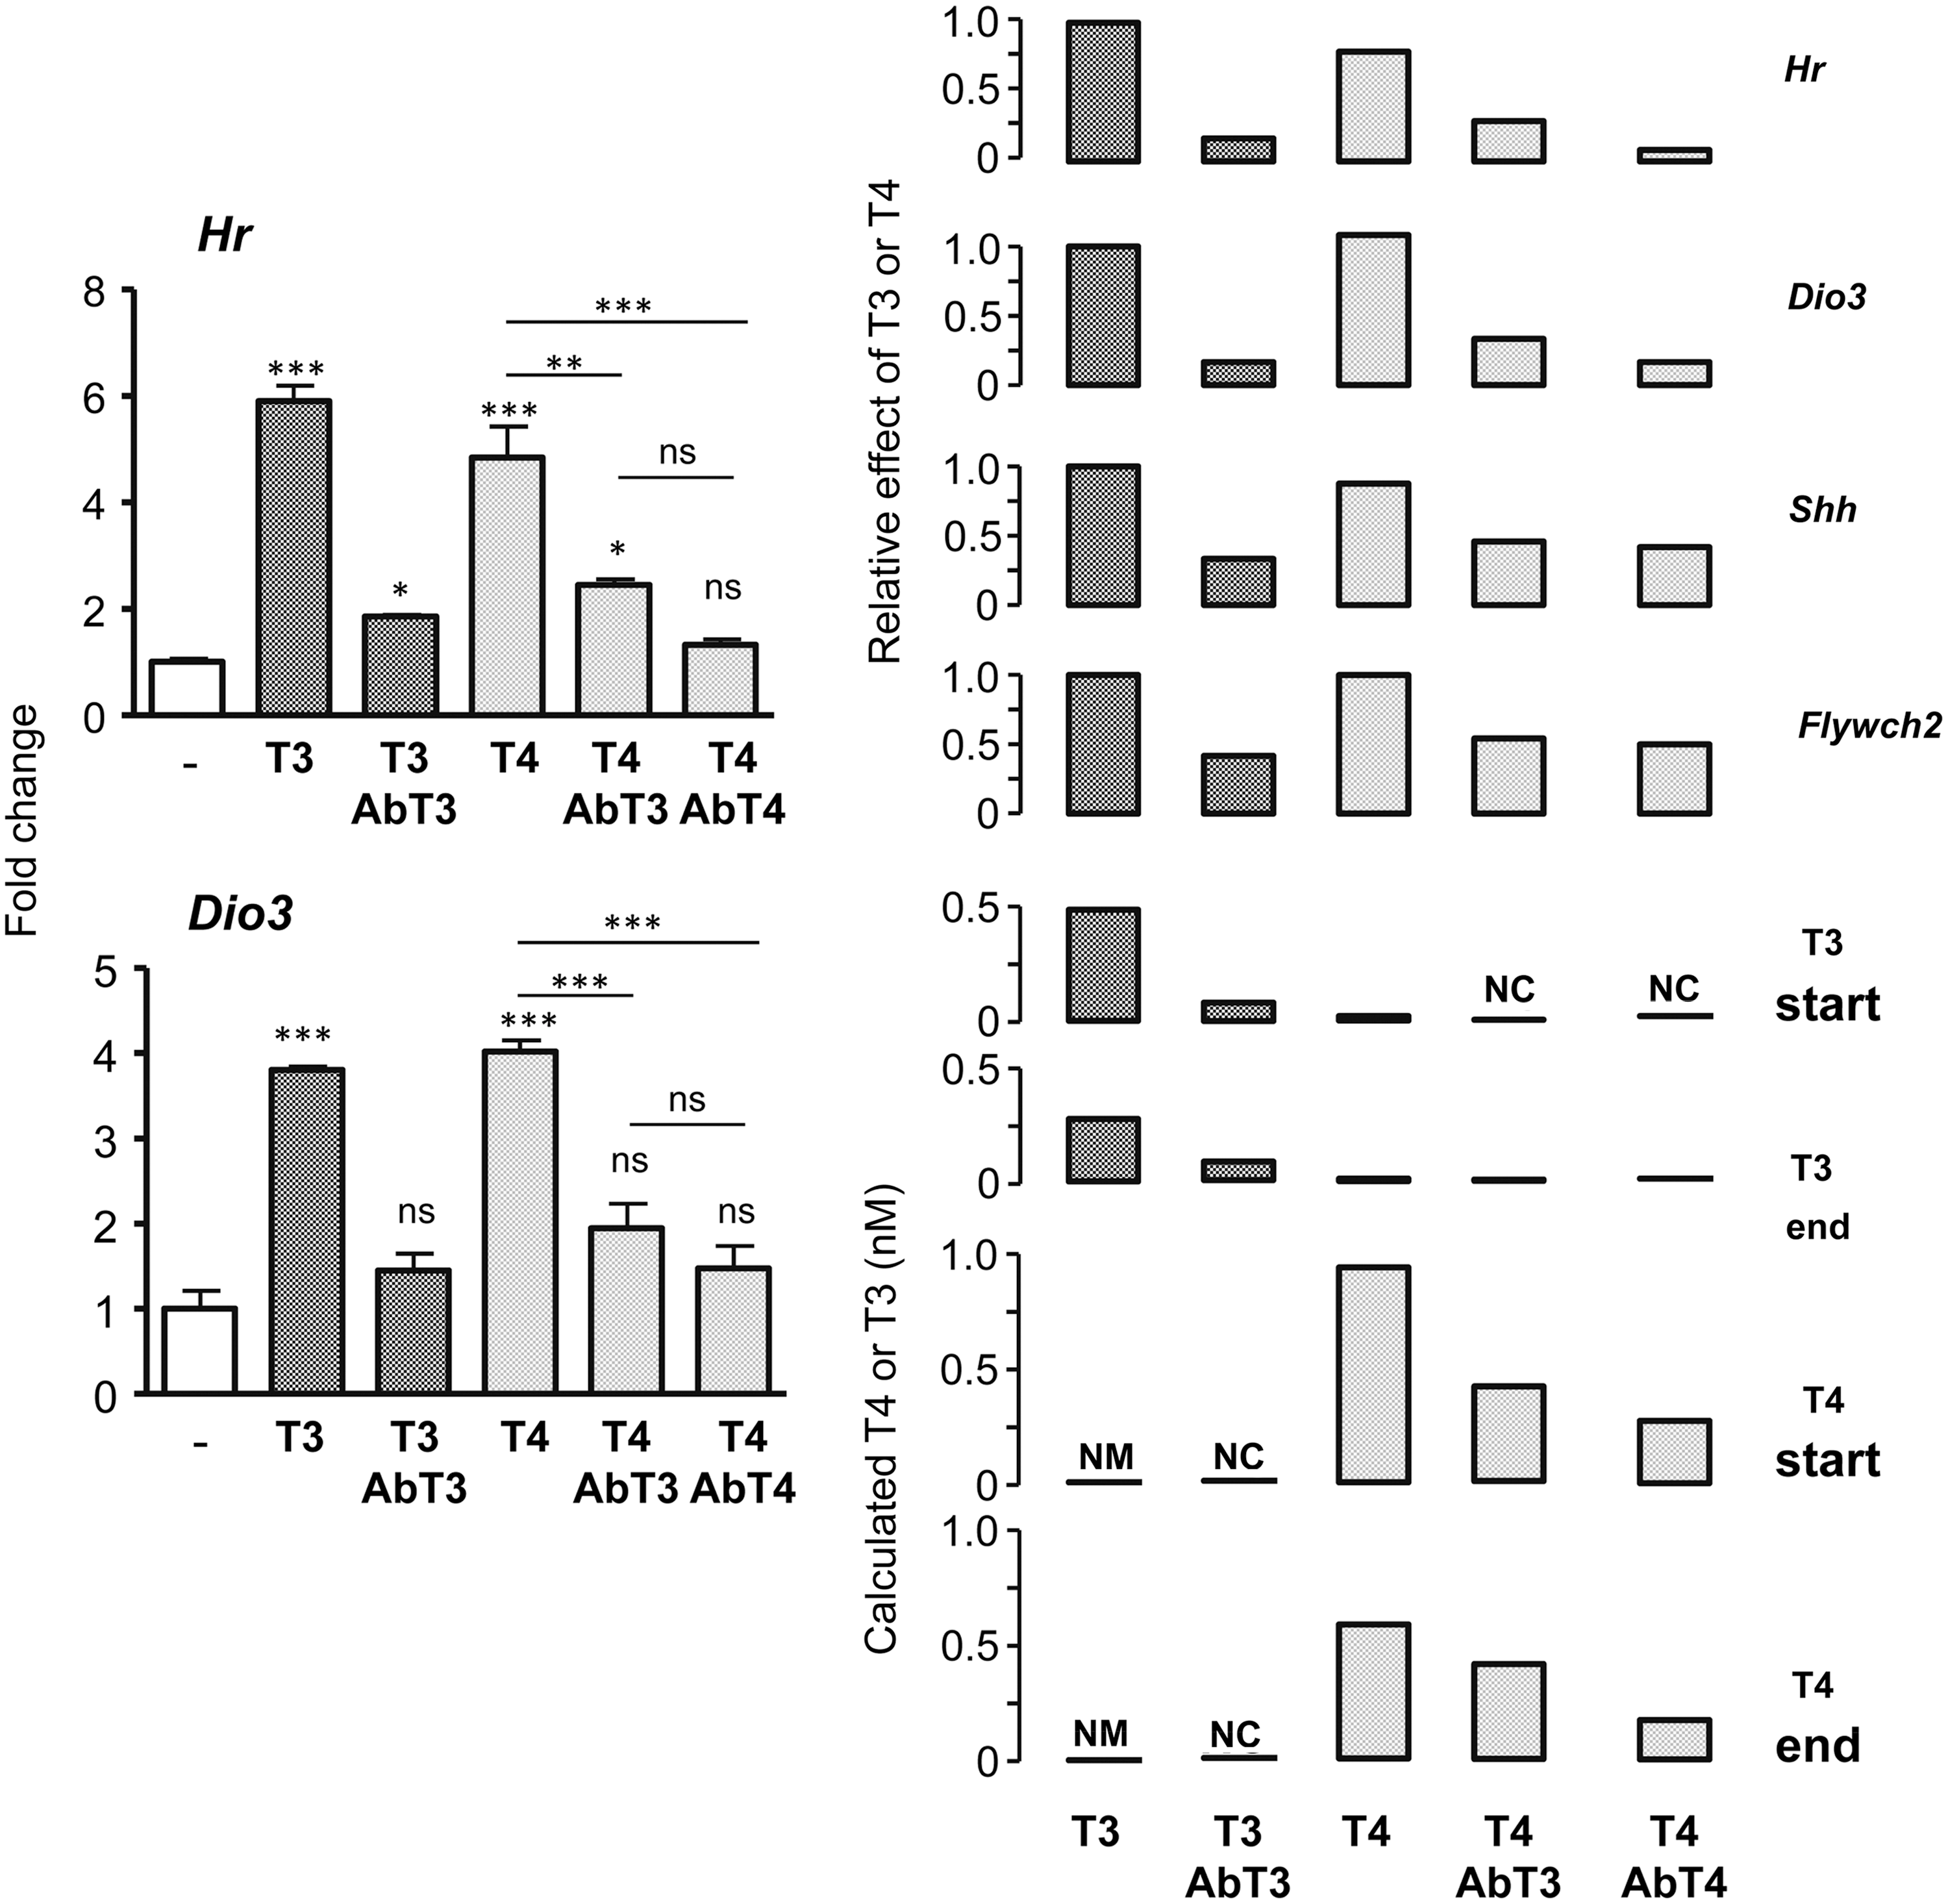
The left panels show the effects of T4 and T3 in the absence or presence of T4 or T3 antibodies on Hr and Dio3 expression. Neuron-enriched cerebrocortical cells from E17.5 Dio2 KO mice were incubated for 24 h in the presence of T4 and T3, and in the absence or presence of T4 and T3 antibodies. The right panel shows the relation between the starting and final concentrations of T4 and T3 shown in Table 1 and the effects on Hr, Dio3, Shh, and Flywch2. Statistical comparisons were by one-way ANOVA. Comparisons were between selected samples as indicated or against the samples without hormone when not indicated. *p < 0.05; ***p < 0.001.
The concentrations of T4 and T3 at the start and the end of incubation in the absence of antibodies were measured in quadruplicate by RIA. Concentrations in the presence of the antibodies were calculated as explained in methods.
T3, triiodothyronine; T4, thyroxine; NM, not measured; NC, not calculated; RIA, radioimmunoassay.
The effects of T3 and T4 on gene expression are shown in Figure 3 for two genes transcriptionally regulated by T3: Hr and Dio3. Two other genes were also measured—Shh and Flywch2—with essentially the same results, but with lower sensitivity to T4 and T3, and these are shown in Supplementary Fig. S1D. Hr expression was increased sixfold by T3 and 4.8-fold by T4. Dio3 was increased 3.7-fold by T3 and fourfold by T4. To check further for hormonal specificity, cells were also incubated with the same amounts of hormones and specific antibodies. A correlation between the T3 and T4 concentrations is shown in Table 1, and the effects on gene expression are shown in Figure 3 (right panel). The presence of the T3 and T4 antibodies inhibited the effects of T3 and T4, respectively.
Focusing on the Hr and Dio3 targets, the T3 antibody decreased the effect of T3 on Hr by 84% and on Dio3 by 81%. The calculated concentration of uncomplexed T3 in the presence of the antibody was 0.08 nM (Table 1). In the presence of the T4 antibody, the effect of T4 was inhibited by 89% (Hr) and 84% (Dio3). The T4 effect was also inhibited by the T3 antibody, most likely due to cross-reactivity. Alternatively, the T3 antibody could have complexed any T3 present in the T4 sample. There was a maximum of 0.001 nM of T3 (0.12% of T4, as indicated in the Methods), an amount that is very unlikely to account for the observed effect of T4. The concentrations of uncomplexed T4 in the presence of the T3 antibody would be 0.65 nM, and in the presence of the T4 antibody the concentrations would be 0.27 nM (Table 1). These results also supported an intrinsic effect of T4 on gene expression at concentrations <1 nM.
Comparison between positive and negative regulation by T4 and T3 in primary cerebrocortical cells
The results suggest that T4 might be more active on positive regulation in the cerebrocortical cells than in the neuroblastoma cells, and that this might have physiological meaning explaining the observations in the Dio2 KO mice indicating that positive regulation is dependent on the cell context. To compare the effect of T4 on positive and negative regulation in the cerebrocortical cells, the effect of T4 on Hr and Flywch2 and on the negatively regulated genes Rgs4 and Nr4a3 (Fig. 4) was analyzed. All these genes are regulated by T3 at the transcriptional level (20). The effect of T3 on Hr was significant beginning at 0.05 nM, with a twofold increase in expression. Flywch2 was less sensitive, with no effect of T3 at 0.05 nM, and a 2.5-fold increase at 1 nM. T4 was not active on these genes at 0.05 nM, and at 1 nM, T4 had 25% of T3 activity on Hr and 57% on Flywch2. In terms of negative regulation, T3 was also effective at 0.05 nM on Rgs4 and Nr4a3. The effect of 0.05 nM of T4 on Rgs4 was not significant, and at 1 nM, it had 75% of T3 activity. On Nr4a3, 0.05 nM of T4 caused a 30% decrease that was not significant, and at 1 nM, it had 85% of the activity of T3.
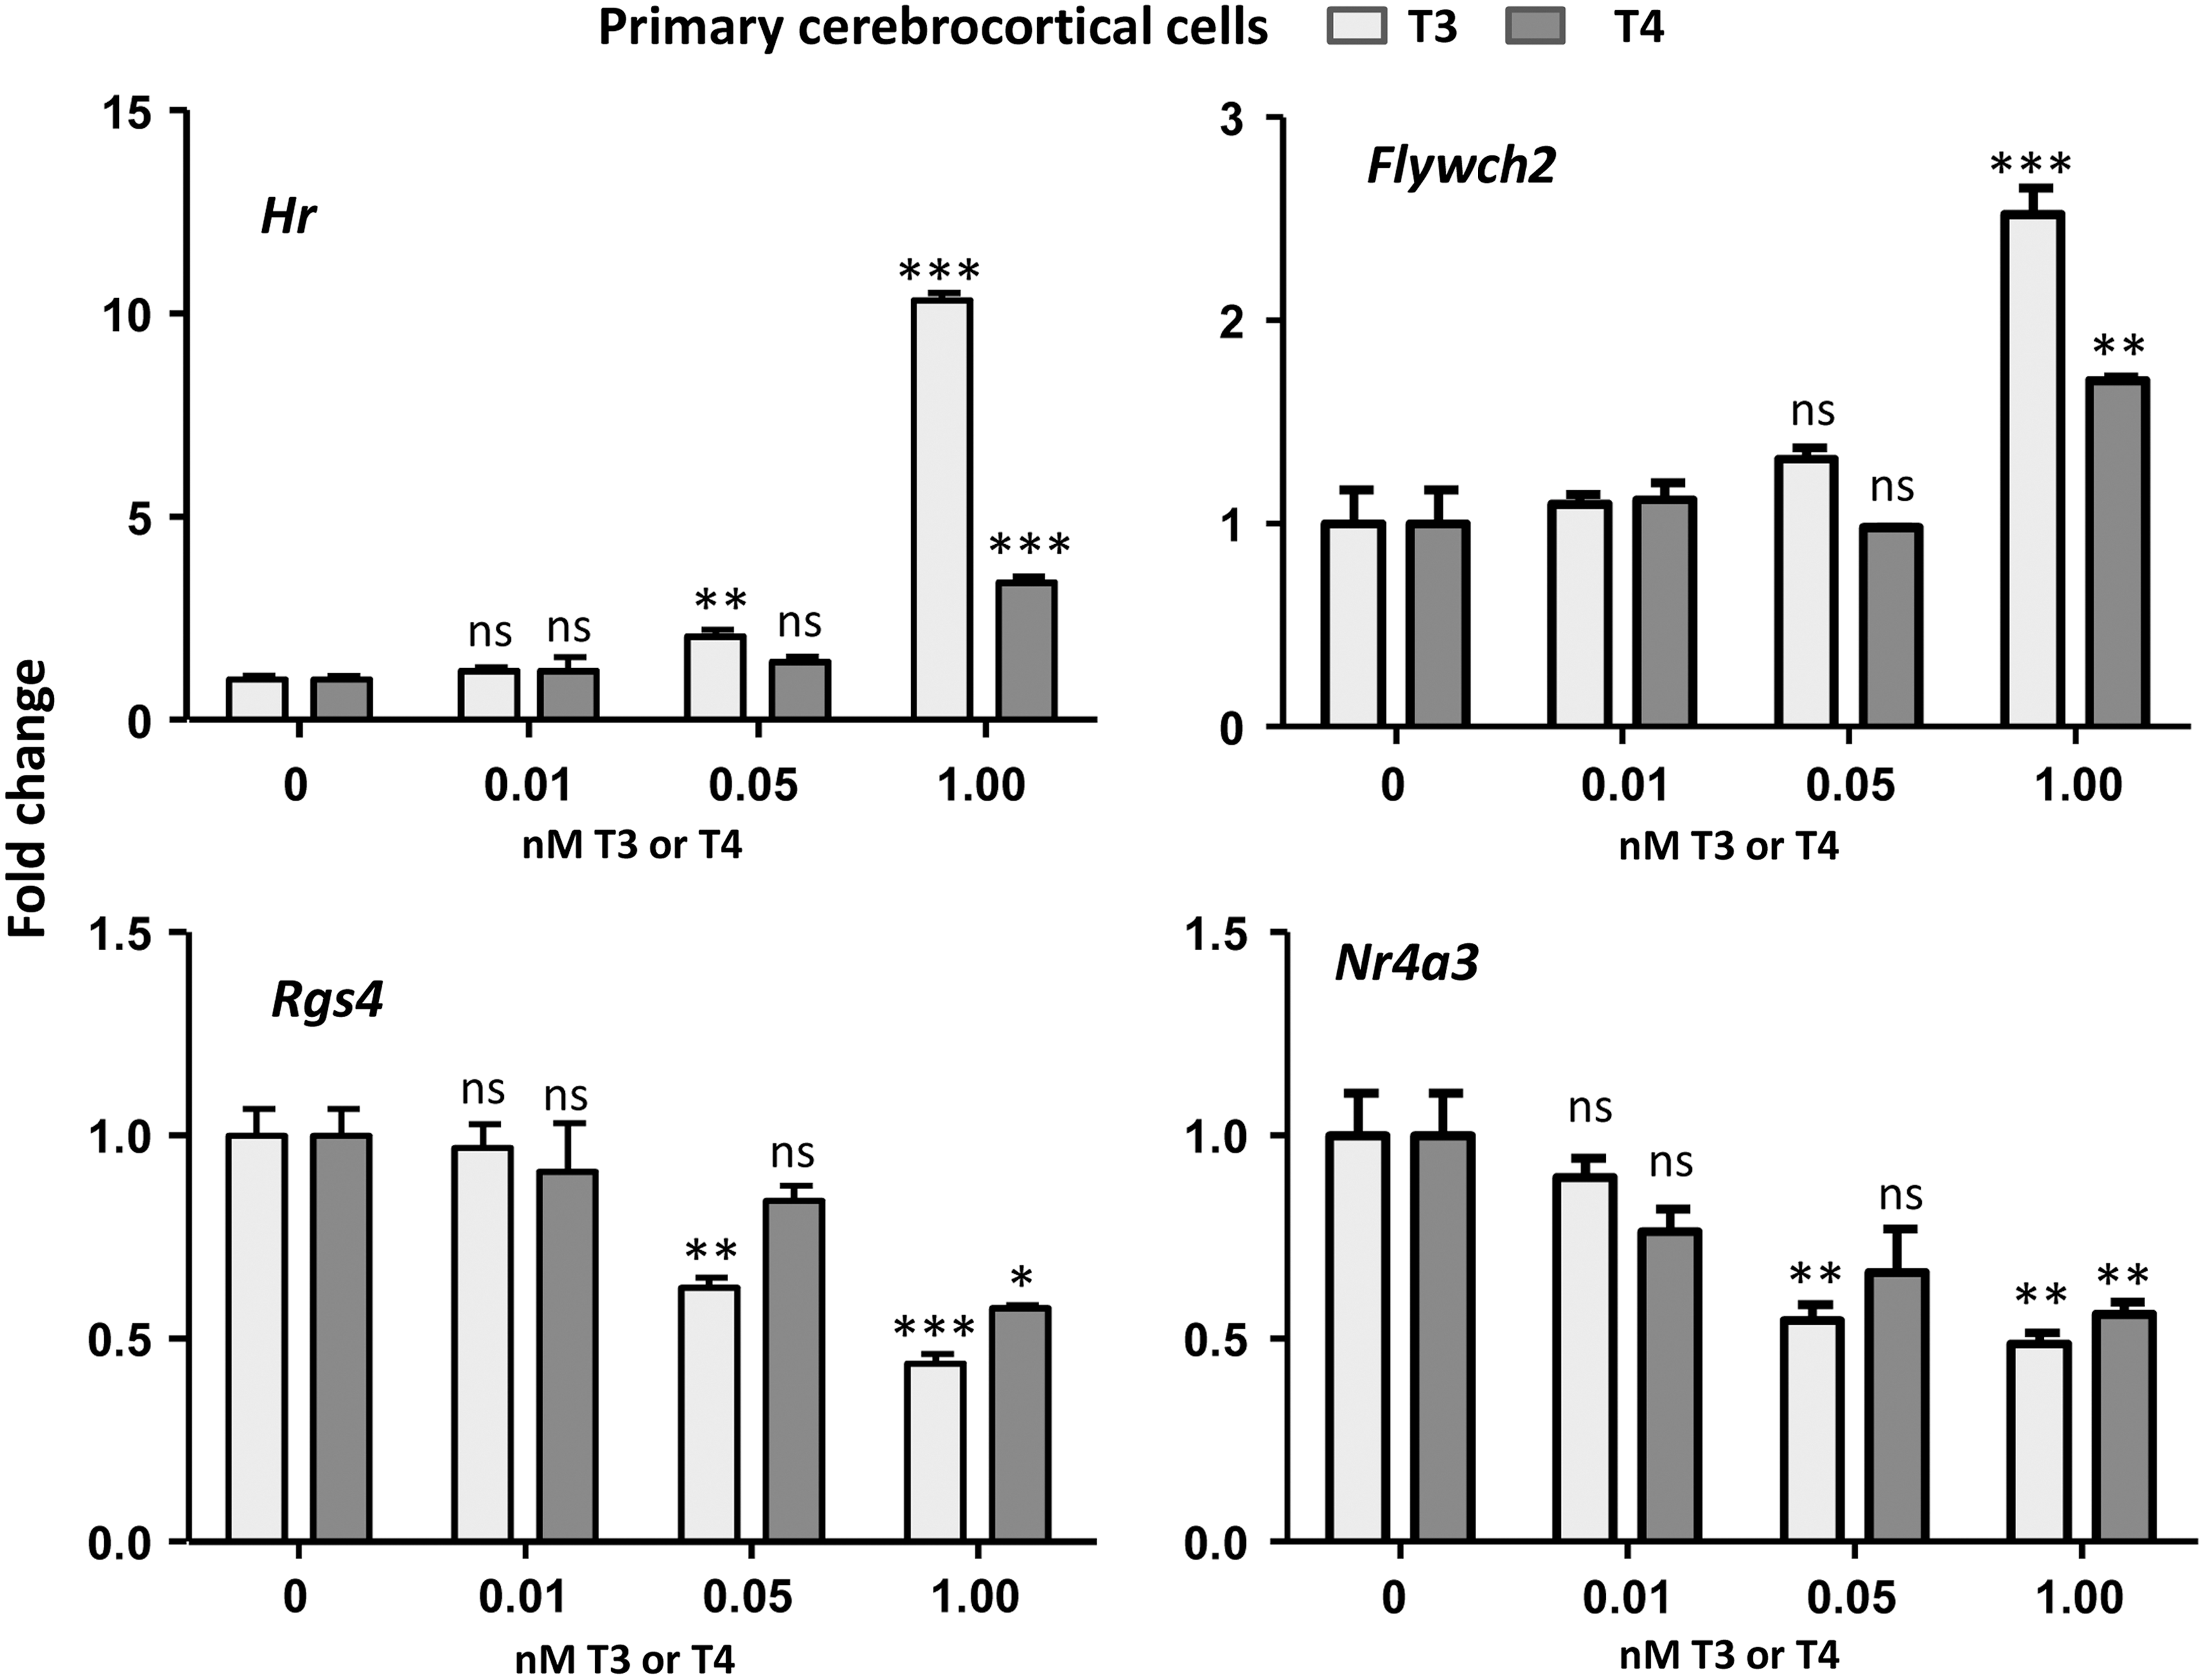
Effects of T4 and T3 on Hr, Flywch2, Rgs4, and Nr4a3 expression in neuron-enriched cerebrocortical cells from E17.5 Dio2 KO mice in 0.1% thyroid hormone–depleted newborn calf serum. Statistical comparisons by one-way ANOVA and Dunnet's post hoc test comparing each data with cells incubated in the absence of added hormone. *p < 0.05; **p < 0.01; ***p < 0.001.
Discussion
The results of the present study show that T4 has intrinsic genomic activity independent of conversion to or contamination with T3. A completely novel observation is the relatively high T4 activity on the negatively regulated genes, both in the N2a cell line and in the primary cerebrocortical cells. The activity of T4 on positively regulated genes appears to depend on the cellular context (16). The effects depend on the presence of the TR, and are probably not mediated by Dio3-produced T4 metabolites, since the N2a cell line does not express Dio3.
The data provide a comparison between different cellular settings, as well as a strict control of the amounts of T4 and T3 actually present during incubation in the absence of deiodinase activity. Effects of T4 and T3 on gene expression were analyzed in mouse brain primary cells enriched in astrocytes or in neurons, and in an established cell line derived from N2a neuroblastoma cells stably expressing the TRα1 receptor subtype. The results with the cerebrocortical cells indicated a relatively high sensitivity to T4. On positive gene regulation, a T3 effect was observed with 0.05 nM, and at 1 nM, T4 had about 50% of the activity of T3. It could be discarded that the activity of T4 was due to contamination with T3 or to artefactual T3 formation during incubation. Thus, after incubation with 0.93 nM of T4, resulting in a 4–5 fold increase in Hr expression, the concentration of T3 at the end of the incubation was 0.02 nM, a concentration of T3 that is unlikely to account for this effect. The inhibition of T4 activity by the T4 and T3 antibodies was not absolutely conclusive due to the cross-reactivity present at the high concentration needed to complex the hormones at the concentrations used, but the results were also in line with an intrinsic T4 activity.
The results with the N2a cells are in agreement with previous estimates of T4 and T3 activity in cultured cells (8,10). The comparison of Hr stimulation between primary and neuroblastoma cells showed that T4 was relatively more active on positive regulation in the primary cells. T4 at 1 nM concentration had no activity on the N2a cells, whereas in the primary cells, it was clearly active. The reason for the greater activity in primary cells is not clear, but it may depend on the expression of receptor subtypes or co-regulators, as suggested recently (16). TRα1, the receptor expressed in the N2a cells, has higher affinity for T4 than TRβ1 (10). TRβ2 has higher affinity for T3 than TRα1 or TRβ1 (25,26). The primary cells express TRα1 and TRβ (19), but the relative amounts of the TRβ1 and TRβ2 isoforms expressed by these cells is unknown. Other possibilities are a greater nuclear accumulation of T4 in the primary cells or different interactions of the T4–TR complex with co-regulators (10). For example, the T4–TR complex might associate better with co-repressors than with co-activators. This could also explain why the difference in the apparent Km of T3 and T4 action is lower for negative regulation than for positive regulation. In the neuroblastoma cells, 50% stimulation of Hr expression took place at about 0.5 nM of T3 and 20 nM of T4, that is, T4 had 1/40th the activity of T3. On Rgs4 repression, 50% downregulation took place at about 0.1 nM of T3 and 0.5 nM of T4, that is, T4 had 1/5th the activity of T3. These results support a physiological action of T4, at least on negative regulation, since the circulating free T4 (25 pM) is fivefold the free T3 concentration (5 pM).
One situation where T4 activity could be relevant is in the Dio2-deficient brain. Dio2 activity contributes to at least 50% of brain T3 concentration by local T4 deiodination. Accordingly, Dio2 KO mice have decreased brain T3 in the range of hypothyroid mice, and increased brain T4 concentrations (13). Surprisingly, most genes regulated positively by TH maintain normal expression, despite the concentration of T3 decreasing to near hypothyroid values. This could be due to increased intracellular T4. If T4 activity on positive gene regulation depends on the cell context, and as shown here the cerebrocortical cells are more sensitive to T4 than the neuroblastoma cells, it is conceivable that an elevation of T4 in the absence of Dio2 contributes to maintaining normal expression of positively regulated target genes. Although many of the negatively regulated genes remain unaltered in the Dio2 KO, there is a high proportion that remain at similar levels as in hypothyroid mice (14,15). This might be a consequence of the diversity of molecular mechanisms involved in negative gene regulation (27).
Footnotes
Acknowledgments
This work was supported by the Center for Biomedical Research on Rare Diseases (Ciberer) under the frame of E-Rare-2 (project acronym THYRONERVE), the ERA-Net for Research on Rare Diseases; grant SAF2014-54919R from Plan Estatal de Investigación Científica, Técnica y de Innovación, Ministerio de Economía y Competititividad, and FEDER funds.
Author Disclosure Statement
The authors have nothing to disclose.