
Abstract
Background:
Difficulties have been reported in quantitating 3-iodothyronamine (T1AM) in blood or serum, and tentatively attributed to problems in extraction or other pre-analytical steps. For this reason, even cell culture experiments have often be performed with unphysiological protein-free media. The aim of this study was to evaluate the recovery of exogenous T1AM added to a standard cell culture medium, namely Dulbecco's minimum essential medium (DMEM) supplemented with fetal bovine serum (FBS), and to other biological matrixes.
Methods:
Cell culture media (Krebs–Ringer buffer, DMEM, FBS, DMEM + FBS, used either in the absence or in the presence of NG108-15 cells) and other biological matrixes (rat brain and liver homogenates, human plasma, and blood) were spiked with T1AM and/or deuterated T1AM (d4-T1AM) and incubated for times ranging from 0 to 240 minutes. Samples were then extracted using a liquid/liquid method and analyzed using liquid chromatography coupled to mass spectrometry in order to assay T1AM and its metabolites, namely 3-iodothyroacetic acid (TA1), thyronamine, thyroacetic acid, N-acetyl-T1AM, and T1AM esters.
Results:
In FBS-containing buffers, T1AM decreased exponentially over time, with a half-life of 6–17 minutes, depending on FBS content, and after 60 minutes, it averaged 0–10% of the baseline. T1AM metabolites were not detected, except for minimum amounts of TA1. Notably, d4-T1AM decreased over time at a much lower rate, reaching 50–70% of the baseline at 60 minutes. These effects were completely abolished by protein denaturation and partly reduced by semicarbazide. In the presence of cells, T1AM concentration decreased virtually to 0 within 60 minutes, but TA1 accumulated in the incubation medium, with quantitative recovery. Spontaneous decrease in T1AM concentration with isotopic difference was confirmed in rat organ homogenates and human blood.
Conclusions:
These results suggest binding and sequestration of T1AM and/or its aldehyde derivative by blood and tissue proteins, with significant isotope effects. These issues might account for the technical problems complicating the analytical assays of endogenous T1AM.
Introduction
I
A pitfall in the investigations on the physiological role of T1AM is the difficulty in measuring its concentration in blood and in reconstituted systems including plasma proteins. T1AM has been detected in human and animal blood by mass spectrometry coupled to liquid chromatography (LC-MS/MS), but significant technical problems exist: (i) extensive pre-analytical processing is needed, different investigators used different methodologies, and the extraction procedure has not been standardized; and (ii) significant variability has been reported between the results obtained by different laboratories, or even by the same laboratory, and sometimes the endogenous levels appear to fall below the detection limit of the assay (5 –9).
An immunological method has been developed and applied to human serum samples, but the endogenous levels measured with this technique also showed variability, and they turned out to be one to two orders of magnitude higher than the ones measured by LC-MS/MS (10 –12).
These difficulties and discrepancies have been tentatively attributed to the high affinity binding of T1AM to serum proteins, particularly apo-B100 (13), but this hypothesis has not been directly investigated. Another potential complication is represented by T1AM metabolism. While exogenous T1AM administered to intact animals has been reported to undergo oxidation, deiodination, N-acetylation, and esterification to sulfate or glucoronate (14 –17), the reactions occurring in blood or serum have not been specifically evaluated.
The difficulty in detecting T1AM in serum also applies to in vitro experiments performed with cell cultures. Incubation buffers devoid of serum proteins have been generally chosen in order to allow a reliable assay by LC-MS/MS. However, the scope of these experiments would be greatly expanded by the use of more physiological media.
For these reasons, this study evaluated the recovery and quantitation of exogenous T1AM added to incubation media containing fetal bovine serum (FBS). The experiments revealed significant pitfalls, and additional observations showed that the latter also apply to tissue homogenates and human blood.
Materials and Methods
Chemicals and cells
FBS, Dulbecco's minimum essential medium (DMEM), and mouse neuroblastoma and rat glioma hybrid cells (NG108-15) were purchased from Sigma–Aldrich. Krebs–Ringer buffer was prepared with the following composition (mM): NaCl 118, NaHCO3 25, KCl 4.5, KH2PO4 1.2, MgSO4 1.2, CaCl2 1.5, and glucose 11 (pH 7.2). T3, T4, tyramine, norepinephrine, urea, proteinase K, β-glucuronidase, semicarbazide, aminoguanidine, iproniazid, pargyline, bovine serum albumin, and goat immunoglobulin G (IgG) fraction were from Sigma–Aldrich. T1AM, deuterated T1AM (d4-T1AM), and T1AM metabolites (3-iodothyroacetic acid, TA1; thyronamine, T0AM; thyroacetic acid, TA0; N-acetyl-3-iodothyronamine; N-Ac-T1AM) were kindly provided by Dr. T.S. Scanlan (Portland, OR) and solubilized in methanol to a final concentration of 1 μg/mL. Deuterated tyramine (d4-tyramine) was from C/D/N Isotopes, Inc. Human blood was obtained from healthy volunteers (i.e., some authors of this paper).
Experimental procedures
Different media (500 μL) were incubated at 37°C from 0 to 4 h with T1AM and or d4-T1AM. Their final concentration was usually 10 ng/mL (i.e., about 28 nM), but in some experiments, concentrations varying from 1 ng/mL to 500 ng/mL (2.8 nM to 1.4 μM) were tested. In additional experiments, T3, T4, T0AM, tyramine, d4-tyramine, and norepinephrine were used. Samples were extracted using a liquid–liquid method: 1 mL of methyl tert-butyl ether (MTBE) was added, and the mixture was then vigorously shaken for 30 s and briefly spun at 21,382 g in a Hettich Mikro 200 centrifuge to separate the organic and aqueous phases. The organic phase was then collected in a new Eppendorf vial, and the extraction procedure was repeated twice. The collected organic phases were then evaporated under nitrogen at 40°C.
Whole blood or plasma (500 μL) was incubated at 37°C for 0–72 h with a T1AM/d4-T1AM mixture at a final concentration of 10 ng/mL. Brain and liver tissues (150 mg/sample) were homogenized in 1 mL of phosphate-buffered saline (PBS) and incubated at 37°C for 0–4 h with a T1AM/d4-T1AM mixture (10 ng/mL each). Samples were then deproteinized using 1 mL of ice-cold acetonitrile, and then the supernatant was washed three times using 2 mL of hexane each time, and dried under nitrogen at 40°C.
In some experiments, media were preincubated for 2 h with proteinase K from Tritirachium album (0.06 mIU/mL of protein in 300 mM of TrisHCl and 5 mM of CaCl2 at 50°C) or with 8 M of urea. In other experiments, amine oxidase inhibitors (semicarbazide, aminoguanidine, iproniazid, or pargyline, each at 100 μM concentration) were included during 1 h of preincubation at 37°C, before adding T1AM and/or d4-T1AM.
In all cases, dry samples were reconstituted using a 70:30 water/methanol mixture and analyzed using high-performance liquid chromatography (HPLC)-coupled LC-MS/MS to assess T1AM, T0AM, TA1, and TA0, as described elsewhere (7). The limits of quantification (referred to original concentrations in medium) were 14 pM for T1AM and T0AM, and 1.35 nM for TA1 and TA0. N-Ac-T1AM was assessed on the basis of the LC-MS/MS method described by Hackenmueller and Scanlan (17), with a detection limit of 120 pM. To investigate the presence of T1AM sulfate and glucuronide, samples were digested with β-glucuronidase from Helix Pomatia (that also includes about 7500 IU/mL of sulfatase activity) for 1 or 2 h, and the increase in T1AM was determined.
T3, T4, and T0AM were assayed, as described previously (7); tyramine and d4-tyramine were assayed by an LC-MS/MS method based on reverse phase HPLC with gradient elution, using a Phenomenex Luna 3 μm Phenyl-hexyl (50 × 4.60 mm) HPLC column, eluted with formic acid in methanol (0.1%, V%) as solvent A, and ammonium acetate (1.2 mM) in water/methanol (98/2, V/V) as solvent B (flow rate 500 μL/min). Tandem mass spectrometry detection was based on the following SRM transitions: 138.2 > 77.1, 138.2 > 102.9, and 138.2 > 121.0 Da for tyramine; 142.2 > 79.1, 142.2 > 105.9, and 142.2 > 125.0 Da for d4-tyramine.
Cell culture experiments
NG108-15 were cultured in DMEM high glucose medium supplemented with 10% (v/v) FBS, 1 mM of pyruvate, 100 IU/mL of penicillin, and 100 μg/mL of streptomycin at 37°C in a humidified atmosphere containing 5% CO2, and subcultured before confluence. To perform uptake experiments, cells were seeded in 24-well plates and growth until 80% confluency. At the start of each experiment, the culture medium was removed, and wells were washed with 300 μL of PBS. PBS was then discarded and replaced with 0.5 mL of Krebs–Ringer buffer, DMEM, or DMEM +10% FBS. T1AM and/or d4-T1AM was added at a final concentration of 10 ng/mL at the time points indicated in the description of the specific experiments. The medium was removed from each well at specific time points and stored at −80°C until extraction, while the wells were washed using 300 μL of PBS that was subsequently discarded before storing the plate at −80°C.
Cell lysis was carried out using 100 μL of NaOH 0.1 M (7). The pH was neutralized by adding 10 μL of HCl 1 M, then 300 μL of methanol was added, and samples were vigorously shaken for 10 min. After 10 min of centrifugation at 18,000 g, the supernatant was evaporated under nitrogen at 40°C. Dry samples were then reconstituted using a 70:30 water/methanol mixture and analyzed by LC-MS/MS, as described above. DMEM + FBS used as cell culture medium was extracted, as previously mentioned, while Krebs samples were extracted with acetonitrile, as described above for blood samples.
Statistical analysis
Data are expressed as mean ± standard error of the mean. GraphPad Prism v6.05 for Windows (GraphPad Software, San Diego, CA) was used for data processing and statistical analysis. Differences between groups were evaluated by one- or two-way analysis of variance, as appropriate. Individual groups were compared by Tukey's post hoc test. When only two groups were compared, an unpaired t-test was used. Decay curves were fitted by a single exponential model. The threshold of statistical significance was set at p < 0.05.
Results
When exogenous T1AM (28 nM) was added to DMEM buffer, its concentration was substantially stable, and after 60 minutes, it exceeded 95% of the baseline. However, in the presence of FBS, T1AM signal decreased exponentially over time, with a half-life of 6–17 minutes, depending on FBS content, and after 60 minutes, it averaged 0–10% of the baseline (Fig. 1). Known T1AM catabolites, namely TA1, T0AM, TA0, N-Ac-T1AM, T1AM sulfate, and T1AM glucuronide, were not detected within this time frame, except for the occasional observation of TA1 at concentrations close to the limit of detection of the assay, and in any case <5% of the baseline (if estimated as described below).
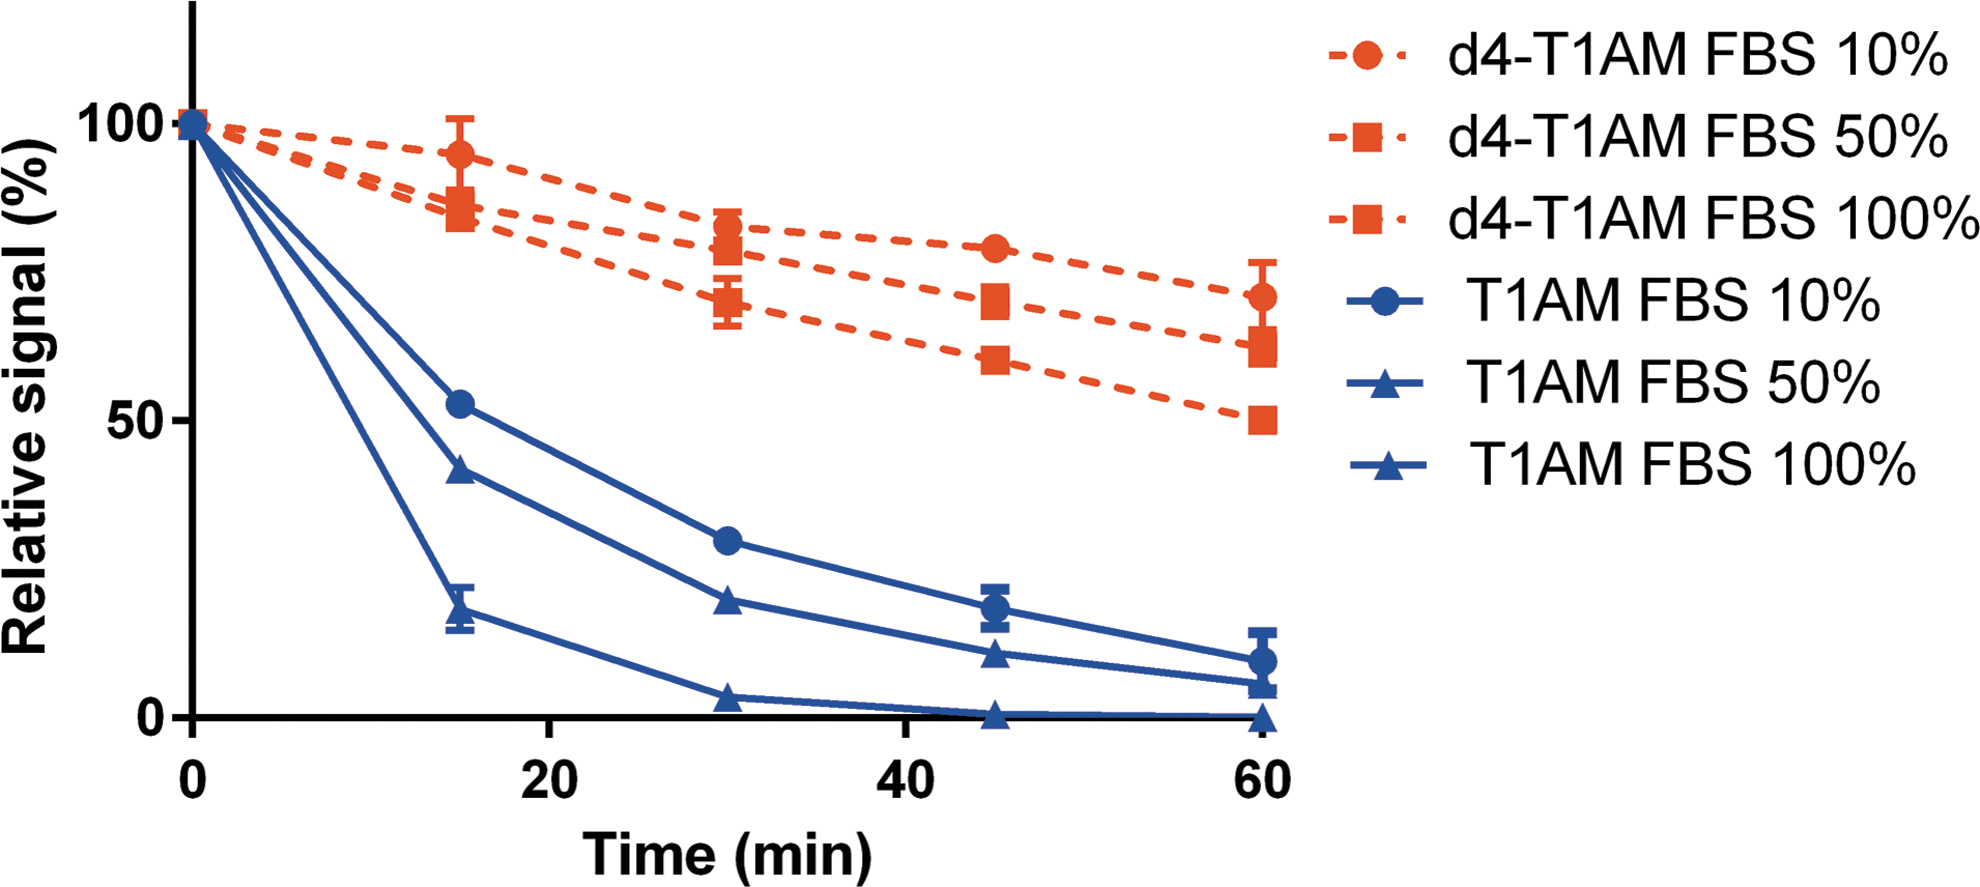
DMEM + FBS experiments. T1AM and d4-T1AM were added at time 0 in FBS or DMEM +10–50% FBS (v/v). Data are shown as relative signal (i.e., percentage of time 0) and are expressed as mean ± SEM of three different assays. Decay curves were better fitted by an exponential model; p < 0.001 for the difference in the time constant between T1AM and d4-T1AM. No significant signal was detected for T1AM metabolites, except for trace amounts of TA1 (<5%). Even with longer incubation times (up to 240 min), TA1 production, estimated as described in the legend to Figure 2, was <10%. DMEM, Dulbecco's minimum essential medium; FBS, fetal bovine serum; T1AM, 3-iodothyronamine; d4-T1AM, deuterated T1AM; SEM, standard error of the mean. Color images available online at
Surprisingly, d4-T1AM showed a significantly different behavior (p < 0.01; see Fig. 1), since its concentration decreased over time at a much lower rate, reaching 50–70% of the baseline at 60 minutes. While d4-T1AM synthetized by Dr. Tom Scanlan was usually used, this observation was confirmed with commercially available d4-T1AM purchased from Sigma–Aldrich.
Adding different T1AM concentrations to DMEM +10% FBS, it was observed that the rate constant of T1AM exponential decrease did not vary over the range 2.8–140 nM, but it decreased significantly in the high nanomolar and low micromolar range (Table 1). In particular, the half-life was on the order of 9–10 minutes up to 140 nM, and increased to 14, 21, and 42 minutes at 280 nM, 700 nM, and 1.4 μM, respectively
T1AM was added to DMEM +10% FBS, and its concentration was measured at time 0 (baseline) and at three to four additional time points, up to 60 minutes. At least two different experiments were performed at each concentration. The average values at different time points were expressed as percentage of the baseline, and decay curves were interpolated by a single exponential, whose parameters are shown in the table. p < 0.001.
T1AM, 3-iodothyronamine; DMEM, Dulbecco's minimum essential medium; FBS, fetal bovine serum; K, rate constant; r, correlation coefficient; p, probability level for significant difference between groups by analysis of variance (ANOVA) applied to nonlinear fitting.
T3, T4, T0AM, and other aromatic amines were also used in the same experimental model at the initial concentration of 28 nM. A significant time-dependent decrease was observed with T0AM, which reached 17% of the baseline at 60 minutes (analysis by a single exponential yielded a half-life of 19 minutes). On the other hand, T3, T4, tyramine, and d4-tyramine did not decrease over time, since at 20, 40, and 60 minutes, their concentration was >95% of the baseline. Consistently, the kinetics of T1AM decay was not significantly modified if 28 nM of T1AM was incubated in the presence of tyramine or norepinephrine, either at 28 nM or 730 nM concentration.
Other experiments were performed with NG108-15 cell cultures. If Krebs or DMEM buffer was used, T1AM concentration in the medium decreased over time, and after 60 minutes, it reached a plateau corresponding to about 50–60% of the baseline. In the same experiments, T1AM concentration in cell lysate increased over time, and accounted for approximately 40–50% of the missing T1AM. TA1 was also detected, and the ratio of TA1-to-T1AM concentration was estimated through calibration curves performed in DMEM (r > 0.99 using eight different concentrations, ranging from 0.82 to 84.3 nM). On the basis of this estimate, TA1 production corresponded to about 10–15% of the initial T1AM, so that the overall recovery was on the order of 100–120% of the added T1AM (Fig. 2).
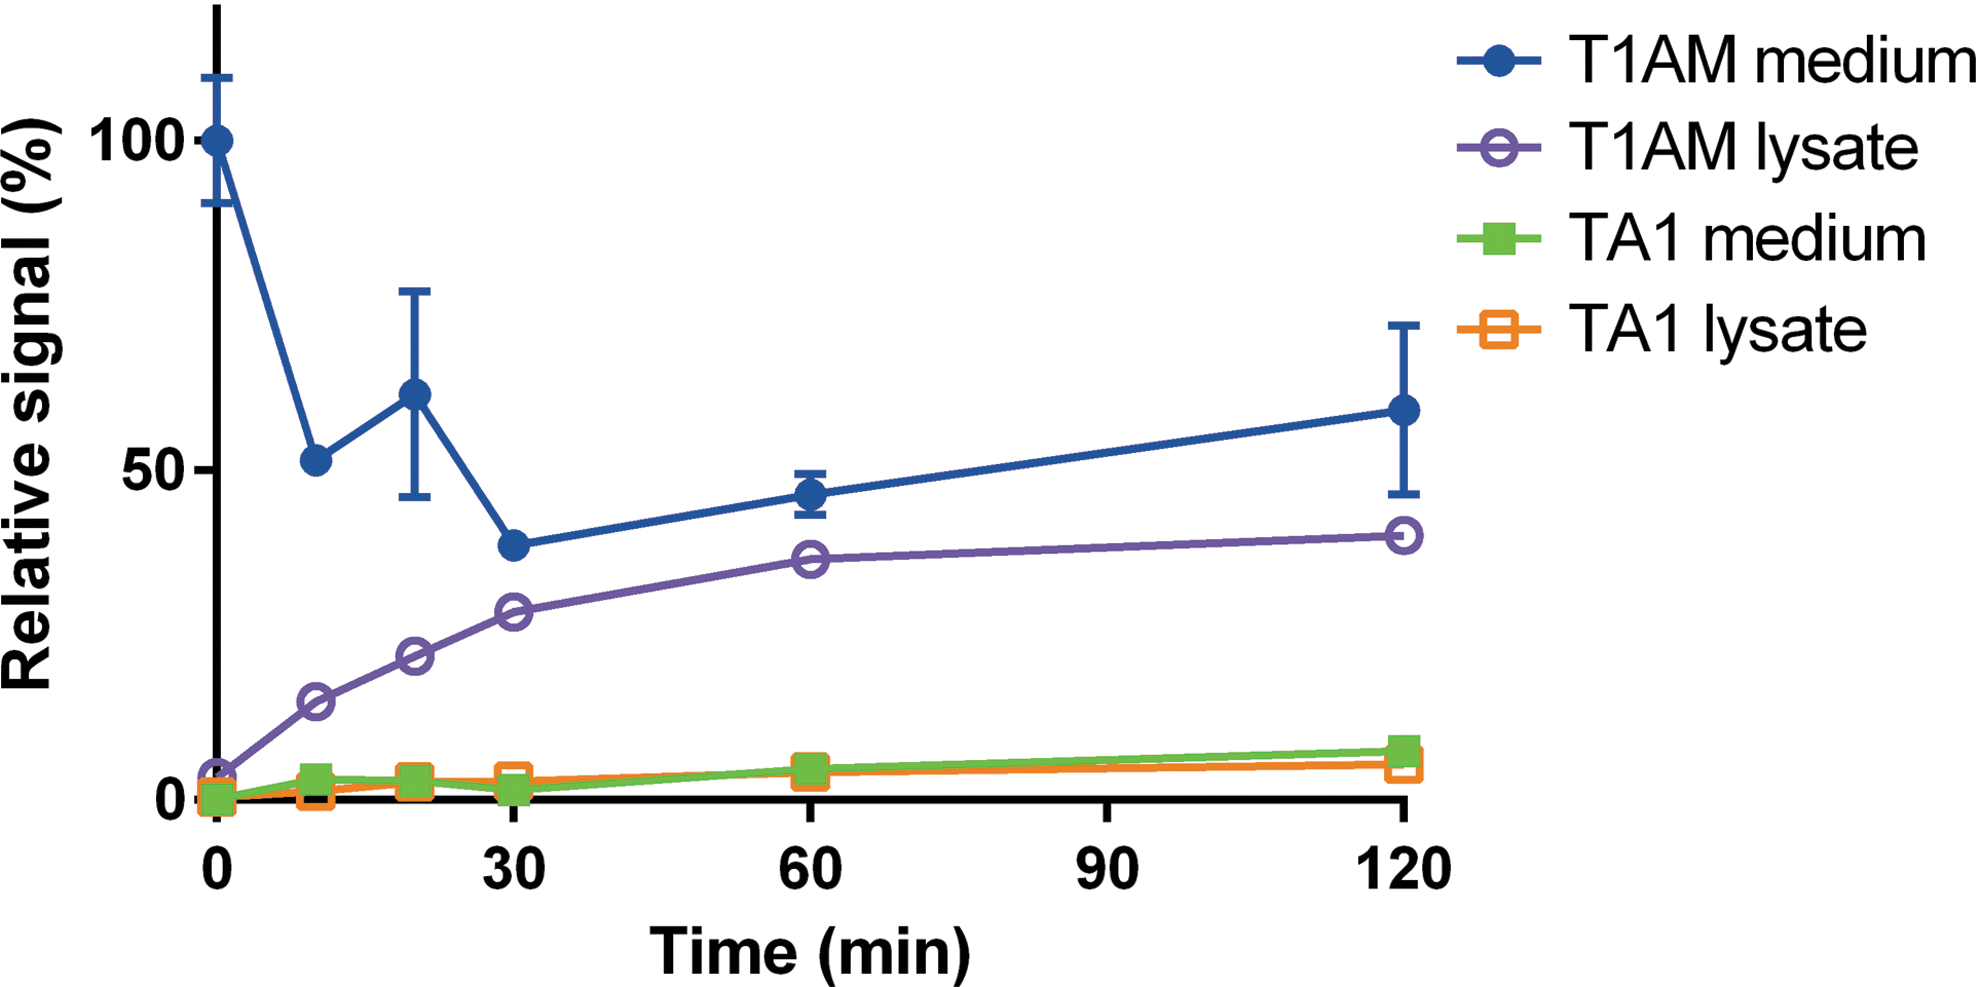
Cell culture experiments performed in DMEM buffer. T1AM was added at time 0 to cell cultures incubated in DMEM. Data are shown as relative signal (i.e., percentage of time 0) and are expressed as mean ± SEM of two different assays. TA1 signal is represented as percentage of the initial T1AM on the basis of calibration curves performed in DMEM, using T1AM and TA1 concentration ranging from 0.82 to 84.3 nM. The calibration curves were linear, with r > 0.99 in all cases. No signal was detectable for other T1AM metabolites. Similar results were obtained when cell cultures were incubated in Krebs–Ringer buffer (not shown). Color images available online at
In the presence of DMEM + FBS, T1AM concentration decreased virtually to zero within 60 minutes, as observed in the absence of cells, while lysate T1AM accounted for only 1.5% of initial T1AM. TA1 accumulated in the incubation medium. Although there was a time lag between T1AM decrease and TA1 production, after 120 minutes, TA1 accumulation corresponded to, or even slightly exceeded, the amount of T1AM measured at time 0 (Fig. 3).
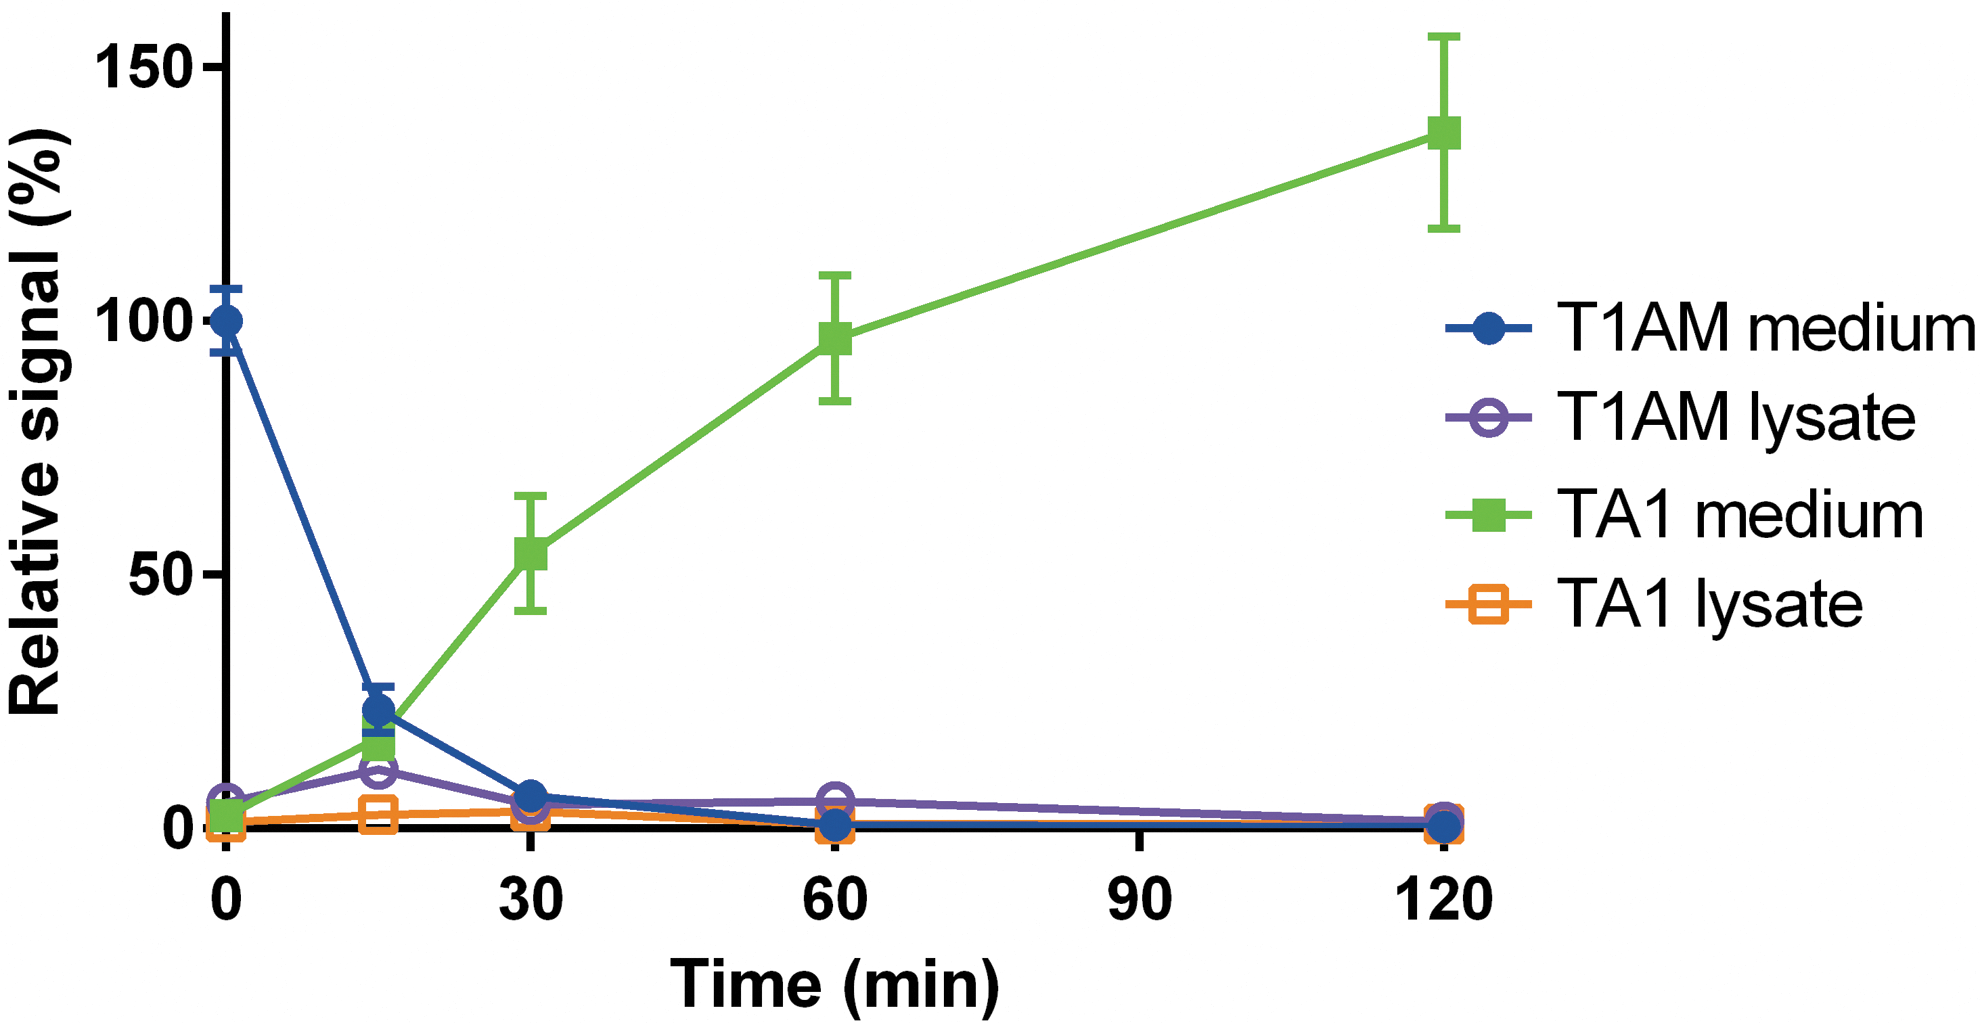
Cell culture experiments in DMEM +10% FBS. T1AM was added at time 0 to cell cultures incubated in DMEM +10% FBS. Data are shown as relative signal (i.e., percentage of time 0) and are expressed as mean ± SEM of six different assays. TA1 signal was determined as described in the legend to Figure 2. No signal was detectable for other T1AM metabolites. In a control experiment, cells were incubated with DMEM +10% FBS without adding exogenous T1AM, and the TA1 signal at 120 min was close to detection limit (i.e., <5%) if expressed according to the scale of this graph. Color images available online at
In another experiment, T1AM was added to DMEM + FBS, and the medium was exposed to NG108-15 cells when T1AM was no longer detectable (i.e., after 120 min; Fig. 4). In the presence of cells, remarkable TA1 production was observed, and it eventually accounted for the total amount of T1AM that had been added. These observations suggest that in the presence of FBS, exogenous T1AM progressively becomes undetectable, although its catabolite TA1 can still be produced by cellular systems with quantitative recovery.
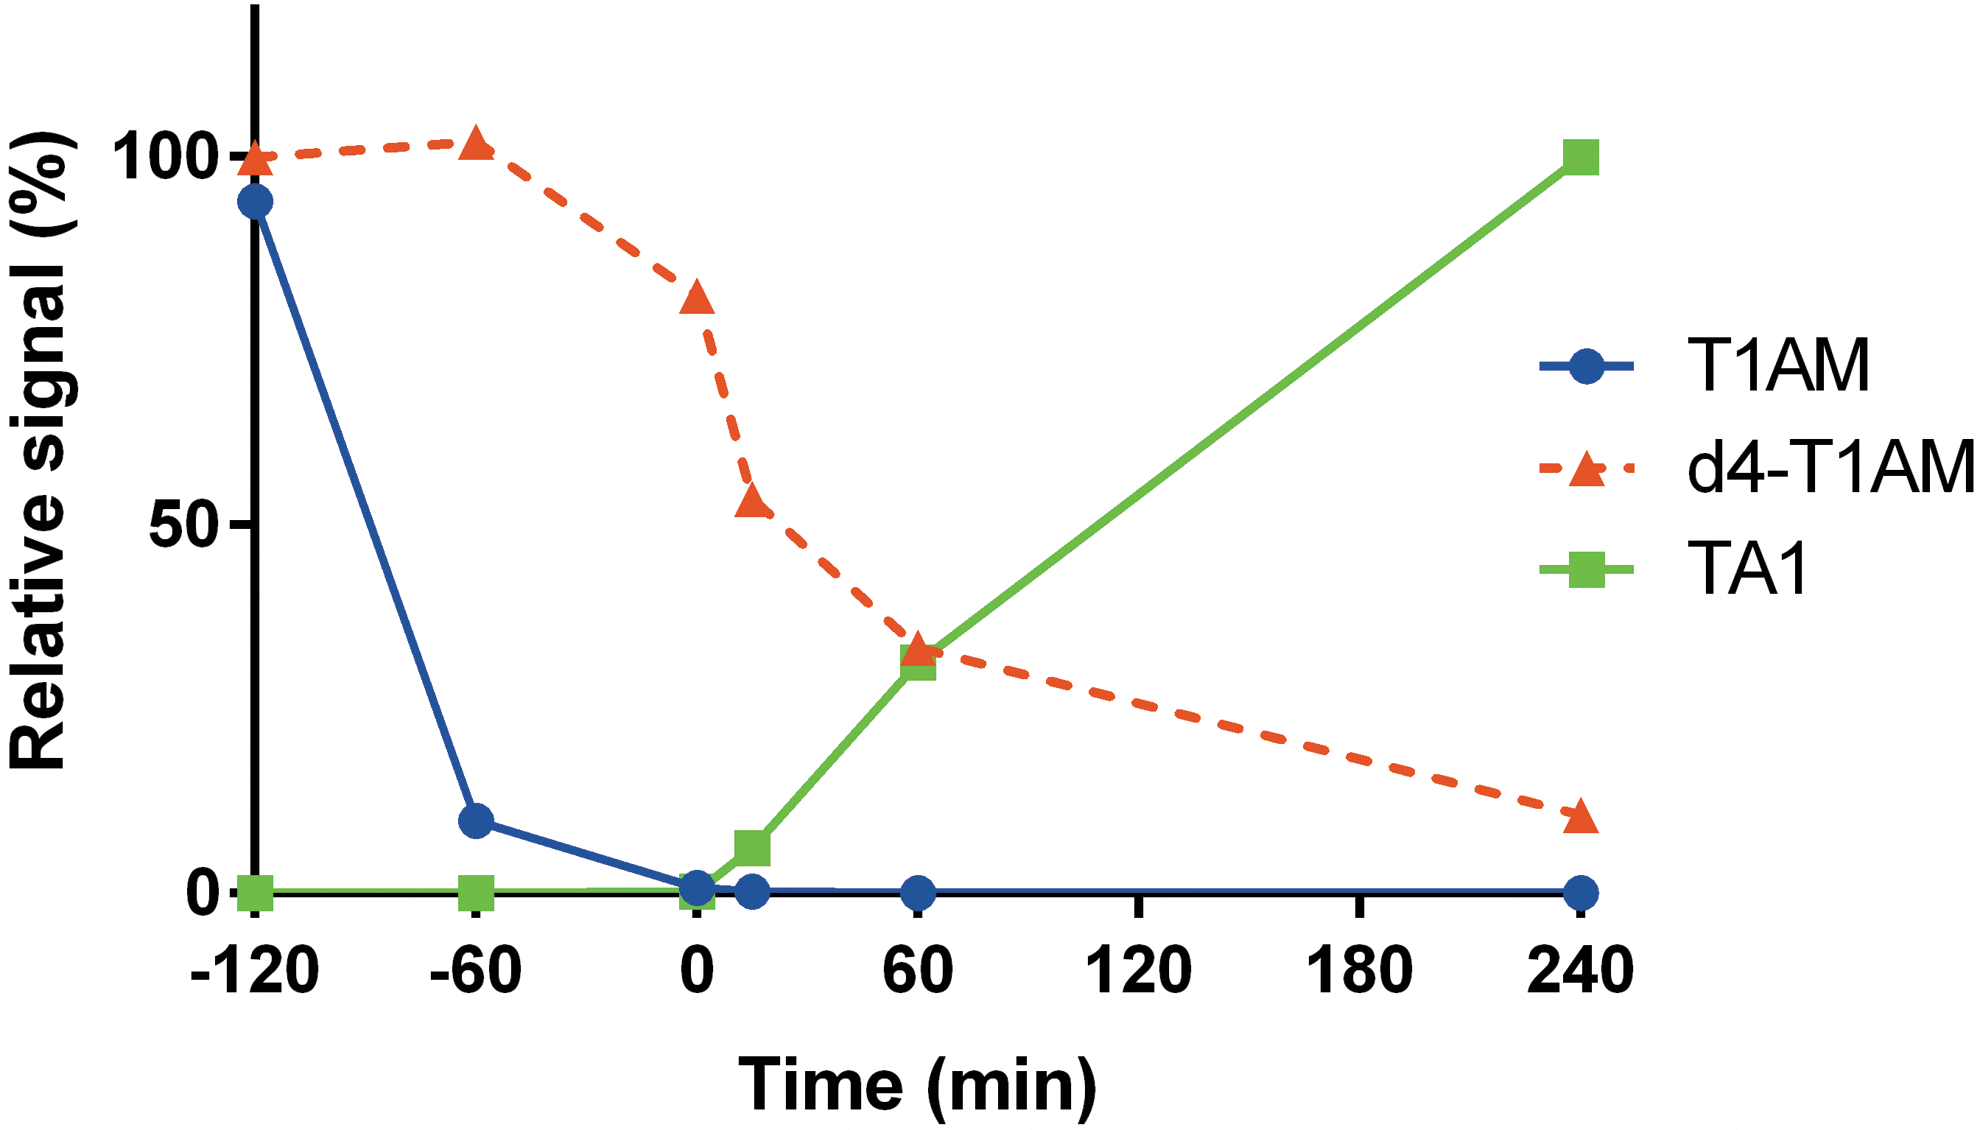
Cell culture experiments with T1AM preincubation. Cell medium (DMEM +10% FBS) was preincubated for 2 h with T1AM + d4-T1AM (negative time points). At time 0, the medium was exposed to NG108-15 cells (positive time points). Data are shown as relative signal (i.e., percentage of time −120 min) and refer to a representative experiment. Results are shown only for medium T1AM, d4-T1AM, and TA1, since lysate values were <2% of the baseline, and no signal was detectable for other T1AM metabolites. TA1 signal is represented as described in the legend to Figure 2. Color images available online at
Further experiments were carried out to evaluate the role of FBS proteins (Supplementary Fig. S1; Supplementary Data are available online at
The major serum protein is albumin, but it did not appear to play a role in the described effects, since adding bovine serum albumin to DMEM produced no significant acceleration in T1AM decay or any difference in T1AM vs d4-T1AM decay. The same results were obtained in the presence of a goat IgG fraction (data not shown). The effects of amine oxidase inhibitors were then tested (Fig. 5). Semicarbazide, a blocker of carbonyl groups that inhibits a class of amine oxidases (known as semicarbazide-sensitive amine oxidases [SSAOs]), approximately halved the decrease in T1AM concentration observed in FBS-containing media (53.2 ± 0.9% vs. 0.6 ± 0.2% at 120 min; p < 0.01) and abolished the decrease in d4-T1AM. Aminoguanidine, another putative SSAO inhibitor, also nearly abolished the decrease in d4-T1AM, but it was virtually ineffective on T1AM. A similar effect was produced by the nonspecific monoamine oxidase (MAO) inhibitor iproniazid, while the MAO-B inhibitor pargyline was ineffective.
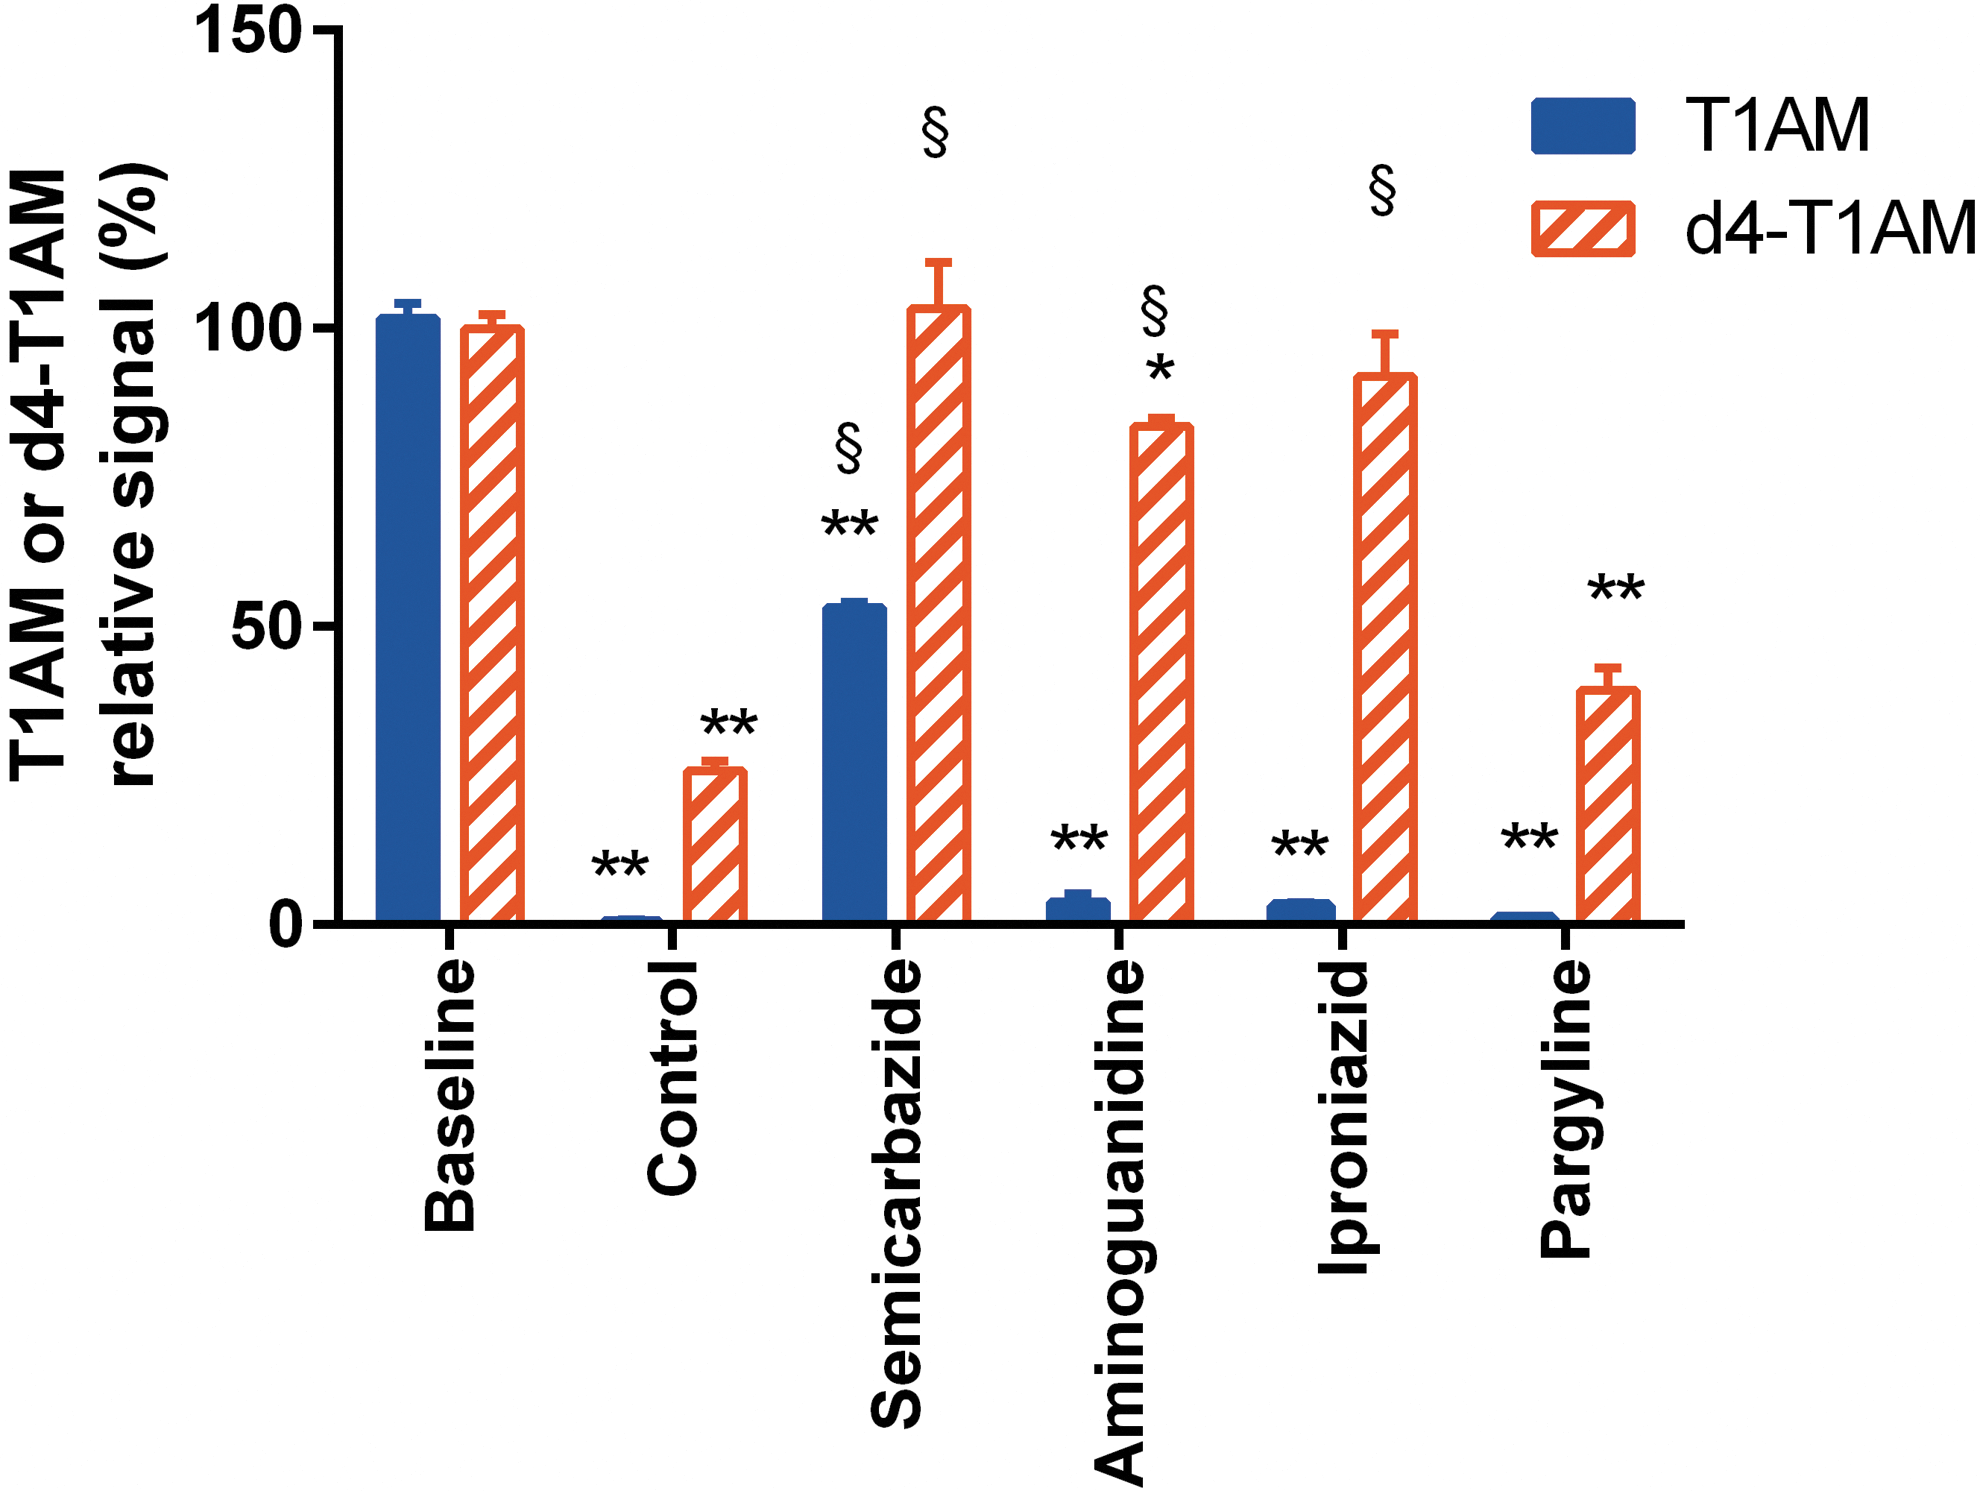
Effect of amine oxidase inhibitors in cell-free DMEM + FBS. T1AM and d4-T1AM were added at time 0 (baseline) in DMEM +10% FBS. Assays were performed at the baseline and after 120 min of incubation in the absence (control) or in the presence of different amine oxidase inhibitors at 100 μM concentration. Samples containing inhibitors were preincubated for 1 h at 37°C before adding T1AM or d4-T1AM. Data represent mean ± SEM of four different assays and are expressed as relative signal (i.e., as percentage of time 0). TA1 signal was <5%, and no signal was detected for other T1AM metabolites.*p < 0.05; **p < 0.01 vs. the corresponding baseline group; §p < 0.01 vs. the corresponding control group by Tukey's test after two-way analysis of variance (ANOVA). Color images available online at
Amine oxidase inhibitors were also used in NG108-15 cell cultures exposed to T1AM in DMEM + FBS buffer (Fig. 6, left panel). After prolonged incubation (240 min), exogenous T1AM was completed converted to TA1, which accumulated in the incubation medium, while lysate TA1 was <1%. Semicarbazide decreased TA1 production to 39.3 ± 3.2% of the control value (p < 0.01), which was associated with significant recovery of T1AM both in the medium and in cell lysate (estimated as about 55% and 23% of control TA1 accumulation, respectively), while lysate TA1 was not significantly modified (<1% in all cases). By contrast, aminoguanidine, iproniazid, and pargyline produced no significant effect.

Effect of amine oxidase inhibitors on TA1 production in cell cultures. Experiments were performed in DMEM +10% FBS (left) and in Krebs buffer (right). T1AM and d4-T1AM were added at time 0 (baseline), and assays were performed after 240 min of incubation in the absence (control) or in the presence of different amine oxidase inhibitors that were used at 100 μM concentration. Data represent mean ± SEM of six different assays and are expressed as percentage of control. Absolute control values were much higher (>10-fold) in DMEM + FBS than in Krebs buffer, as shown in Figures 2 and 3. See text for further details.*p < 0.01 vs. control; §p < 0.01 vs. iproniazid; §§p < 0.01 vs. aminoguanidine, iproniazid, and pargyline by Tukey's test after one-way ANOVA. Color images available online at
These results were compared to those obtained using Krebs buffer. As expected, after 240 minutes of incubation, TA1 production was about 10-fold lower than observed in DMEM + FBS (compare Figs. 2 and 3). The response to amine oxidase inhibitors was different, since iproniazid was more effective than semicarbazide in reducing TA1 production, while aminoguanidine and pargyline showed intermediate potency (Fig. 6, right panel).
Although this investigation was projected to evaluate a specific in vitro model, namely T1AM addition to FBS, a few experiments were performed to determine whether the reported effects were also apparent in tissue homogenates or in human blood (Fig. 7). In rat liver and brain homogenate, the recovery of exogenous T1AM after 240 minutes of incubation averaged 26.5 ± 1.5% and 64.0 ± 4.0%, respectively (p < 0.01 vs. baseline in both cases), and no metabolite was detected. D4-T1AM recovery was similar in the liver (32.5 ± 3.5%) and significantly higher in the brain (91.5 ± 2.5%; p < 0.01 vs. T1AM recovery). In human plasma, the kinetics of T1AM decrease was much slower, but the pattern was similar. In particular, after 72 hours, T1AM decreased to 59.0 ± 3.0% of the baseline (p < 0.01), while d4-T1AM was virtually unchanged.
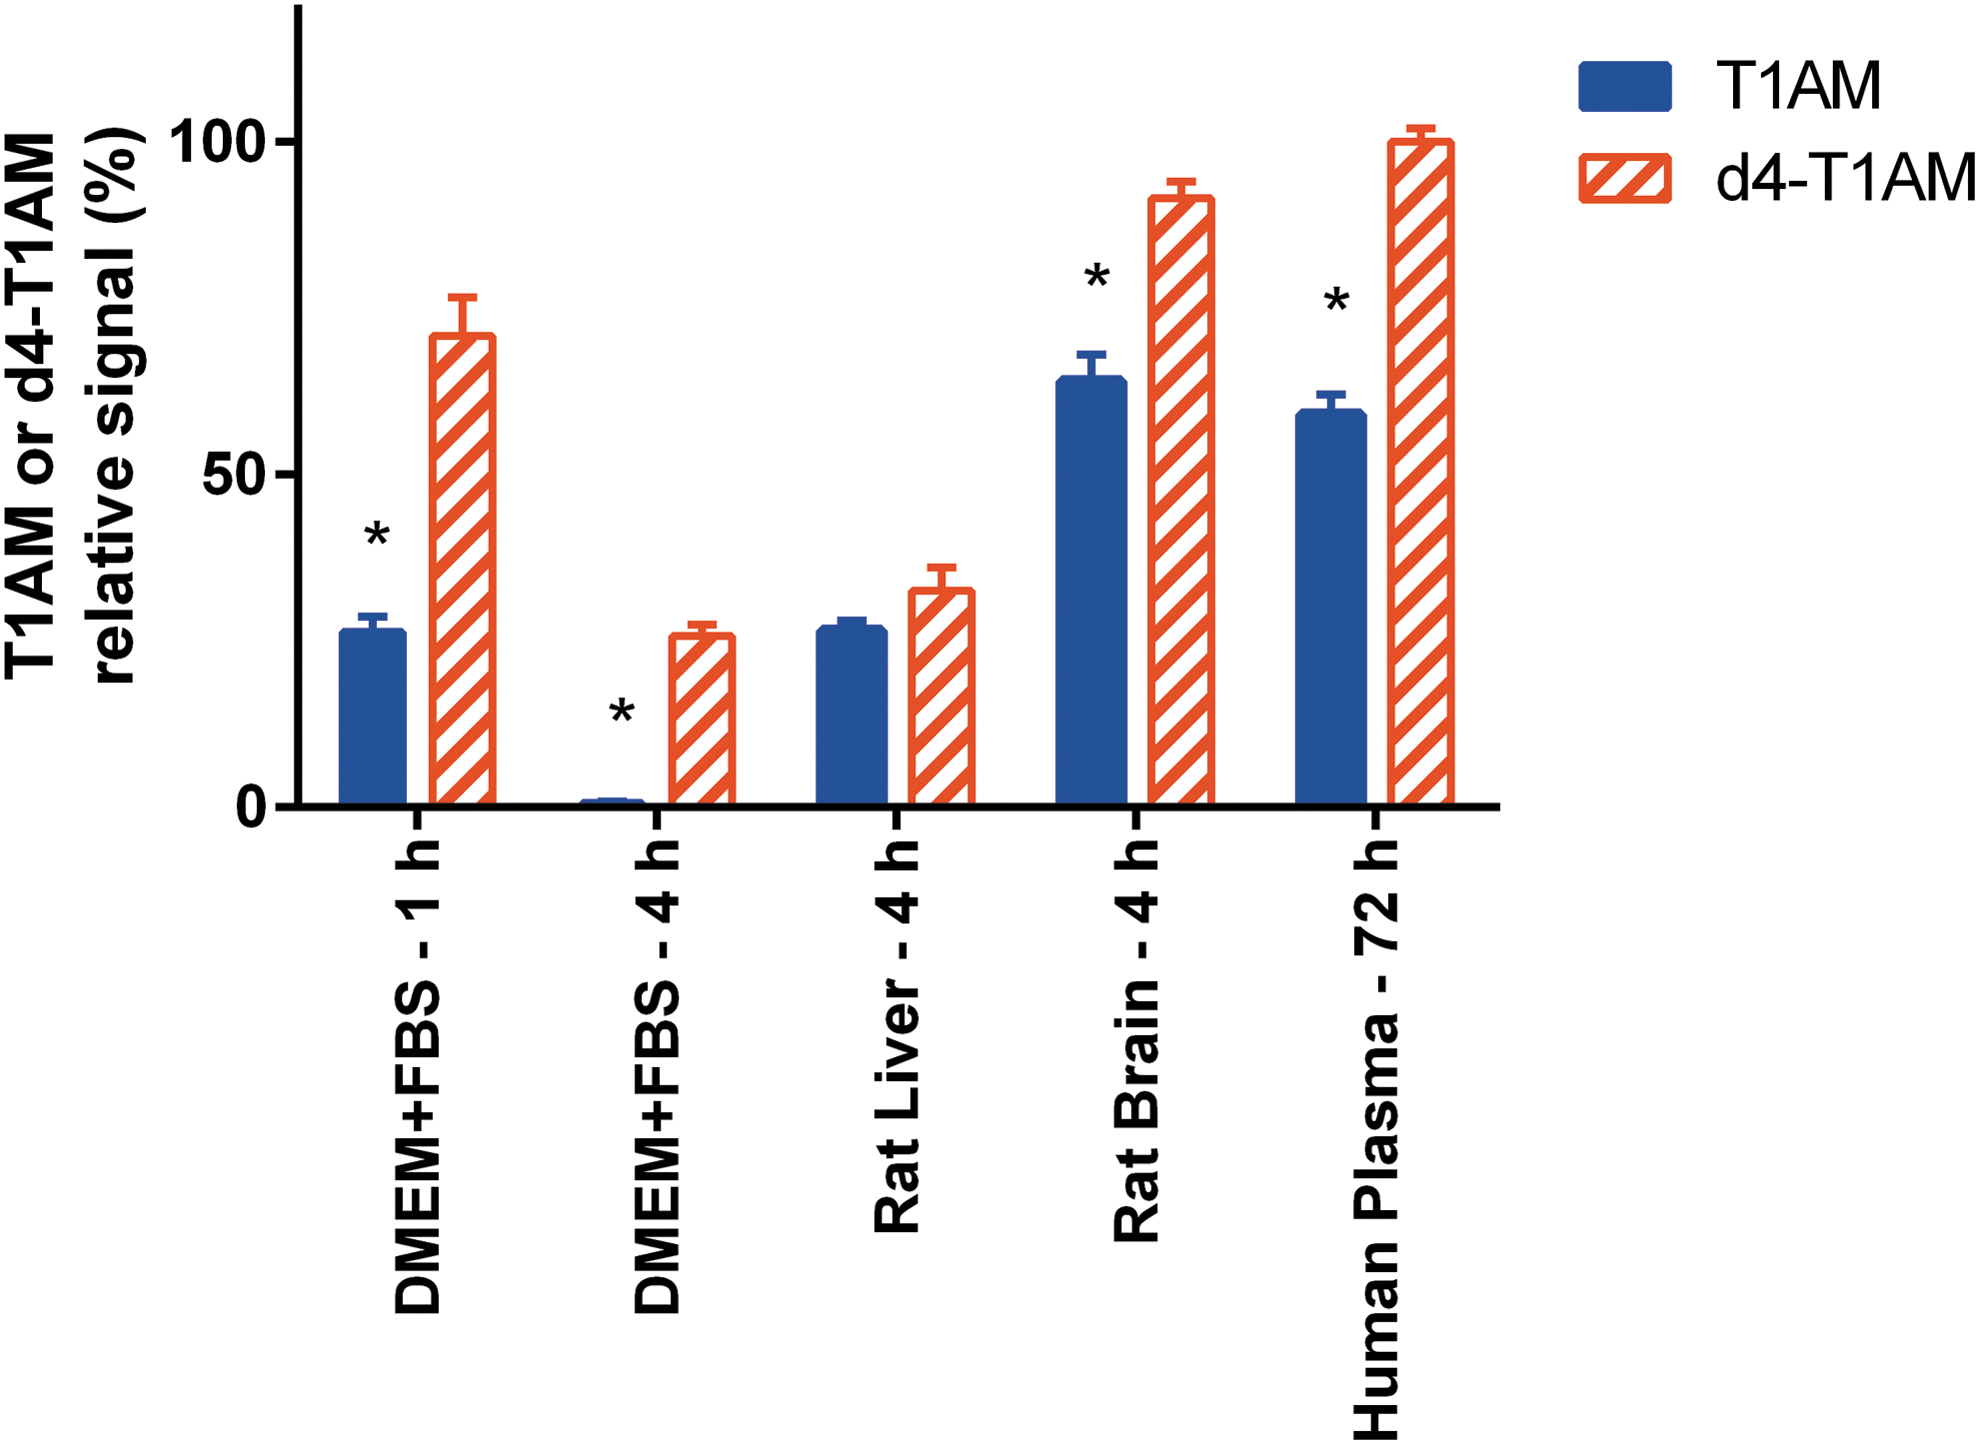
Comparison of time-dependent decay of T1AM and d4-T1AM in DMEM + FBS, rat tissue homogenates, and human plasma. Data are shown as relative signal (i.e., percentage of time 0) and are expressed as mean ± SEM of two to four different assays. No significant signal was detected for TA1 or other T1AM metabolites. *p < 0.01 for the difference between T1AM and the corresponding d4-T1AM by Tukey's test after two-way ANOVA. Color images available online at
In whole human blood, T1AM decrease was confirmed, and after 72 hours, T1AM and d4-T1AM recovery averaged 14.0 ± 1.5% versus 45.4 ± 1.8%, respectively (p < 0.01 vs. baseline in both cases, and p < 0.01 for T1AM vs. d4-T1AM). In addition, significant TA1 production was observed, corresponding to about 57.2 ± 6.9% of baseline T1AM. For this reason, the response to amine oxidase inhibitors in human blood was also tested. As shown in Figure 8, only the combination of semicarbazide and iproniazid significantly reduced TA1 release (to 6.0 ± 0.2% of baseline; p < 0.01), which was associated with increased but still incomplete recovery of T1AM and d4-T1AM (66.0 ± 2.0% and 68.0 ± 1.9%, respectively; p < 0.01 in both cases). Iproniazid alone slightly increased T1AM recovery, while semicarbazide alone was ineffective.
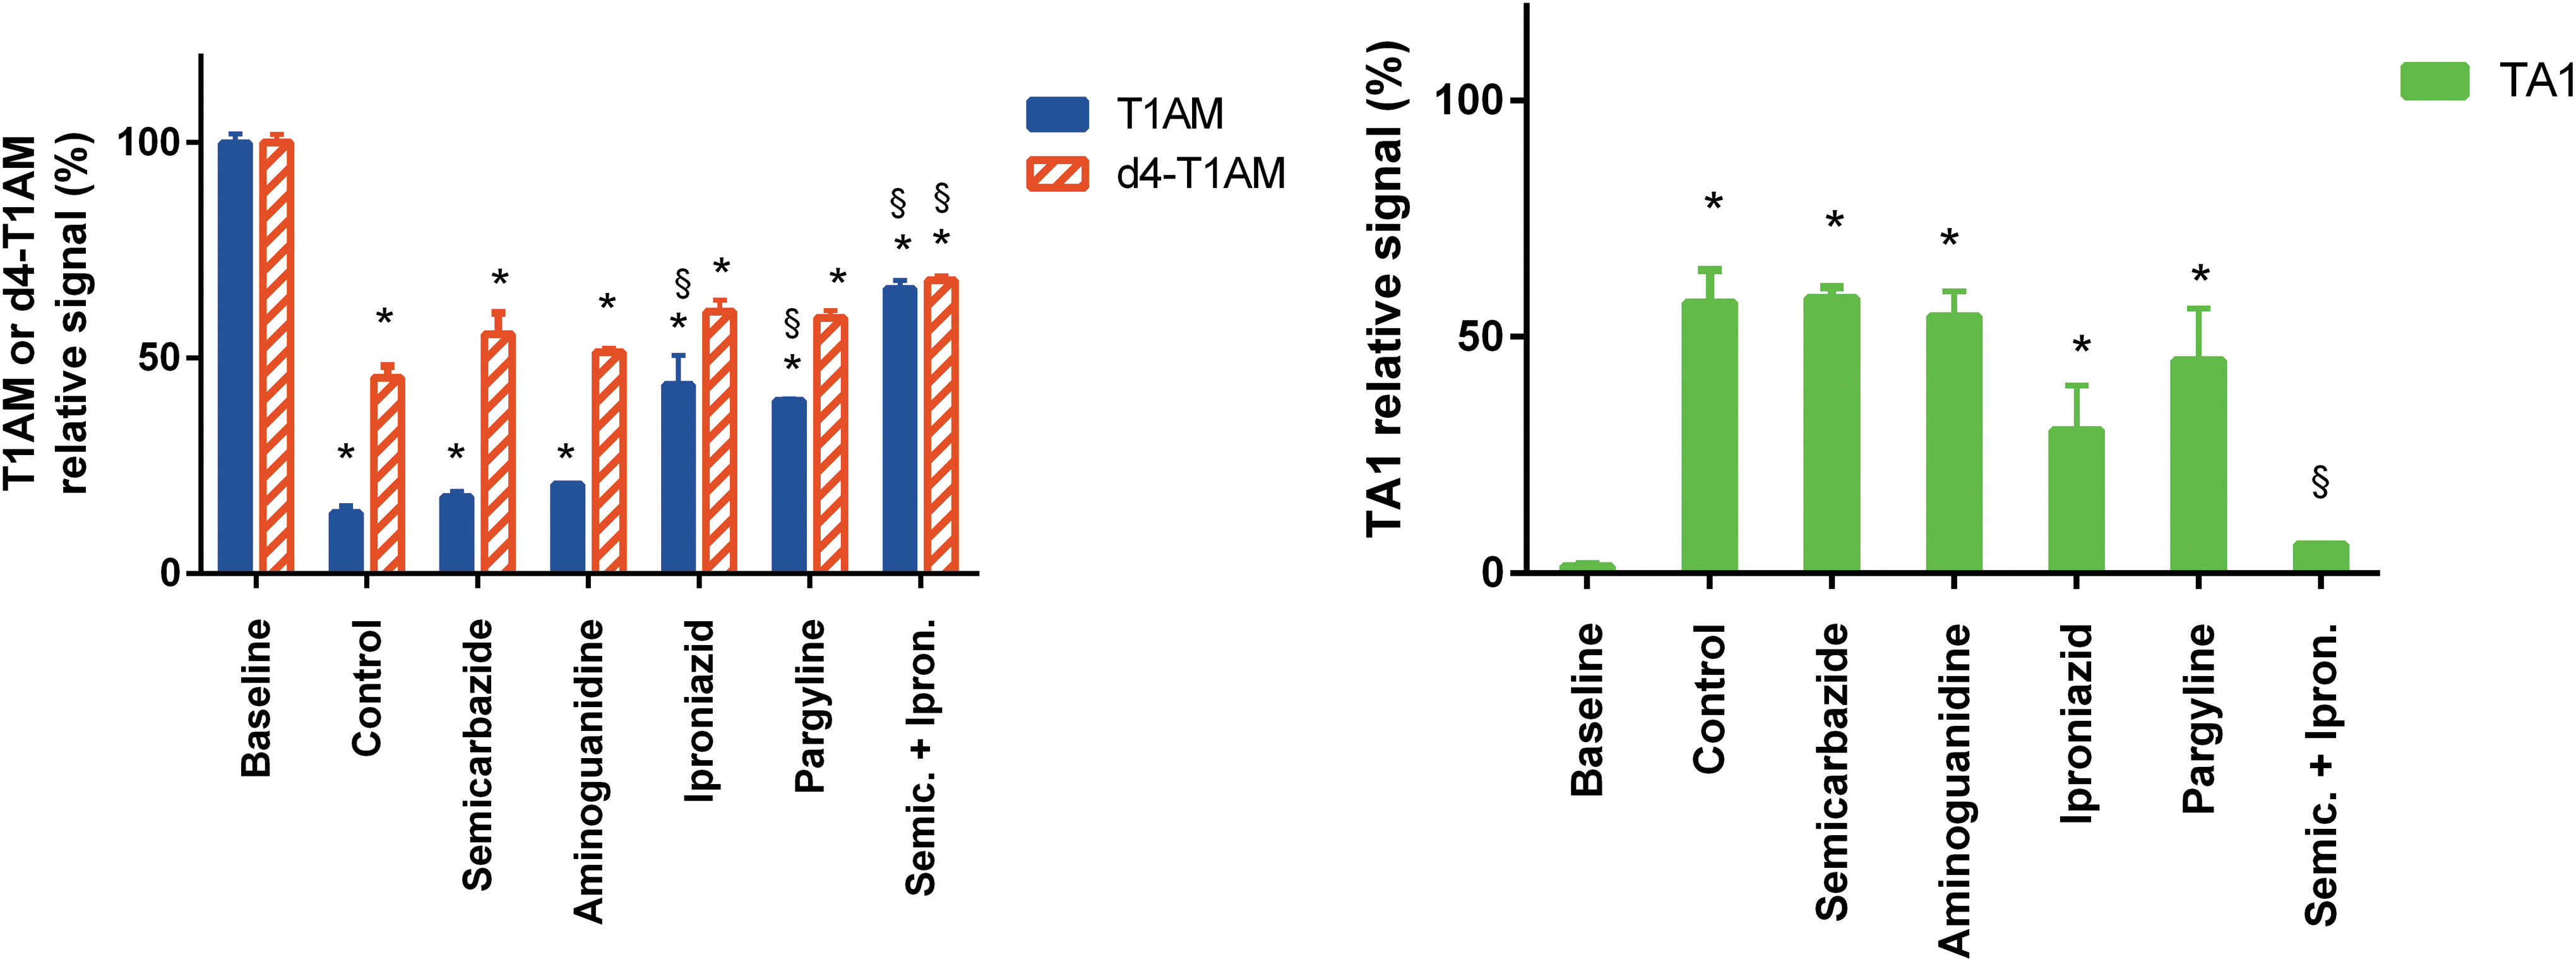
Human blood experiments. T1AM and d4-T1AM were added at time 0 (baseline). Assays were performed at the baseline and after 72 h of incubation in the absence (control) or in the presence of different amine oxidase inhibitors at 100 μM concentration. Data represent mean ± SEM of three to five different assays. T1AM and d4-T1AM (left panel) are expressed as relative signal (i.e., as percentage of time 0). TA1 signal (right panel) is represented as described in the legend to Figure 2. *p < 0.01 vs. the corresponding baseline group; §p < 0.01 vs. the corresponding control group by Tukey's test after two- or one-way ANOVA. Color images available online at
It was originally assumed that d4-T1AM oxidative deamination would yield d2-TA1, since deuterium atoms are located in the methylene groups of the ethylamine chain (Fig. 9). Although no d2-TA1 standard was available, the mass spectrometer was set on the basis of its putative transitions, but only minimal amounts of d2-TA1 were detected in the experimental settings in which significant TA1 production occurred (i.e., those shown in Figs. 4 and 8). To investigate this issue further, only d4-T1AM was added to DMEM + FBS buffer in cell culture experiments, and TA1 and its potential deuterated isotopes (i.e. d1-TA1, d2-TA1, d3-TA1, and d4-TA1) were determined. After 2–4 hours of incubation, the ratio d2-TA1:d1-TA1:TA1 was in the order of 1:5:22. “Spontaneous” d4-T1AM oxidation was also evaluated after 24 hours of incubation of the same medium in the absence of cells, and the ratio d2-TA1:d1-TA1:TA1 turned out to be similar, namely 1:6:45. Thus, isotopic exchange apparently occurs during d4-T1AM oxidation.

Scheme of the putative pathways of T1AM oxidation. A variety of amine oxidases (e.g., SSAOs and MAOs) can oxidize T1AM to 3-iodothyroaldehyde that exists as an equilibrium between the ketonic and enolic forms. Further oxidation to TA1 can be catalyzed by aldehyde dehydrogenase. Aldehydes are highly reactive compounds and might react with amine groups yielding Schiff bases, even in the absence of specific enzymes. In the bottom part of the figure, the putative conversion of d4-T1AM into d2-TA1 is shown. Deuterium/hydrogen exchange in the ethylamine chain leads to the production of either d1-TA1 or TA1. See text for further details.
Discussion
This article reports a peculiar phenomenon observed in FBS-containing media, namely the spontaneous decrease in mass spectrometry-detectable T1AM, with a remarkable kinetic isotope effect, since d4-T1AM decrease was much slower.
This phenomenon apparently depends on specific serum proteins, since it was abolished by protein denaturation or hydrolysis, but it was not reproduced by albumin or IgG. No T1AM metabolites accounting for the missing fraction were detected, but remarkable TA1 production was observed when the medium was exposed to cell cultures, suggesting that T1AM, or in general some TA1 precursor, was still available. Actually, TA1 production was much lower when cells were incubated with Krebs buffer or DMEM.
Spontaneous decrease in detectable T1AM was also observed in brain and liver homogenates and in human plasma and blood, although the kinetics was slower than in FBS. Isotopic difference was confirmed in all cases, except for liver homogenate.
These findings might help part of the problems linked to the assay of endogenous T1AM in serum to be understood (3,4). Techniques based on mass spectrometry yielded endogenous concentrations in the order of 100 pM (i.e., >100-fold lower than immunological assays) (5,7 –12). Negative results have also been described (6), and several investigators reported that the assays occasionally showed high variability. The present results suggest that T1AM metabolism and/or sequestration may remarkably impair the possibility of detecting it. In addition, the isotope effect observed with d4-T1AM versus T1AM might contribute to underestimate endogenous T1AM. On the other hand, immunological methods should also be reconsidered. Recently published papers relied on calibration curves obtained in PBS (12). Because of the potential effect of serum proteins, calibration should be performed in the presence of T1AM-free serum.
The molecular mechanisms responsible for these findings remain to be determined. If T1AM becomes undetectable because of noncovalent protein binding, resisting the liquid–liquid extraction procedure, in principle it should be possible to recover it by applying more drastic treatments. In the present experiments, protease K and urea could not rescue exogenous T1AM. A few tests with ethyl acetate or solid phase extraction were also negative, but it should be acknowledged that alternative extraction procedures were not systematically investigated. It would be interesting to determine whether T1AM can be detected by the antibodies that have been used in human immunoassays (10).
Intriguing findings were obtained with amine oxidase inhibitors. In DMEM + FBS, semicarbazide substantially reduced T1AM decrease. FBS is particularly rich in SSAOs, probably derived from membrane-bound leukocyte adhesion molecule VAP-1, also known as copper-dependent amine oxidase 3 (18,19). The immediate product of amine oxidation is an aldehyde (Fig. 9). Thus, it can be hypothesized that T1AM was converted into its aldehyde derivative, while TA1 production required a further oxidative step that could not occur in FBS but was catalyzed by cellular aldehyde dehydrogenase(s).
Cells exposed to exogenous T1AM in Krebs buffer also produced TA1, but the extent of TA1 production was lower and the metabolic pathway was apparently different, since it was inhibited by iproniazide and was less sensitive to semicarbazide. Under these conditions, amine oxidation was probably catalyzed by intracellular MAOs.
To test the aldehyde hypothesis, the study looked for 3-iodothyroaldehyde through the LC-MS/MS equipment, on the basis of its theoretical selective reaction monitoring parameters, but no signal was detected. In other experiments, exogenous aldehyde dehydrogenase was added to FBS, but no TA1 production was observed. These observations are not consistent with the presence of free aldehyde, but they do not exclude that 3-iodothyroaldehyde may spontaneously form adducts with nucleophilic reagents (e.g., protein amine and/or sulfhydryl groups) as many aldehydes are known to do (20). An alternative hypothesis is that SSAOs, or in general semicarbazide-sensitive proteins, might simply bind T1AM, even though unable to oxidize it (e.g., as a Schiff base with the 2,4,5-trihydroxyphenylalanine quinone prostetic group). If this is the case, protein binding should also favor cellular uptake and/or further metabolism, accounting for the remarkable TA1 production observed in DMEM + FBS.
However, semicarbazide did not abolish T1AM disappearance, suggesting that, besides semicarbazide-sensitive proteins, other components of FBS can sequester T1AM and target it toward cellular oxidation. Similar mechanisms may apply to human blood, where semicarbazide sensitivity was minimal, and significant T1AM decrease was also observed when TA1 production was prevented by the association of iproniazid and semicarbazide. Roy et al. (13) showed that apo-B100 containing lipoproteins bind T1AM with high affinity, and favor its cellular uptake through endocytosis. Oxidized LDL include aldehyde groups (21), which might react with organic amines, yielding Schiff bases. However, this hypothesis should be tested by further investigations. Further analysis will also be necessary to unravel the reactions occurring in tissue homogenates, where preliminary experiments suggested that the response to amine oxidase inhibitors varied from tissue to tissue.
This study also investigated the specificity and the concentration dependence of the observed phenomenon. Spontaneous decrease in DMEM + FBS was not observed with T3, T4, or tyramine, a biogenic amine that shares with T1AM a high affinity for trace amine associated receptor 1 (1). In addition, the kinetics of T1AM decrease was not modified in the presence of tyramine or noradrenaline. However, a significant decrease occurred for non-iodinated thyronamine (T0AM), although the kinetics was slightly slower than observed with T1AM. These results suggest that the phenomenon is fairly specific concerning arylalkylamines with a 4′-hydroxyphenoxy group. It would be interesting to test thyronamines with higher iodination (i.e., T2AM, T3AM, and T4AM), and to search for specific amine oxidases requiring a bulky aromatic side chain in their substrates.
Regarding concentration dependence, no significant difference in kinetic parameters was observed within the range 2.8–140 nM of T1AM, while the half-life increased at higher concentrations, particularly with 1.4 μM of T1AM. Thus, although no conclusive evidence of saturation was detected, the phenomenon appeared to be attenuated in the micromolar range.
Specificity and a non-linear concentration dependence may suggest an enzymatic reaction, or in general the interaction with specific protein binding sites. However, it should be acknowledged that in the absence of specific inhibitors, this hypothesis remains unproven. It is quite possible that the process requires both enzymatic and non-enzymatic steps. In particular, Schiff base formation might occur spontaneously under physiological conditions, as well as in these in vitro systems. Further attempts at clarifying whether and under which conditions the phenomenon is reversible might also provide additional information on its mechanism.
Two striking and unexpected findings were the different kinetics of T1AM versus d4-T1AM decay, and the isotopic shift observed upon d4-T1AM oxidation. Although isotopic preference has been reported for several enzymes, such a large difference (e.g., a 10-fold change in the rate constants, as observed in Fig. 1) is unusual. Isotopic effects of this magnitude have been described for the cleavage of carbon–hydrogen bonds, particularly by flavoprotein oxidases (22) and by copper-containing SSAOs (23). This supports the hypothesis that interaction with amine oxidases, at least up to the stage of hydrogen extraction, plays a crucial role in spontaneous T1AM decay.
The very low percentage of deuterated TA1 observed upon d4-T1AM administration suggests hydrogen/deuterium exchange occurring in the beta carbon of the ethylamine side chain. Amine oxidases remove hydrogen form the alpha, but not from the beta, carbon. However, cleavage of beta C–H bond might be due to keto-enol tautomerism after aldehyde formation (Fig. 9). Hydrogen-deuterium exchange on C–H bonds can also be induced by a large number of metal complexes (24), but the relevance of specific metal-containing catalysts in the cellular environment, and the identity of their substrates, are largely unknown.
In any case, T1AM isotopes labeled with deuterium on the ethylamine chain do not appear as a proper internal standard. Different standards, such as C13-labelled T1AM, will be necessary to develop a reliable analytical method of T1AM assay in biological matrixes by mass spectrometry–based techniques, and they should be specifically tested for isotopic effects. The addition of amine oxidase inhibitors (e.g., semicarbazide and/or iproniazid) might also be appropriate.
In conclusion, a time-dependent decrease is reported in the detection of exogenous T1AM added to FBS, tissue homogenates, and human blood, with isotopic preference for T1AM over d4-T1AM. This is probably due to the binding and sequestration of T1AM and/or its aldehyde derivative by proteins whose identity is still poorly defined. These issues reveal novel features of thyronamine biology and might account for the technical problems complicating the analytical assay of endogenous T1AM.
Footnotes
Acknowledgments
This work was partly supported by a grant from the University of Pisa to RZ (PRA_2016_43).
Author Disclosure Statement
There is no conflict of interest to disclose for any author, and in particular no competing financial interests exist.