
Abstract
Background:
Studies show that a significant portion of laboratory testing is unnecessary. Thyroid tests are some of the most commonly ordered laboratory tests. Yet, little is known about practice patterns for laboratory testing for thyroid disease. The objective of this study was to collect data on practice patterns for thyroid testing in the United States.
Methods:
A survey was conducted to collect data on annual test volumes for thyrotropin (TSH), free thyroxine (fT4), total thyroxine (TT4), free triiodothyronine (fT3), total triiodothyronine (TT3), triiodothyronine uptake (T3U), reverse triiodothyronine (rT3), and complete blood counts (CBC). Sites were also asked to provide data on laboratory utilization management activities. Thyroid workup rates were compared using the TSH/CBC ratio. Thyroid test selection patterns were compared using the ratio of order volumes for thyroid tests relative to TSH.
Results:
Data were obtained from 82 sites. The thyroid workup rate (TSH/CBC) was higher for outpatients (0.26) than for inpatients (0.03). Based on median values, sites ordered 14 fT4, three TT4, four fT3, two TT3, 0.1 rT3, and 0.1 T3U for every 100 TSH orders. The majority (approximately 90%) of orders for T4 were for fT4 rather than TT4. Orders for T3 were almost evenly split between fT3 and TT3. There was significant practice variation in test selection for all tests. The highest variability was for the rT3/TSH and T3U/TSH ratios. Most organizations reported at least some laboratory utilization management activities. There was a weak relationship between utilization management initiatives and the quality of orders for thyroid tests.
Conclusions:
There is considerable practice variation in thyroid testing, which suggests a need for better guidance in test selection. Based on the current sample, some organizations could significantly improve the quality of thyroid testing and reduce testing costs.
Introduction
H
Thyroid tests are some of the most commonly ordered laboratory tests. A study in New Zealand showed that approximately one in six office visits is associated with a thyroid test (9). Screening for thyroid disease increased significantly from 1978 to 2010 (10,11). A 1985 study estimated that the cost of thyroid testing in the United States was nearly $1 billion (12). Based on more current figures, the costs associated with thyrotropin (TSH) and free thyroxine (fT4) testing are approximately $1.6 billion per year in the United States assuming a population of 320,000,000, a TSH testing rate of 0.16 per person year, and a fT4/TSH rate of 0.56, with a Medicare reimbursement rate of $23.80 for TSH and $12.39 for fT4 (testing rates estimated from Table 2). Although clinical practice guidelines have been developed (13 –16), studies have shown wide variability in thyroid testing practice (17 –27). For example, recent studies in Spain showed wide variation in ordering patterns for fT4 (28). A study in the United Kingdom found a sixfold variation in the rate of thyroid testing and found that only 24% of the variation could be explained by population differences (25). Another British study found a 57-fold variation between providers in orders for TSH (26). Such variation suggests that thyroid tests are often ordered inappropriately.
Testing patterns can vary due to differences in individual practice, hospital management (e.g., utilization management programs), or broad influences such as practice guidelines (29). Practice guidelines vary between countries but can also vary within one country. The American Thyroid Association and American Academy of Endocrinologists recommend routine screening for thyroid disease at five-year intervals starting at 35 years of age, but the United States Preventative Health Task Force found insufficient evidence to recommend screening asymptomatic adults (15,30). Because of differences in guidelines, studies conducted in other countries have limited applicability to the U.S. context. Studies to assess current patterns of thyroid testing practice in the United States are needed.
Testing patterns are often compared by benchmarking studies (31 –33). Benchmarking was introduced in the 1980s and has now become a standard tool for quality improvement. Such studies can assess adherence to or the need for guidelines by demonstrating wide practice variation. Although a number of studies have provided data on thyroid testing in the United States, most of these studies were performed more than a decade ago and are now dated (20,34 –38). Thyroid testing methods have improved over the past decade, and as a consequence, testing practices and guidelines have evolved. Older studies use techniques that are no longer relevant. The previous study on thyroid testing in the United States only utilized data from a single tertiary care university clinical laboratory (UCSF) (20). The authors are not aware of any studies that have compared thyroid testing patterns in the United States. Finally, many institutions have initiated utilization programs, and it is unclear whether these programs are having an effect. The objectives of this study were to conduct a multi-institutional comparison of thyroid testing patterns, to assess appropriateness of testing, and to investigate whether laboratory utilization management programs are associated with improvements in thyroid testing.
Methods
Data collection
Data were collected through a voluntary web-based survey (see Supplementary Data S1; Supplementary Data are available online at
Data were also collected on laboratory utilization initiatives at each site (Supplementary Data, survey). Utilization management questions were grouped into four categories: (i) providing education and feedback, (ii) menu modification and order restriction, (iii) organizational-level programs (e.g., whether the organization has a laboratory utilization management committee), and (iv) thyroid-specific interventions (e.g., whether the endocrinology department had issued guidelines for thyroid testing). Category-specific scores were calculated by dividing the total number of affirmative responses by the number of questions in the category. Thus, each category score had a potential range of 0 to 1 for each site (a score of 0 would indicate that none of the utilization measures listed on the survey had been implemented, whereas a score of 1 would indicate a particular site had implemented all of the utilization measures on the survey). For example, for the education and feedback category, the survey asked whether organizations had implemented any of five interventions (Table 1). The education feedback score would be the number of affirmative responses divided by five. An overall utilization management score (UMS) was calculated by averaging the category scores at each site. The UMS score had a potential range of 0 to 1 and had the same interpretation as the category scores. The UMS was designed to provide a measure of the overall intensity of utilization management activity at each site.
Responses from 24 organizations regarding the use of various interventions to improve utilization. The first column lists the number (percentage) of organizations indicating that they use a particular method. The average perceived effectiveness and standard deviation (SD) are shown in the second column. Effectiveness was rated on a five-point scale (5 = “very effective,” 3 = “neutral,” 1 = ”not effective”).
The response to these questions were either yes/no/don't know; no perceived effectiveness score data was collected.
SD, standard deviation.
Data analysis
Testing volume was normalized to facilitate comparisons between sites. Data were normalized in two ways. First, the CBC was used as a measure of overall testing volume at each site, and the relative rate of thyroid testing was measured using the TSH/CBC ratio. This normalized measurement is referred to as the thyroid workup rate (TWR). Second, because thyroid testing almost always begins with a TSH, the volume of other thyroid tests (i.e., fT4, TT4, fT3, TT3, rT3, and T3U) was measured relative to the TSH testing volume. (The ratios are denoted TSH/CBC, fT4/TSH, etc.) These ratios are referred to as thyroid test selection ratios (TTSR). Each TTSR represents the number of specific thyroid tests per 100 TSH orders. For instance, a fT4/TSH ratio of 0.14 would translate to 14%, or 14 fT4 tests for every 100 TSH tests ordered (Table 2). The rationale for these ratios is as follows. Screening for thyroid disease generally begins with a TSH test (either as TSH alone or TSH plus fT4). The TSH/CBC ratio (TWR) was used as a measure of the relative rate of thyroid workups. Once thyroid testing is initiated, physicians may choose additional tests. The additional tests chosen were reflected by the TTSRs, which provided normalized measures that were used to compare the relative testing volume of individual tests between sites (31). Thus, TWR measures the rate at which thyroid workups are initiated, and TTSR measures the rate at which an individual test is selected (relative to TSH) once a thyroid workup is initiated. Ratios normalized to CBC and TSH have been applied in previous studies on vitamin D and thyroid testing, respectively (28,31)
Distribution of testing ratios for total testing (inpatient + outpatient) across sites.
Lower boundary calculated by using the 25th percentile (0.00009) because the 10th percentile was 0.
T3 = (fT3 + TT3); T4 = (fT4 + TT4).
Each row provides statistics for the ratio of order volume by patient status across many sites. C10 = 10th percentile; C90 = 90th percentile. The variability index is the ratio of the 90% to the 10% of the distribution.
TSH, thyrotropin; CBC, complete blood count; fT4, free thyroxine; TT4, total thyroxine; fT3, free triiodothyronine; TT3, total triiodothyronine; rT3, reverse triiodothyronine; T3U, triiodothyronine uptake.
The total volume of T4 and T3 testing were defined as follows: T3 = (fT3 + TT3), that is, either fT3 or TT3, or both; T4 = (fT4 + TT4), that is, either fT3 or TT3, or both. The ratio of fT3 and fT4 relative to the total volume of T3 and T4 testing were calculated as follows: fT3/T3 = fT3/(fT3 + TT3); fT4/T4 = fT4/(fT4 + TT4). The ratio of the total volume of T3 testing to T4 testing was also calculated as follows: T3/T4 = (fT3 + TT3)/(fT4 + TT4). The various ratios and their interpretation are summarized in Appendix 1.
Quality assessment
Two measures were used to assess order quality: fT4/T4 and T3U/TSH. These were selected because recommendations for these tests are relatively clear. T3U is in general considered an obsolete test (39). It is generally ordered along with TT4 to provide a fT4 index (FTI). The FTI has largely been replaced by fT4. Similarly, fT4 is used more frequently than TT4 because it is considered a measure of the “bioactive” form of T4 (40). Thus, fT4/T4 and T3U/TSH were selected as measures of order quality. Higher ratios of fT4/T4 indicate higher quality. High ratios of T3U/TSH indicate poor quality. T3 should be ordered as a third-line test. However, no guidelines are available to indicate a reasonable value for the ratio of T3 to TSH testing. Similarly, there are no clear guidelines to evaluate the appropriateness of the fT4-to-TSH test volume ratio.
Statistical methods
All statistical calculations and graphing were performed using Stata v14 (Stata Corp. LLC, College Station, TX) and R v3.2.3. Distributions of inpatient and outpatient results between multiple sites were compared using the Kruskal–Wallis test. Results between academic versus non-academic hospital settings were compared via Mann–Whitney U-test. Variability was measured by calculating the ratio of the 90th percentile to the 10th percentile of a distribution to create a variability index. This measure of variability has been used in previous benchmarking studies (22,23,32,41). Variation (heterogeneity) of distributions was evaluated using Higgins I 2 statistic (42), as implemented by the metaprop command in Stata. The I 2 statistic is a measure of inconsistency and measures the proportion of total variation that can be attributed to differences between sites rather than sampling variation. Correlations between the UMS score and quality indexes (i.e., T3U/TSH, fT4/T4) were calculated using Spearman's rank correlation. Statistical significance was evaluated at the 0.05 level.
Results
Characteristics of participating sites
Data on testing volumes were received from 82 laboratories from 24 unique healthcare organizations. Thirteen organizations were academic medical centers. One large network of community hospitals had 51 sites. A second network of community hospitals had six sites. The annual volume of CBC orders (a measure of overall testing volume at each site) ranged from 3300 to 1,452,000 (median 37,800). Of 20 sites reporting bed sizes, two had <250 beds, four had 250–500 beds, and 14 had >500 beds. Hospital networks supplied test volume data for all sites but only supplied data on utilization management activities for the parent site.
Thyroid workup rate by patient group
The TWR (i.e., TSH/CBC; see Appendix 1 for explanation of ratios and abbreviations) for outpatients was significantly higher (Kruskal–Wallis χ2 = 19.0; p < 0.001) than for inpatients (Supplementary Fig. S1). The median TWR was 0.03 for inpatients and 0.26 for outpatients (Table 2). The TTSRs (see Data: Method Analysis; e.g., fT4/TSH) showed no significant differences between inpatients and outpatients (p > 0.05). Consequently, the inpatient and outpatient data were combined for the TTSRs, and TTSRs were expressed in terms of total testing.
Test selection rate
On average, 40% of thyroid workups involved a test for T4 (either fT4 or TT4; Fig. 1A; T4/TSH ratio ∼0.40). The majority of T4 tests were for fT4 (Table 2 and Fig. 2C). The fT4/T4 ratio ranged from 0.52 to 1.00 (median 0.90; Table 2 and Fig. 2C). The T3/TSH ratio ranged from 0 to 0.36 (median 0.07; Table 2 and Fig. 1B). T4 testing was performed more frequently than T3 (Fig. 1). The T3/T4 ratio ranged from 0 to 0.51 (median 0.23; Table 2 and Supplementary Fig. S2A). T3 testing was positively correlated with T4 testing (p = 0.02; Supplementary Fig. S2B) and was evenly divided between fT3 and TT3 (Fig. 2A and B and Table 2). The fT3/T3 ratio ranged from 0.08 to 1.00 (median 0.56; Table 2 and Fig. 2A). At most sites, T3U testing was infrequently ordered (Table 2 and Fig. 1C). On average, approximately 0.1% of thyroid workups included T3U (T3U/TSH ratio = 0.001; Table 2 and Fig. 1C). rT3 was rarely ordered as part of a thyroid workup (Table 2 and Fig. 1D). On average, only 0.1 rT3 was ordered for every 100 TSH (i.e., rT3/TSH ratio = 0.001; Table 2 and Fig. 1D). TTSRs for rT3 ranged from 0.00 to 0.04 (median 0.001; Fig. 1D). Based on median values, 14 fT4, three TT4, four FT3, two TT3, 0.1 rT3, and 0.1 T3U were ordered for every 100 TSH.

Comparison of test selection rates. The figure shows the distribution of the thyroid test selection ratio (TTSR) across surveyed sites. The y-axis presents the proportion of sites surveyed that had the corresponding TTSR ratio shown on the x-axis. TSH, thyrotropin; T4, total test volume for thyroxine (fT4 + TT4); fT4, free thyroxine; TT4, total thyroxine; T3, total test volume for triiodothyronine (fT3 + TT3); fT3, free triiodothyronine; TT3, total triiodothyronine; T3U, triiodothyronine uptake; rT3, reverse triiodothyronine. Each panel shows the ratio of annual test volumes (e.g., T4/TSH shows the ratio of the annual volume of T4 to TSH orders).
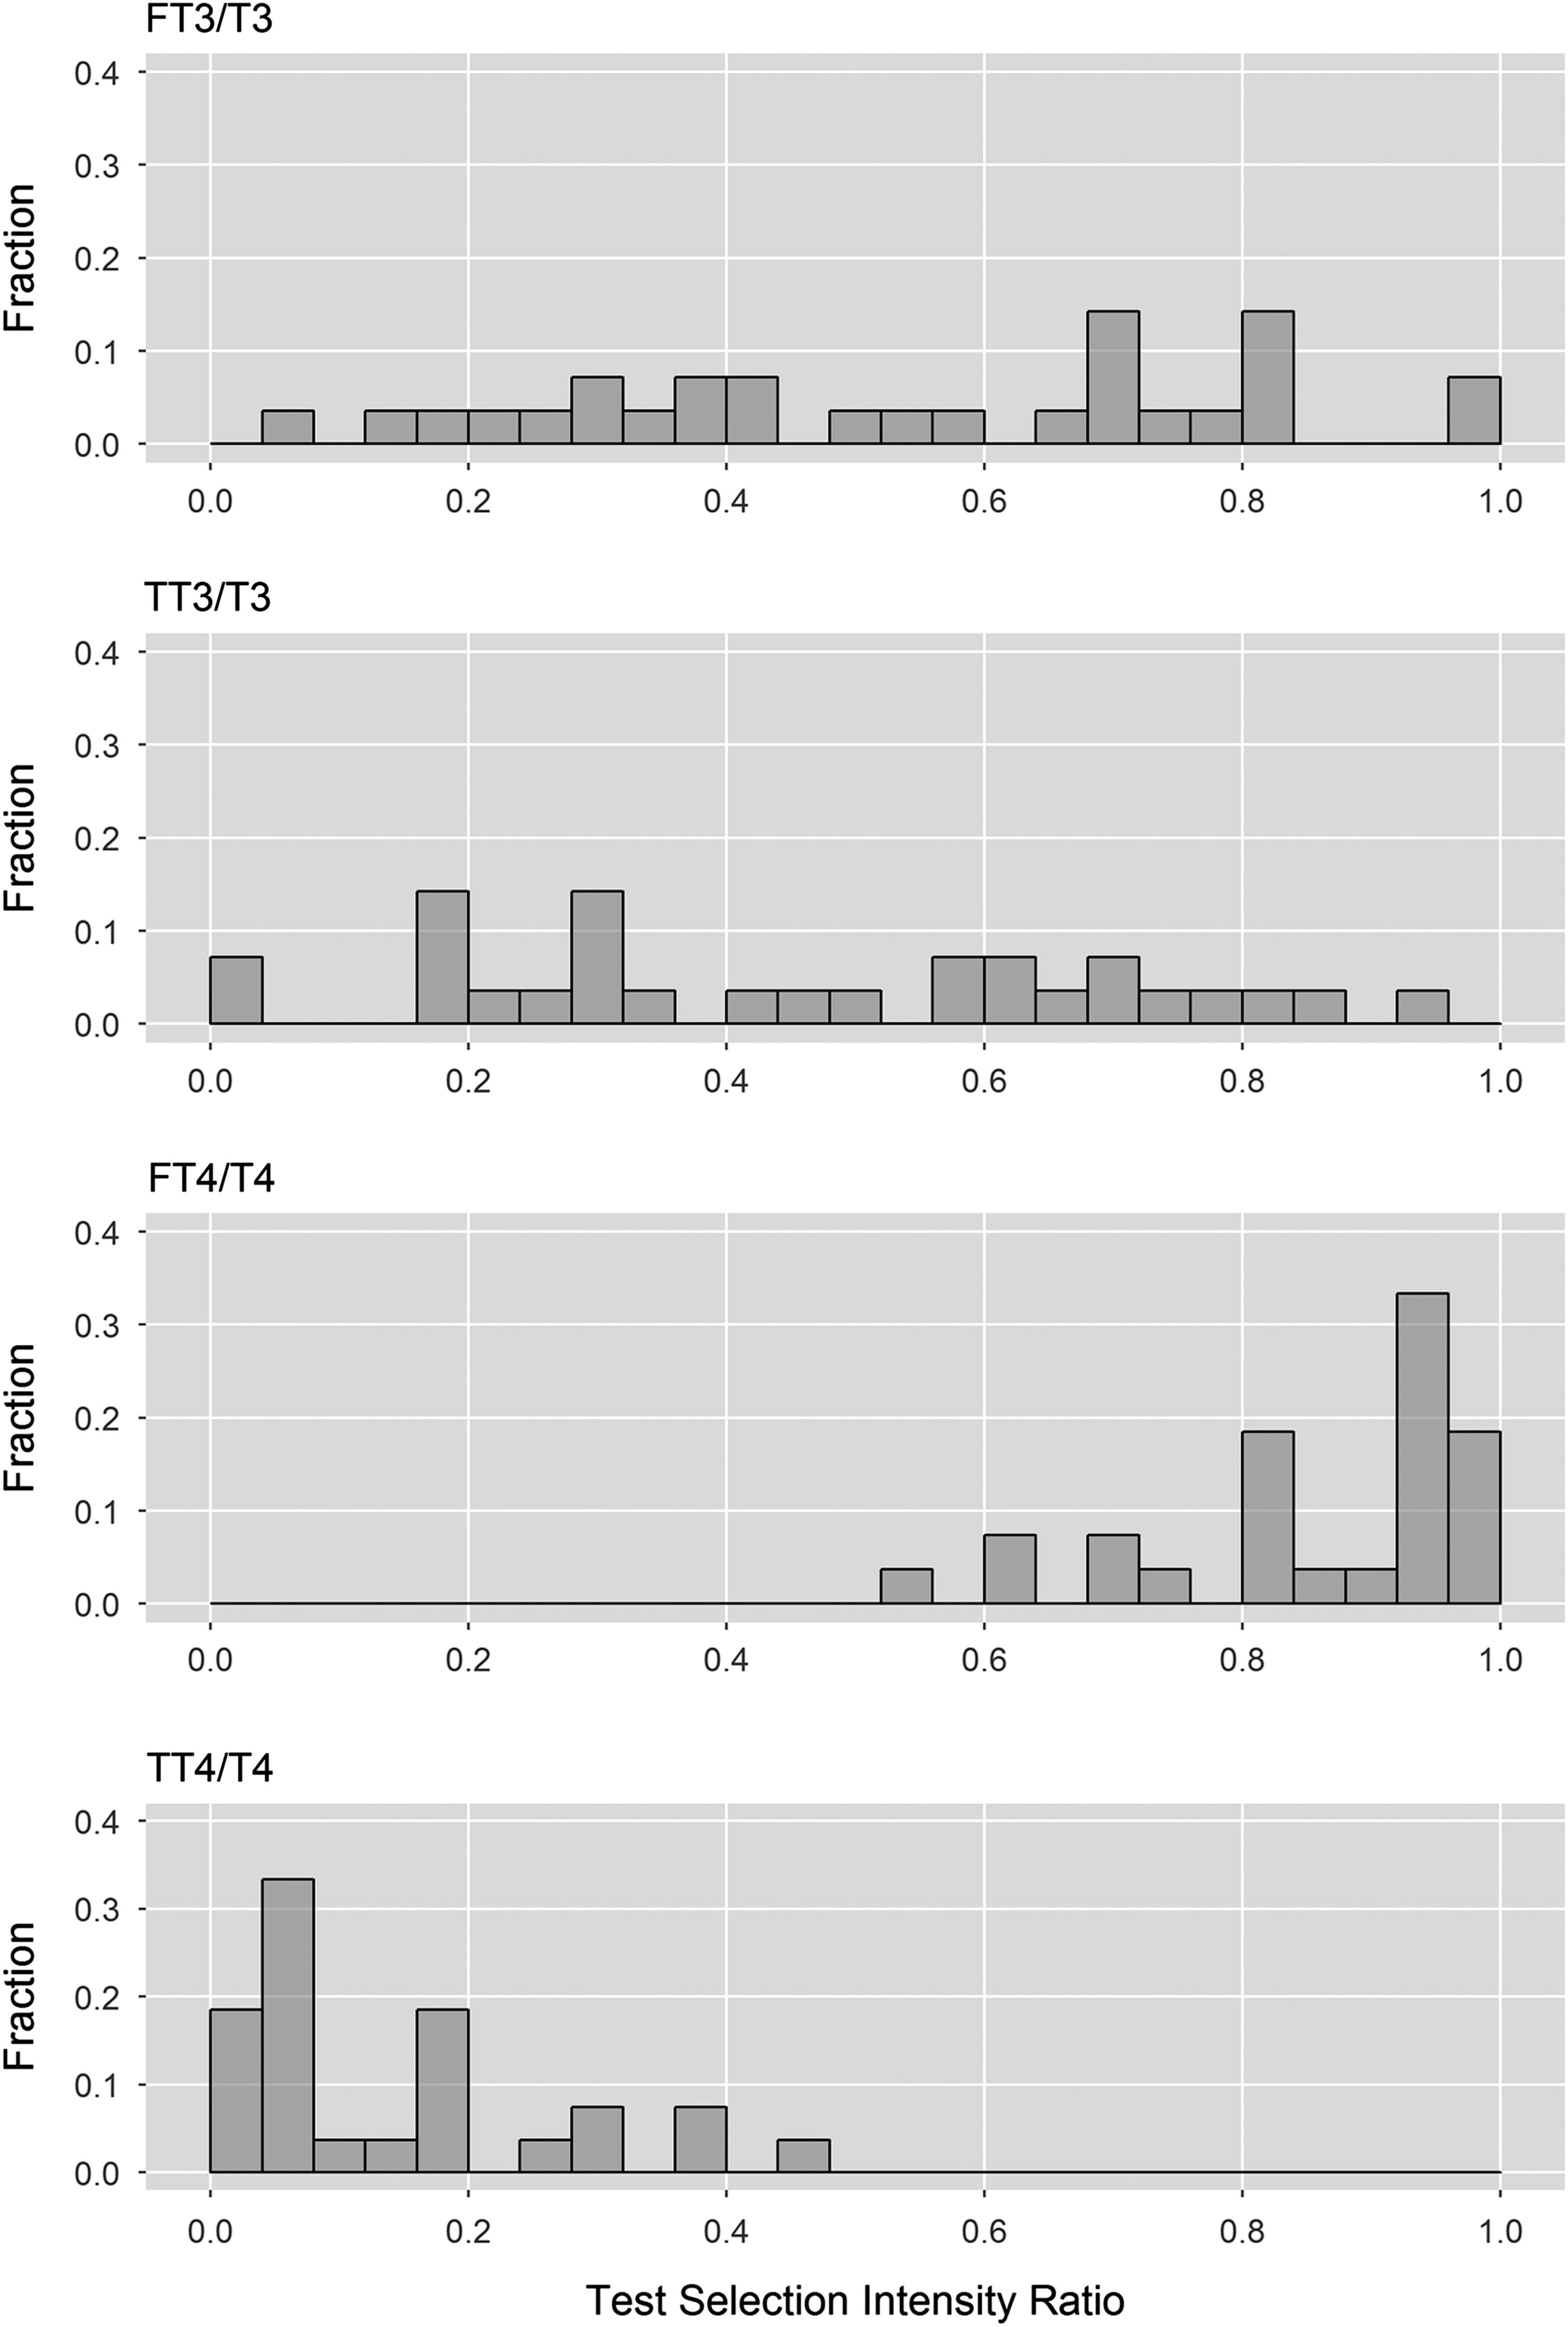
Distribution of test selection. The graph shows the distribution of test selection ratios by test category (T3 and T4) across surveyed sites. T3 = total test volume for triiodothyronine (fT3 + TT3); T4 = total test volume for thyroxine (fT4 + TT4). Each panel shows the ratio of annual test volumes (e.g., fT3/T3 shows the ratio of the annual volume of fT3 to the total volume of orders for T3).
Practice variation in thyroid testing
The distributions of TTSRs showed considerable practice variation (Table 2, Figs. 1 and 2, and Supplementary Figs. S3 and S4). The distributions of TTSRs all showed statistically significant heterogeneity (I 2 = 100%; p < 0.001). Variability indexes for test selection rates ranged from 1.6 to 88.9 (Table 2). rT3/TSH and T3U/TSH had the greatest variability indexes (36.7 and 88.9, respectively). TT4/TSH and TT3/TSH had intermediate variability (17 and 10, respectively). All other variability indexes were <5.
Several TTSR distributions were characterized by outliers. For example, T4/TSH typically ranged between 0.2 and 0.6 (Fig. 1A). However, one site had a T4/TSR ratio of 1.0, indicating that a T4 (fT4 or TT4) was ordered as frequently as TSH. The T3/TSH ratio was clustered between 0 and 0.2 (Fig. 1B). However, one site had a ratio of 0.36, indicating that one-third of TSH orders were accompanied by an order for T3 (fT3 or TT3) at that site. There were four sites that ordered high rates of T3U (Fig. 1C). The T3U/TSH ratio for these sites ranged from 0.08 to 0.15. All other sites had T3U/TSH ratios <0.01 (Fig. 1C). One site had a rT3/TSH ratio of 0.038. The next largest rT3/TSH ratio was 0.011. The majority were <0.001, or 0.1% (Fig. 1D).
The TWR also showed statistically significant practice variation (Supplementary Fig. S1). For inpatients, the TWR (TSH/CBC ratio) was generally clustered around 0.03. However, a few sites reported unusually high rates of thyroid workups (TWRs of 0.08, 0.10, and 0.16; Supplementary Fig. S1A). For outpatients, the TWR was clustered between 0.2 and 0.4. However, two sites had TWRs of 0.5 and 0.8 (Supplementary Fig. S1B).
The above-mentioned ratios were also compared between academic and non-academic hospital settings. It was found that some of the practice variation was associated with organization type (academic vs. non-academic). The TSH/CBC ratio was significantly higher (p < 0.05) in non-academic hospitals, while fT4/TSH, TT4/TSH, and T3/TSH ratios were significantly higher in academic hospital settings.
Utilization management and quality of test selection
Almost all participating organizations reported some level of engagement in utilization management activities (n = 24 provided utilization management survey responses; Table 2). The median UMS ranged from 0 to 0.77 (median: .45; Fig. 3). Of 24 organizations, six reported activities specific to thyroid utilization. fT4/T4 was positively correlated with UMS (r = 0.38), but the association was not statistically significant (Fig. 4A; p = 0.15). T3U/TSH had a statistically significant negative correlation with UMS (r = −0.54, p = 0.03; Fig. 4B). fT4/T4 was strongly correlated with T3U/TSH (Fig. 5; r = −0.91, p < 0.001).
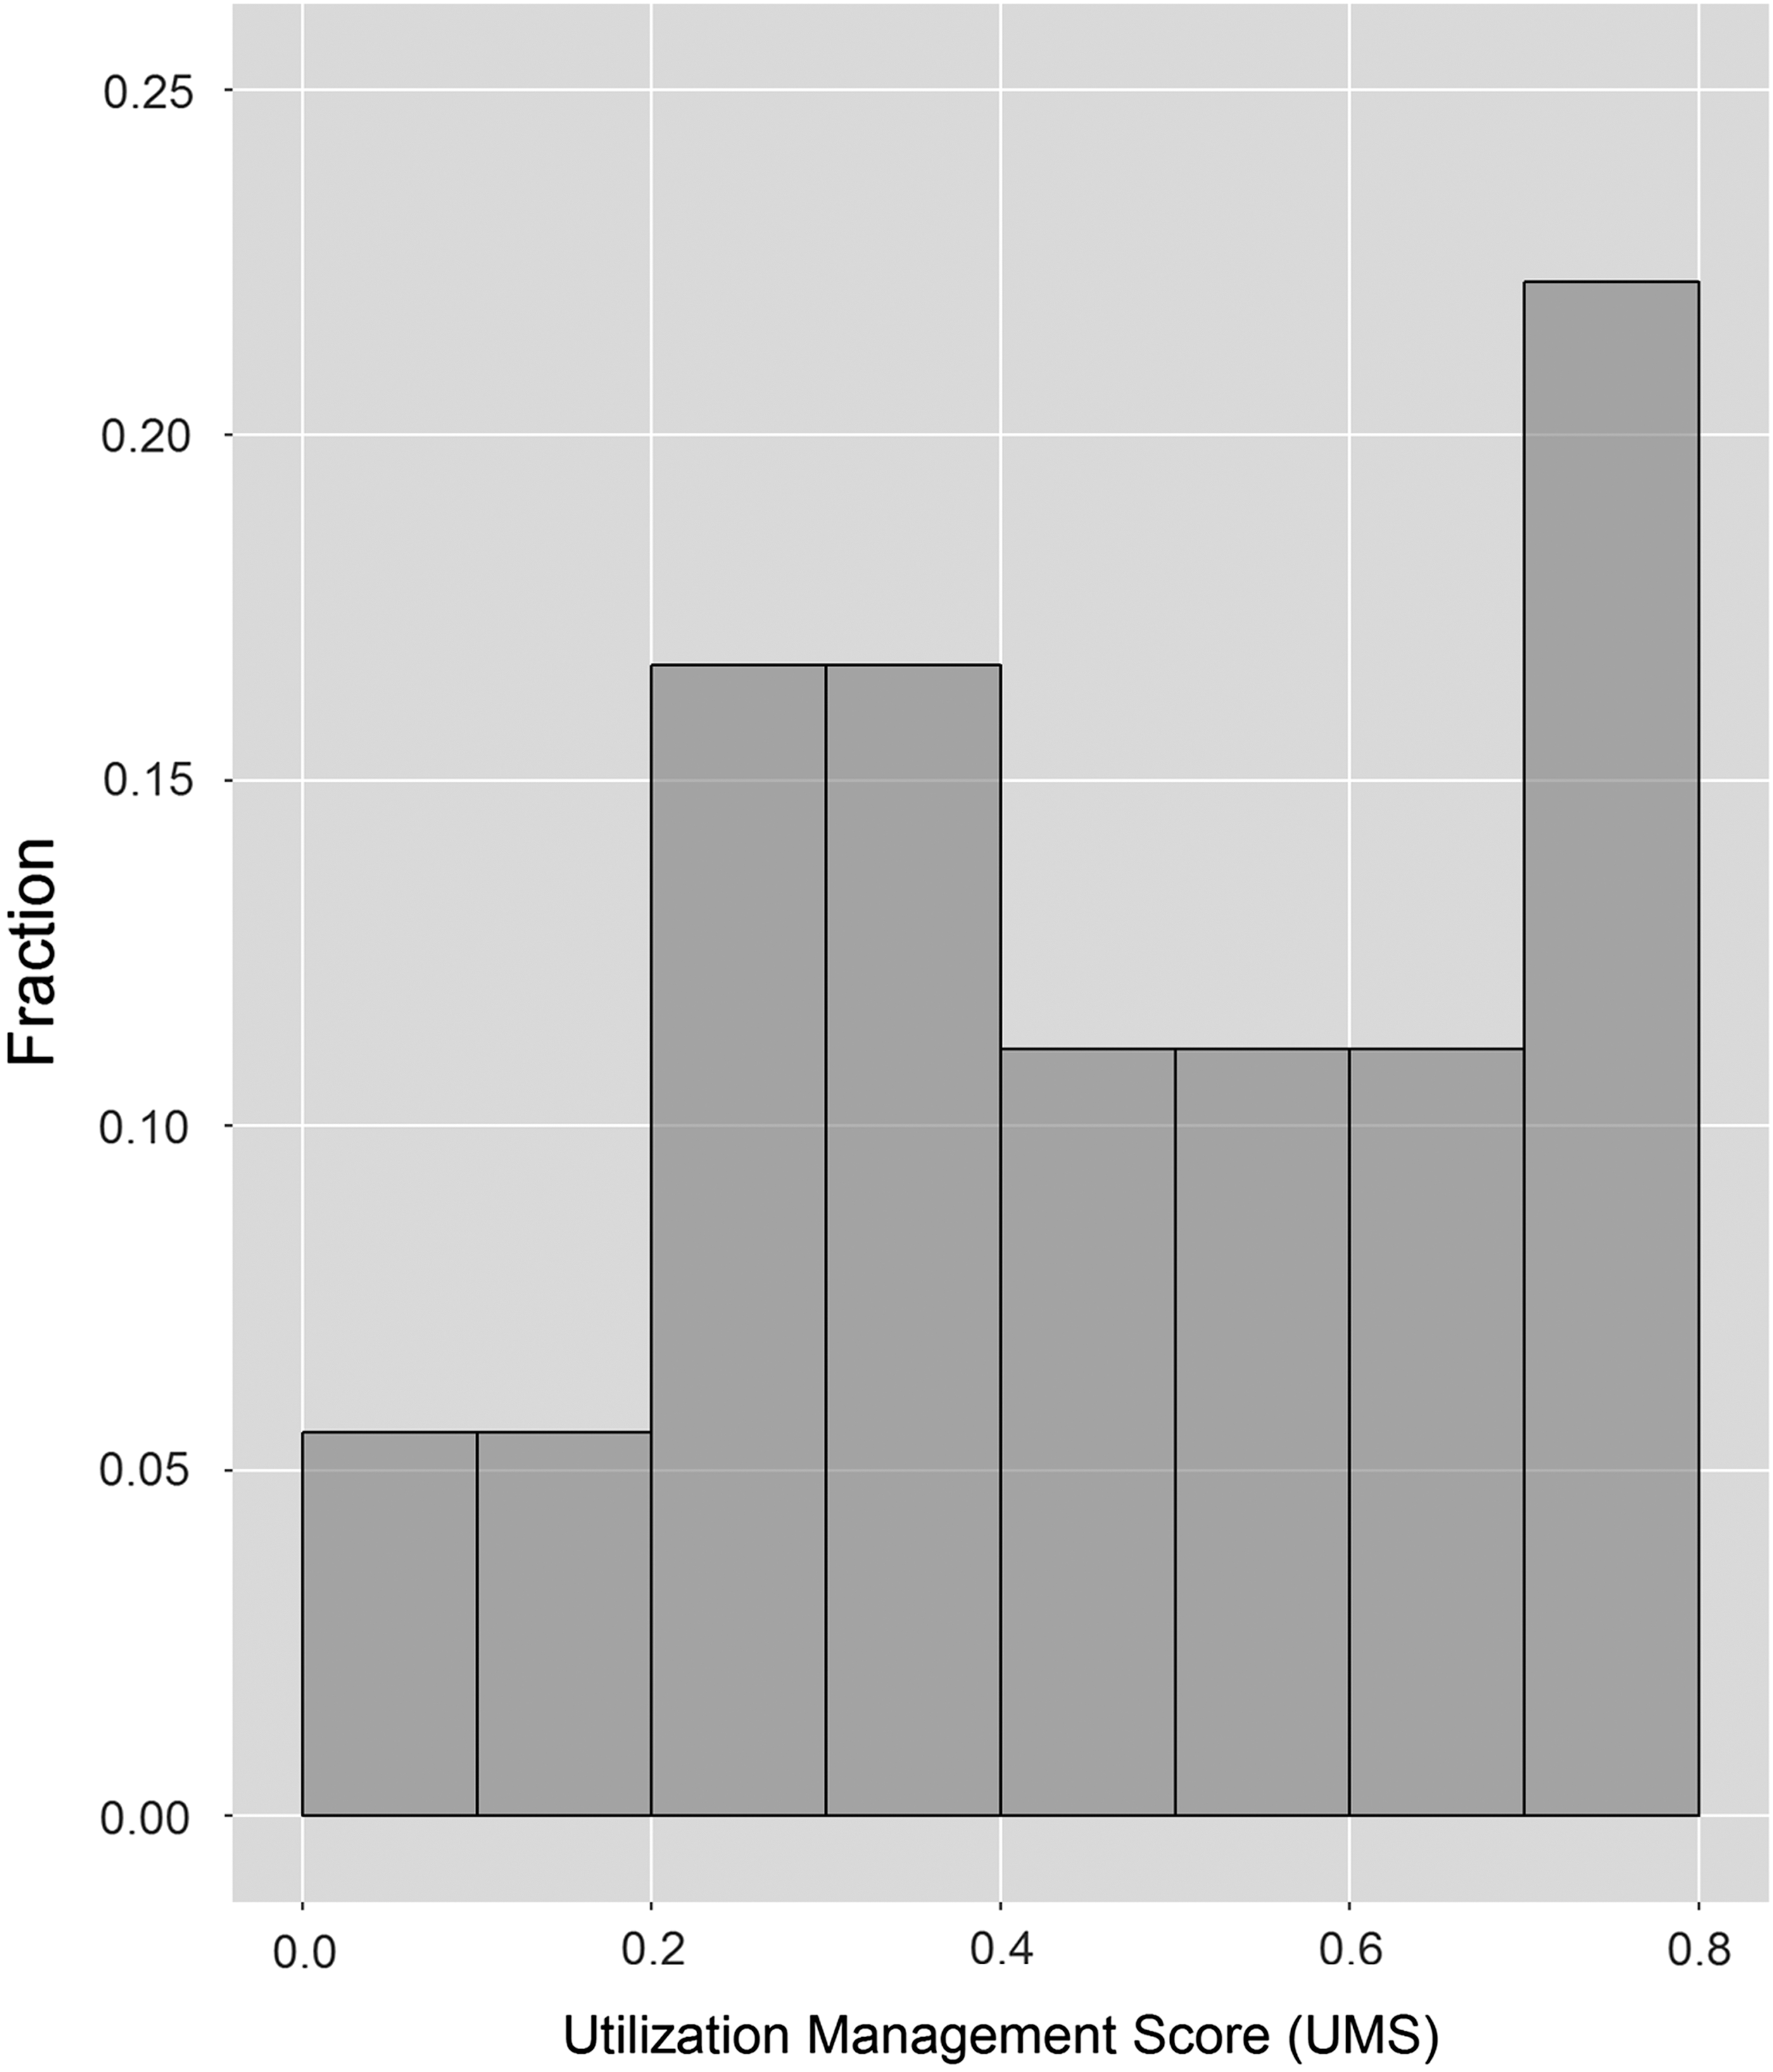
Distribution of utilization management scores (UMS). The graph shows the distribution of UMS based on sites that provide data on laboratory utilization management activities.
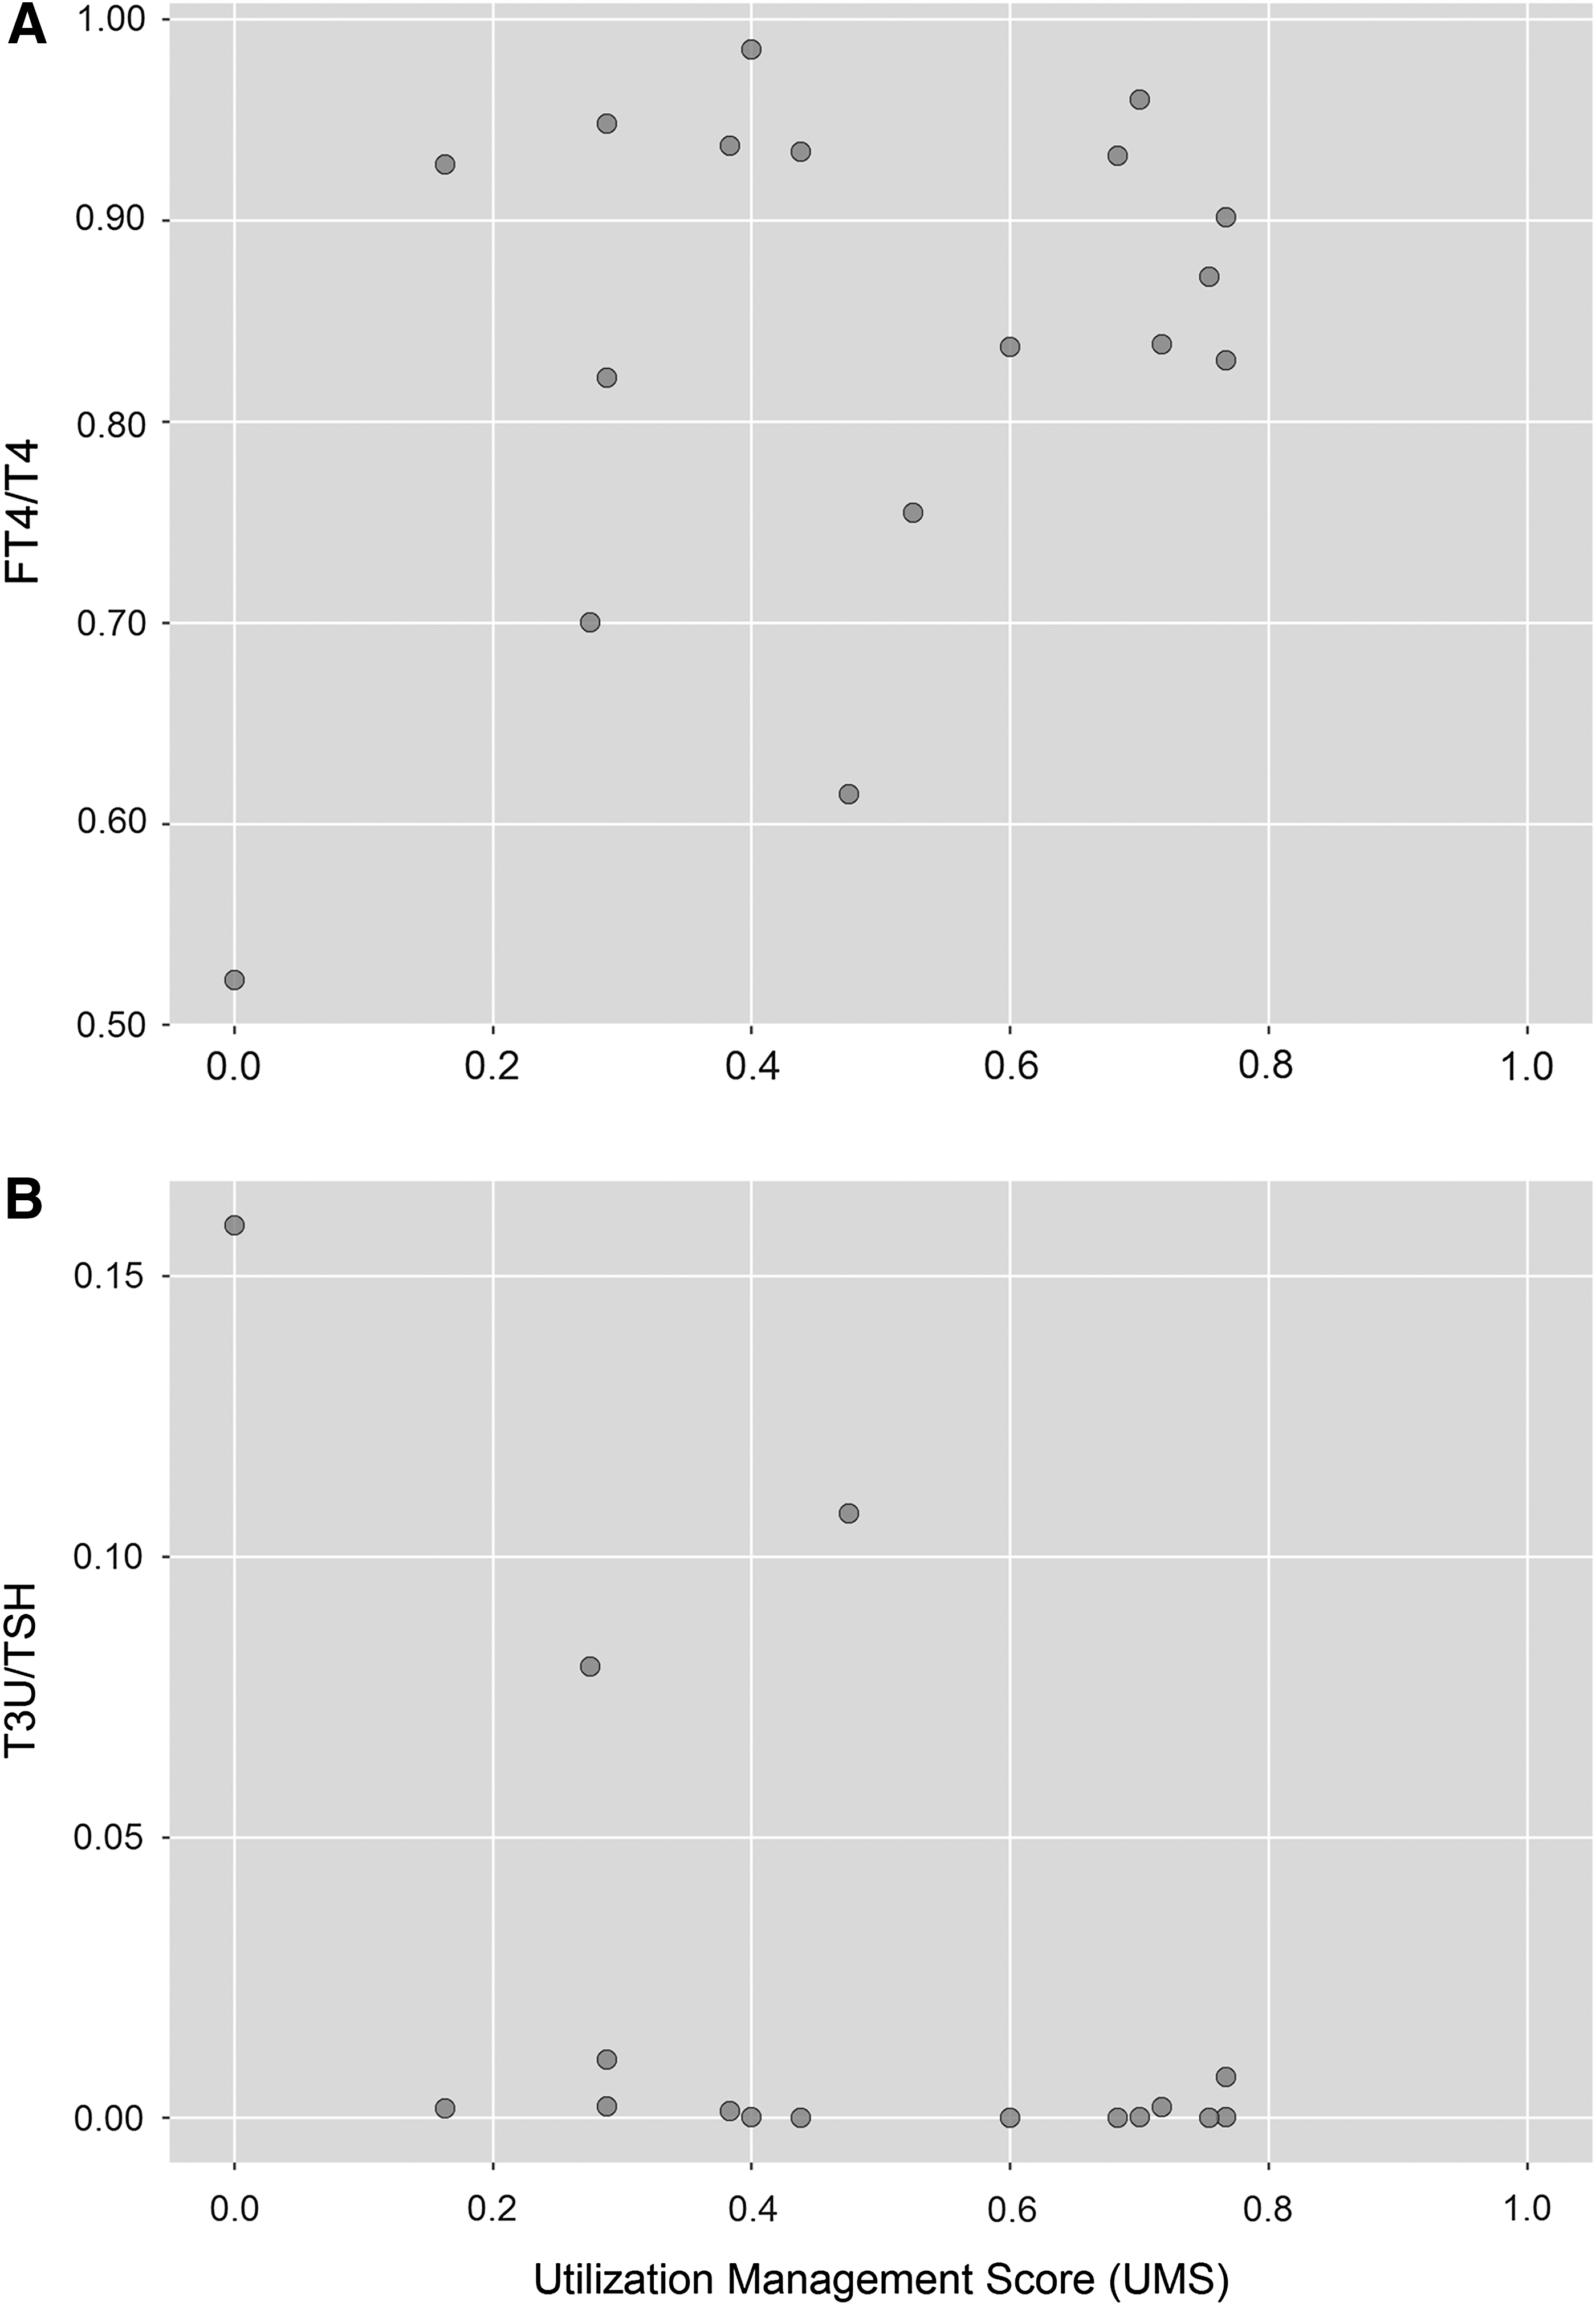
Testing quality with UMS. The following graphs demonstrate the correlation patterns between the (
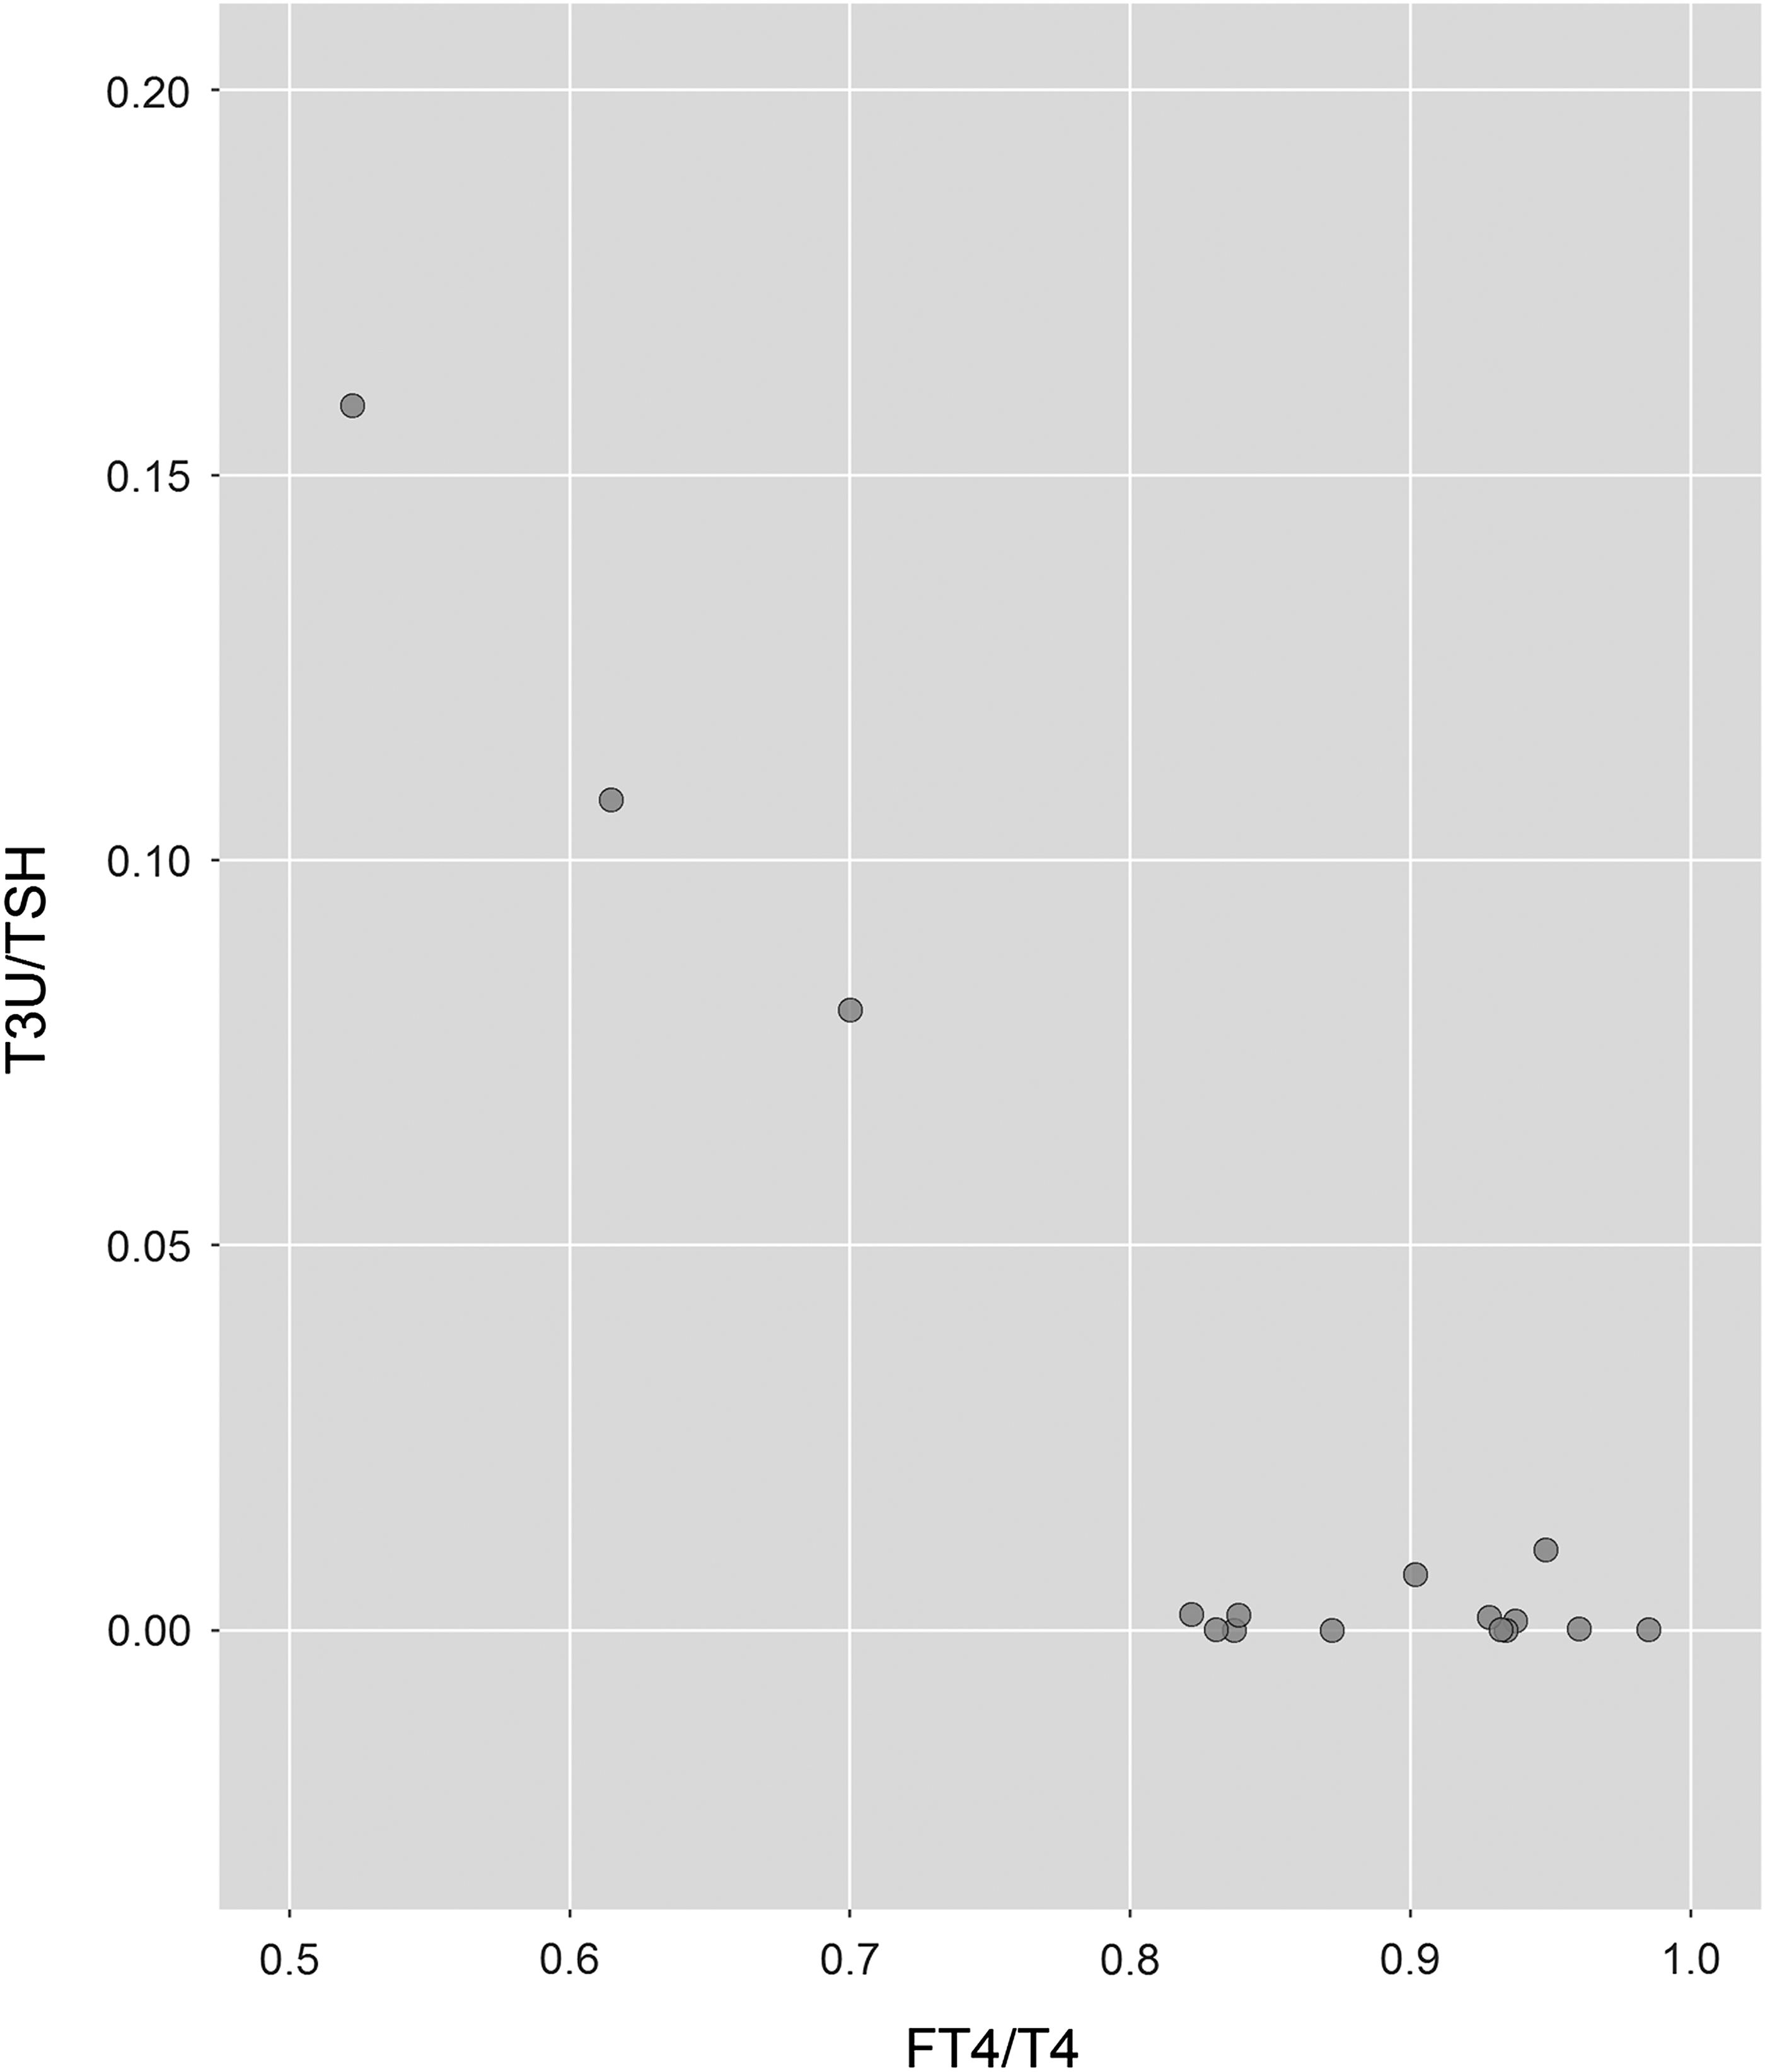
Relationship between T3U/TSH and fT4/T4. An inverse relationship was observed between the T3U/TSH (i.e., proposed indicator of poor test utilization) and fT4/T4 ratios (i.e., proposed indicator of better test utilization).
Discussion
Two types of comparisons were used to study order patterns for thyroid testing: (i) absolute comparisons with guidelines and (ii) relative comparisons between sites. The rate at which thyroid workups were initiated (TWR) and the tests that were selected once a thyroid workup was started (TTSR) were compared. It was found that thyroid workups were performed at a higher rate among outpatients than among inpatients, and that they were higher in non-academic relative to academic hospital settings. Once a thyroid workup was started, there were no significant differences in test selection for inpatients and outpatients, as all TTSR comparisons using the Kruksal–Wallis test showed p-values of >0.05. Following TSH, fT4 was the most frequently ordered test. On average, 38 T4 tests (i.e., fT4 or TT4) were ordered for every 100 TSH determinations. T3 tests (i.e., fT3 or TT3) were ordered much less frequently (seven T3 tests per 100 TSH). Orders for rT3 and T3U were relatively rare and were concentrated at a few sites.
The T4/TSH ratio showed considerable variability. This may reflect controversy concerning the best approach for thyroid screening and diagnosis. Different clinical groups, as well as the U.S. Preventative Services Task Force, have produced different guidelines for thyroid testing (15,30). In addition, there is controversy regarding whether to use TSH alone as an initial test or to use a combination of TSH and fT4 (9,20,21,28,43,44). It was found that the T4/TSH ratio varied from 0.12 to 1.00 between sites. One site had a T4/TSR ratio of 1.0, which indicates that T4 (fT4 or TT4) was ordered as frequently as TSH. Upon inquiry, it was found that this was the result of test order menu design (i.e., the thyroid test panel included both TSH and fT4 tests). The fT4/TSH ratio has been reported in a number of studies. These studies, mainly conducted in Europe, also showed considerable variability in fT4/TSH ratios (Table 3), ranging from 0.15 to 0.94. Thus, the variability observed in this study, conducted in the United States, is consistent with the variability in European studies. The high variability in the rate of fT4 testing suggests that fT4 testing may be a fruitful target for utilization management. Unfortunately, no benchmarks are available for the fT4/TSH ratio. However, this study provides a useful starting point by which to gauge current practice.
Before and after study. Post-intervention results are shown.
N, number of participating sites; TSH/1000, volume of TSH tests per 1000 patients in catchment area; NA, not available (large catchment area); NR, no range reported.
T3 tests (i.e., fT3 or TT3) were ordered much less frequently than T4 tests (i.e., fT4 or TT4). T3 is primarily ordered to confirm cases of hyperthyroidism. Thus, T3 is a third-level test (following TSH and fT4) and should be ordered relatively infrequently (45). It was found that a median of 7% of patients who were tested for TSH were also tested for fT3 or TT3. One site had a T3/TSH rate of 0.36. Interestingly, one study estimated that only 2% of patients require T3 testing (46). T3/TSH, TT3/TSH, and fT4/TSH ratios were higher for the non-academic sites, whereas the TWR tended to be higher for the non-academic sites. This pattern may arise because non-academic sites initiate thyroid workups more frequently and obtain more normal screening results. As a consequence, these sites perform fewer downstream tests.
It was found that most orders for T4 were placed for fT4 rather than TT4. On average, 90% of the orders were for fT4. Thus, most sites order fT4, in accordance with current recommendations. It was found that the proportion of orders for fT3 was widely distributed. This variation may be due to the fact that no current specific guidelines are available for T3 testing. This, along with the increasing availability of fT3 methods on automated immunoassay analyzers, represents an opportunity for improvement. Updates to guidelines and greater specificity about which tests are more ideal in various clinical scenarios are warranted in the future.
T3U is considered an obsolete test in the United States (39). Historically, T3U was ordered along with TT4 to calculate a FTI. This approach has now been replaced by measurement of fT4, the bioavailable form of T4. As a result, T3U is no longer recommended, and some organizations have removed T3U from their test menus. Based on data in the current study, it was found that T3U was rarely ordered at most institutions. Significant volumes of orders for T3U were placed at only a few sites. Only four of the participating sites had an annual T3U test volume >100 and a T3U/TSH test volume ratio >0.08 (i.e., eight T3U tests for every 100 TSH tests ordered).
rT3 is a controversial test. rT3 may be elevated in non-thyroidal illness, but it has relatively low clinical specificity, leading some individuals to claim that rT3 has no clinical value (47). Among the 82 sites (from 24 healthcare organizations), most sites either do not order or order very few rT3. All but five sites had >40 rT3 tests annually. rT3 orders were concentrated at a few sites. Three sites in this study accounted for 84% of rT3 testing.
It was found that most participants were engaged in utilization management activities, and a majority believed their utilization management activities were effective based on the mean perceived effectiveness score (Table 2). Seventy-one percent of participants provided guidelines or algorithms to guide testing, and more than half (54%) of the participants collect information to guide and improve utilization (Table 2). About 25% of sites had implemented specific measures to improve thyroid testing. The UMS index was constructed to provide a rough measure of the intensity of utilization management activities at each site. The fT4/T4 ratio and T3U/TSH ratios were used as measures of testing quality because there is a consensus regarding the use of these tests (39). It was found that the fT4/T4 ratio was weakly correlated with the UMS but that the T3U/TSH had a significant correlation with the UMS (Fig. 4). The T3U/TSH correlation was strongly influenced by a single point, so the significance of this finding was discounted. It was also found that the quality of test selection was strongly correlated by site: low values for fT4/T4 ratios were associated with high levels of T3U/TSH ratios (Fig. 5). This is a reasonable association, as both FTI and fT4 may be used as follow-ups to an abnormal TT4 result or if an abnormality in serum thyroid binding globulin (TBG) is suspected.
The present study suggests that there is considerable opportunity to reduce practice variation in thyroid testing. A recent meta-analysis summarized the findings on interventions to improve thyroid testing (48). This study concluded that behavioral interventions are generally effective in reducing the volume of thyroid function tests. However, the study called for more research because the quality of studies was generally poor, and it was not possible to recommend specific intervention types. Another study conducted in the United Kingdom examined reasons for practice variation in thyroid testing (49). Reasons included variation in awareness and adherence to practice guidelines, difficulties related to computer systems, and the range of professionals who order thyroid tests.
This study has several limitations. Although it showed statistically significant variation in test selection, it is not clear whether this variation is clinically significant. This is a potential topic for further investigation. The sample was a convenience sample and may not be representative. Although the study would have been stronger if the sites had been randomly selected, there is no reason to believe that the included sites are not representative. The data collected do not distinguish between tests ordered for initial workups versus follow-ups. There may be several other reasons for ordering the same test(s) multiple times, such as monitoring or follow-up on results that are borderline or inconsistent with clinical findings. However, there is no reason to believe that these factors differentially affected certain sites more than others. Further, unlike other medical questionnaires used for assessment or diagnosis of conditions, the UMS scale was designed for the purpose of this study and has not been validated. Research to define measures of utilization management effectiveness would be helpful. The TWR is imperfect because it is difficult to interpret. It assumes that the variability of TSH testing with respect to CBC testing is relatively constant between sites. Although normalization of test volume to that of CBC has been used in other published work (13,31,50), the possibility that the significant difference observed in TWR between inpatients versus outpatients may be the result of CBC test ordering variations due to different clinical settings cannot be ruled out. Similarly, the possibility that differences in patient population and/or the ordering physician type (i.e., endocrinologist vs. non-endocrinologist) may have also contributed to the observed practice variation cannot be ruled out. Collecting and merging such detailed information from a large number of sites would be very challenging. Thus, data collection was limited to aggregate data. The impact of provider type could be examined in a future study with a smaller number of sites. This study is also limited by the fact that data were not collected on thyroid antibodies. This is a topic that could be explored in future studies.
Most studies comparing thyroid testing use measures such as the number of TSH tests per 1000 patients. However, those data were not available for this study. One of the main objectives was to demonstrate variability, and the TWR is able to show significant variability in the rate of thyroid workups between sites (similar to TSH per 1000 patients). Similarly, TTSR is also able to show significant variability in the selection of thyroid testing. Normalization of thyroid test volume to that of TSH (i.e., TTSR ratios) has been used in a number of studies (Table 3). Finally, benchmarking data are limited because they only show what is usual, not what is correct.
This study also has several strengths. To the authors' knowledge, this study is the first in North America to compare test order patterns for thyroid testing across organizations. Guidelines on thyroid test selection ratios would help organizations reduce waste and improve patient care. These comparative ratios may provide useful benchmarks that could serve as quality guidelines. Absent specific guidelines, the benchmarking results provide ranges for usual practice that organizations can use for comparison. An online tool has been created (
Footnotes
Acknowledgments
We wish to thank Daniel James for his assistance in administering the Web survey. We also wish to thank Jason Shepherd for developing the Web site, which allows interested readers to compare their organization's results with those in this study.
Thyroid Benchmarking Group
Nikolina Babic, PhD, Department of Pathology, Mount Sinai and Icahn School of Medicine at Mount Sinai, New York, NY,
Author Disclosure Statement
No competing financial interests exist.