
Abstract
Background:
Hyperthyroidism is associated with alterations in metabolism that are currently only partially understood. The objective of the study was to investigate changes in metabolism associated with reinstatement of euthyroidism in Swedish patients.
Methods:
Eighty metabolites in plasma were profiled from 10 subjects with Graves' disease (GD) at baseline and after 9 and 15 months of treatment to reinstate euthyroidism. Thyroid parameters, thyrotropin (TSH), TSH receptor antibodies, free triiodothyronine, and free thyroxine were followed. Main findings were validated in plasma from 20 subjects with GD at baseline and at three, six, and nine months. The study was conducted at the endocrinology clinic in Malmö, Sweden.
Results:
Euthyroidism was reinstated at three months, and thyroid status did not change further during the 15-month follow-up. This was paralleled by altered levels of 9/19 detected acylcarnitines (p < 0.05 after adjustment for multiple testing). Levels of short-chain acylcarnitines were decreased, intermediate-chain acylcarnitines elevated, and long-chain acylcarnitines unaltered.
Conclusions:
GD and treatment of the disease is associated with pronounced acyl chain length–dependent alterations in acylcarnitine levels. These changes may be impacted by ethnicity and or dietary differences.
Introduction
G
Patients with hyperthyroidism have a reduced metabolic efficiency and suffer from increased thermogenesis (2). Among the many effects on metabolism exerted by thyroid hormones (3), the effects of the hormone on lipid metabolism are well studied. It has been shown that oxidation of fatty acids is increased in hyperthyroidism (4). Carnitine palmitoyl transferase 1 (CPT1), converting cytosolic acyl-CoAs to acylcarnitines, is the key regulatory enzyme for fatty acid oxidation. Both gene expression and activity of CPT1 is increased in hyperthyroidism (5). CPT1 expression has also been linked to appetite modulation and changes in the lipidomic profile (6). Moreover, the sensitivity of the enzyme to the inhibitory action of malonyl-CoA, a key intermediate in fatty acid synthesis, is reduced (5,7). Once converted into acylcarnitines, the acyls can be transported into the mitochondria by the carnitine-acylcarnitine translocase (CACT). In addition, the activity of this enzyme is elevated in hyperthyroidism (8). In a recent study conducted in a Chinese population, reinstatement of euthyroidism was nominally significantly associated with decreased levels of 14 acylcarnitines, which clearly supports an impact on mitochondrial metabolism, in particular lipid metabolism (9). Studies examining acylcarnitines in relation to thyroid disease are summarized in Table 1.
Male/female.
BMI, body mass index; fT4, free thyroxine; NA, not available.
To shed further light on changes in metabolism associated with re-establishment of euthyroidism in a European population, metabolites in plasma were profiled from Swedish patients with GD before and after medical treatment of hyperthyroidism.
Materials and Methods
Study design
A subset of samples was selected from a randomized clinical trial in GD patients living in Malmö with newly diagnosed hyperthyroidism.
Patients were treated with the antithyroid drug methimazole (15 mg; Thacapzol®; Recip) twice daily to block thyroid hormone synthesis, and levothyroxine (LT4; 100 μg; Euthyrox®; Merck) once a day to reach euthyroidism (10).
Ten subjects were included in a first screening, and fasting samples were collected at baseline and at 9 and 15 months after initiation of treatment (Table 2). Selection criteria were detectable TRAb, non-smokers, and no treatment other than methimazole and LT4.
Calculated versus baseline.
For 0 vs. 9, 0 vs. 15, and 9 vs. 15 months (baseline = 0 months).
Paired Student's t-test.
p < 0.05
p < 0.01
p < 0.001
ANOVA, analysis of variance; SEM, standard error of the mean; TSH, thyrotropin; fT3, free triiodothyronine; TRAb, TSH receptor antibody; na, not applicable; ns, insignificant.
In the validation sample, fasting plasma samples were collected at baseline and at three, six, and nine months after initiation of treatment (Table 3). This sample of 20 patients included the aforementioned subjects. One patient was excluded due to the lack of a sufficient baseline plasma volume. The same selection criteria were applied, with the only exception that smoking was not used as exclusion criterion. Participants were asked to fill in a food questionnaire at baseline. Samples were stored at −20°C until analysis.
Nonsmoker/previous smoker/smoker.
Calculated versus baseline.
For 0 vs. 3, 0 vs. 6, 0 vs. 9, 3 vs. 6, 3 vs. 9, and 6 vs. 9 months (baseline = 0 month).
p < 0.01
p < 0.001.
The study was registered in the Clinical
Assays
Plasma TSH (reference interval 0.4–3.7 mIU/L, sensitivity 0.001 mIU/L, CV 10%), free thyroxine (fT4; reference interval 8–14 pmol/L, sensitivity 2 pmol/L, CV 10%), and free triiodothyronine (fT3; reference interval 3.5–5.4 pmol/L, sensitivity 2 pmol/L, CV 10%) were determined by enzyme-linked immunosorbent assay according to the manufacturer's instructions (Beckman-Coulter). TRAb were measured using a human radio receptor assay kit purchased from Brahms, following the manufacturer's instructions (reference interval <1 IU/L, sensitivity 0.3 IU/L, CV 9.3–15.4%). All laboratory parameters were analyzed at the Department of Clinical Chemistry in Malmö, Sweden.
Sample preparation
Metabolites were extracted from 40 μL of plasma in a total volume of 320 μL of methanol/water (80/20; v/v), as previously described in detail (11,12). Following centrifugation, 200 μL of the supernatant was transferred to a glass vial and evaporated to dryness in a vacuum centrifuge. Samples were stored at −80°C and dissolved in 40 μL of methanol/water (1/1; v/v) prior to analysis.
Metabolite profiling
Plasma extracts were analyzed on a 10 cm ACQUITY UPLC CSH C18 column (Waters Corp.) using a VanGuard pre-column (Waters Corp.) on a 1290 Infinity UPLC (Agilent) connected to a 6550 iFunnel Q-TOF (Agilent). The screening sample was analyzed in both positive and negative electrospray ionization mode (ESI+ and ESI–, respectively), whereas the validation sample was analyzed in ESI+ only. Two-microliter samples were injected and chromatographed, as previously described in detail (13). The mass spectrometer was operated in full scan mode from 50 to 1800 m/z, with a capillary voltage of 3.5 kV and a fragmentor voltage of 175 V. The drying gas flow rate was set to 14 L/min at 200°C, with a nebulizer pressure of 35 psi. Samples were analyzed in randomized order. A quality control (QC) sample created from a mixture of all analyzed samples was analyzed eight times prior to the first sample injection and then again every 10th injection. Extraction blanks were analyzed after the final sample injection. Data were acquired using MassHunter B.06.00 Build 6.0.633.0 (Agilent). Metabolites were identified by MS/MS using MassHunter METLIN Metabolite PCDL (Agilent) and injection of pure standards, when available. Targeted feature extraction was performed using MassHunterProfinder B.06.00 Build 6.0625.0 (Agilent).
Statistical analysis
Metabolite data were normalized to the scores along the first principal component in a principal component analysis (PCA) calculated on the uncentered and unit variance scaled internal standards (14). All metabolite profiling data were log2-transformed. PCA and visualization of data by orthogonal projections to latent structures-discriminant analysis were performed in SIMCA P + 12.0 (Umetrics). Differences between time points were assessed by repeated measures analysis of variance (ANOVA), followed by a paired Student's t-test post hoc. Differences between two time points were assessed by a paired Student's t-test, followed by correction for multiple testing using the false discovery rate (FDR) method. All statistical analyses were performed with R software (
Results
Clinical characteristics
In the screening sample, patients increased in weight (4.35 ± 0.96 kg) and body mass index (BMI; 1.42 ± 0.32 kg/m2) during the first nine months of treatment. As expected, levels of fT3 and fT4 decreased (−12.01 ± 2.6 and −30.5 ± 5.1 pmol/L, respectively), as did TRAb (−6.31 ± 1.53 IU/L). Plasma creatinine increased (16.3 ± 2.91 μmol/L) but was always within the normal range. These parameters did not change further between 9 and 15 months after initiation of treatment (Table 2). Four patients were subclinically hypothyroid at nine months and received a dose-adjustment of LT4. At the 15-month evaluation, all patients were euthyroid. One patient who was not subclinically hypothyroid at nine months developed ophthalmopathy at the 12-month evaluation.
In the validation sample, patients showed an increased weight (3.4 ± 0.6 kg) and BMI (1.1 ± 0.2 kg/m2) already at three months. Levels of fT3 and fT4 decreased (−10.9 ± 2.2 and −26.0 ± 3.3 pmol/L, respectively), and creatinine increased (16.7 ± 2.5 μmol/L). These parameters did not change further between three and nine months. However, TRAb did not decrease until nine months after initiation of treatment (−5.7 ± 1.2 IU/L; Table 3). One patient was subclinically hypothyroid at the three-month visit. TSH was normalized after dose adjustment.
Out of the 14 full hot meals that are commonly consumed weekly in Sweden, the participants had fish on average 1.5 occasions and vegetarian food on only 0.5 occasions. None of the participants were vegetarians.
Metabolite profiling
In the screening, 80 metabolites were identified and relatively quantified in the baseline and follow-up samples (Fig. 1). Out of these, 18 differed in levels between sampling occasion: baseline and 9 and 15 months (two-way ANOVA; nominal p < 0.05). However, only 3/80 metabolites (LPC, 20:0; carnitine, C6; and SM, 36:1; p < 0.05) showed altered levels between 9 and 15 months. Consequently, further analyses focused on alterations occurring within the first nine months of treatment. Levels of 15 metabolites in total were altered at nine months after initiation of treatment (q < 0.05; Table 4). These included 9/19 detected acylcarnitines (C3:0, C8:0, C10:0, C10:1, C10:2, C12:0, C12:1, C14:1, and C14:2). Two additional acylcarnitines (C2:0 and C14:0) showed nominally altered levels (p < 0.05). Moreover, 2/6 detected lyso phosphatidylethanolamines (LPEs; 18:2 and 20:5) were elevated (q < 0.05), with one additional LPE (18:0) showing nominally elevated levels. Notably, short-chain acylcarnitines showed increased levels, whereas medium-chain acylcarnitines showed lower levels after treatment (Fig. 2A). These changes were observed in all individuals included in the study (Fig. 2B). Long-chain acylcarnitines were unaltered. Other lipids, such as lysophosphatidylcholines (LPCs) and sphingomyelins (SMs) were generally increased after treatment (Table 4).
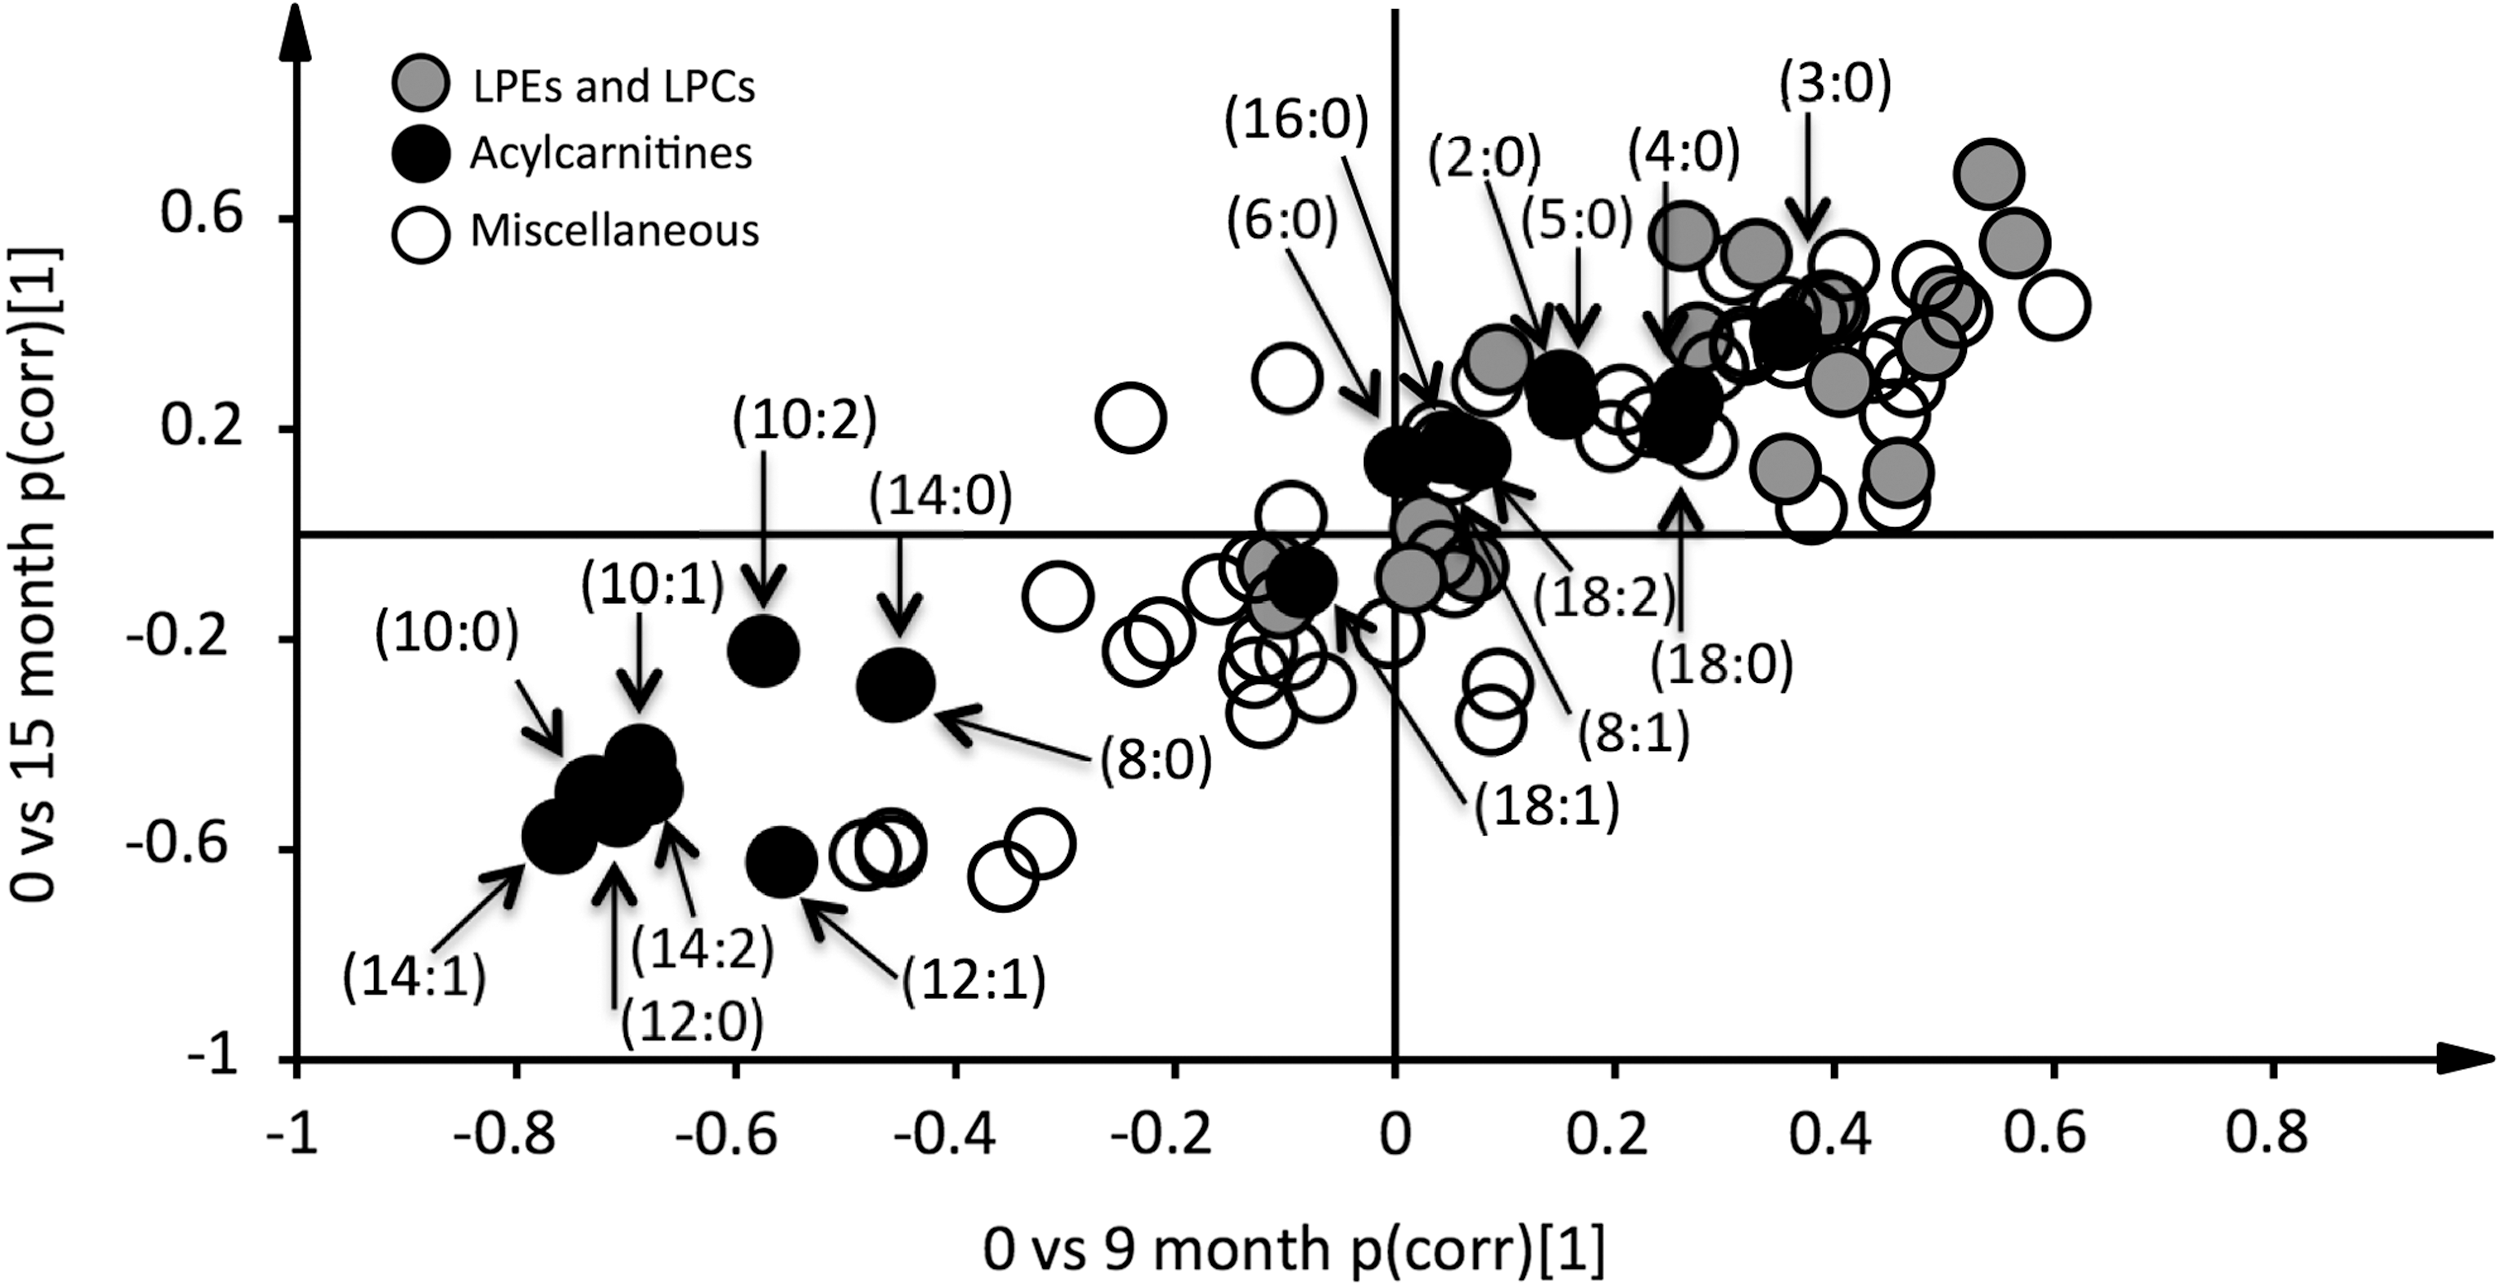
Re-establishment of euthyroidism is associated with alterations in lipid metabolism. Data were analyzed by orthogonal projections to latent structures-discriminant analysis. Two models were calculated classifying baseline samples from samples taken at 9- and 15-month follow-up. Loadings, scaled as correlations (pcorr), from these two models were combined in an onset-decay plot. Hence, metabolites that show elevated levels at 9 and 15 months are indicated by a dot in the upper-right quartile of the plot. Similarly, those showing lower levels at both 9 and 15 months are found in the lower-left quartile. None of the 80 detected metabolites were uniquely elevated at 9 or 15 months. Hence, alterations in metabolite levels took place during the first nine months of treatment. Short-chain acylcarnitines (C2–C5) are increased, intermediate-chain acylcarnitines (C8–C14) decreased, and long-chain acylcarnitines (C16–C18) unaltered. Acylcarnitines are annotated as (acyl-chain length:degree of unsaturation).
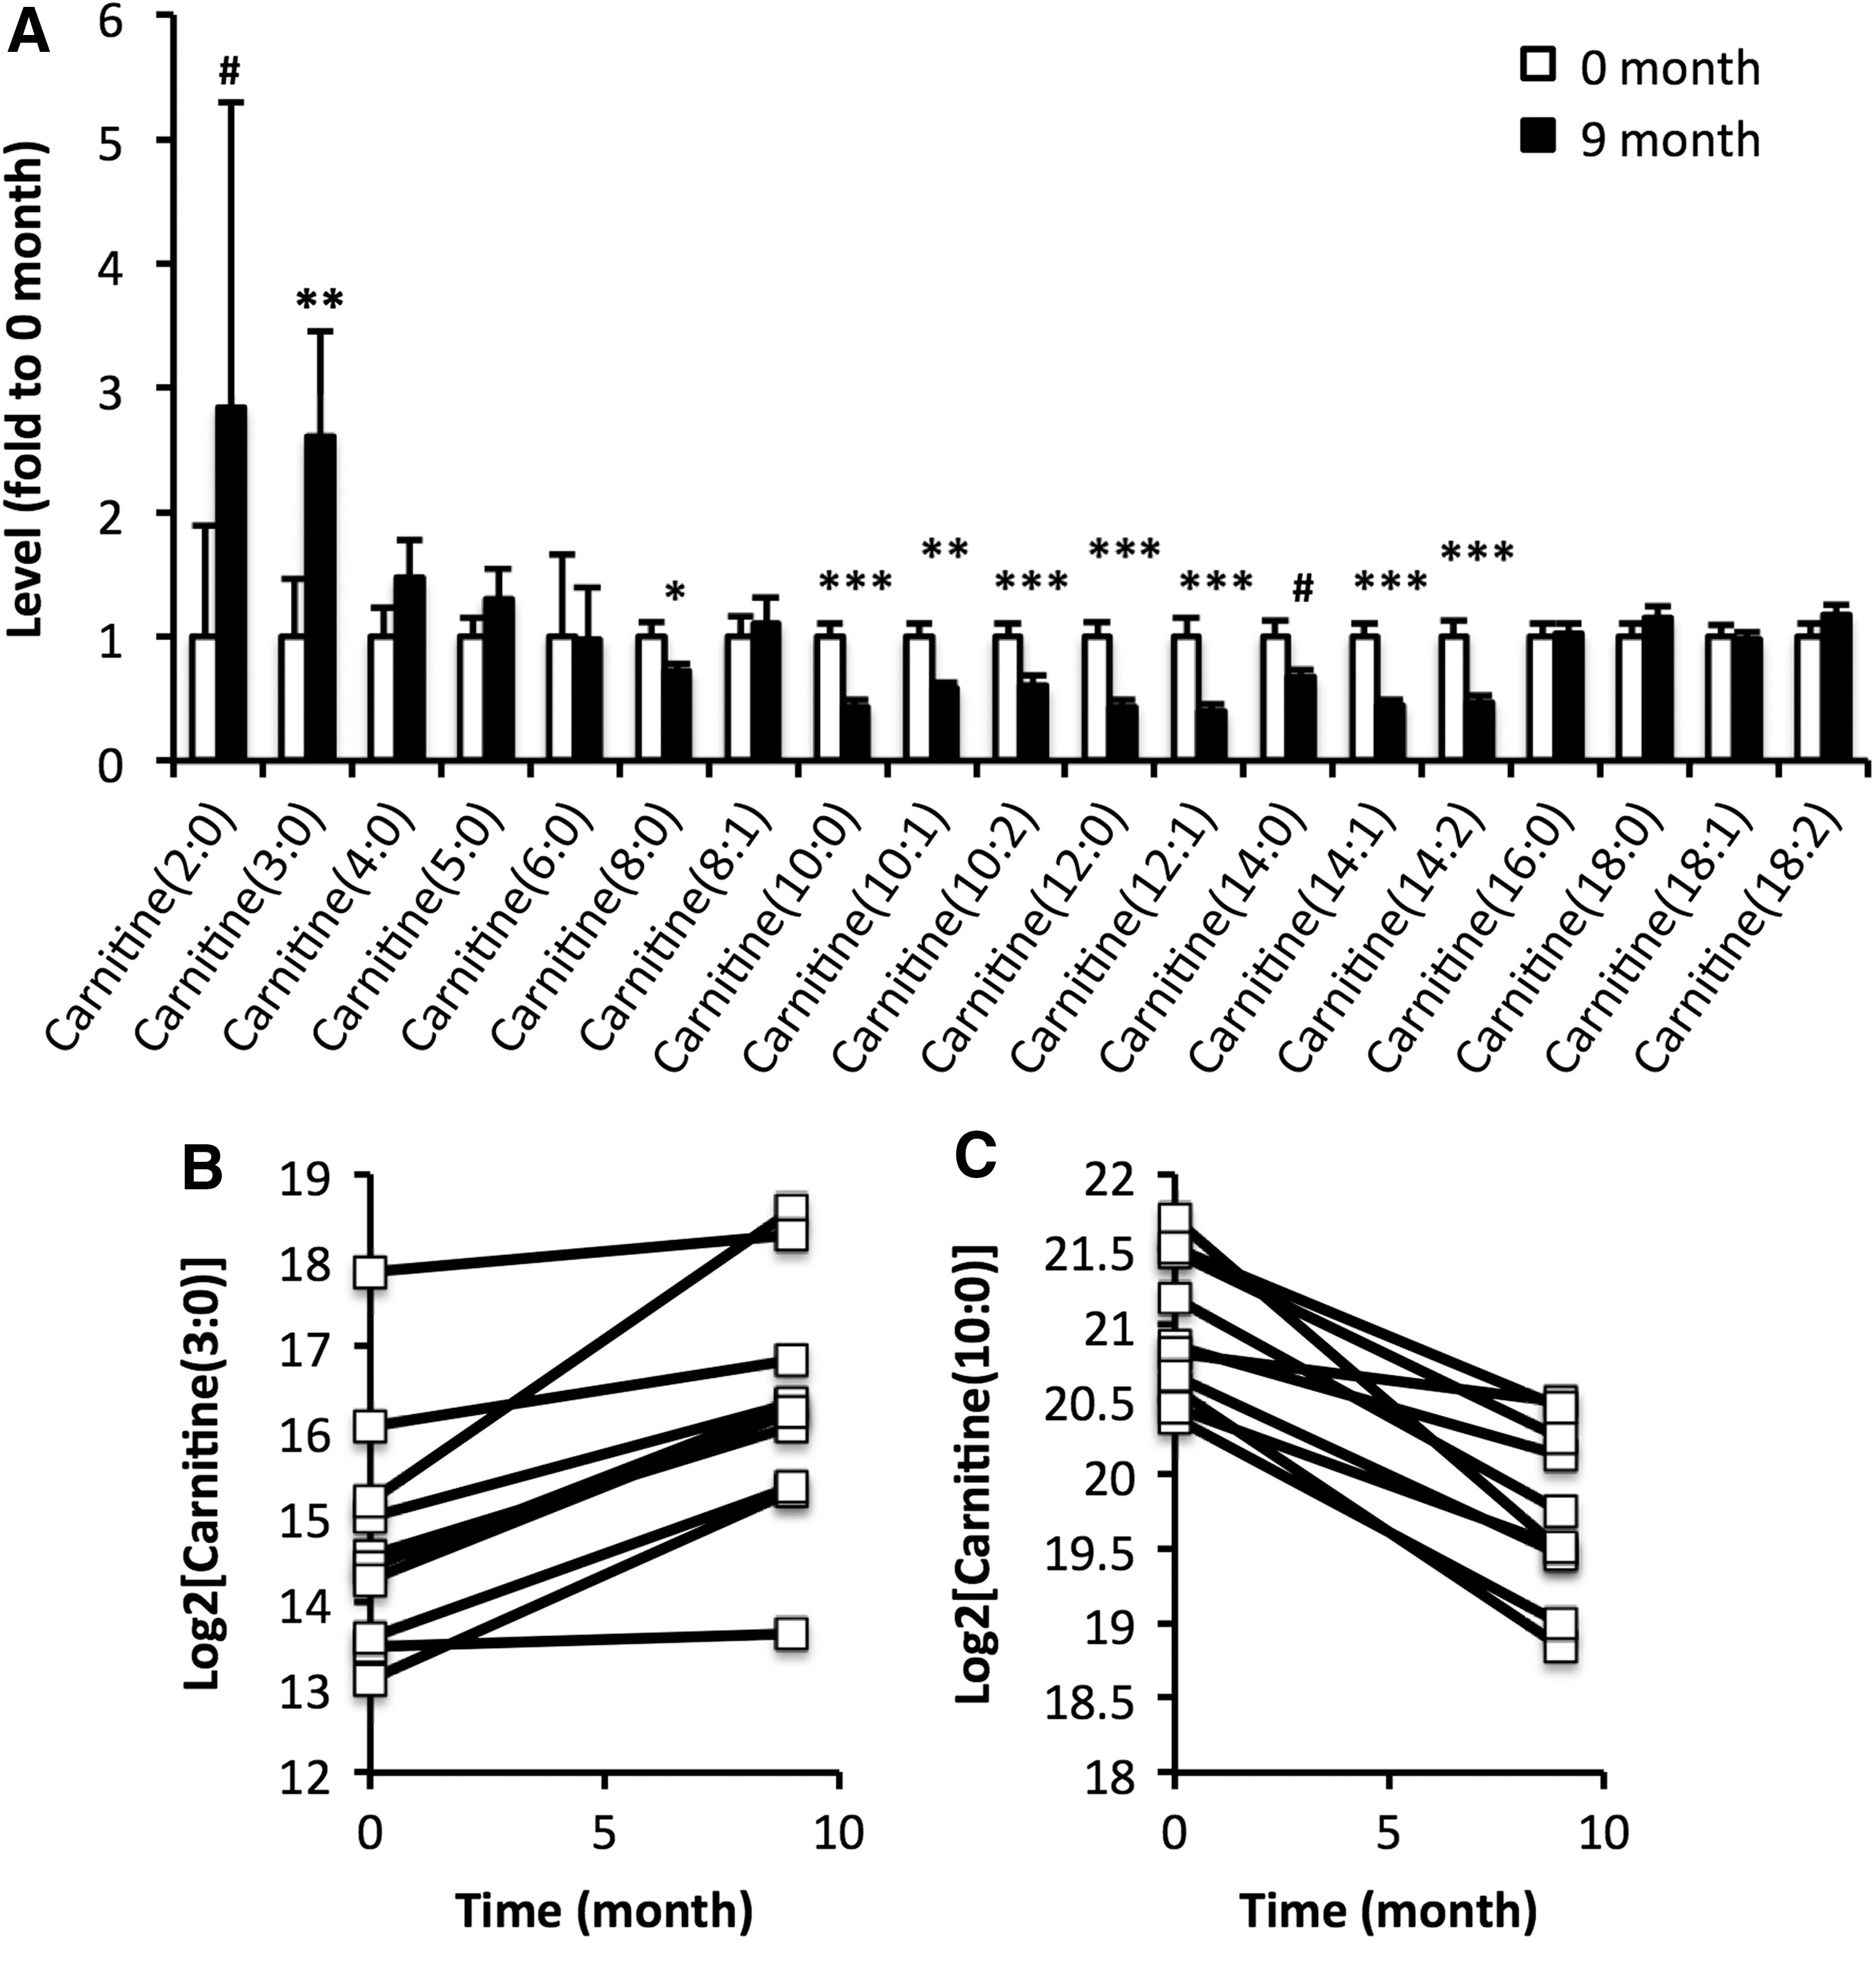
Alterations in acylcarnitine levels elicited by treatment of hyperthyroidism depend on the acyl chain length. (
p < 0.05 and q < 0.05 are highlighted in bold.
Data expressed as fold to baseline ± SEM.
Next, alterations in acylcarnitines occurring within 9 months after initiation of treatment were examined in a larger sample. Alterations in acylcarnitine levels were similar to those observed in the screening study but shown to occur already at three months after initiation of treatment (Fig. 3).
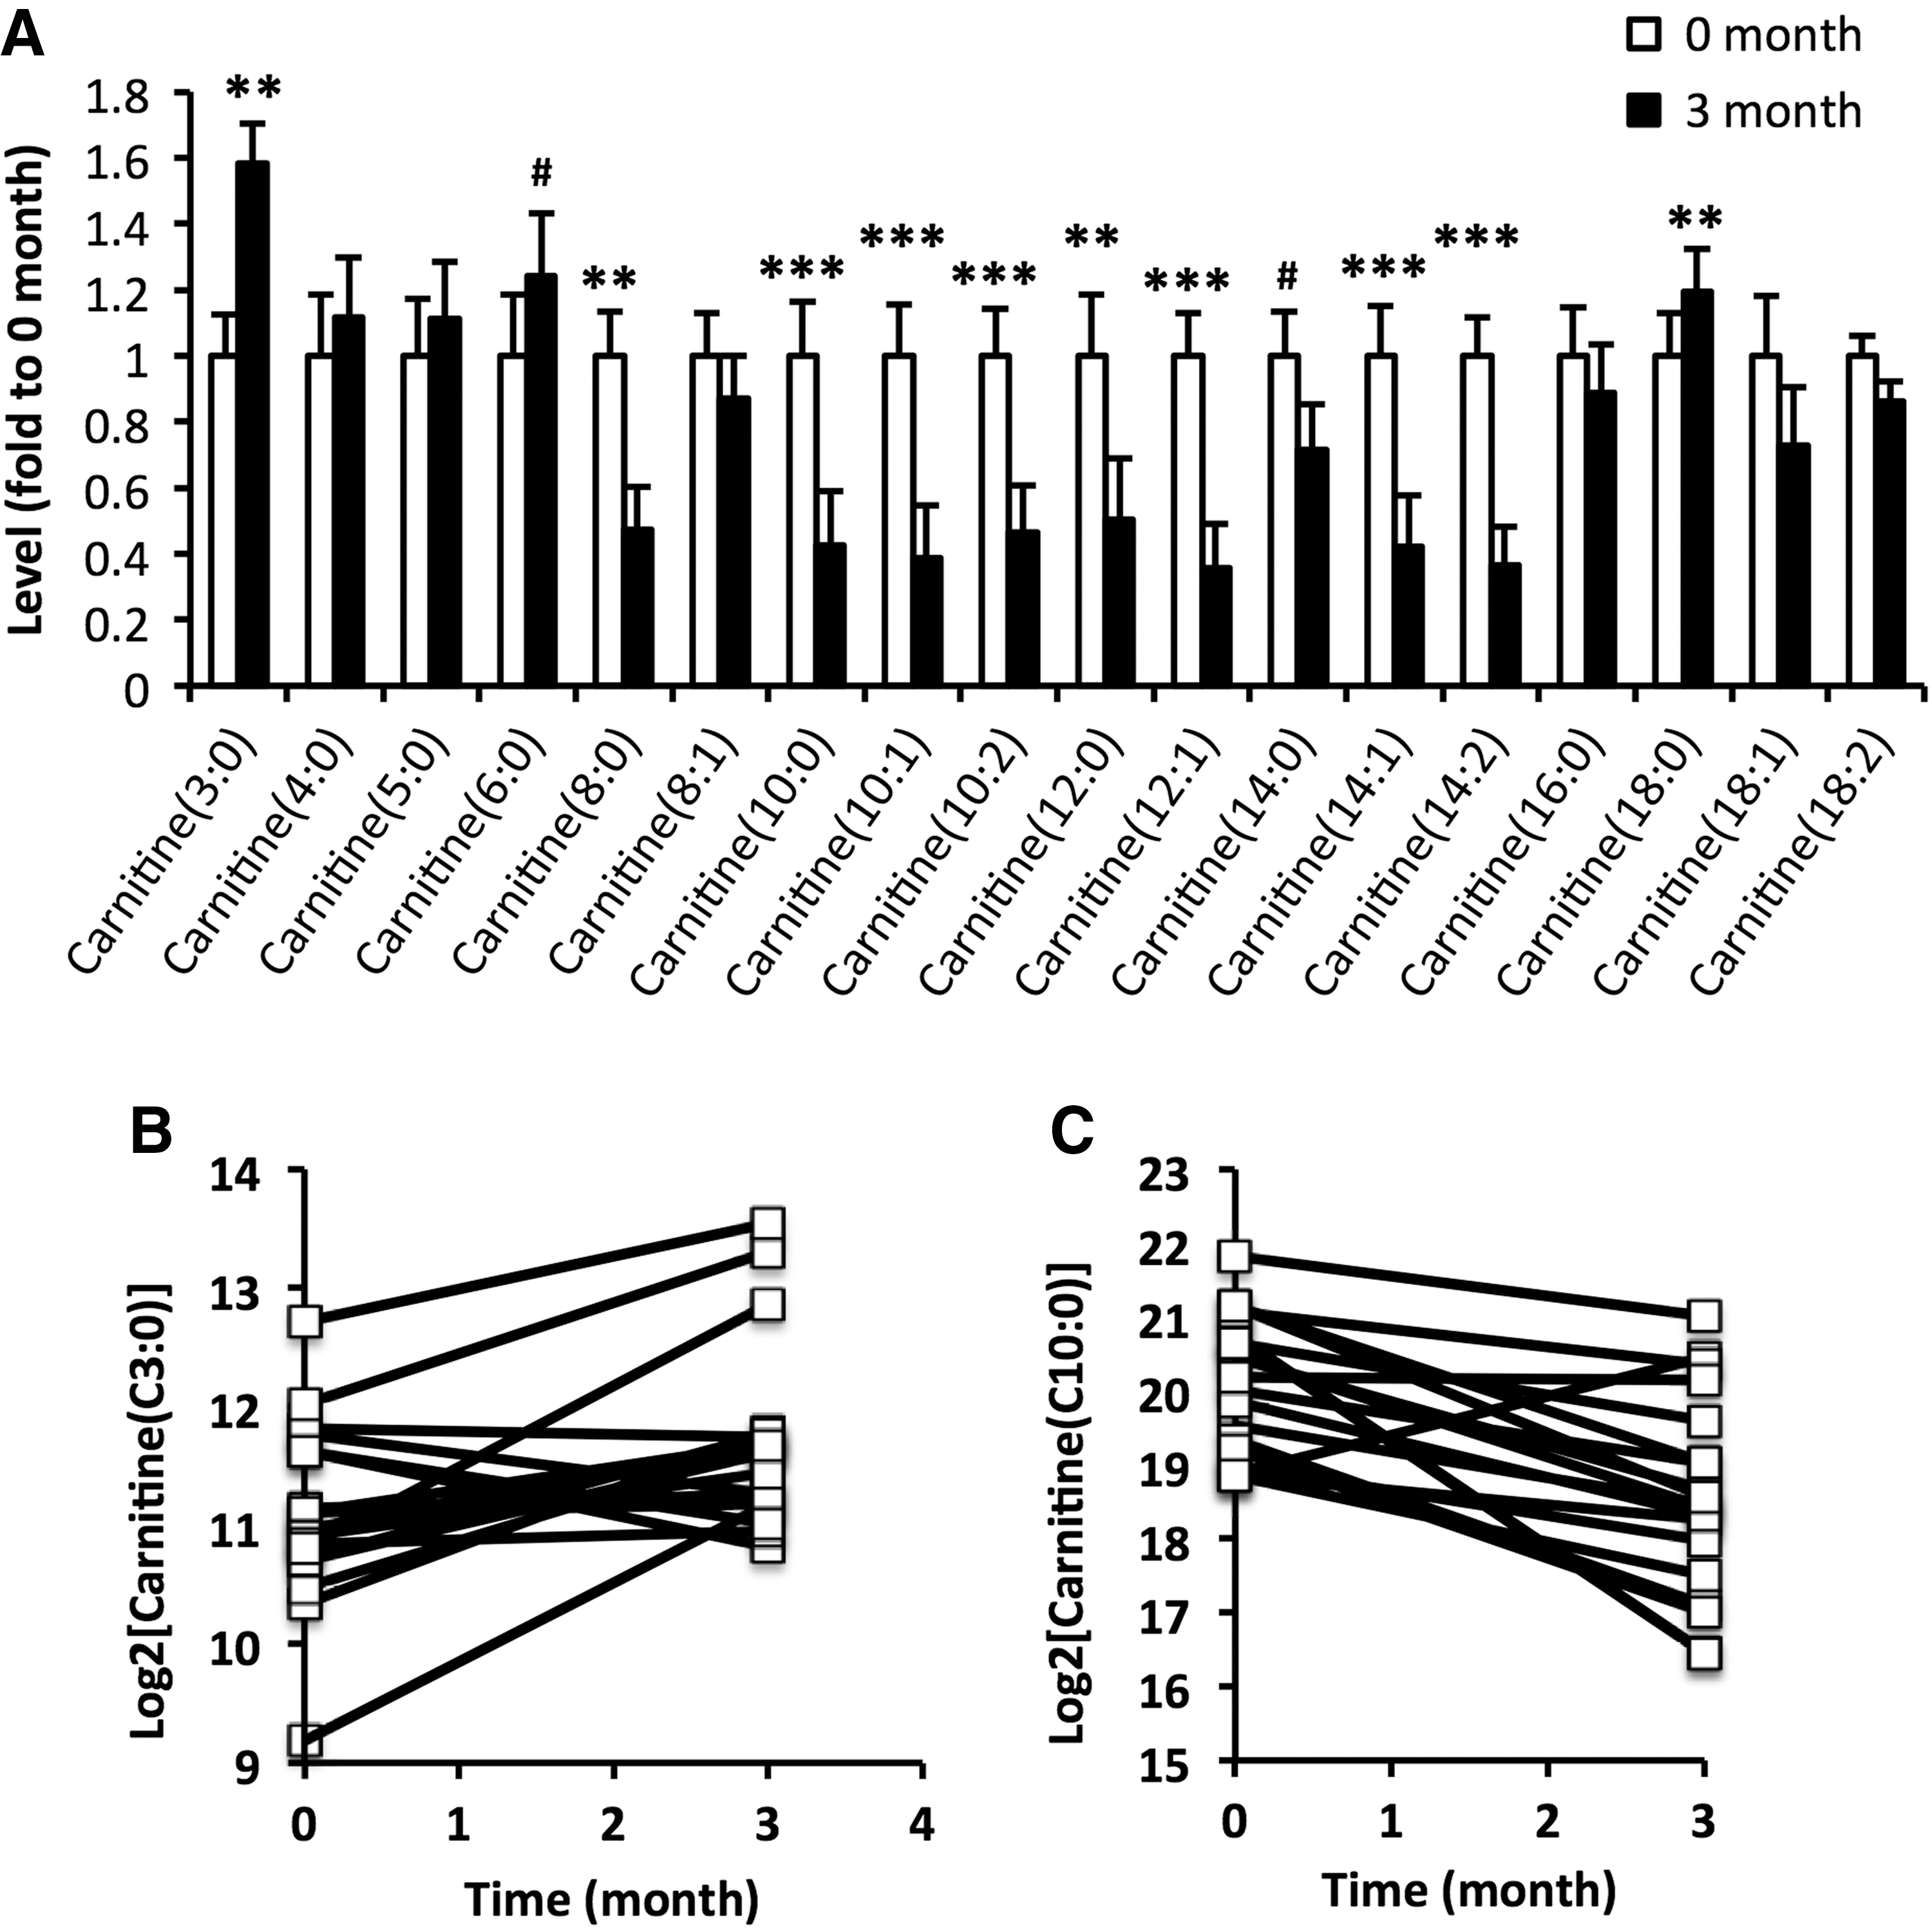
Alterations in acylcarnitine levels occurs within three months of treatment. (
Discussion
Hyperthyroidism is associated with multiple changes in metabolism, resulting in weight loss and insulin resistance. Hence, re-establishment of euthyroidism should be paralleled by alterations in metabolism. As the metabolic consequences of hyperthyroidism are poorly understood, unbiased metabolite profiling was performed in European patients before and after treatment for hyperthyroidism. As patients are healthy after treatment, each patient could serve as his/her own control.
Eighty metabolites were detected and relatively quantified, covering a broad spectrum of different metabolite classes. Levels of the majority of metabolites that were altered during the course of the treatment showed altered levels already after three months of treatment and did not change further during the following 12 months. Hence, the time frame for alterations in metabolism paralleled re-establishment of euthyroidism, occurring within three months of treatment.
Eight of the metabolites showing most significant changes were acylcarnitines. Elevated levels of multiple acylcarnitines have been associated with T4 in a euthyroid population (15). Carnitine is known to impair access of thyroid hormone to the nucleus, thereby diminishing thyroid hormone action (16). As such, it has been used in a few cases to reduce clinical symptoms of thyroid storm (17) and also to reduce clinical symptoms of iatrogenic hyperthyroidism (18). Some of its effects may result as a consequence of increased activity of antioxidant enzymes (19). Moreover, hyperthyroidism is associated with an increased activity of CACT (8), deficiency in which has been associated with elevated levels of acylcarnitines, particularly the long-chain C16 and C18 (20). In a study conducted on a heterogeneous group of 12 subjects with hyper-, hypo-, or euthyroidism, no significant differences were found in acylcarnitine levels (21). In that study, only one of the subjects had GD, whereas the others suffered from various other diseases associated with increased thyroid hormone signaling. In the present study, the patient material was more homogeneous, which allowed the same changes in all individuals to be observed. However, baseline levels as well as the magnitude of change in acylcarnitine levels differed between individuals. Whether this is related to the extent of symptoms, which generally vary massively between patients, remains to be investigated.
Levels of acylcarnitines with short acyl chain lengths (C2–C5) were found to increase after re-establishment of euthyroidism. Acetylcarnitine and other short-chain (C3–C5) acylcarnitines may be derived from glucose and amino acid metabolism, respectively. Levels of acylcarnitines with intermediate chain lengths (C8–C14) decreased in levels after treatment of hyperthyroidism, whereas those with a long chain length (C16–C18) were unaltered. These two groups of acylcarnitines emanate from fatty acid metabolism. Intermediate-chain acylcarnitines (C8–C14) have been shown to drop quickly after refeeding in the fasted states, whereas long-chain acylcarnitines remained constant (22). In the present study, this may reflect that hyperthyroidism can be seen as a state of relative starvation. Acylcarnitines have been suggested to be exported from the mitochondria to liberate CoA, an essential co-factor in mitochondrial metabolism (23). Moreover, mitochondrial levels of acetyl-CoA need to be kept low in order to avoid inhibition of pyruvate dehydrogenase (24). Elevated plasma acylcarnitine correlates with plasma glucose in the postprandial state (22), as well as with HbA1c (25). Hence, exaggerated glucose and lipid oxidation (26) and impaired glucose tolerance (27), both being associated with hyperthyroidism, are likely to underlie altered acylcarnitine levels. Carnitine levels, in particular acylcarnitine levels, have previously been shown to be reduced in muscle from patients with hyperthyroidism (28). Here, the opposite was observed in intermediate-chain acylcarnitines, which may suggest an increased export from muscle cells that contain far higher concentrations of acylcarnitines than blood or any other tissue. The impact of endogenous synthesis of carnitines on this observation is expected to be low, as the amount of carnitines emanating from the diet is far greater (29). However, it must be mentioned that activity of gamma-butyrobetaine hydroxylase, which catalyzes carnitine production, has been shown to be increased in hyperthyroid rats (30). Increased creatinine levels further support that the treatment alters muscle metabolism, resulting in increased muscle mass.
Insulin resistance is associated with elevated levels of medium- and long-chain acylcarnitines (31). Moreover, hyperthyroidism is associated with increased hepatic insulin resistance (1), but also to some extent with increased muscle insulin resistance (32). Clearly, improvements in insulin sensitivity associated with treatment are a likely although not proven cause of the changes observed in this study.
The present results differ slightly from results obtained from a similar study in a Chinese population (9). This may to some extent be explained by differences in metabolism (i.e., fat-free mass and basal energy expenditure) between Europeans and Asians (33). BMI was also higher in the Swedish compared to the Chinese group of patients (9); levels of multiple acylcarnitines have shown positive associations with BMI (34). Moreover, diets are also known to differ significantly, with respect to both food and macronutrient composition, between Asia and Europe (35,36). In the present study, participants consumed a fairly low amount of fish and vegetables. This is in line with the Western diet, which is focused on nutrition and energy, and hence contains large amounts of meat. The Chinese diet, on the other hand, contains a considerably larger amount of vegetables (37). Several studies have shown that diet impacts acylcarnitine levels. For instance, the dietary fatty acid composition, (e.g., palmitate/oleate-ratio) has been shown to alter acylcarnitine metabolism (38). Moreover, a meat-rich diet has been shown to elevate acylcarnitines compared to fish- and vegetable-rich diets (39). A higher protein content in the diet has been shown to increase short-chain acylcarnitines, whereas high dietary leucine levels reduce intermediate- to long-chain acylcarnitines, in infants (40). Higher dietary meat and saturated fat consumption are characteristics of the Western diet. Indeed, the Western diet has been shown to elevate plasma short-chain acylcarnitine levels (41). Moreover, differences have also been observed with respect to the risk of developing Graves' ophthalmopathy, the risk being sixfold higher in Europeans compared to Asians (42). Whether these differences are in part due to metabolic components remains to be elucidated.
Besides robust alterations in acylcarnitine levels, increased levels of LPEs and nominally significant elevations in the majority of LPCs and some of the SMs were also found. Levels of T4 have been shown to be associated with lower plasma levels of LPCs (15). Overall, hyperthyroidism has been associated with lower levels of plasma lipids (43,44), which normalize after treatment (45).
In conclusion, this study found a decrease in medium-chain acylcarnitines and an increase in short-chain acylcarnitines after treatment of hyperthyroidism and re-establishment of euthyroidism in European patients. Acylcarnitines produced in metabolism of glucose and amino acids are increased, whereas those produced in fatty acid oxidation are decreased. It remains to be determined whether these changes are due to restoring a euthyroid state or secondary to other alterations such as changes in BMI.
Footnotes
Acknowledgments
This work was supported by grants from the Royal Physiographic Society, the Novo Nordisk, Påhlsson, the Swedish Diabetes, Hjelt and Crafoord Foundations, the research funds of Malmö University Hospital, the Faculty of Medicine at Lund University, and the Skåne Research Foundation.
Author Disclosure Statement
No competing financial interests exist.