
Abstract
Background:
Hashimoto's thyroiditis (HT) is an autoimmune thyroid disease characterized by low expression of transcription factor Forkhead Box P3 (FOXP3) and functional deficiency of a cluster of differentiation regulatory T cells (Tregs). This study aimed to investigate the mechanism of Treg dysfunction in HT.
Methods:
The number of CD4+CD25+FOXP3+ T cells was determined by flow cytometry. Expression of FOXP3 and Sirtuin type 1 (SIRT1) was evaluated by Western blot analysis. Acetylation of FOXP3 was analyzed by immunoprecipitation and Western blot analysis. The suppressive function of Treg was analyzed by the 5,6-carboxyfluorescein diacetate succinimidyl ester (CFSE) assay.
Results:
The percentage of CD4+CD25+FOXP3+ T cells, expression of FOXP3, and FOXP3 acetylation level in the HT group were significantly lower than in the control groups. Conversely, SIRT1 expression was significantly higher in the HT group than in the other two groups. After Ex-527 treatment, the CD4+CD25+FOXP3+ T cells percentage, FOXP3 expression, and FOXP3 acetylation level in the HT group were significantly increased. HT Tregs exhibited less suppressive activity, but Ex-527 treatment significantly increased their suppressive activity.
Conclusions:
The findings demonstrate that the reduced FOXP3 expression level and Treg function defect in HT patients are regulated by SIRT1-mediated abnormal FOXP3 acetylation. Ex-527 may upregulate the FOXP3 acetylation level and subsequently increase the number and suppressive function of Treg cells.
Introduction
H
1HT is regarded as a T-cell-mediated autoimmune disease (6,7). Studies have shown that a lack of a cluster of differentiation CD4+CD25+ T regulatory cells (Tregs) in humans and mice results in various systemic autoimmune disorders, such as thyroiditis, multiple sclerosis, and inflamed ovaries (8 –10). As an essential T-cell subset for self-immunotolerance, CD4+CD25+ Tregs influence thyroiditis development. Accordingly, it can be inferred that Treg dysfunction plays an important role in HT etiology.
Due to their immunosuppressive abilities, Tregs have an indispensable role in the maintenance of immune homeostasis and prevention of autoimmunity induced by excessive, misdirected, or unnecessary immune activation (11,12). Tregs can be identified by expression of the transcription factor Forkhead Box P3 (FOXP3). FOXP3 is a forkhead winged-helix family transcriptional regulator that plays a key role in CD4+CD25+ Treg development and function, and represents a specific marker for these cells (13). Deletion of the FOXP3 gene and loss of Tregs promote development of autoimmune and inflammatory syndromes (12,14). Several studies have reported that FOXP3 expression is reduced in peripheral CD4+CD25+ Tregs, and that the function of CD4+CD25+ Tregs is defective in patients with HT and other autoimmune diseases (6,15). FOXP3 expression is also controlled by reversible acetylation of the FOXP3 protein. Various cellular histone acetyltransferases (HATs) and histone deacetylases (HDACs) have been implicated in FOXP3 acetylation/deacetylation (16 –18). It was hypothesized that regulation of FOXP3 acetylation is important for the mechanism of HT and probably other autoimmune diseases (16,19).
SIRT1 (Sirtuin type 1) is a member of the HDAC sirtuin family and downregulates FOXP3 expression (16 –20). It is also a nicotinamide adenine dinucleotide (NAD)+-dependent HDAC with several non-histone targets, including the transcription factors nuclear factor-kappa B and forkhead box O proteins (21). Recent studies have suggested that FOXP3 acetylation could be regulated in a reciprocal manner by HAT P300 and class-III HDAC SIRT1 (16,17). In fact, SIRT1 functions as a negative regulator of CD4+ T cells for reduction of the inflammatory reaction (22). Thus, specific inhibitors of SIRT1 may be beneficial for enhancing FOXP3 acetylation, thereby improving Treg function (23,24).
The present study was undertaken to investigate the mechanism of Treg dysfunction in HT. It was hypothesized that such dysfunction might be caused by abnormal acetylation of FOXP3 regulated by SIRT1, and that induction of FOXP3+ Tregs with specific inhibitors of SIRT1 might upregulate FOXP3 expression and improve Treg function.
Materials and Methods
Human subjects
Thirty HT patients (5 males, 25 females; 35–65 years) were enrolled (Table 1). A clinical diagnosis of HT was based on increased serum levels of antibodies against thyroid peroxidase and/or thyroglobulin, and ultrasound examination demonstrating a characteristic heterogeneous echotexture. HT was not accompanied with thyroid cancer in any of the patients, and there was no evidence/medical history of other autoimmune diseases.
HT, Hashimoto's thyroiditis; NG, nodular goiter; HC, healthy controls; TSH, thyrotropin; fT3, free triiodothyronine; fT4, free thyroxine; TPOAb, thyroid peroxidase antibodies; TgAb, thyroglobulin antibodies.
The normal control group comprised age- and sex-matched healthy individuals with no history of autoimmune disease. This healthy control (HC) group contained 30 participants (7 males, 23 females; 35–65 years).
The second control group comprised 30 age-and sex-matched patients with thyroid nodules and euthyroid nodular goiter (NG; 6 males, 24 females; 35–65 years). They had no evidence/medical history of autoimmune diseases. NG was confirmed by ultrasound examination and thyroid function tests.
The study protocol was approved by the Ethics Committee of China Medical University (Liaoning, China). Written Informed consent was obtained from all participants: 30 subjects in the HT group, 30 subjects in the NG group, and 30 subjects in the HC group. Exclusion criteria were patients with cancer, infection, or any other immune-mediated disease.
Isolation of peripheral blood mononuclear cells and T-cell subpopulations
Peripheral venous blood collected in 10 mL tubes containing the anticoagulant heparin was used to isolate peripheral blood mononuclear cells (PBMCs; four tubes per sample). Approximately 5 × 10⁷ PBMCs were purified by Ficoll-sodium diatrizoate (Ficoll-Hypaque; Haoyang TBD, Tianjin, China) density gradient centrifugation and decanting of the supernatant. Approximately 2.5 × 10⁷ CD4+ T cells were isolated from PBMCs by magnetic-activated cell separation (MACS) and a human CD4+ T-cell isolation kit (Miltenyi Biotec, Bergisch Gladbach, Germany). Half of the CD4+ T cells were used for flow cytometric and Western blotting to measure expression of FOXP3 and SIRT1. The remaining half of the CD4+ T cells were cultured. CD4+CD25+ T cells were obtained by MACS and a CD4+CD25+ Treg isolation kit (Miltenyi Biotec) from cultured CD4+ T cells.
Western blotting
Total cellular proteins were extracted from CD4+ T cells. Briefly, CD4+ T cells were lysed in lysis buffer (25 mmol/L Tris-Cl [pH 8.8], 1 mmol/L ethylenediaminetetraacetic acid, 2% sodium dodecyl sulfate [SDS]). Protein concentration was determined and samples heated for 5 min at 100°C. Equal amounts of protein from each sample were separated by 10% sodium dodecyl sulfate–polyacrylamide gel electrophoresis (SDS–PAGE) and transferred by electrophoretic means onto polyvinylidene difluoride membranes (Millipore, Billerica, MA). Then, membranes were blocked for 2 h with 5% skimmed milk (Boster, Wuhan, China) in 50 mM of Tris-HCl (Boster), 200 mM of NaCl (Beijing Chemical Works, Beijing, China), and 0.05% Tween 20 at pH 7.5 (Beijing Solarbio Science & Technology, Beijing, China). Incubation with primary antibodies was performed overnight at 4°C followed by incubation with anti-SIRT1 (Cell Signaling Technology, Danvers, MA) or anti-Foxp3 antibody (Cell Signaling Technology) at 1/1000 dilution in TBST containing 5% bovine serum albumin. The next day, membranes were washed three times with 0.5% Tween 20 with phosphate-buffered saline (PBS), and incubated for 2 h with the appropriate horseradish peroxidase-conjugated secondary antibodies at room temperature. Immunoreactive protein bands were visualized using an Electrochemiluminescence Detection Kit (Thermo Fisher Scientific, Rockford, IL). The relationship between the mean intensity of the protein glyceraldehyde 3-phosphate dehydrogenase (GAPDH, internal control) and expression of SIRT1 or FOXP3 was used to normalize densitometric data.
Cell culture and suppression of SIRT1 expression
As described previously (16,18), isolated CD4+ T cells were incubated at 106/mL in research-grade TexMACS™ medium (Miltenyi Biotec) containing 100 IU/mL of penicillin/streptomycin (Invitrogen, Carlsbad, CA), 500 IU/mL of recombinant human interleukin (IL)-2 (Peprotech, Rocky Hill, NJ), and 25 μL/mL of ImmunoCult™ human CD2/CD3/CD28 T-cell activator (Stemcell Technologies, Vancouver, Canada) for four days. Cells were incubated in six-well plates at 37°C in an atmosphere of 5% CO2 at a relative humidity of 100%. After four days, half of the cells were treated with a specific inhibitor of SIRT1, Ex-527 (50 μM/mL), dissolved in dimethyl sulfoxide (DMSO; Selleck Chemicals, Houston, TX), and the remaining cells were treated with DMSO alone (control). Both sets of cells were cultured for 72 h. After seven days of cultivation, the number of cells in each sample can be amplified to approximately 108. Depending on whether Ex-527 was added, cell groups were denoted as follows: HT, HTE, NG, NGE, HC, and HCE.
Immunoprecipitation and determination of FOXP3 acetylation
A Pierce Classic IP kit (Thermo Fisher Scientific) was used for the FOXP3 immunoprecipitation (IP) assay. Approximately 5 × 10⁷ HT-, HC-, and NG-cultured CD4+ T cells treated or untreated with Ex-527 were lysed with IP lysis/wash buffer on ice for 30 min and vortex-mixed four or five times throughout incubation. The protein concentration was determined using the BCA Bradford assay. The expression of FOXP3 was detected in one-third of the lysates by Western blotting. Then, remnant lysates were pre-cleared by mixing and elution with control agarose resin. Next, pre-cleared lysates were mixed with anti-FOXP3 antibody (Abcam, Cambridge, United Kingdom). After overnight incubation at 4°C, the Pierce Protein A/G Agarose resin was washed twice with 100 μL of cold IP lysis/wash buffer in a Pierce spin column. Antibody/lysate samples were added to the Protein A/G Plus Agarose in a spin column and the latter agitated for 1 h. After several washing and centrifugation steps, 50 μL of 2 × reducing sample buffer was added to the spin column. The mixture was boiled for 5 min and subjected to SDS–PAGE gel. Measurement of FOXP3 acetylation was achieved by blocking membranes with anti-acetylated-lysine antibody (Cell Signaling Technology).
Flow cytometric analysis
Approximately 5 × 10⁵ CD4+ T cells were sampled at study commencement. Cells were washed in PBS and suspended in staining buffer. For analysis of the surface markers of Tregs, approximately 1 × 10⁶ CD4+ T cells were stained with two fluorescent monoclonal antibodies (Biolegend, San Diego, CA) directed to human CD4 (FICT), CD25 (Pe-cy5), incubated for 30 min at 4°C in the dark, and washed in cold flow cytometry staining buffer. For further staining of FOXP3, cells were first fixed and permeabilized using a commercial cell fixation/permeabilization kit, and then incubated with phycoerythrin (PE)-labeled anti-FOXP3 antibody (Biolegend) for 30 min in the dark at 4°C. Next, cells were washed with 2 mL of permeabilization buffer and re-suspended in staining buffer for analysis. Flow cytometric analysis was performed on a FACSCalibur™ flow cytometer (Becton Dickinson Biosciences, San Jose, CA). Isotype-matched antibodies were used as controls. A total of 50,000 events in the lymphocyte gate were acquired on the FACSCalibur and analyzed using FlowJo (Ashland, OR).
Assay to measure Treg suppression
A Treg isolation (CD4+CD25+CD127dim/−) kit was used to purify Tregs from approximately 4 × 10⁷ CD4+ T cells according to the manufacturer's (Miltenyi Biotec) instructions. Approximately 4 × 10⁶ CD4+CD25+ Tregs purified from Ex-527 treated/untreated CD4+ T cells were used as suppressor cells. Approximately 3.6 × 10⁷ CD4+CD25− Tregs were collected in a similar manner and used as responder cells. According to previous results from our research team, the maximum suppressive capacity of suppressor cells was obtained at a ratio of 1:1. As a control group, responder cells were cultured alone. A total of 5 × 10⁵ CD4+CD25− responder cells were labeled with carboxyfluorescein succinimidyl ester (CFSE) and co-cultured with 5 × 10⁵ CD4+CD25+ Tregs in 48-well round-bottom plates in a final volume of 1000 μL/well of research grade TexMACS medium (Miltenyi Biotec) containing 100 IU/mL of penicillin/streptomycin (Thermo Fisher Scientific), 500 IU/mL recombinant human IL-2 (Peprotech), and appropriate doses of Treg Suppression Inspector™, which contains anti-biotin MACSiBead™ particles preloaded with biotinylated CD2, CD3, and CD28 antibodies (Miltenyi Biotec). Plates were incubated for four days in an atmosphere of 5%CO2 at 37°C. After incubation, the cells were analyzed by FACS. Suppressive capacity of Tregs was calculated using the following formula: [100 × (1 − %CFSElowCD4+CD25− T cells in co-culture% of CFSElowCD4+CD25− T cells alone)], as described previously (25).
Statistical analyses
The results are expressed as mean ± standard deviation (SD) or median (interquartile range) according to a normal distribution test (Shapiro–Wilk test). Fisher's exact test was used for categorical variables. Each comparison between groups was examined by a one-way analysis of variance followed by Student–Newman–Keul's testing and Student's t-testing using IBM SPSS Statistics for Windows v20.0 (IBM Corp., Armonk, NY). The significance level was defined as p < 0.05. All graphs were plotted using GraphPad Prism v6.0 (GraphPad Software, Inc., La Jolla, CA).
Results
CD4+CD25+FOXP3+ T cells are significantly decreased in HT patients
The percentage of CD4+CD25+ Tregs and CD4+CD25+FOXP3+ T cells in the total number of CD4+ T cells in peripheral blood of 30 patients with HT, 30 patients with NG, and 30 HC donors was analyzed by flow cytometry. In HT patients, the CD4+CD25+ Treg population comprised 3.75–8.10% CD4+ T cells, and the CD4+CD25+FOXP3+ T-cell population comprised 1.41–3.89% CD4+ T cells (Fig. 1A and B). Compared to the HC and NG groups, the HT group showed a significant decrease in the mean number of CD4+CD25+FOXP3+ T cells (HC 3.85 ± 0.39 vs. NG 3.95 ± 0.39 vs. HT 2.50 ± 0.26; p = 0.0129; Fig. 1D). However, there were no significant differences in the mean number of CD4+CD25+ Tregs among the three groups (HC 7.36 ± 0.94 vs. NG 5.72 ± 0.57 vs. HT 5.77 ± 0.53; p = 0.1902; Fig. 1C).

Frequency of CD4+CD25+ regulatory T cells (Tregs) and CD4+CD25+FOXP3+ T cells in healthy control (HC), nodular goiter (NG), and Hashimoto's thyroiditis (HT) groups by flow cytometry. (
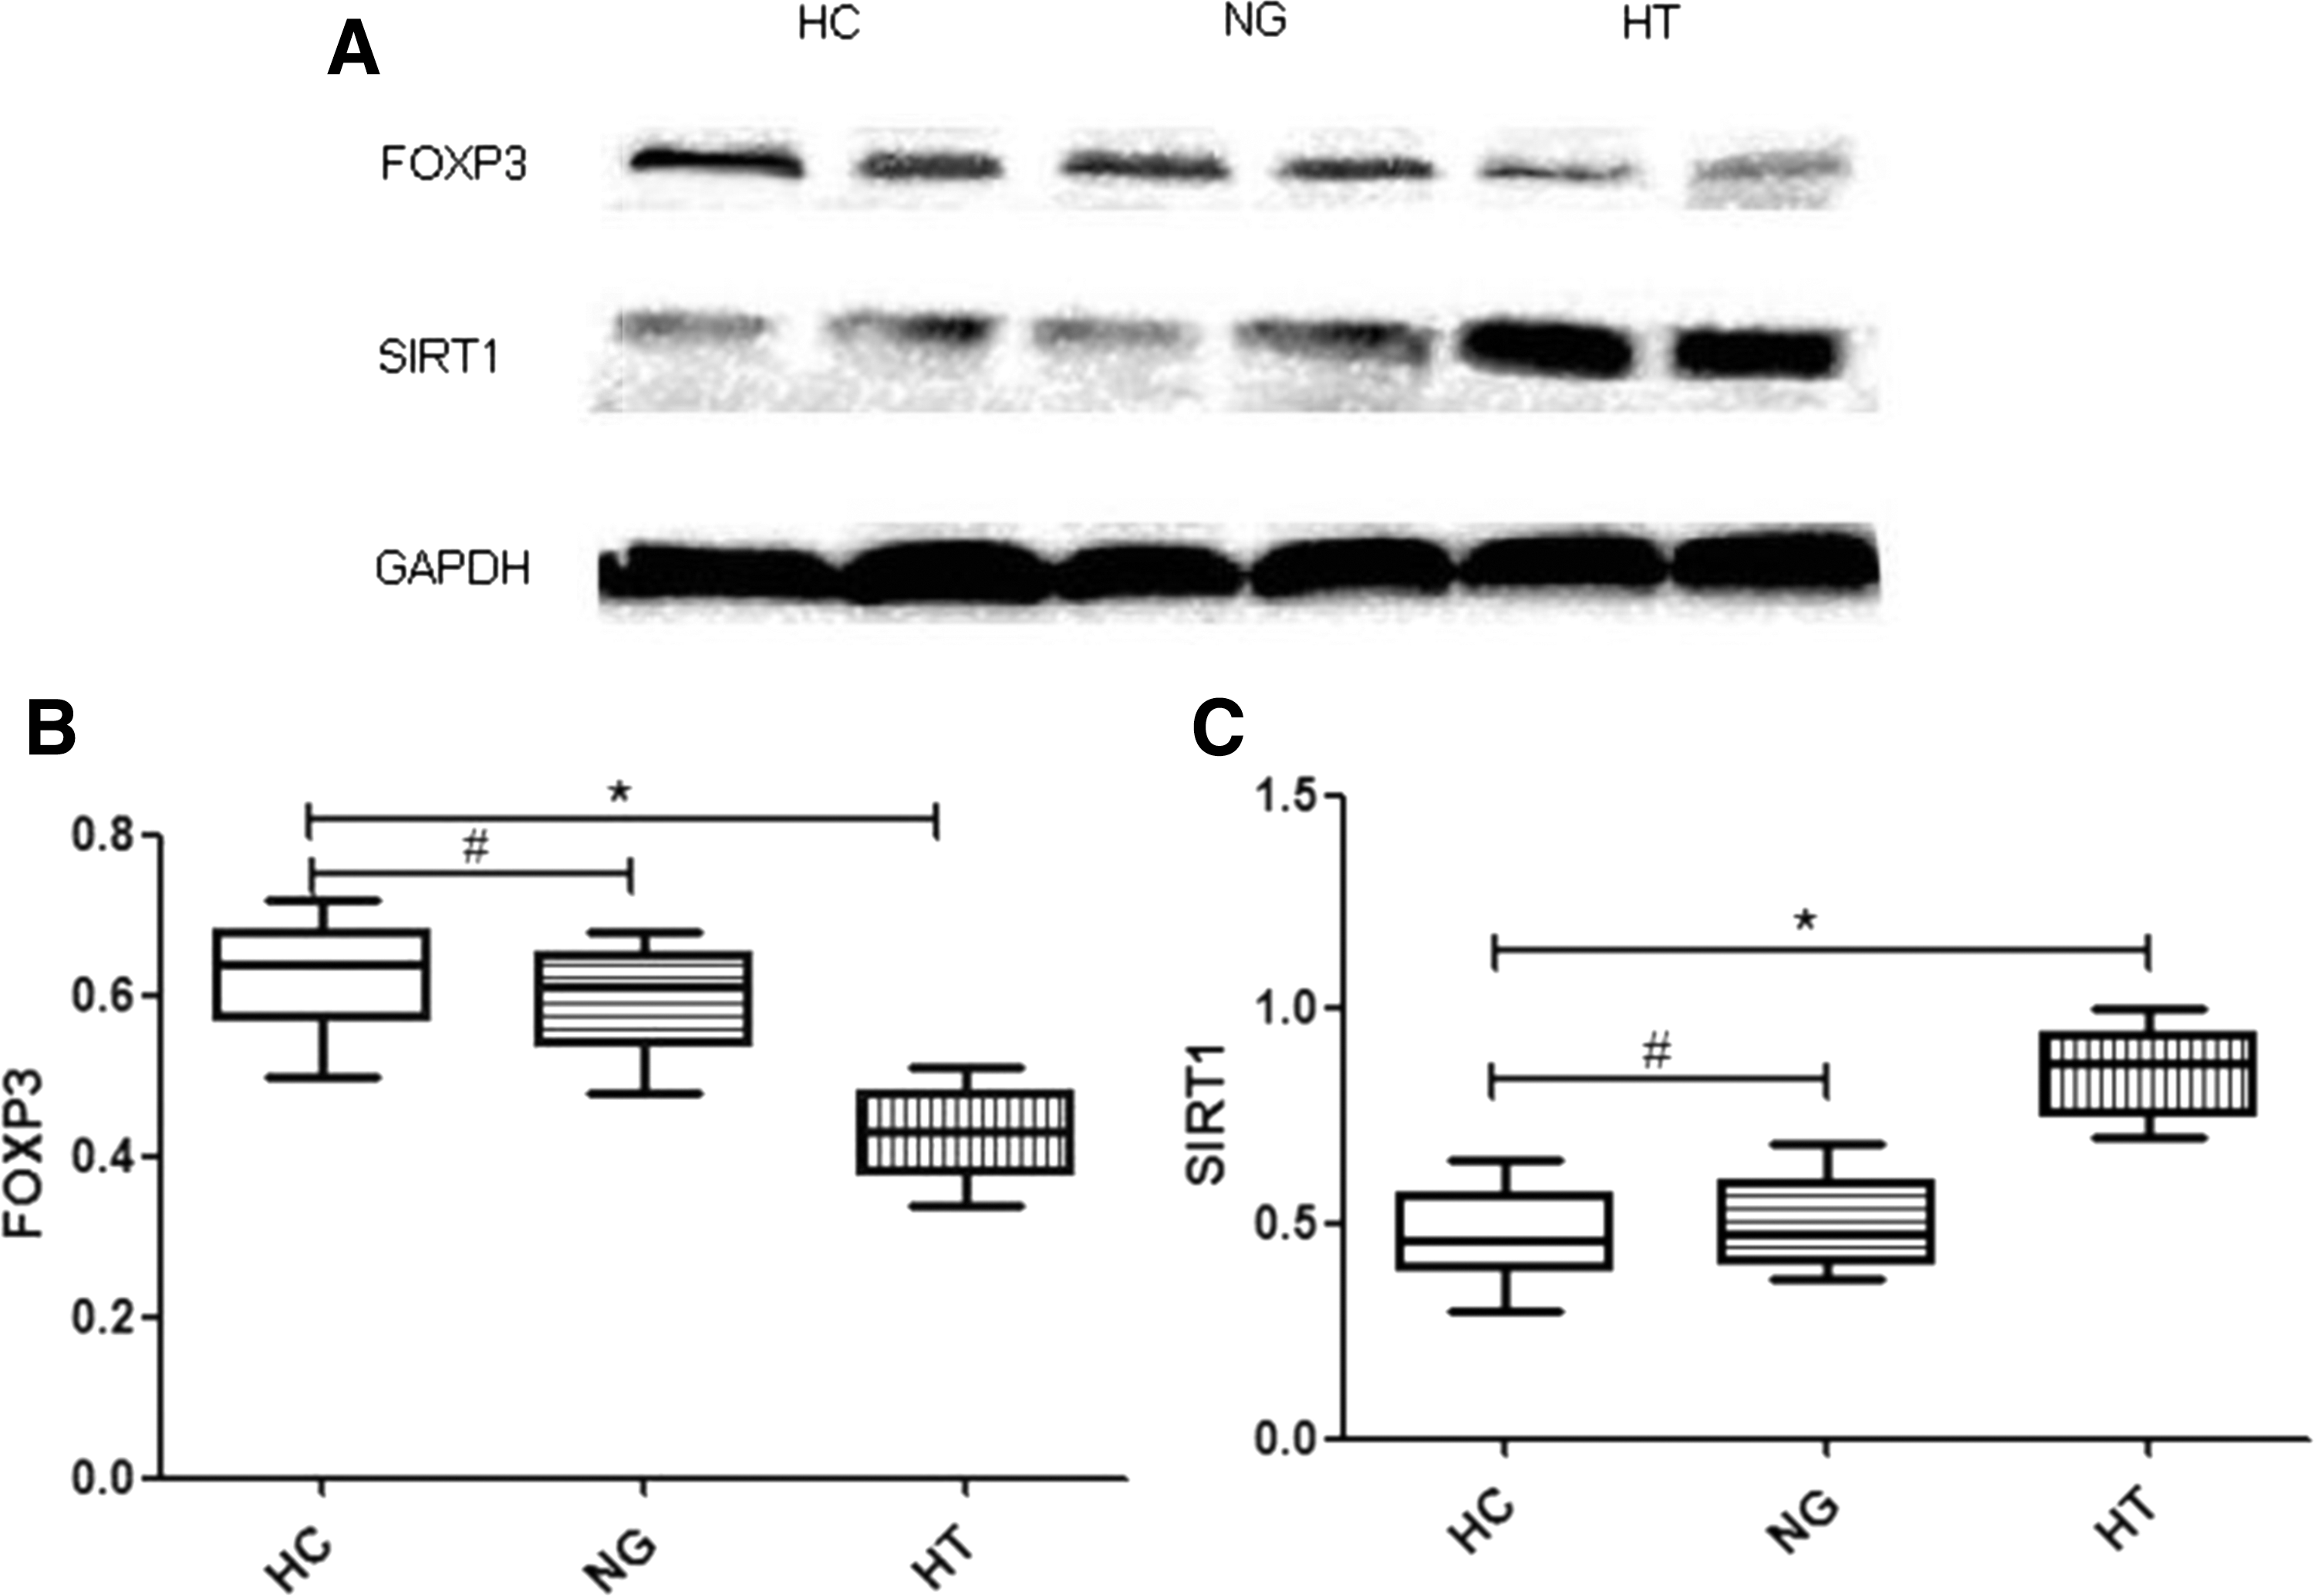
Expression levels of FOXP3 and SIRT1 in isolated CD4+ T cells
Expression of FOXP3 and SIRT1 was compared in 30 patients with HT, 30 patients with NG, and 30 HC donors (Fig. 2A). Western blot analysis showed a significant reduction of FOXP3 expression in isolated CD4+ T cells from HT patients compared to that in CD4+ T cells from NG patients or HC donors (HT 0.42 ± 0.009 vs. NG 0.59 ± 0.01 vs. HC 0.62 ± 0.01; p < 0.0001; Fig. 2B1). SIRT1 expression in the CD4+ T cells from HT patients was significantly higher than that in CD4+ T cells from NG patients and HC donors (HT 0.84 ± 0.02 vs. NG 0.50 ± 0.01 vs. HC 0.47 ± 0.01; p < 0.0001; Fig. 2B2).
(
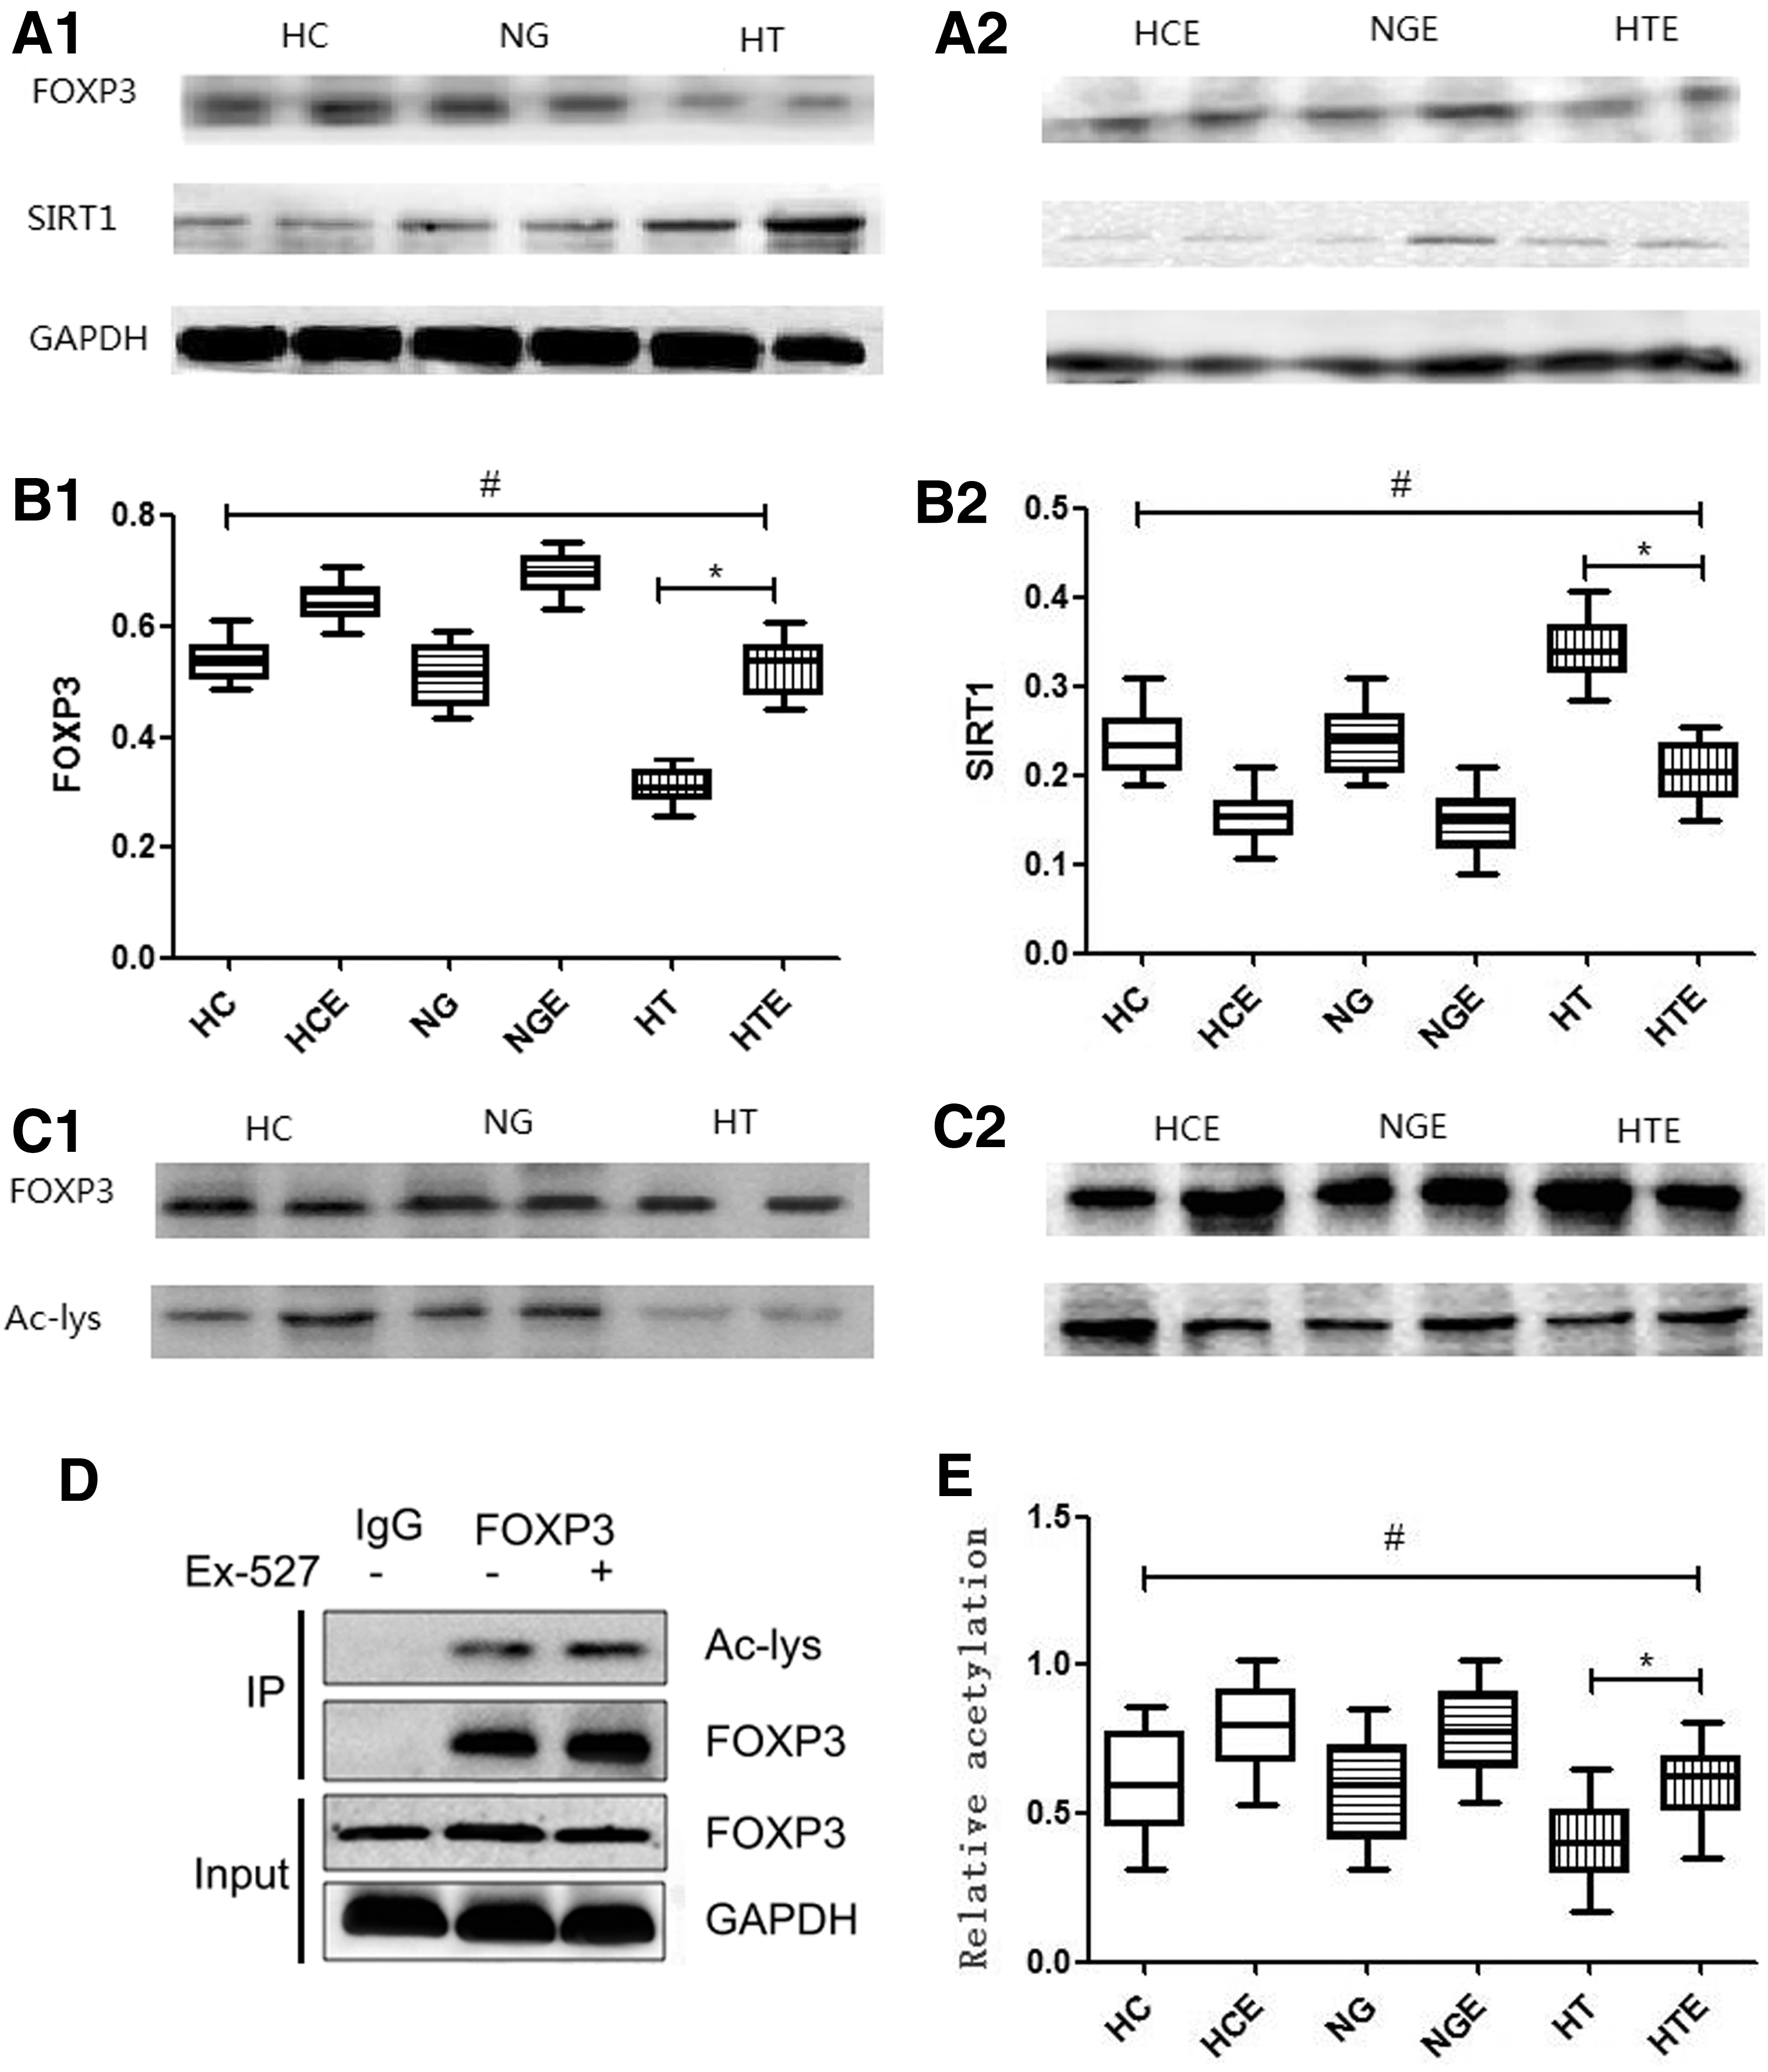
Inhibition of SIRT1 expression increased acetylation and expression of FOXP3 in HT patients
Acetylation and expression of FOXP3 protein and expression of SIRT1 was analyzed in cultured CD4+ T cells from 25 HT patients, 24 NG patients, and 27 HC donors, and a difference was detected in the amount of acetylated FOXP3, as well as in the expression of FOXP3 and SIRT1 among these groups (Fig. 3A1and A2). The results showed that the level of FOXP3 in the Ex-527-treated HT group was significantly higher than that in the untreated HT group (HTE 0.52 ± 0.01 vs. HT 0.30 ± 0.01; p < 0.0001). Comparison of FOXP3 expression in HTE and HC showed no significant difference (HTE 0.52 ± 0.01 vs. HC 0.53 ± 0.01; p = 0.53; Fig. 3B1). SIRT1 expression in the Ex-527-treated HT group was significantly lower than that in the untreated HT group (HTE 0.20 ± 0.01 vs. HT 0.34 ± 0.01; p < 0.0001), and it was not significantly different compared to the HC group (HTE 0.20 ± 0.01 vs. HC 0.23 ± 0.01; p = 0.056; Fig. 3B2). To assess FOXP3 acetylation in cultured CD4+ T cells, FOXP3 protein was immunoprecipitated from cell lysates, followed by blotting with anti-acetylated lysine antibody (Fig. 3C1 and C2). FOXP3 acetylation in the HT group was significantly lower than that observed in the NG group and HC group (HT 0.40 ± 0.03 vs. NG 0.57 ± 0.04 vs. HC 0.60 ± 0.04; p = 0.0019). Among Ex-527-treated groups, the level of FOXP3 acetylation in the HTE group was significantly higher than that detected in the HT group (HTE 0.59 ± 0.03 vs. HT 0.40 ± 0.03; p = 0.0002), and it was increased to a level comparable to that observed in the HC group (HTE 0.59 ± 0.03 vs. HC 0.60 ± 0.04; p = 0.93; Fig. 3D).
(
Inhibition of SIRT1 expression increased the number of CD4+CD25+FOXP3+ T cells in HT patients
After seven days of culture with or without Ex-527, the percentage of CD4+CD25+ Tregs and CD4+CD25+FOXP3+ T cells in the total number of cultured CD4+ T cells was determined in 26 patients with HT, 25 patients with NG, and 28 HC donors. In the HT and HTE groups, the CD4+CD25+ Treg population comprised 3.26–8.56% and 9.3–13.87% CD4+ T cells, respectively, and the CD4+CD25+FOXP3+ T-cell population comprised 2.8–7.1% and 5.1–11.9% CD4+ T cells of the CD4+ T cells, respectively (Fig. 4A and B). As a result, the mean number of CD4+CD25+ Tregs in the Ex-527-treated HT group was significantly higher compared to the untreated HT groups (HTE 11.8 ± 0.66 vs. HT 7.06 ± 0.57; p < 0.0001). Comparison analysis between the HTE and HC groups showed no significant difference (HTE 11.8 ± 0.66 vs. HC 9.71 ± 0.89; p = 0.075; Fig. 4C), indicating that the number of CD4+CD25+ Tregs in HTE was increased up to the level detected in HC. Simultaneously, the mean number of CD4+CD25+FOXP3+ T cells in the Ex-527-treated HT group was significantly higher than that in the untreated HT group (HTE 9.09 ± 0.92 vs. HT 4.86 ± 0.58; p = 0.0017). When compared to the HC group, the HTE group showed no difference in the mean frequency of CD4+CD25+FOXP3+ T cells, indicating that these cells were increased up to the level in the HC group (HTE 9.09 ± 0.92 vs. HC 8.09 ± 0.6; p = 0.3829; Fig. 4D).
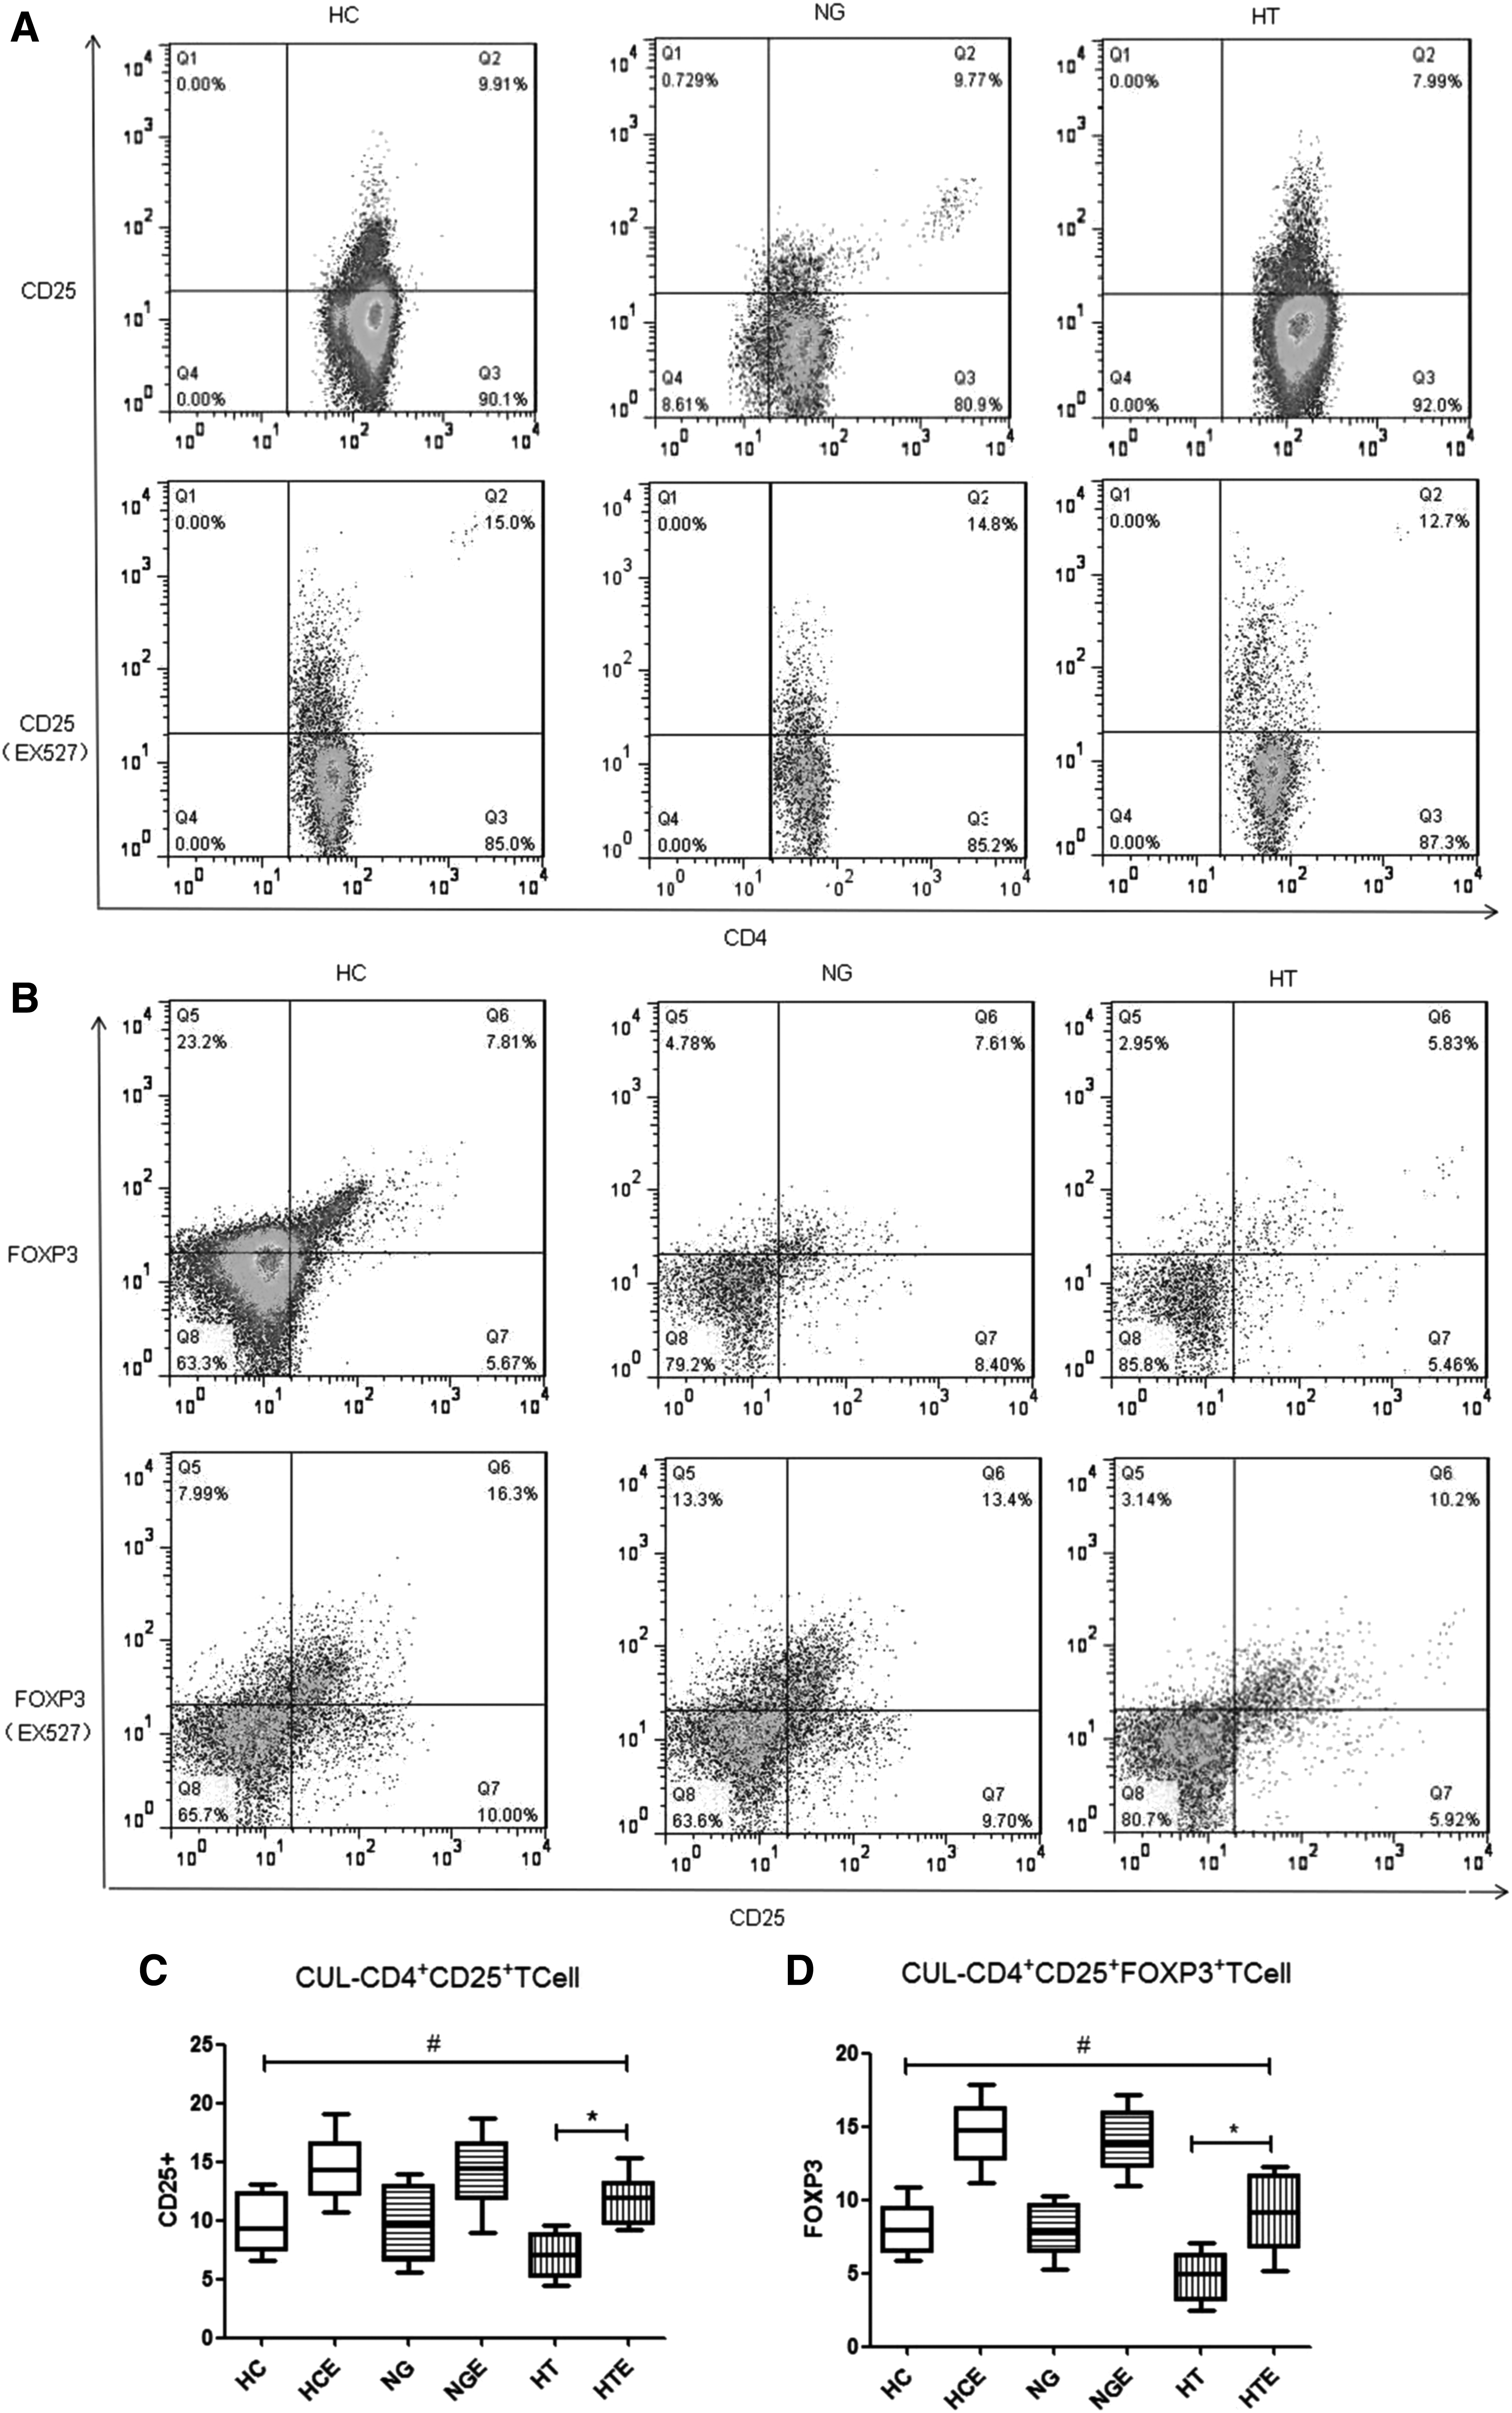
(A) Ex-527-treated CD4+CD25+ T cells in three representative profiles all increased compared to untreated cells. (
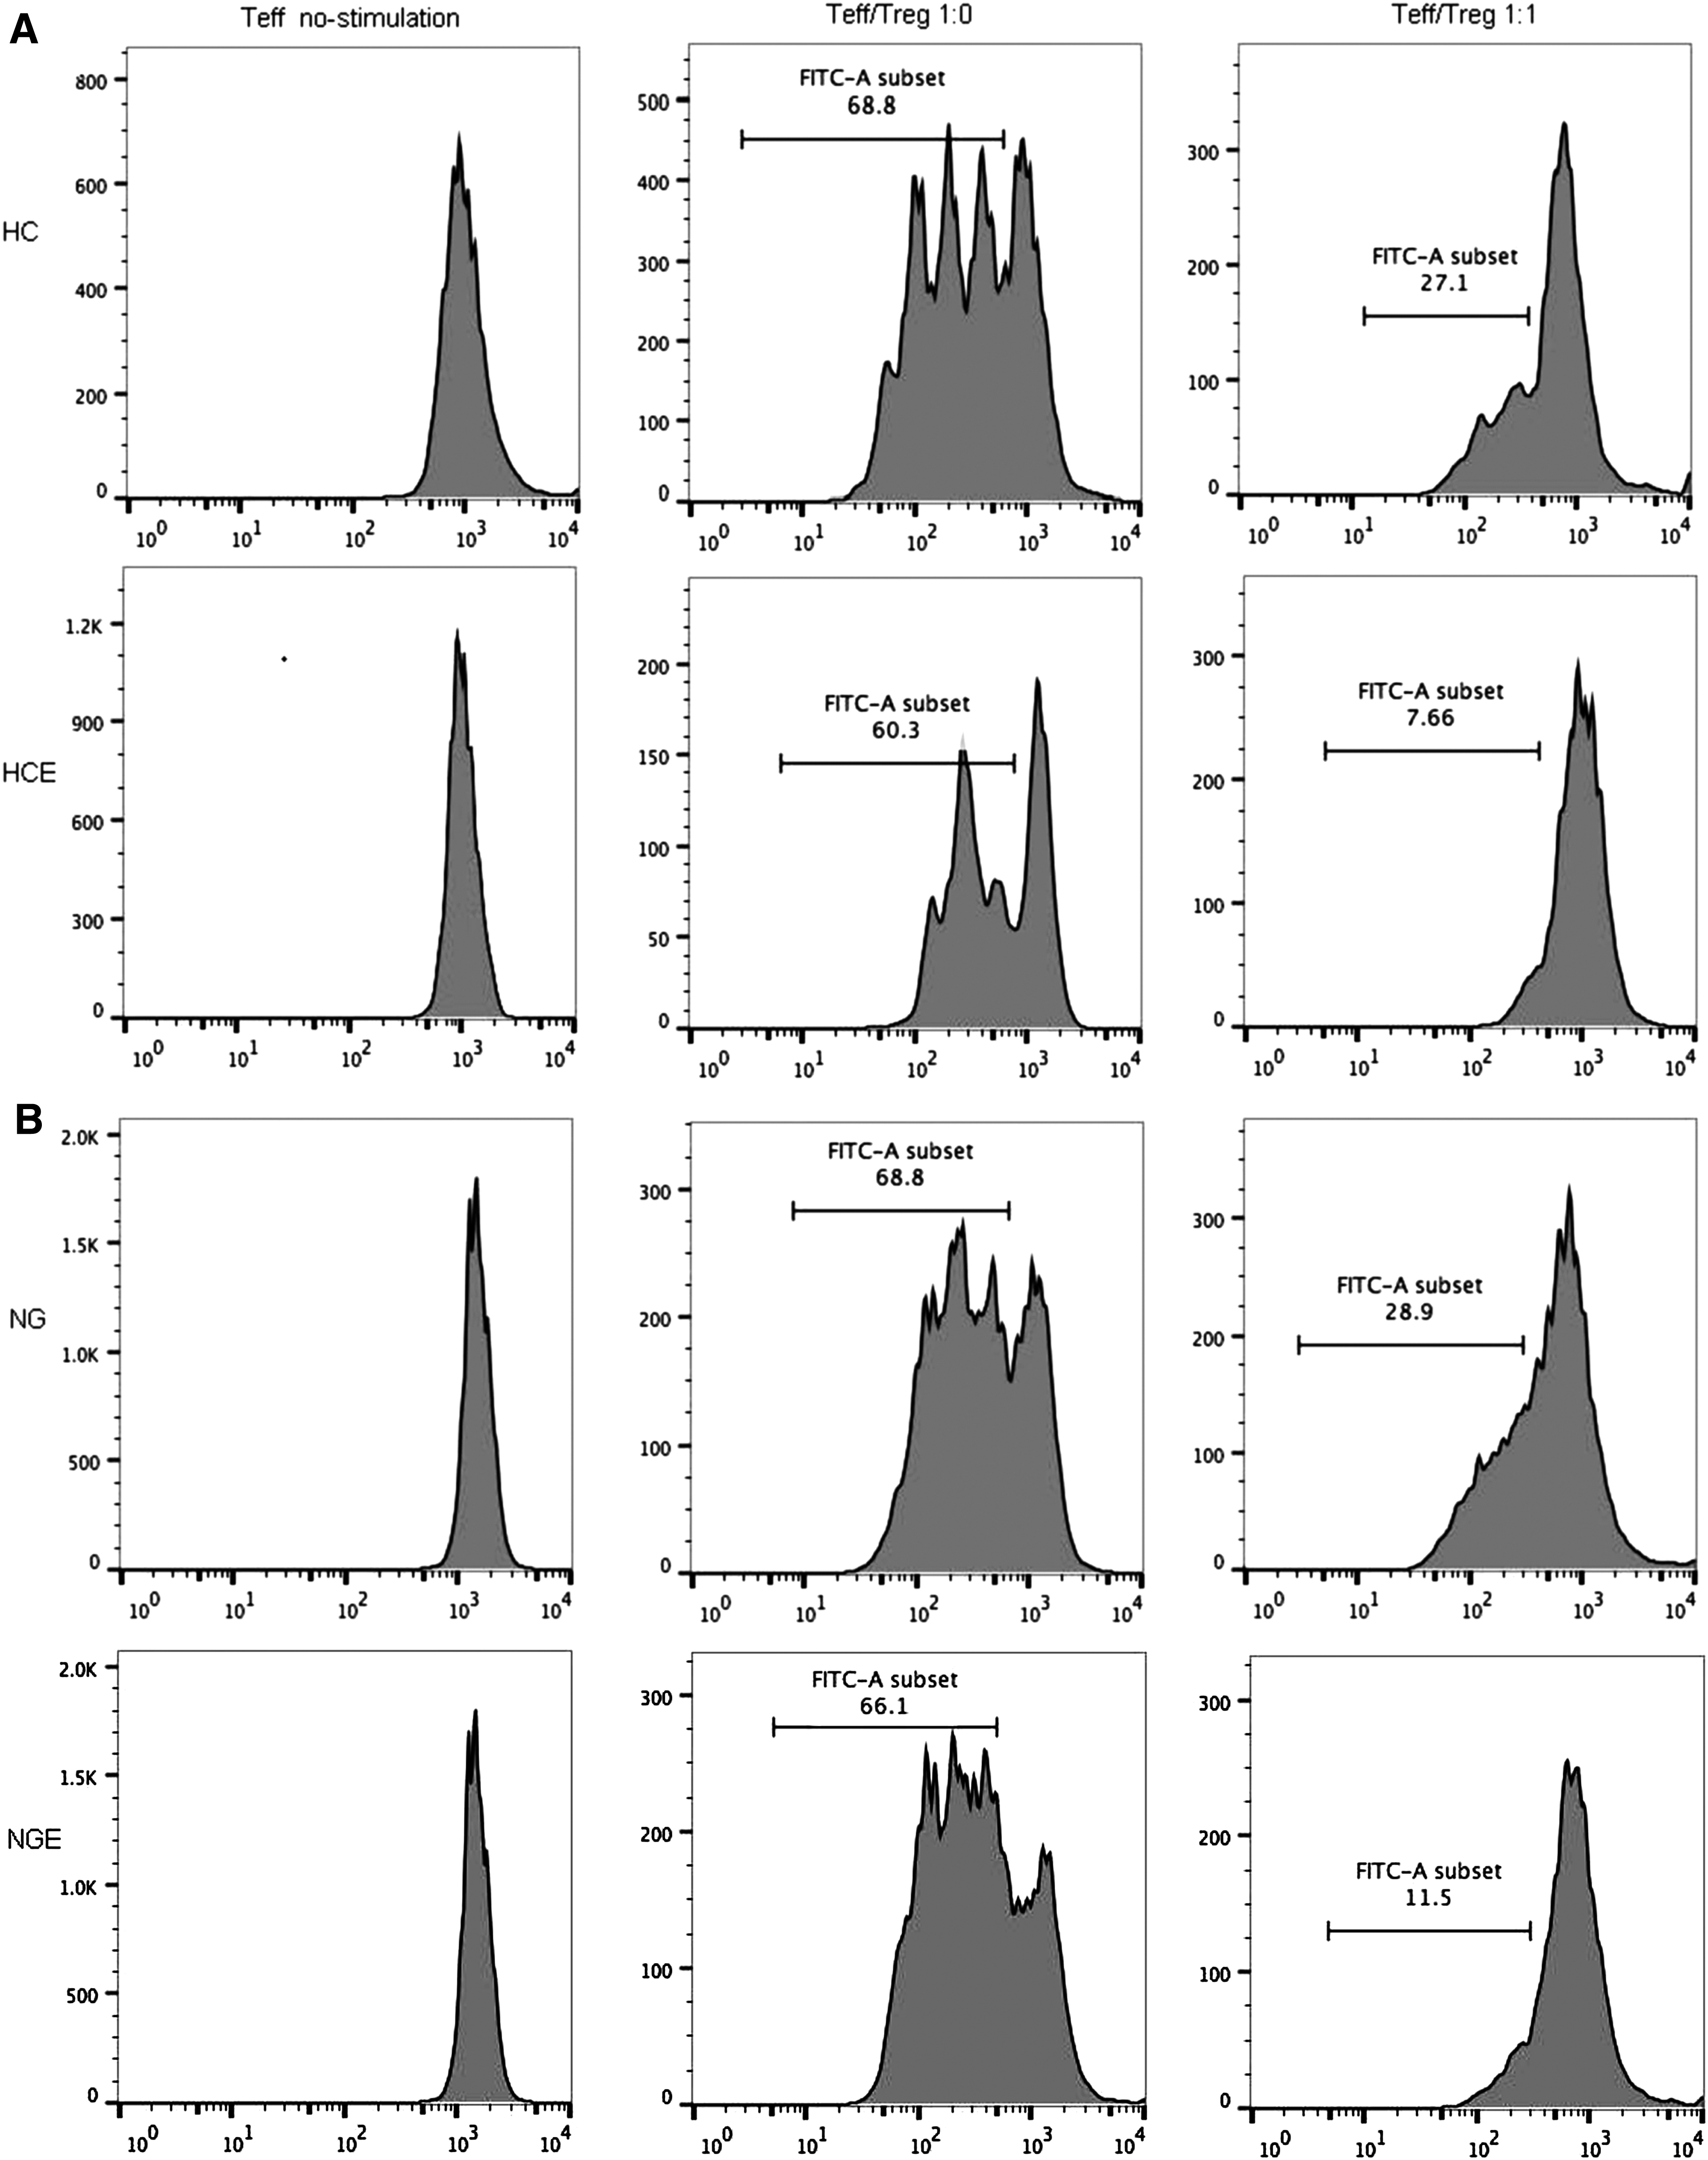
Inhibition of SIRT1 expression improved the suppressive function of Tregs in HT patients
A CFSE-based suppression assay was used to evaluate functional suppression of CD4+CD25+ T cells from the HT, NG, and HC groups. Upon Ex-527 treatment, CFSE-labeled CD4+CD25− responder cells and CD4+CD25+ Tregs were placed together at a ratio of 1:0 and 1:1, as recommended by Treg Suppression Inspector (25), and the proliferation of responder cells was measured (Fig. 5A–C). Freshly isolated CD4+CD25− T cells from the HT group showed the same high rate of proliferation as the NG group and the HC group (HT 69.62 ± 0.98% vs. NG 67.69 ± 0.74% vs. HC 67.43 ± 0.64%; p = 0.1243). Among Ex-527-treated groups, CD4+CD25− T cells from the Ex-527-treated groups showed the same proliferation rate as the untreated groups (Fig. 5D). The regulatory properties of Tregs were investigated by testing their ability to suppress proliferation of responder cells. At a ratio of 1:1, the inhibition ratio of responder T cells from the HT group was significantly lower than that from the NG group or HC group after co-culture with autologous Tregs (HT 49.87 ± 0.88% vs. NG 58.63 ± 0.91% vs. HC 62.03 ± 1.05%; p < 0.0001). Tregs from the HTE groups, however, showed a significantly improved ability to suppress responder cells compared to that of the HT group (HTE 60.30 ± 0.88% vs. HT 49.87 ± 0.88%; p < 0.0001), and when compared to that of Tregs in the HC group, it showed no significant difference (HTE 60.30 ± 0.88% vs. HC 62.03 ± 1.05%; p = 0.204; Fig. 5E). The data above demonstrate that SIRT1-mediated regulation of acetylation could modulate FOXP3 expression in CD4+ T cells and the number of CD4+CD25+ Tregs. Importantly, inhibition of SIRT1 by Ex-527 could significantly improve the function of Tregs in HT.
(

Discussion
Accumulating evidence has revealed the important role of FOXP3 in the maintenance of immune homeostasis and prevention of autoimmune diseases (16). The number and functionality of immunosuppressive Tregs have been implicated in various autoimmune diseases, including HT (26). Despite various research conducted in recent years, the pathogenesis of HT is still not fully understood. Previous studies have suggested that the chronic inflammatory infiltration of the thyroid in HT results from an autoreactive T-cell-mediated autoimmune response that is induced by Treg dysfunction (6). Eventually, this abnormal autoimmune response leads to destruction of thyroid tissue.
FOXP3 plays an important role in the maintenance of the autoimmune response and self-tolerance by Tregs. Loss-of-function in FOXP3 is accompanied by a lack of functional Tregs, and can induce severe autoimmune diseases in mice and humans (11,12,27). This study demonstrated a reduced expression of FOXP3 and a reduction in the suppressive function of Tregs in HT patients. Although the finding reveals no significant alterations in the frequency of CD4+CD25+ Tregs in HT patients, the decreased number of CD4+CD25+FOXP3+ T cells is responsible for Treg functional deficiency. A beneficial effect was dependent upon Treg number, but the underlying mechanisms in HT and related autoimmune diseases remain unclear (28).
Histone acetylation is a major modification that affects gene expression by HATs and HDACs (29). In addition to histones, some non-histones can be acetylated and deacetylated (16,30). Studies have suggested that acetylation regulates the transcriptional activity of FOXP3 (31 –33). Under normal physiologic conditions, FOXP3 hyperacetylation is important for maintenance of expression of FOXP3 protein and, consequently, is vital for development of the suppressive function of Tregs (34,35). This study demonstrates that expression and acetylation of FOXP3 in HT patients were reduced, and were related to reduction in the suppressive function of Tregs. The results demonstrate for the first time a major function of acetylation in the regulation of the stability of the FOXP3 protein, whereas FOXP3 deacetylation may lead to dysfunction of Tregs in HT patients.
The results presented in this study show that: the expression of FOXP3 protein is controlled directly by acetylation, SIRT1 functions as a negative regulator for FOXP3 in HT, specific blocking of SIRT1 could increase FOXP3 acetylation, and FOXP3 hyperacetylation in CD4+ T cells would result in more FOXP3+ cells, higher expression of FOXP3 protein, and improved suppressive abilities. To ascertain whether SIRT1 is an initiation factor for the phenomena mentioned above, SIRT1 expression was measured in HT and control groups: SIRT1 expression was increased significantly in the HT group. After treatment with Ex-527 (a specific inhibitor of SIRT1), acetylation and expression of FOXP3 in HT was significantly increased. Moreover, the defect in Treg function was ultimately improved.
In conclusion, this study shows that expression of FOXP3 protein can be closely regulated by acetylation. Abnormal acetylation of FOXP3 is induced by high expression of SIRT1, and it might be one of the causes of the abnormal autoimmune response and T-cell infiltration in HT patients. Accordingly, the most important mechanism for regulation of the Treg function is prevention of FOXP3 deacetylation, which leads to an autoimmune response. Acetylation modification regulated by HDAC inhibitors, a specific inhibition of SIRT1, could become a promising strategy to augment Treg function. The present study establishes a possible role for FOXP3 deacetylation in HT pathogenesis. Thus, the findings have an important implication for the development of a new therapeutic basis for HT to regulate Treg function through the pharmacologic stabilization of FOXP3 acetylation and protein levels.
Footnotes
Acknowledgments
We gratefully acknowledge Shuyan Du in the Key Laboratory of the First Hospital of China Medical University for important assistance with the techniques. We also acknowledge the patients, investigators, and co-investigators. This work was supported by the National Natural Science Foundation of China (81600602).
Author Disclosure Statement
The authors declare that no competing financial interests exist.