
Abstract
Background:
It was hypothesized that the biguanides metformin and phenformin, which are anti-hyperglycemic drugs used for diabetes mellitus, would have therapeutic effects in an in vitro model of Graves' orbitopathy (GO). Because adipogenesis, hyaluronan production, and inflammation are considered important in the pathogenesis of GO, this study aimed to determine the therapeutic effects and underlying mechanisms of biguanides on these parameters.
Methods:
In vitro experiments were performed using primary cultured orbital fibroblasts from patients with GO. Orbital preadipocyte fibroblasts were allowed to differentiate into adipocytes and were treated with various concentrations of metformin or phenformin. Oil Red O staining was performed to evaluate lipid accumulation within the cells. Western blot analysis was used to measure the expression of adipogenic transcription factors and the phosphorylation of AMP-activated protein kinase and mitogen-activated protein kinase signaling proteins. Hyaluronan production was measured using enzyme-linked immunosorbent assay, and mRNA levels of proinflammatory molecules were determined using real-time polymerase chain reaction after interleukin (IL)-1β stimulation with or without biguanide treatment.
Results:
Lipid accumulation during adipogenesis in GO orbital fibroblasts was dose-dependently suppressed by both metformin and phenformin. Adipocyte differentiation was attenuated, and the adipogenic transcription factors peroxisome proliferator-activated receptor γ and CCAAT-enhancer-binding proteins-α/β were downregulated. Furthermore, metformin and phenformin increased the phosphorylation of AMP-activated protein kinase and suppressed extracellular-regulated kinase activation. The IL-1β-induced hyaluronan production and mRNA expression of IL-6, cyclooxygenase-2, and intercellular adhesion molecule-1 were also significantly suppressed after metformin or phenformin co-treatment.
Conclusions:
The present study indicates that the biguanides metformin and phenformin exert an anti-adipogenic and inhibitory effect on hyaluronan production and expression of pro-inflammatory molecules in GO orbital fibroblasts, suggesting that they could potentially be used for the treatment of GO.
Introduction
G
Many clinical features of GO are caused by the expansion of orbital fatty connective tissues and extraocular muscles. The increase in tissue volume is characterized by the infiltration of immune cells, including T-cells, B-cells, and mast cells (5,6). Hyaluronan production greatly increases in orbital fibroblasts of patients with GO in response to various cytokines. The proportion of preadipocytes capable of differentiating into adipocytes also increases compared to that of normal orbital fibroblasts (6 –9).
Standard treatment of GO includes immunosuppressive therapies and orbital irradiation, but specific therapeutic agents targeting the pathogenic mechanism have not yet been developed. Glucocorticoids are frequently used for their anti-inflammatory and immunosuppressive effects, but they elicit long-term side effects, including Cushingoid features, diabetes, and hypertension (6).
This study investigated the therapeutic effects of the biguanides, including metformin and phenformin, in an in vitro model of GO. Biguanides are widely used to treat diabetes because of their anti-hyperglycemic and weight-loss effects (10). These effects result from the activation of catabolic pathways through phosphorylation of AMP-activated protein kinase (AMPK) (11). AMPK plays an important role in the regulation of energy balance, and recent evidence suggests that AMPK is also related to anti-inflammatory actions in adipose tissue (12,13).
Based on their mechanism of action, it was hypothesized that biguanides would have therapeutic effects in GO. The inhibitory effects of biguanides during adipogenesis and the signaling pathways involved in the process were investigated. The study further evaluated whether hyaluronan production and mRNA expression of pro-inflammatory molecules were suppressed by biguanides to determine if biguanides are a potential GO treatment.
Materials and Methods
Reagents and chemicals
High glucose Dulbecco's modified Eagle's medium (DMEM), fetal bovine serum (FBS), and penicillin/streptomycin were purchased from GE Healthcare Life Sciences, Inc. (HyClone™; Logan, UT). Metformin, phenformin, U0126, 5-aminoimidazole-4-carboxamide ribonucleotide (AICAR), Compound C, Oil Red O powder, dexamethasone, and phenylmethylsulfonyl fluoride (PMSF) were purchased from Sigma–Aldrich (St. Louis, MO). Cell lysis buffer (10 × , #9803), phospho-extracellular signal-regulated kinase 1/2 (ERK(1/2)), phospho-AKT(S473), total ERK, and total AKT antibodies were purchased from Cell Signaling Technology (Danvers, MA). Peroxisome proliferator-activated receptor gamma (PPARγ), CCAAT-enhancer-binding proteins (c/EBP)α/β, and β-actin antibodies were purchased from Santa Cruz Biotechnology (Dallas, TX). MTS assay solution (#G3580) was purchased from Promega Corporation (Madison, WIUSA). The hyaluronan enzyme-linked immunosorbent assay (ELISA) kit was purchased from Echelon Bioscience, Inc. (Salt Lake, UT). Rosiglitazone was purchased from Cayman Chemical Company (Ann Arbor, MI), and insulin was purchased from Roche Diagnostics Corporation (Indianapolis, IN). NucleoZOL RNA isolation reagent was purchased from Clontech (Mountain View, CA). The ReverTra Ace® qPCR RT kit was purchased from TOYOBO (Osaka, Japan).
Orbital fibroblast cell culture
Human primary orbital fibroblast cultures were prepared as reported previously (6,9,14). The protocol was approved by the Institutional Review Board of Severance Hospital, and informed consent was obtained from all patients. Orbital adipose/connective tissue explants were obtained from patients with GO (n = 6; four women and two men, aged 38–57 years) who were undergoing surgical decompression, and all the cases were euthyroid at the time of surgery. Normal orbital adipose/connective tissue specimens were collected during the course of orbital surgery from patients with no history of thyroid disease or GO (n = 6; three women and three men, aged 35–52 years). Clinical information of patient samples used in the study is provided in Table 1. Tissue explants were minced with scissors and plated in 10 cm culture dishes in DMEM/F-12 containing 20% FBS and 1% penicillin/streptomycin. After fibroblasts had grown from the explants, cells were passaged with trypsin/EDTA, and cultures were maintained in DMEM containing 10% FBS and 1% penicillin/streptomycin using standard cell culture protocols. Passages under five were used for the experiments, and each experiment was repeated using fibroblasts from at least three independent GO patient samples.
GO, Graves' orbitopathy; CAS, clinical activity scores; GC, glucocorticoids; n/a, not applicable; F, female; M, male; R/L, right or left eyes.
Adipogenesis and Oil Red O staining
Cells were plated in either a six-well plate or 6 cm culture dish and allowed to reach confluence. Differentiation was initiated by the addition of 10 μM of rosiglitazone, 33 μM of biotin, 17 μM of pantothenic acid, 10 μg/mL of transferrin, 0.2 nM of triiodothyronine (T3), 1 μM of insulin, 0.2 μM of carbaprostaglandin, 1 μM of dexamethasone, and 0.1 mM of 3-isobutyl-1-methylxanthine (IBMX). The differentiation was continued for 10 days, along with 10, 100, and 1000 μM of metformin and 1, 10,100 μM of phenformin. The media was replaced every 2–3 days, and dexamethasone and IBMX were excluded from day 7.
For Oil Red O staining, a stock solution of 0.5% (w/v) Oil Red O in isopropanol was prepared. For working solutions, 6 mL of prepared stock solution was mixed with 4 mL of distilled water and incubated at room temperature for 1 h before filtering through a 0.2 μm filter. Differentiated cells were gently washed with warm phosphate-buffered saline (PBS) and fixed with 10% formalin at 4°C for 1–16 h. Fixed cells were gently washed with distilled water, stained with Oil Red O solution for 20 min at 20°C, and then washed again with distilled water. Stained cells were visualized and examined microscopically. For quantification, isopropanol was added to solubilize cell-bound Oil Red O after the cells were completely dried, and the absorbance was measured with a spectrophotometer at 490 nm.
Western blot assay
Cells were harvested, washed twice with cold PBS, and then lysed in 1 × cell lysis buffer containing 1 mM of PMSF. Lysis buffer (60 μL) was added to each 6 cm culture dish, and the cells were lysed on ice for 30 min before being centrifuged for 15 min at 15,000 g. The protein concentration was determined using a Bradford assay kit (Bio-Rad, Hercules, CA). Equal amounts of protein were subjected to sodium dodecyl sulfate-polyacrylamide gel electrophoresis, transferred to polyvinylidene difluoride membranes (Immobilon; Millipore, Billerica, MA), and then probed with the specific antibodies after membrane blocking for 1 h with 5% skim milk at room temperature. After incubation with primary and secondary antibodies, the blot was visualized using a chemiluminescent Western Blotting Detection kit (GE Healthcare Life Sciences, Inc.) and exposure to x-ray film (Agfa HealthCare, Mortsel, Belgium). Band intensities were quantified using Image J software.
Hyaluronan measurement
Cells were plated in a 96-well plate (5 × 10³ cells/well) and allowed to attach. After 16–24 h, cells were treated with different concentrations of drugs, along with 1 ng/mL of interleukin (IL)-1β in DMEM with 1% FBS. After 24 h, the cell culture media were collected and centrifuged at 5000 g for 10 min, and the hyaluronan concentration was determined using the hyaluronan ELISA kit, according to the manufacturer's instructions.
RNA extraction and real-time polymerase chain reaction
Cells were plated in 6 cm culture dishes and cultured until the cell density reached approximately 80% confluency. Cells were pretreated with different doses of drugs for 6 h, then stimulated with IL-1β in DMEM containing 1% FBS. After 24 h, cells were washed twice with cold PBS, and RNA was extracted using NucleoZOL RNA extraction reagent, according to the manufacturer's instructions. cDNA was synthesized from 1 μg of total RNA using the ReverTra Ace® qPCR RT kit (TOYOBO). Real-time PCR was performed using a StepOnePlus™ Real-Time PCR Systems (Thermo Fisher Scientific, Waltham, MA) and RealHelix qPCR kit (Nanohelix, Daejeon, South Korea). The primers used for the experiments were as follows: GAPDH forward 5′-GCC AAG GTC ATC CAT GAC AAC-3′ and reverse 5′-GTC CAC CAC CCT GTT GCT GTA-3′; interleukin-6 (IL-6) forward 5′-TCA ATG AGG AGA CTT GCC TG-3′ and reverse 5′-GAT GAG TTG TCA TGT CCT GC-3′; cyclooxygenase-2 (COX-2) forward 5′-GTT CCA CCC GCA GTA CAG-3′ and reverse 5′-GGA GCG GGA AGA ACT TGC-3′; and intercellular adhesion molecule 1 (ICAM-1) forward 5′-GGC CTC AGC ACG TAC CTC TA-3′ and reverse 5′-TGC TCC TTC CTC TTG GCT TA-3′.
Statistical analysis
ImageJ software was used for densitometry analysis of the Western blot bands. All calculations and statistical analyses were performed using GraphPad Prism v6 (GraphPad Software, Inc., La Jolla, CA). All experiments were performed using cell cultures isolated from at least three different patients with GO. Data were analyzed using Student's t-tests and are presented as mean values with standard deviations calculated from three repeated experiments. p-Values <0.05 were considered significant.
Results
Anti-adipogenic effect of metformin and phenformin in GO orbital fibroblasts
To determine the non-cytotoxic concentration of metformin and phenformin in orbital fibroblasts, an MTS assay was performed. The results indicate that concentrations <1000 μM of metformin and <100 μM of phenformin were not cytotoxic to non-GO and GO orbital fibroblasts (Supplementary Fig. S1; Supplementary Data are available online at
Cultured orbital fibroblasts/preadipocytes obtained from patients with GO were allowed to differentiate into adipocytes for 10 days. Oil Red O staining showed that adipogenesis was significantly stimulated after treatment with 10 μM of rosiglitazone (p < 0.001). However, non-GO control fibroblasts were not effectively differentiated, even with the same stimulation. Therefore, subsequent experiments were carried out using only GO orbital fibroblasts. Interestingly, co-treatment with metformin or phenformin dose-dependently inhibited intracellular lipid droplet formation induced by rosiglitazone (Fig. 1). According to the quantitative analysis in Figure 1B, adipogenesis was suppressed by 35 ± 4.5% with 1000 μM of metformin and 45 ± 2.9% with 100 μM of phenformin.
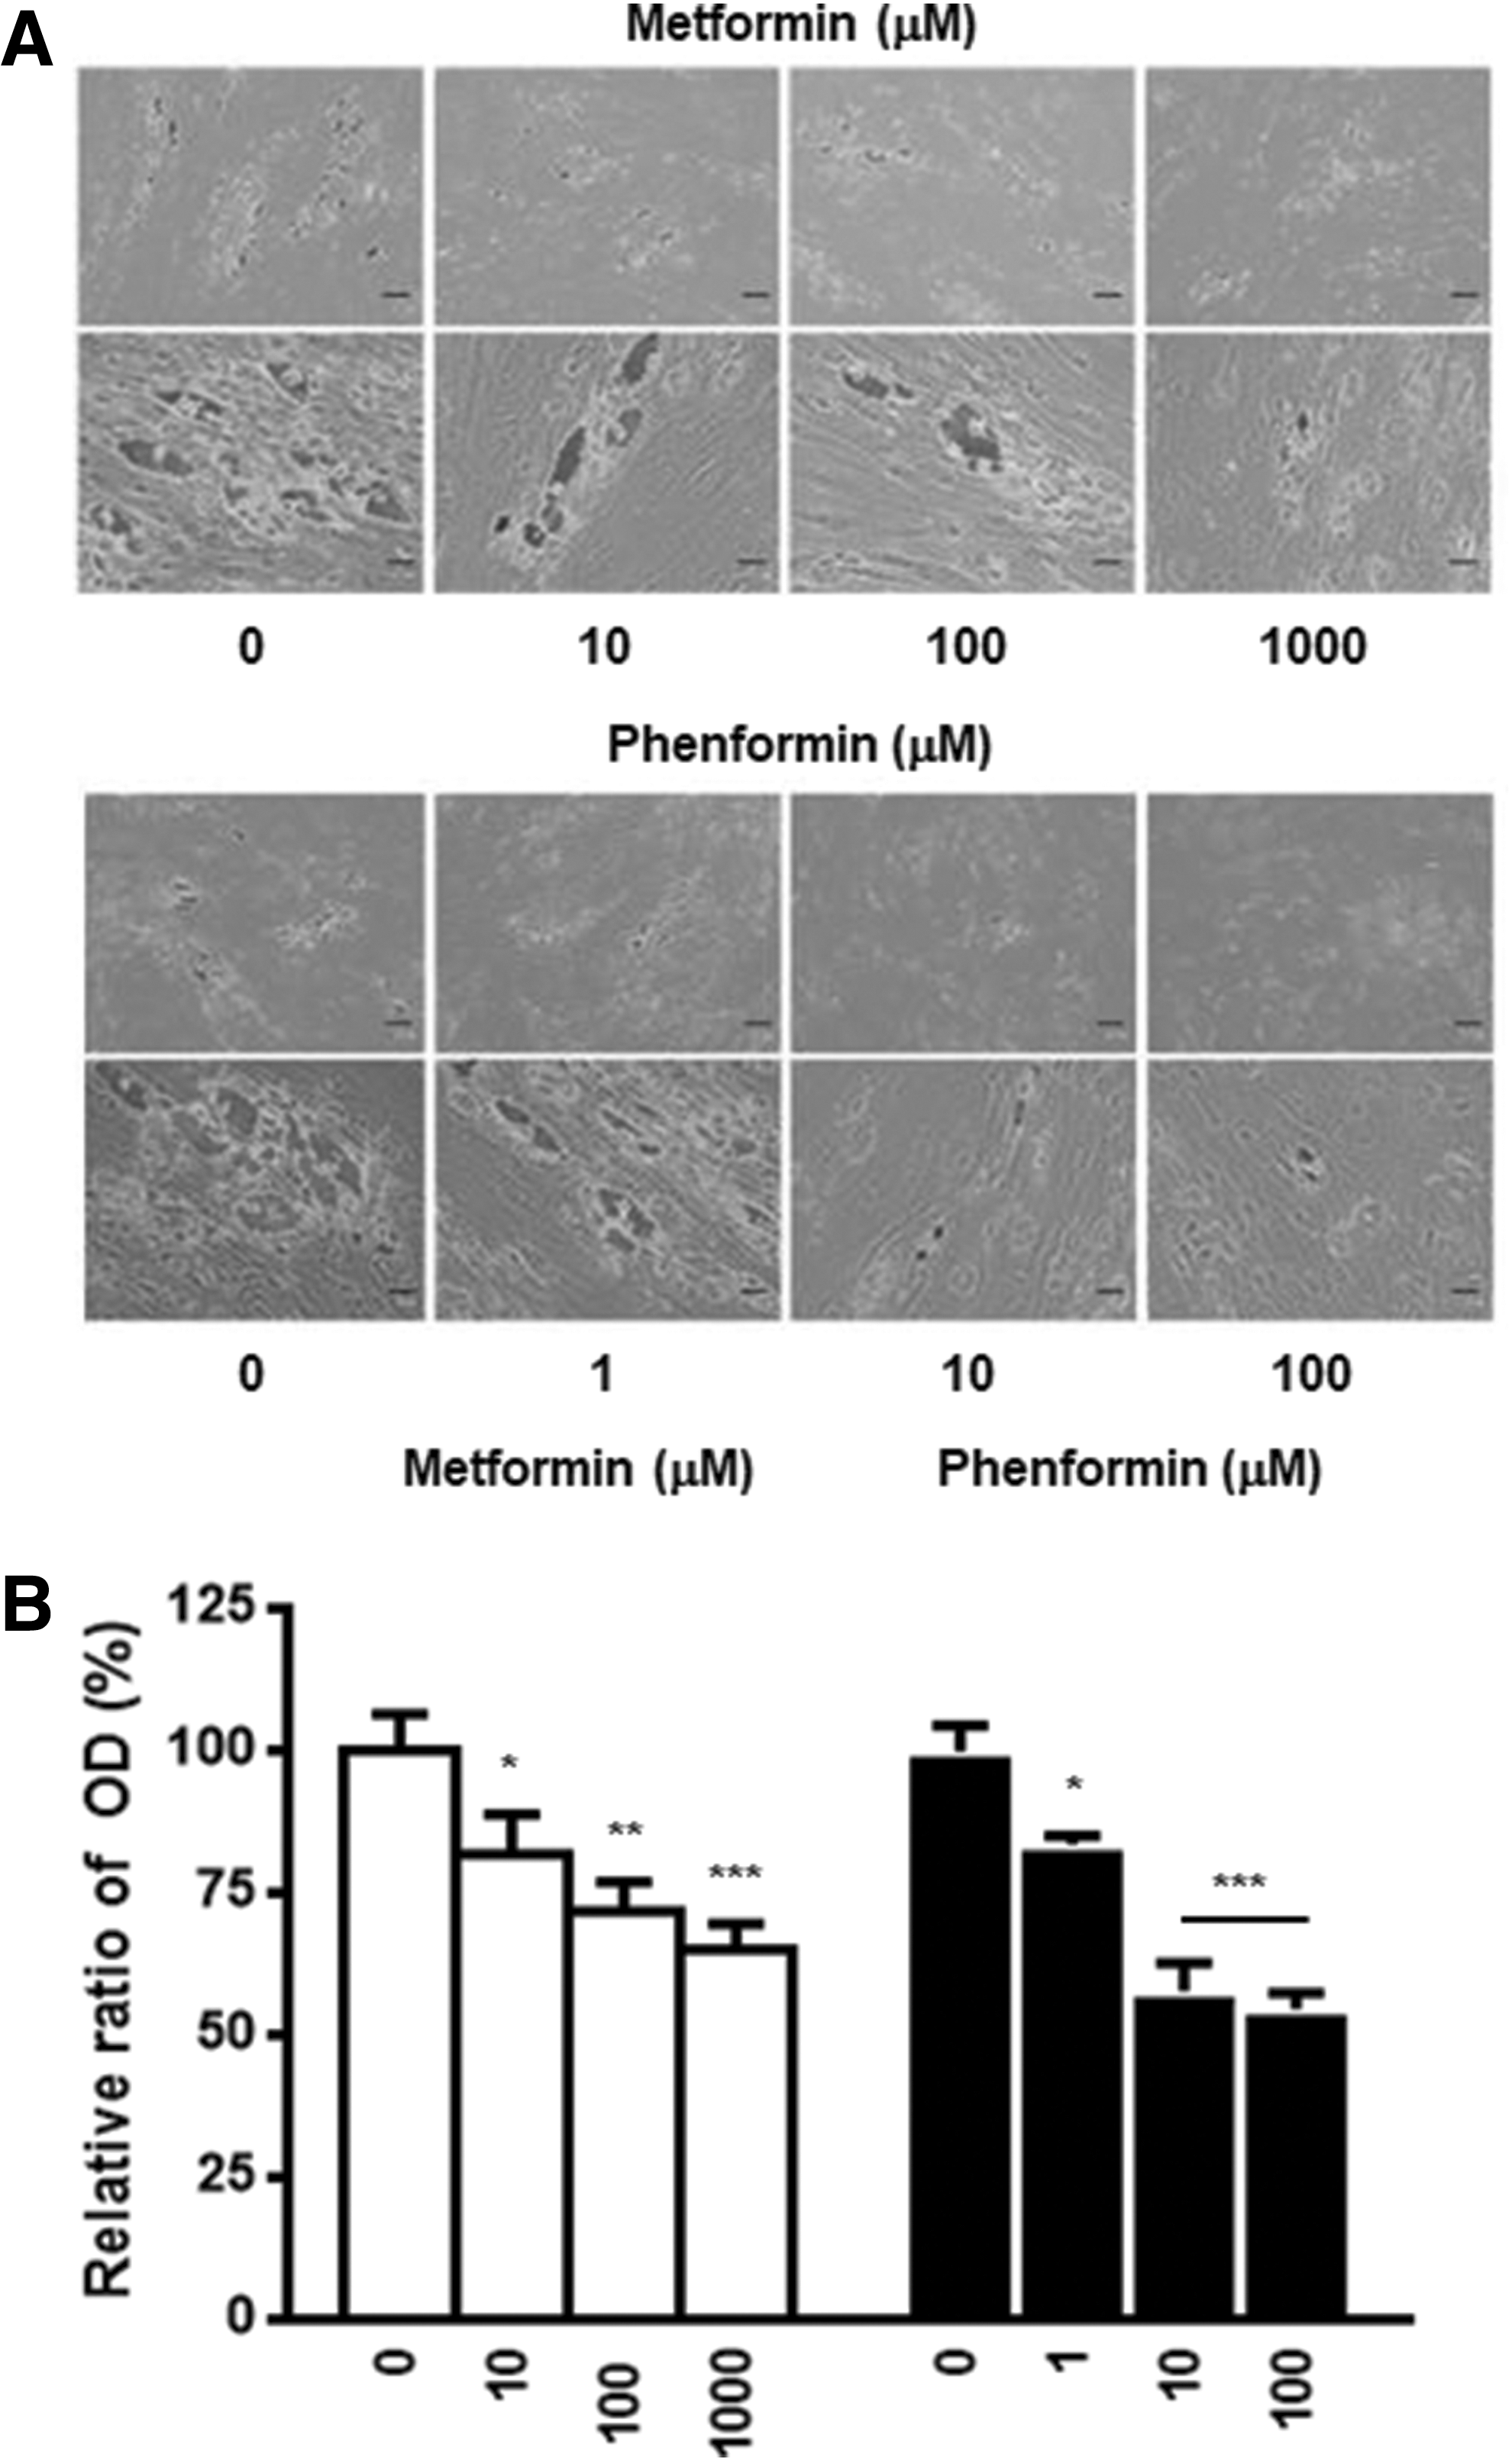
Effect of metformin and phenformin on adipogenesis in Graves' orbitopathy (GO) orbital fibroblasts. (
Effect of metformin and phenformin on the expression of adipogenic transcription factors
Differentiation of preadipocytes into adipocytes requires the sequential and cooperative expression of key adipogenic transcription factors, such as PPARγ and c/EBPα/β (24). Therefore, the study examined whether the reduced accumulation of intracellular lipid droplets during adipogenesis caused by metformin and phenformin treatment paralleled the expression of the adipogenic transcription factors. As shown in Figure 2, PPARγ and c/EBPα/β protein expression was reduced in a dose-dependent manner, and the effect was observed even at the lowest dose of each drug. Treatment with phenformin resulted in a more dramatic effect, which corroborated the results in Figure 1, where phenformin inhibited intracellular lipid droplet formation more effectively than metformin. These data demonstrated that the biguanides attenuated the expression of adipogenic transcription factors essential for differentiation of GO preadipocytes into adipocytes.

Effect of metformin and phenformin on the expression of adipogenic transcription factors in GO orbital fibroblasts. (
Metformin and phenformin regulate the AMPK/ERK pathway during adipogenesis
Because biguanides are known to activate AMPK, which is a key regulator of energy balance, the phosphorylation of AMPK was examined using Western blot analysis (25). As shown in Figure 3, treatment with metformin and phenformin induced the phosphorylation of AMPK in a dose-dependent manner. Furthermore, to evaluate the upstream signaling responsible for the anti-adipogenic effects, the status of mitogen-activated protein kinase (MAPK) phosphorylation was evaluated in biguanide-treated GO orbital fibroblasts. MEK/ERK signaling at the early stage of adipogenesis has been shown to be responsible for enhancing the expression of PPARγ and c/EBPα/β in 3T3-L1 cells (26 –28). Interestingly, ERK was phosphorylated when adipogenesis was stimulated with rosiglitazone, and treatment with metformin or phenformin dose-dependently inhibited this ERK phosphorylation. Because ERK activation is important in the early stage of adipogenesis, inhibition of its phosphorylation with phenformin or metformin would be expected to attenuate adipogenesis by blocking the expression of the adipogenic transcription factors. Other MAPK pathways were also examined. However, there was no difference in the phosphorylation of stress-activated protein kinase/c-Jun N-terminal kinase (SAPK/JNK), and p38 was barely detected (Supplementary Fig. S2).
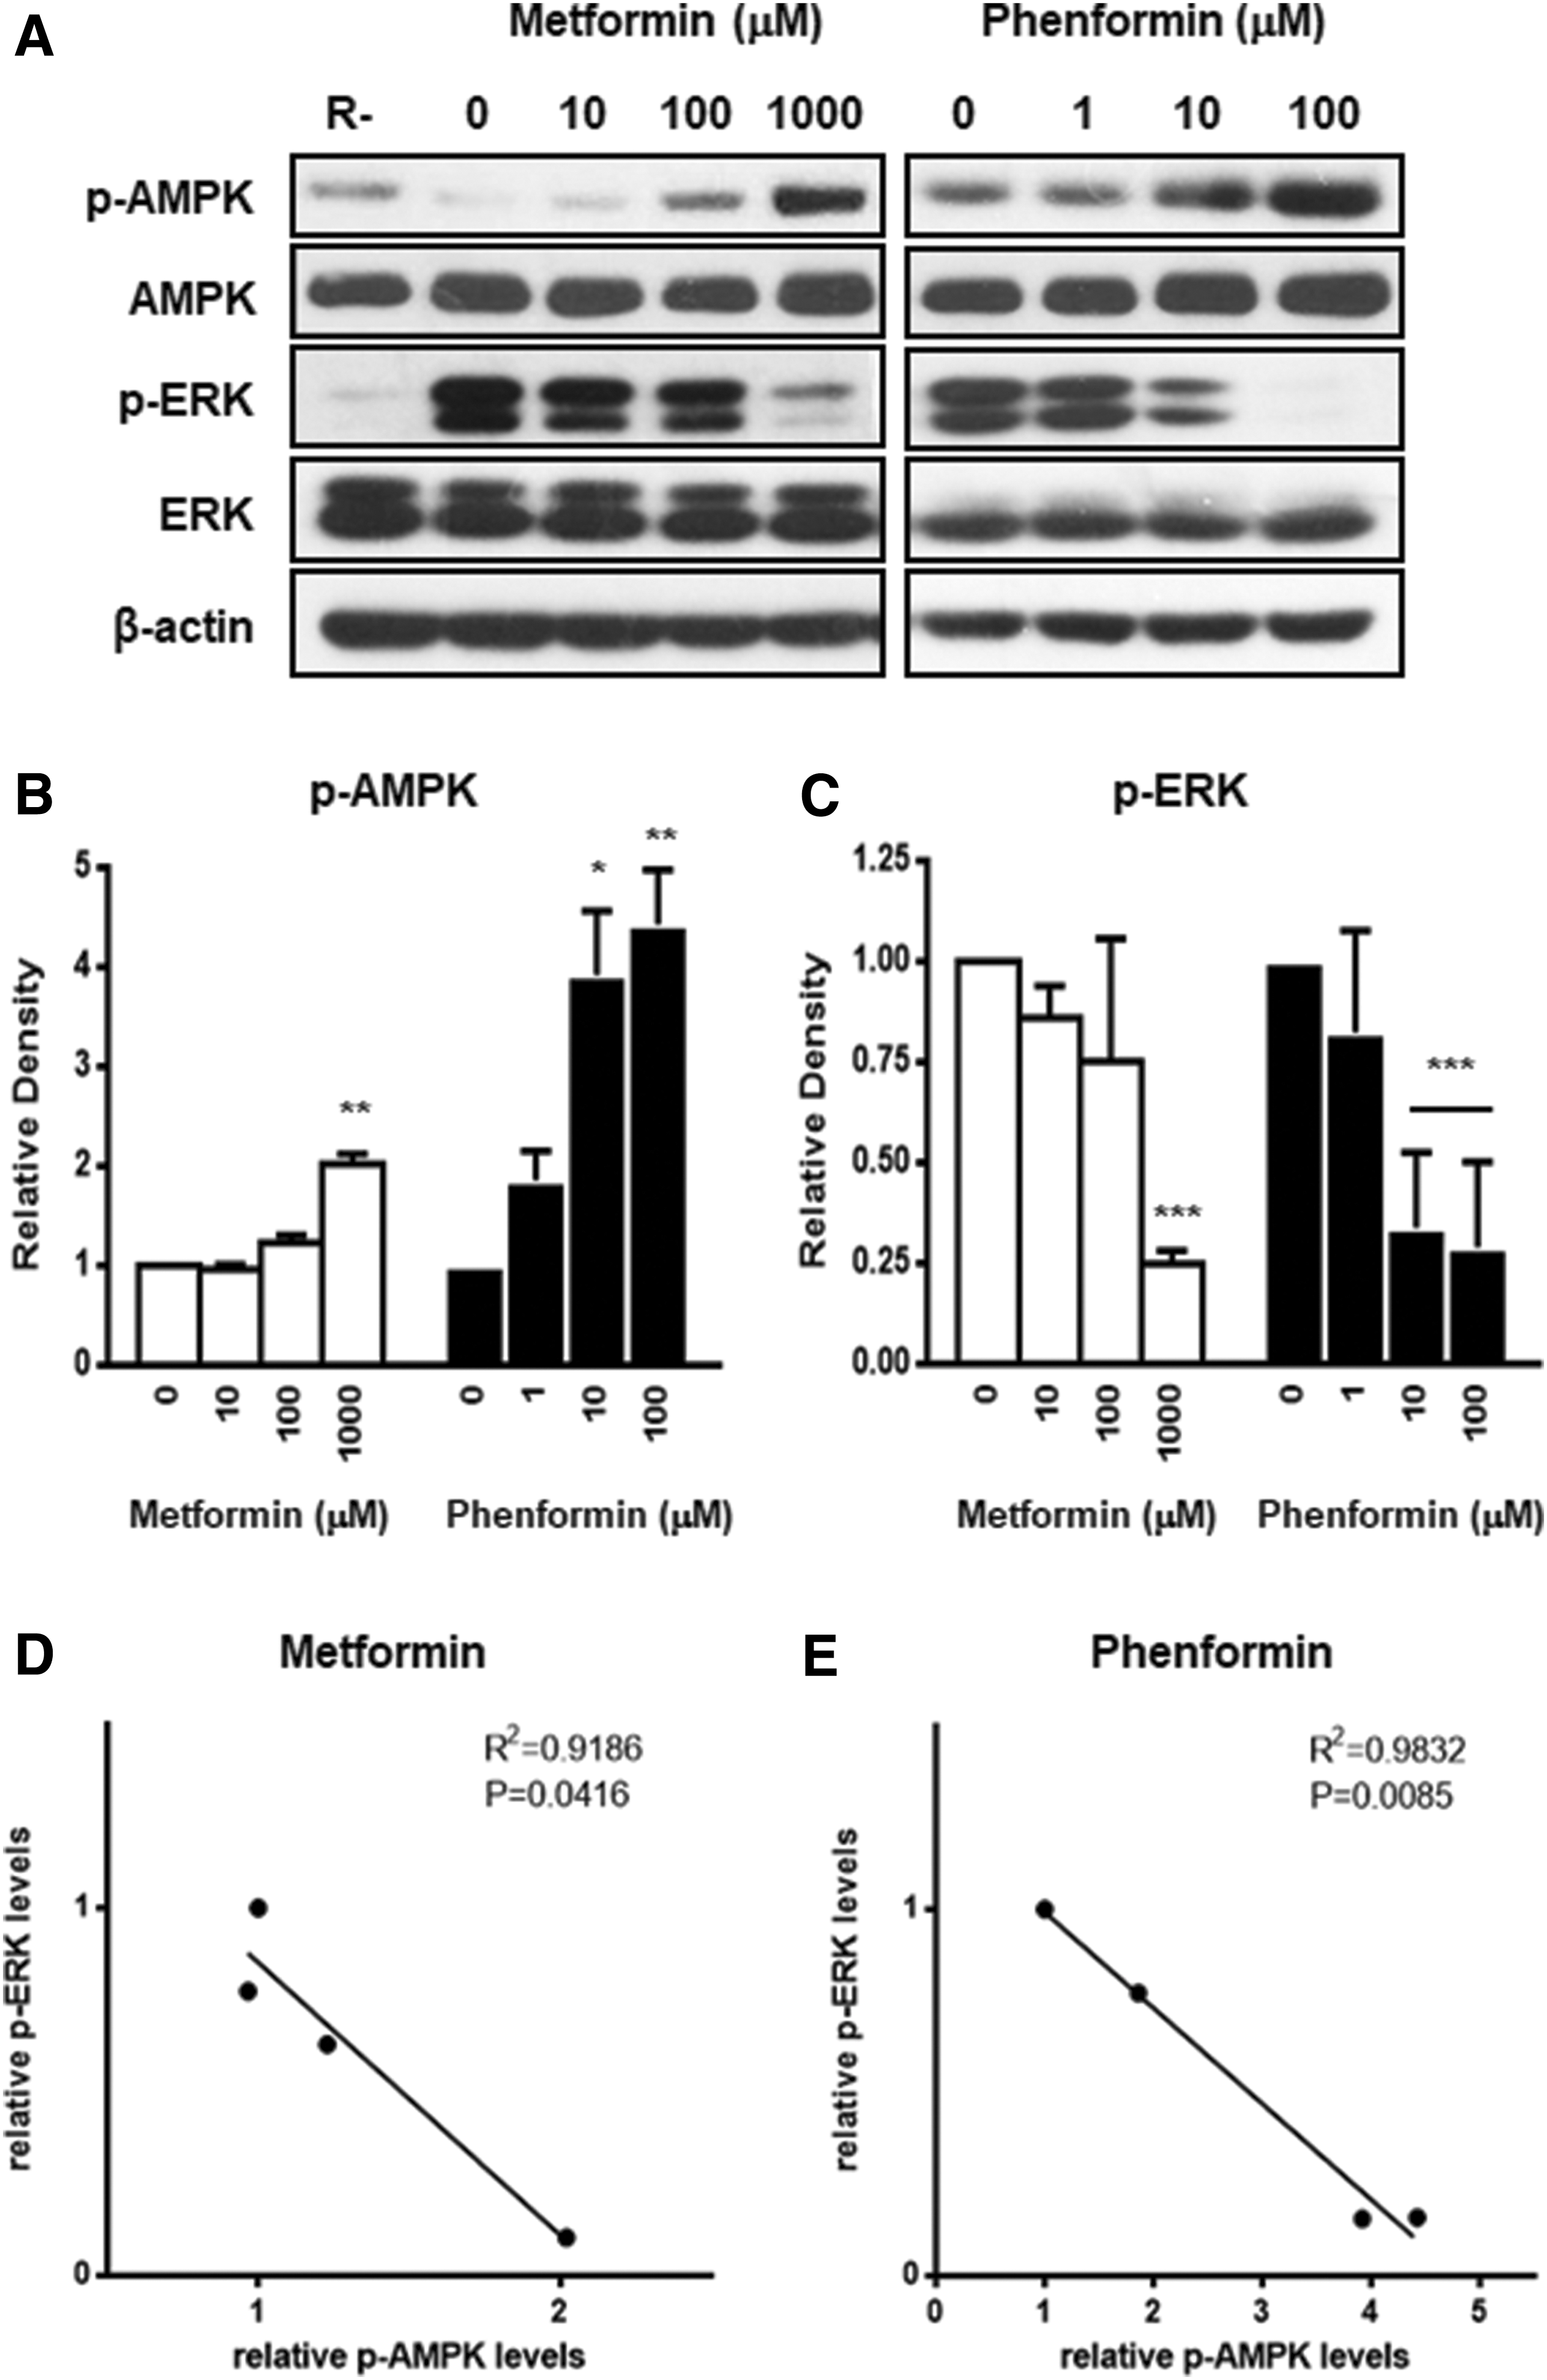
Effect of metformin and phenformin on AMP-activated protein kinase (AMPK)/extracellular-regulated kinase (ERK) signaling pathway. (
Metformin and phenformin attenuated adipogenesis via ERK inactivation
To confirm that ERK inactivation was responsible for the anti-adipogenic effects of metformin and phenformin, the signaling pathways were examined using the AMPK agonist AICAR and the AMPK inhibitor compound C (29). As shown in Figure 4, AICAR enhanced the phosphorylation of AMPK, and compound C decreased the phosphorylation of AMPK, but neither affected the phosphorylation of ERK. The study also co-treated with biguanides and compound C to evaluate whether ERK phosphorylation was still suppressed when AMPK activation was blocked. Co-treatment with compound C did not reverse the suppressive effect of metformin and phenformin on ERK phosphorylation, even when AMPK activation was attenuated.
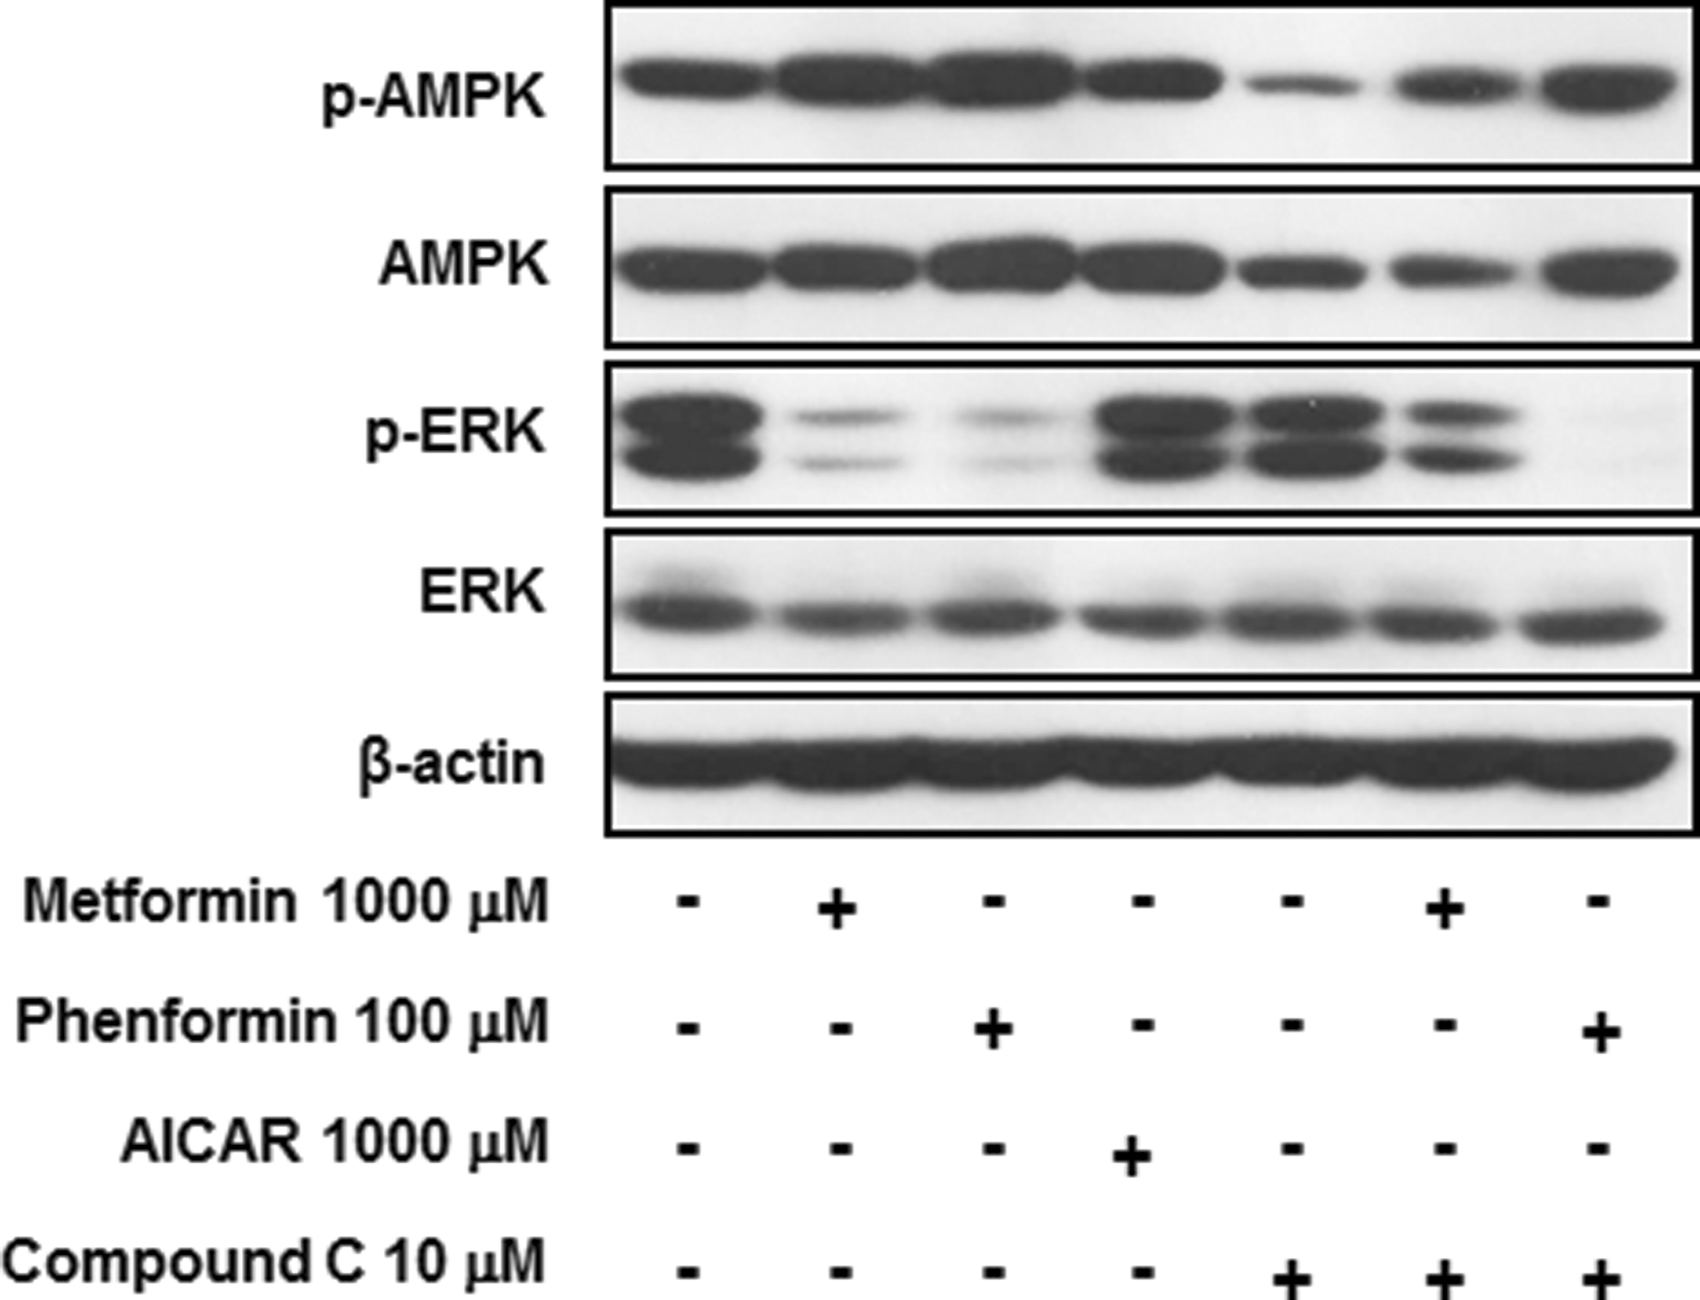
Metformin and phenformin suppressed ERK activation in GO orbital fibroblasts. Each drug was co-treated with 10 μM of rosiglitazone from the initial day of adipogenesis. The cell lysates were harvested on day 4 and subjected to Western blot analysis, and phosphorylation and expression of AMPK and ERK was assessed. Bands are representative of at least three independent experiments.
Inhibitory effect of metformin and phenformin on IL-1β-induced hyaluronan production in GO orbital fibroblasts
In addition to excess adipogenesis, hyaluronan overproduction contributed to the pathogenesis of GO (3). Therefore, the study investigated whether the biguanides inhibit hyaluronan production in primary cultures of orbital fibroblasts from patients with GO. As shown in Figure 5, cells treated with 1 ng/mL of IL-1β exhibited increased hyaluronan production compared to that in untreated control cells. Additionally, co-treatment with metformin or phenformin decreased hyaluronan production in a dose-dependent manner (1000 μM of metformin, p < 0.05; 100 μM of phenformin, p < 0.01).

The effect of metformin and phenformin on hyaluronan production stimulated by interleukin (IL)-1β in GO orbital fibroblasts. GO orbital fibroblasts were stimulated with 1 ng/mL of IL-1β for 24 h with or without metformin and phenformin. Co-treatment with metformin and phenformin dose-dependently decreased IL-1β-stimulated hyaluronan production. Data in the column were obtained from the mean ± SD of repeated experiments from three independent GO cell samples. ***p < 0.001 versus untreated control; †p < 0.05 versus IL-1β-treated control of each sample.
Inhibitory effect of metformin and phenformin on IL-1βinduced pro-inflammatory molecules
Pro-inflammatory molecules, including IL-6, COX-2, and ICAM-1, which are undetectable in normal cell cultures, are expressed in GO cells (9). Because stimulation with IL-1β further increases the mRNA levels of pro-inflammatory molecules, the study evaluated whether metformin and phenformin suppressed IL-1β-stimulated IL-6, COX-2, and ICAM-1 mRNA levels. As shown in Figure 6, metformin and phenformin pretreatment dose-dependently suppressed the upregulated mRNA levels.

The effect of metformin and phenformin on mRNA expression of IL-1β-induced proinflammatory molecules. (
Discussion
Approximately half of patients with GD suffer from GO. Clinical symptoms, including upper eyelid retraction, edema, and erythema, result from the expansion of orbital fatty connective tissues and extraocular muscles (1,3). Despite their long-term side effects, glucocorticoids have been used to treat GO because there are no other specific medical therapeutic agents available.
Biguanides, including metformin and phenformin, are anti-hyperglycemic drugs used to treat diabetes mellitus, but their effects have not been investigated in GO. Human primary orbital fibroblast cultures obtained from patients with GO were used, and because most of the tissue explants were taken from adipose tissue, we did not differentiate between muscle and fat. Cultures obtained from inflamed orbits with CAS3 or higher might respond differently compared to those from stable, inactive orbits. However, it is almost impossible to obtain inflamed orbits because anti-inflammatory therapy before surgical decompression results in an inactive state at the time of tissue explant.
This study investigated whether biguanides had anti-adipogenic or suppressive effects on hyaluronan production and pro-inflammatory molecule expression in GO orbital fibroblasts. Adipogenesis is a major factor that contributes to the pathogenesis of GO, and inhibition of the adipogenic pathway is required when treating GO (1,30). It was found that both metformin and phenformin significantly inhibited adipogenesis during the adipogenic differentiation of GO orbital fibroblasts. The anti-adipogenic effect was confirmed through Oil Red O staining of intracellular lipid droplets and Western blot analysis of adipogenic transcription factors, including PPARγ and c/EBPα/β. Although dosages that exceeded the steady state plasma concentrations achieved in humans were used, the effect was still observed at concentrations of 10 μM. To determine the mechanism by which biguanides suppress adipogenesis, the AMPK and MAPK pathways were examined using Western blot analysis. Similar to that reported in other cells, treatment with metformin or phenformin activated AMPK in GO orbital fibroblasts (13). Moreover, the activation of ERK signaling by stimulation with rosiglitazone was dose-dependently reduced after biguanide co-treatment, which was not reflected in a corresponding reduction in AMPK activation. Other MAPK pathways, such as JNK and p38, were not affected. AICAR and compound C, a known agonist and antagonist of AMPK, respectively, did not affect ERK phosphorylation and co-treatment with biguanides, and compound C did not reverse the suppressive effect of metformin and phenformin on ERK phosphorylation. From these results, it is concluded that metformin and phenformin generate anti-adipogenic effects in GO orbital fibroblasts involving the activation of AMPK through the suppression of ERK.
Another important factor contributing to the pathogenesis of GO is cytokine production caused by the interaction between T-cells and orbital fibroblasts (6,9,31). An increase in hyaluronan production was also observed in GO orbital fibroblasts after stimulation with IL-1β. Treatment with metformin or phenformin dose-dependently reduced this IL-1β-induced hyaluronan production.
Furthermore, cross-activation between infiltrating T-cells and orbital fibroblasts results in increased cytokine production, including IL-6 and T-cell activating factors such as COX-2. In addition, ICAM-1 mRNA levels are upregulated in GO orbital fibroblasts by the CD40 ligand (9). In this study, mRNA levels of IL-6, COX-2, and ICAM-1 were upregulated after IL-1β treatment. As expected, IL-1β-induced mRNA levels of the pro-inflammatory molecules were significantly suppressed by pretreatment with metformin or phenformin.
This study demonstrates that the biguanides metformin and phenformin exhibit anti-adipogenic and inhibitory effects on hyaluronan production and pro-inflammatory molecule expression in GO orbital fibroblasts. Microscopic examination after Oil Red O staining indicates that biguanides suppress lipid droplet formation. This correlates with the reduced expression of PPARγ and c/EBPα/β. The study further confirmed the activation of AMPK, a known target of metformin and phenformin, and the inactivation of ERK, which could be the pathways responsible for the suppression of adipogenic factors. Furthermore, treatment with biguanides also resulted in reduced IL-1β-induced production of hyaluronan and pro-inflammatory molecules.
Biguanides have been shown to exhibit therapeutic effects in various studies, and their safety has already been ensured from in vivo studies (19) and their wide use in diabetic patients. The availability of an animal model for GO would allow for the evaluation of in vivo effects and determination of the optimum dosage of biguanides. However, partly because of differences between human and rodent orbital anatomy, in vivo models resembling ocular changes in patients with GO have yet to be reported (1,32). The results of this study are noteworthy and signify the potential of biguanides as therapeutic agents for the treatment of GO.
Footnotes
Acknowledgments
This research was supported by the Bio & Medical Technology Development Program of the NRF funded by the Korean government, MSIP (grant number: 2014M3A9B6069341) and a grant of the Korea Health Technology R&D Project through the Korea Health Industry Development Institute (KHIDI), funded by the Ministry of Health & Welfare, Republic of Korea (grant number: H14C1324).
Author Disclosure Statement
No competing financial interests exist.