
Abstract
Background:
Hashimoto's thyroiditis (HT) is an organ-specific autoimmune disease in which both genetic predisposition and environmental factors serve as disease triggers. Many studies have indicated that alterations in the gut microbiota are important environmental factors in the development of inflammatory and autoimmune diseases. A comparative analysis was systematically performed of the gut microbiota in HT patients and healthy controls.
Methods:
First, a cross-sectional study of 28 HT patients and 16 matched healthy controls was conducted. Fecal samples were collected, and microbiota were analyzed using 16S ribosomal RNA gene sequencing. Second, an independent cohort of 22 HT patients and 11 healthy controls was used to evaluate the diagnostic potential of the selected biomarkers.
Results:
Similar levels of bacterial richness and diversity were found in the gut microbiota of HT patients and healthy controls (p = 0.11). A detailed fecal microbiota Mann–Whitney U-test (Q value <0.05) revealed that the abundance levels of Blautia, Roseburia, Ruminococcus_torques_group, Romboutsia, Dorea, Fusicatenibacter, and Eubacterium_hallii_group genera were increased in HT patients, whereas the abundance levels of Fecalibacterium, Bacteroides, Prevotella_9, and Lachnoclostridium genera were decreased. A correlation matrix based on the Spearman correlation distance confirmed correlations among seven clinical parameters. Additionally, the linear discriminant analysis effect size method showed significant differences in 27 genera between the two groups that were strongly correlated with clinical parameters. The linear discriminant analysis value was used to select the first 10 species from the 27 different genera as biomarkers, achieving area under the curve values of 0.91 and 0.88 for exploration and validation data, respectively.
Conclusions:
Characterization of the gut microbiota in HT patients confirmed that HT patients have altered gut microbiota and that gut microbiota are correlated with clinical parameters, suggesting that microbiome composition data could be used for disease diagnosis. Further investigation is required to understand better the role of the gut microbiota in the pathogenesis of HT.
Introduction
H
However, few studies have addressed the link between gut microbiota and HT, and these studies have only provided indirect or weak evidence. First, a previous study indicated that many interrelationships exist between the thyroid gland and the gastrointestinal tract. Similarities in embryology, phylogeny, and function persist throughout adult life, even after fragmentation of the primitive thyroglossal duct (19). Therefore, it was hypothesized that thyroid disorders may be associated with alterations of the gut microbiota. Second, molecular mimicry mechanisms provide the most reasonable explanation of the role of the gut microbiota in provoking autoimmune disease, that is, the emergence of autoreactive clones of T and B lymphocytes as a result of a cross-immune response to homologous bacterial or viral antigens (20,21). It was recently found that components of the cells of Bifidobacterium bifidum 791, Bifidobacterium adolescentis 94 BIM, Bifidobacterium longum B379M, and Lactobacillus plantarum B-01 selectively bind human antibodies (TPOAb and TgAb) and compete with natural antigens (22). Third, some authors have proposed that disruption of the mucosal barrier exposes submucosal immune cells to bacterial and dietary antigens and to self-antigens, leading to unfavorable immune activation or failure of the tolerance reaction, with the consequent development of autoimmune diseases (23,24). In accordance with this hypothesis, morphological changes in gut epithelial cells, increased intestinal permeability, and intraepithelial lymphocyte infiltration have been demonstrated in T1D patients and in animal models (25,26). Interestingly, similar changes have been detected in patients with HT (27), suggesting a pathogenic role of a leaky gut barrier in the development of HT. Finally, in nonobese diabetic mice with thyroiditis, polarization toward a prevalent Th1 or Th17 pathway has been reported (28,29). Activation of Toll-like receptors in the development of thyroiditis (30) and a protective inhibitory effect of Treg cells (31) have also been reported in this model. However, whether a similar mechanism (i.e., CD4+ Th pathway imbalances) initiates autoimmune thyroiditis in humans requires further investigation (32).
Therefore, it was hypothesized that HT patients have gut microbial dysbiosis that influences HT development. To test this hypothesis, the gut microbiota composition was analyzed in euthyroid HT patients. The results showed that HT patients have a distinct microbiota community profile from that of healthy controls.
Materials and Methods
Ethics statement
The protocols used in this study were approved by the Ethics Committee of the First Affiliated Hospital of Harbin Medical University (China). All subjects were informed of the nature of the study and were asked to provide written informed consent. The procedures were conducted in accordance with approved guidelines.
Study cohort and recruitment of subjects
There were two study groups. First, a cross-sectional study (exploration cohort) was conducted of 28 HT patients and 16 matched healthy controls. Second, an independent cohort (validation cohort) composed of 22 HT patients and 11 matched healthy controls was used to evaluate the diagnostic potential of selected biomarkers. Seventy-seven participants were enrolled in the study from November 2016 to April 2017, including 50 HT patients recruited from the outpatient departments of endocrinology at the First Affiliated Hospital of Harbin Medical University and 27 healthy controls recruited from the health screening center. The healthy volunteers were matched with the HT groups in terms of age, sex, and body mass index (BMI). All HT patients were diagnosed and underwent disease verification by an endocrinologist based on their histories, physical examination, ultrasound, and biochemistry (2). The inclusion criteria for HT patients were as follows: aged 18–65 years and the presence of euthyroidism (normal free triiodothyronine [fT3], free thyroxine [fT4], and thyrotropin [TSH] plasma levels without hormonal therapy). The following exclusion criteria were applied to all groups: pregnancy; lactation; cigarette smoking; alcohol addiction; hypertension; diabetes mellitus; lipid dysregulation; BMI >27 kg/m2; recent (<3 months prior) use of antibiotics, probiotics, prebiotics, symbiotics, hormonal medication, laxatives, proton pump inhibitors, insulin sensitizers, or Chinese herbal medicine; a known history of disease with an autoimmune component, such as MS, rheumatoid arthritis, irritable bowel syndrome (IBS), or IBD; and a history of malignancy or any gastrointestinal tract surgery (e.g., gastrectomy, bariatric surgery, colectomy, ileectomy, cholecystectomy, or appendectomy).
Sample collection
All subjects were examined in the morning after an overnight fast (≥8 h). Peripheral blood (6 mL) was collected from all subjects and stored in EDTA tubes at 4°C for routine blood, thyroid function, and thyroid autoantibody examinations. In addition, all subjects were provided with Commode Specimen Collection Kits for stool collection. Fecal samples were collected by the patients using disposable sterile forceps in the morning, when the patients had an empty stomach. Basic information, such as acquisition time and patient name, was recorded on the sample collection box. If the subjects were unable to provide a stool sample during their stay at the hospital outpatient clinic, they were instructed to collect the sample at home in accordance with the above methods and to send it to the laboratory in an ice pack within two hours. Upon collection, each fecal sample was immediately divided into aliquots, frozen on dry ice, and stored at −80°C until DNA extraction.
Thyroid function and thyroid autoantibodies tests
Serum TSH, fT4, and fT3 levels were measured by chemiluminescent immunoassays (Abbott Diagnostics, Tokyo, Japan). Reference ranges were defined as follows: TSH 0.35–4.94 μIU/L; fT4 0.70–1.48 ng/dL; and fT3 1.71–3.71 pg/mL. TgAb and TPOAb were measured using chemiluminescent immunoassays (Beckman Coulter, Fullerton, CA). Reference ranges were defined as follows: TPOAb 0.00–5.61 IU/mL; TgAb 0.00–4.11 IU/mL.
gDNA extraction
DNA extraction was performed within one month after sample collection. Bacterial DNA was extracted from the fecal samples at Novogene Bioinformatics Technology Co. Ltd. (Beijing, China) using a TIANGEN kit according to the manufacturer's recommendations. DNA concentration and purity were monitored on 1% agarose gels. After determining the concentration, DNA was diluted to 1 ng/μL using sterile water. The extracted DNA was stored at −20°C.
Amplicon generation and purification
The bacterial genomic DNA was amplified with primers 341F (CCTAYGGGRBGCASCAG) and 806R (GGACTACNNGGGTATC-TAAT) specific to the V3–V4 hypervariable regions of the 16S rRNA gene (33). All polymerase chain reactions (PCR) were carried out with Phusion® High-Fidelity PCR Master Mix (New England Biolabs, Ipswich, MA). An equal volume of 1 × loading buffer (containing SYB green) was mixed with the PCR products and subjected to electrophoresis on 2% agarose gels for detection. Samples with a bright, primary band between 400 and 450 bp were chosen for further experiments. Products of the same sample were combined and subjected to electrophoresis. DNA of the correct size was purified using a Gel Extraction Kit (Qiagen, Hilden, Germany) and quantified using a Qubit instrument (Life Technologies, Carlsbad, CA).
Library preparation and sequencing
Sequencing libraries were generated using a TruSeq® DNA PCR-Free Sample Preparation Kit (Illumina, San Diego, CA) following the manufacturer's recommendations, and index codes were added. Library quality was assessed using a Qubit@ 2.0 Fluorometer (Thermo Fisher Scientific, Waltham, MA) and an Bioanalyzer 2100 system (Agilent, Santa Clara, CA). Finally, the library was sequenced on an Illumina HiSeq2500 platform, and 250-bp paired-end reads were generated.
Paired-end reads assembly and quality control
Paired-end reads were assigned to samples based on their unique barcode and were truncated by cleaving the barcode and primer sequence. Paired-end reads were merged using FLASH (v1.2.7), a rapid and highly accurate analysis tool designed to merge paired-end reads when at least some of the reads overlap the reads generated from the opposite end of the same DNA fragment; the splicing sequences were termed raw tags.
Quality filtering of the raw tags was performed under specific filtering conditions to obtain high-quality clean tags according to the QIIME (v1.7.0) quality control process. The tags were compared with a reference database (the Gold database) using the UCHIME algorithm to detect chimaera sequences, and the chimaera sequences were then removed. The effective tags were finally obtained.
Operational taxonomic unit cluster and species annotation
Sequence analysis was performed using Uparse software (Uparse v7.0.1001). Sequences with ≥97% similarity were assigned to the same operational taxonomic units (OTUs). Representative sequences for each OTU were screened for further annotation. For each representative sequence, the SILVA128/16S database was used based on the RDP classifier (v2.2) algorithm to annotate taxonomic information. To study the phylogenetic relationships between different OTUs and differences in dominant species in different samples (groups), multiple sequence alignment was conducted using MUSCLE software (v3.8.31). OTU abundance information was normalized using the sequence number corresponding to the sample with the fewest sequences.
Statistical analyses
The analysis of clinical parameters, Firmicutes/Bacteroidetes (F/B) ratio, and Pearson correlation distance results was performed using IBM SPSS Statistics for Windows v19.0 (IBM Corp., Armonk, NY). Alpha diversity was applied to analyze the complexity of species diversity in each sample based on six indexes: Observed-species, Chao1, Shannon, Simpson, ACE, and Good's coverage. These indexes were calculated for the samples using QIIME (v1.7.0) based on the rarefied OTU counts and were displayed using R software (v2.15.3). A beta diversity analysis was used to evaluate differences in the species complexity between samples, and beta diversity-weighted UniFrac was calculated using QIIME software (v1.7.0) based on the rarefied OTU counts. A principal coordinate analysis (PCoA) was performed to obtain the principal coordinates and to visualize complex, multidimensional data. The results of the PCoA were displayed using the WGCNA package, stats package, and ggplot2 package in R software (v2.15.3). Differences between the two groups were tested based on a distance matrix using the nonparametric multivariate analysis test (analysis of similarities [ANOSIM], used to examine whether differences between groups were significantly greater than differences within groups) included in R's Vegan package.
The microbiota features differentiating the fecal microbiota were characterized using the linear discriminant analysis (LDA) effect size (LEfSe) method for biomarker discovery, which emphasizes both statistical significance and biological relevance (34). Based on a normalized relative abundance matrix, LEfSe uses the Kruskal–Wallis rank-sum test to detect features with significantly different abundance levels between assigned taxa and performs an LDA to estimate the effect size of each feature. An alpha significance level of 0.05 and an effect size threshold of 3 were used for all biomarkers discussed in this study. A differential abundance analysis was performed using the Wilcoxon rank-sum test at the phylum, family, and genus levels. Microbiome features of healthy controls were compared to those of patients with HT using Metastats based on the p-value and the false discovery rate (Q-value) for non-normal distributions. Only taxa with average abundance levels >1%, p-values <0.05, and Q-values <0.05 were considered significant (35). Correlations between variables were computed using the Spearman rank correlation. Statistical analyses were performed using the SPSS Data Analysis Program (v16.0; SPSS, Inc., Chicago, IL). To evaluate the discriminatory ability of the prediction model, operating characteristic curves (receiving operational curve [ROC]) were constructed, and area under curve (AUC) values were calculated.
Results
Study population
All subjects (n = 77) were of Han nationality and were born in northeastern China. The fecal samples of 50 HT patients and 27 healthy controls were sequenced and analyzed. Because of traditional customs and the cold climate, typical meals include foods that are rich in saturated fat and salt, such as pork fat, blood sausage, and mutton. The demographics and clinical parameters of the subjects are summarized in Table 1.
HT, Hashimoto's thyroiditis; M/F, male/female; TgAb, thyroglobulin antibody; TPOAb, thyroperoxidase antibody; fT3, free triiodothyronine; fT4, free thyroxine; TSH, thyrotropin; BMI, body mass index; P/N, positive/negative ratio.
The gut microbiota of HT patients differs from that of healthy controls
To identify whether HT was associated with a change in microbiota diversity, the fecal samples of HT patients and healthy controls were subjected to pyrosequencing and statistical analysis. A summary of the microbiota diversity is shown in Table 2, and the detailed characteristics of each sample are shown in Supplementary Table S1 (Supplementary Data are available online at

Gut microbiota of Hashimoto's thyroiditis (HT) patients differs from that of healthy controls. Rank-abundance curves were used to explain species richness and evenness. The bacterial communities of the healthy controls and HT patients exhibited similar patterns (
The operational taxonomic units (OTUs) were defined at a 97% similarity level.
The coverage percentage (Good's) was calculated using Good's method, and richness estimators (ACE and Chao1) and diversity indices (Shannon and Simpson) were calculated using the Mothur program.
CI, confidence interval.
A taxon-dependent analysis using the Ribosomal Database Project (RDP) classifier was conducted to describe the composition of the fecal microbiota in HT patients and healthy controls. Compared to healthy controls, the proportions of Firmicutes and Actinobacteria were increased, and the proportions of Bacteroidetes and Proteobacteria were decreased in patients with HT (Fig. 1C). At the family and genus levels, the microbiota composition of the HT patients was also altered compared to that of the healthy controls (Fig. 1D and Supplementary Fig. S3). To evaluate the extent of similarity between the microbiota communities, beta-diversity values were calculated using the weighted UniFrac method, and a PCoA was performed. Despite significant inter-individual variation, the gut microbiota of the HT patients and the healthy controls were clearly separated using PCoA (Fig. 1E). The HT patient samples also showed greater heterogeneity, with subsets resembling the healthy control samples. The analysis of group similarities (ANOSIM) indicated that the differences between the HT patients and the healthy controls were significant at the phylum and genus levels, with R values of 0.7154 and 0.6653, respectively (p < 0.001; Fig. 1F and Supplementary Fig. S4). These results demonstrate that the experimental grouping design was reliable.
The above results indicate that similar levels of bacterial richness and diversity were found in the gut microbiota of HT patients compared to those of healthy controls, whereas the overall structures of the gut microbiota of the HT and control groups were significantly different.
The abundance levels of certain bacteria are associated with HT
To identify the specific bacterial taxa associated with HT, the compositions of the fecal microbiota of HT patients and healthy controls were compared using the LEfSe method. A cladogram representing the structures of the fecal microbiota and the predominant bacteria in the healthy controls and HT patients, and the largest differences in the taxa between the two communities were compared. In total, the LEfSe analysis revealed 40 discriminative features (LDA >3, p < 0.05; Fig. 2A) at the phylum (n = 3), family (n = 10), and genus (n = 27) levels. Members of the Bacteroidetes bacterial taxa were enriched in the healthy control samples, whereas members of the Firmicutes and Synergistetes were enriched in the HT patient samples. Therefore, these taxa may be used as biomarkers to discriminate HT patients. Changes in the composition of the gut microbiota in the HT patient samples were also explored using the Mann–Whitney U-test (a nonparametric test for two independent groups) at different taxon levels, confining the analyses to the taxa with average abundance levels >1%, p-values <0.05, and false discovery rates (Q-values) <0.05. Eighteen differentially abundant taxa were identified (Table 3). At the phylum level, the proportion of Firmicutes was higher in the HT patient samples than that in the healthy control samples, whereas the proportion of Bacteroidetes was lower (Q-value <0.05; Fig. 2B). At the family level, members of Lachnospiraceae were prevalent in the HT patient samples, whereas members of Bacteroidaceae, Prevotellaceae, Streptococcaceae, and Peptostreptococcaceae were enriched in the healthy control samples (Q-value <0.05; Fig. 2B). At the genus level, 11 genera differed dramatically between the HT patient samples and the healthy control samples. The proportions of the Bacteroides, Fecalibacterium, Prevotella_9, and Lachnoclostridium genera were decreased, whereas the proportions of the Blautia, Ruminococcus_torques_group, Roseburia, Fusicatenibacter, Romboutsia, Dorea, and Eubacterium_hallii_group genera were increased in the HT patient samples (Q-value <0.05; Fig. 2B).
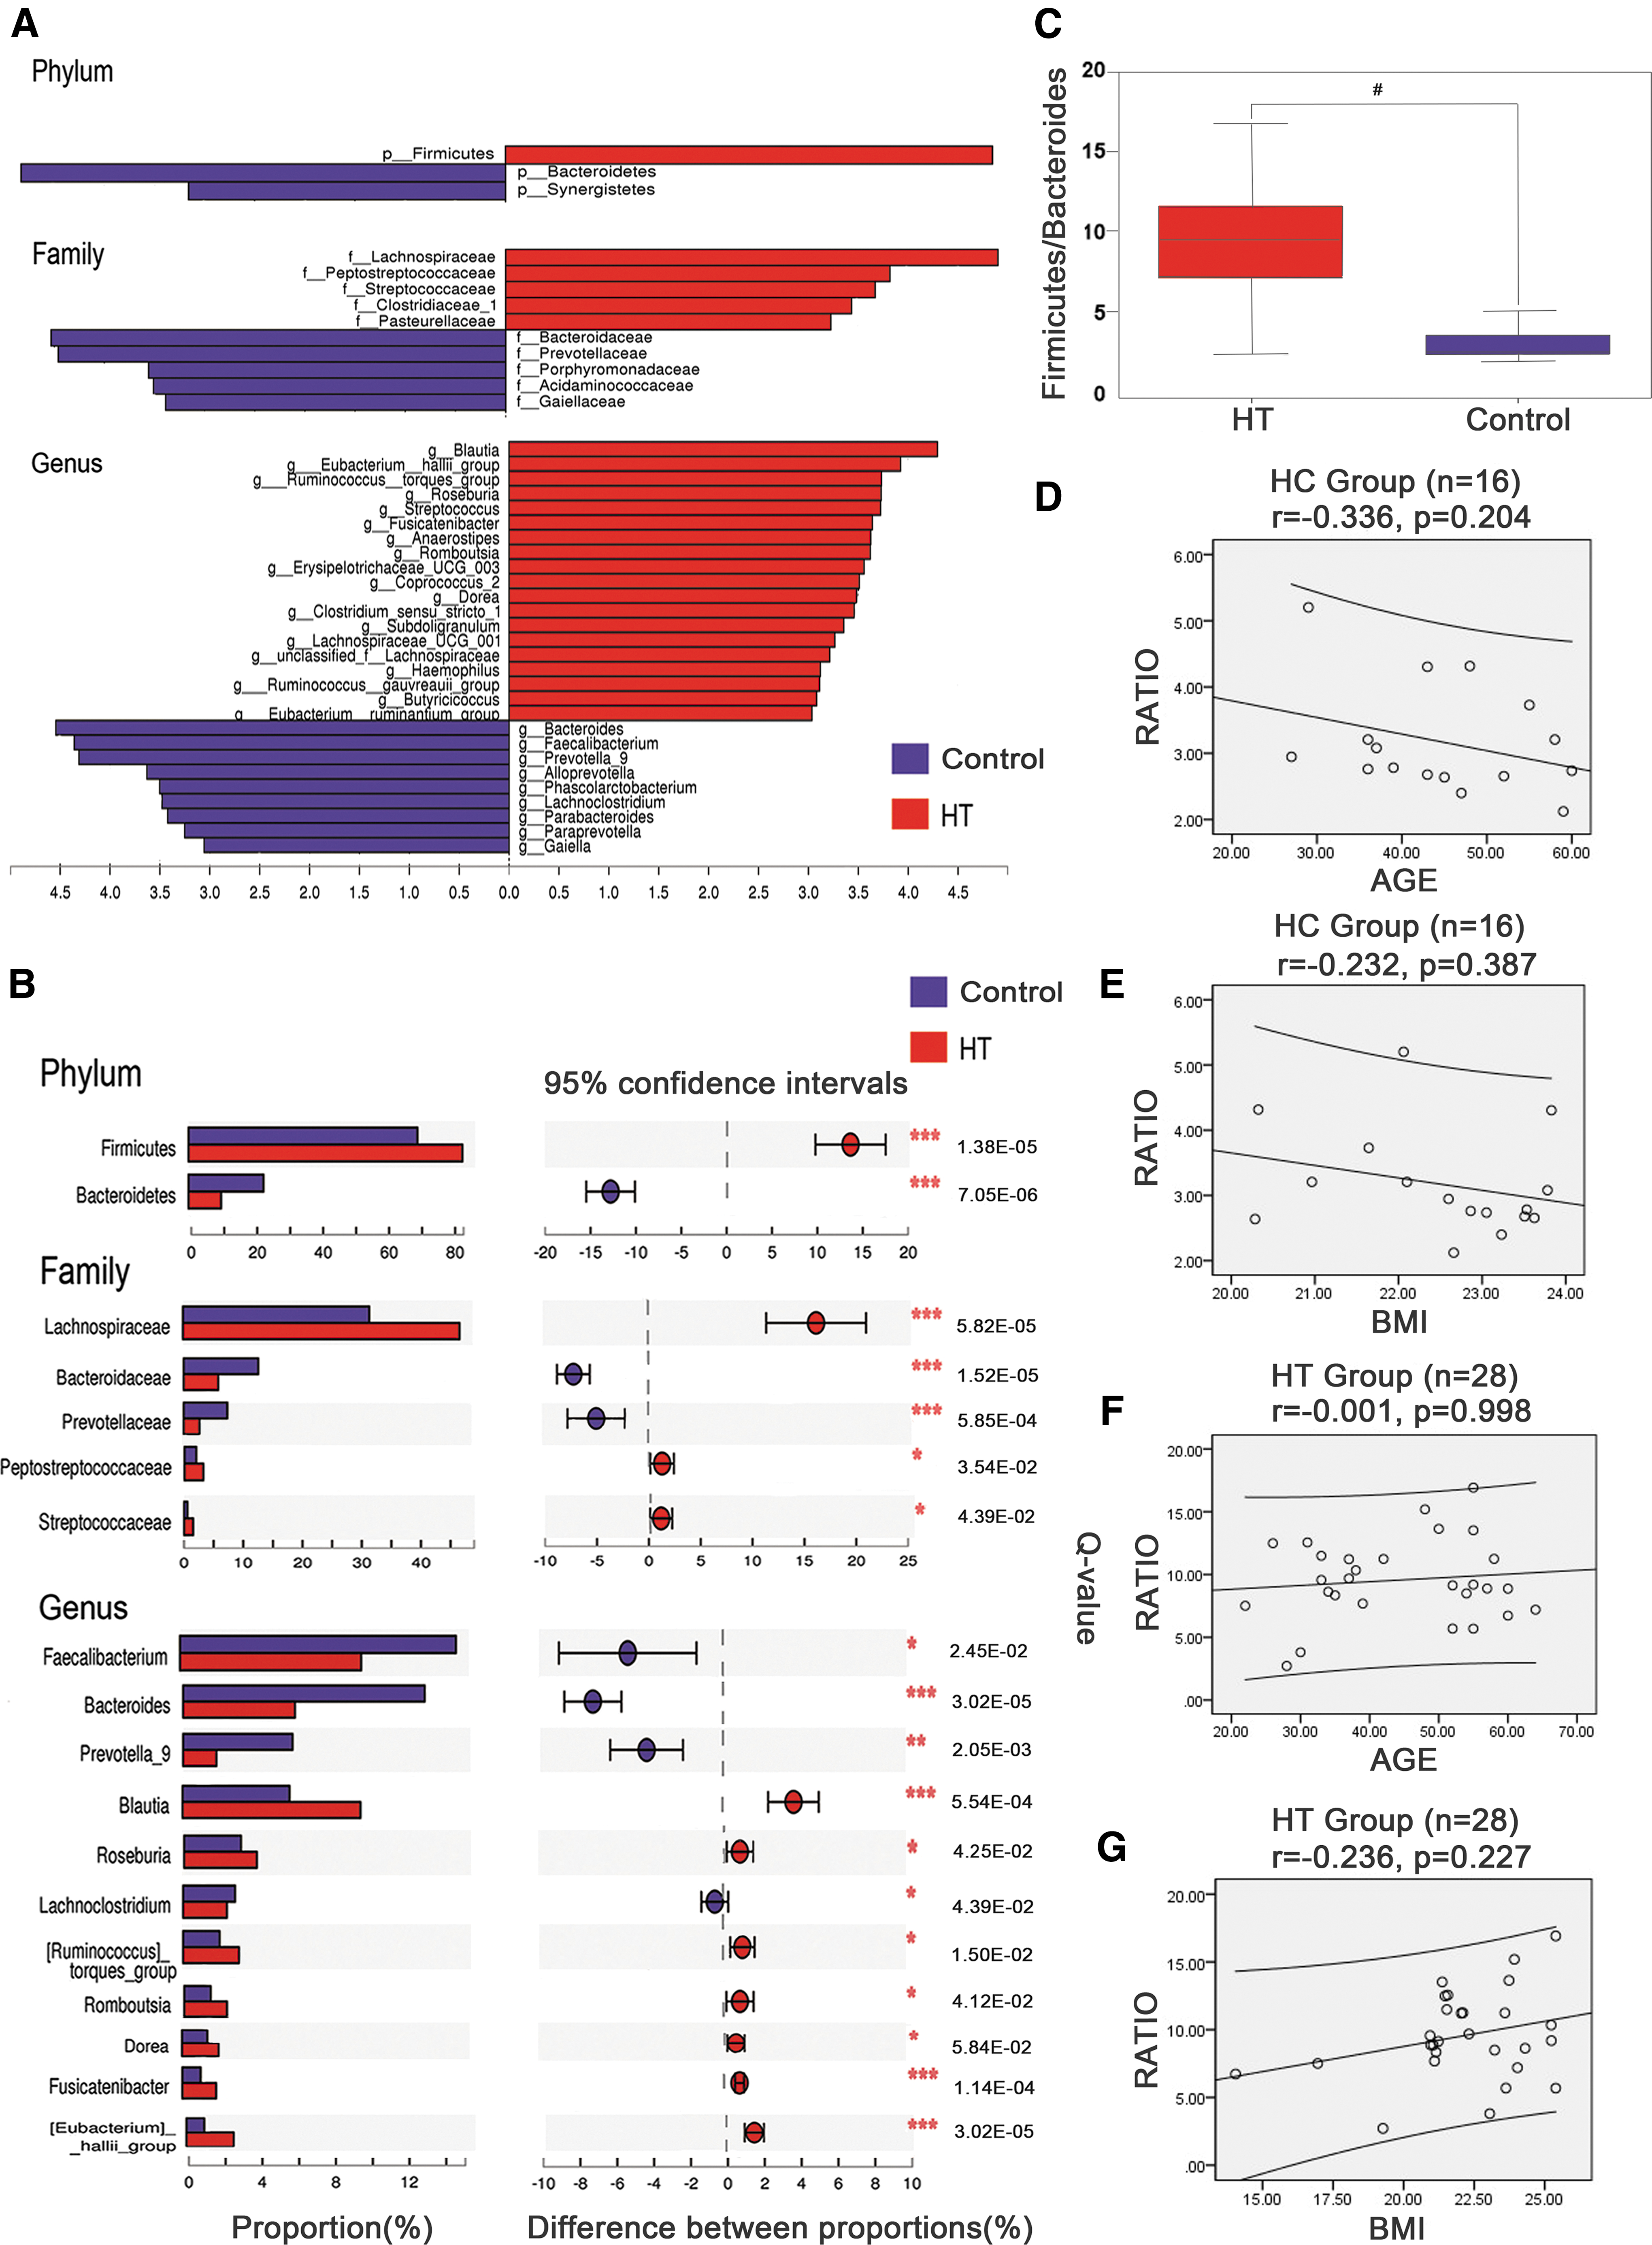
Taxonomic cladogram obtained using linear discriminant analysis (LDA) effect size (LEfSe) analysis and Mann–Whitney U-tests of the 16S sequences. LEfSe identified the taxa with the greatest differences in abundance between the HT patients and the healthy controls. At the phylum, family, and genus level, the HT patient-enriched taxa are indicated by a positive LDA score (blue), and healthy control-enriched taxa are indicated by a negative score (red). Only taxa meeting a significant LDA threshold value of >3 are shown (
These data indicate that the HT patients had different abundance levels of certain bacteria in the gut microbiota than the healthy controls. Although bacterial diversity was not altered dramatically, the aberrant compositions of the fecal microbiota indicated gut dysbiosis in the patients with HT. The F/B ratio was significantly higher in the HT patient samples (9.534 ± 3.207; p < 0.05; Fig. 2C) than that in the healthy control samples (3.175 ± 0.8209). A correlation matrix based on Pearson correlation distance confirmed correlations between the F/B ratio and age and BMI, but no significant differences (p > 0.05) were detected in the correlations between the healthy group or the HT group (Fig. 2D–G).
Clinical parameters correlated with the gut microbiota
The relationships between gut microbiota and host clinical parameters were explored. A correlation matrix based on Spearman correlation distance confirmed correlations among seven clinical parameters, and 27 genera showed significant differences between the two groups according to the LEfSe method (Fig. 2A). The results revealed significant correlations between different genera (not including Subdoligranulum, Alloprevotella, and Lachnoclostridium) and HT-related clinical diagnostic parameters, including TPOAb and TgAb (p < 0.05). Eighteen genera were enriched in the HT patient group and were positively correlated with TPOAb or TgAb, while six genera were enriched in the healthy control group and exhibited opposite correlations (Fig. 3A). Additionally, Alloprevotella was positively correlated with fT4, while Fusicatenibacter exhibited the opposite correlation. Romboutsia was negatively correlated with TSH. However, other environmental factors were not significantly correlated with the gut microbiota, including fT3, age, and BMI (p > 0.05).
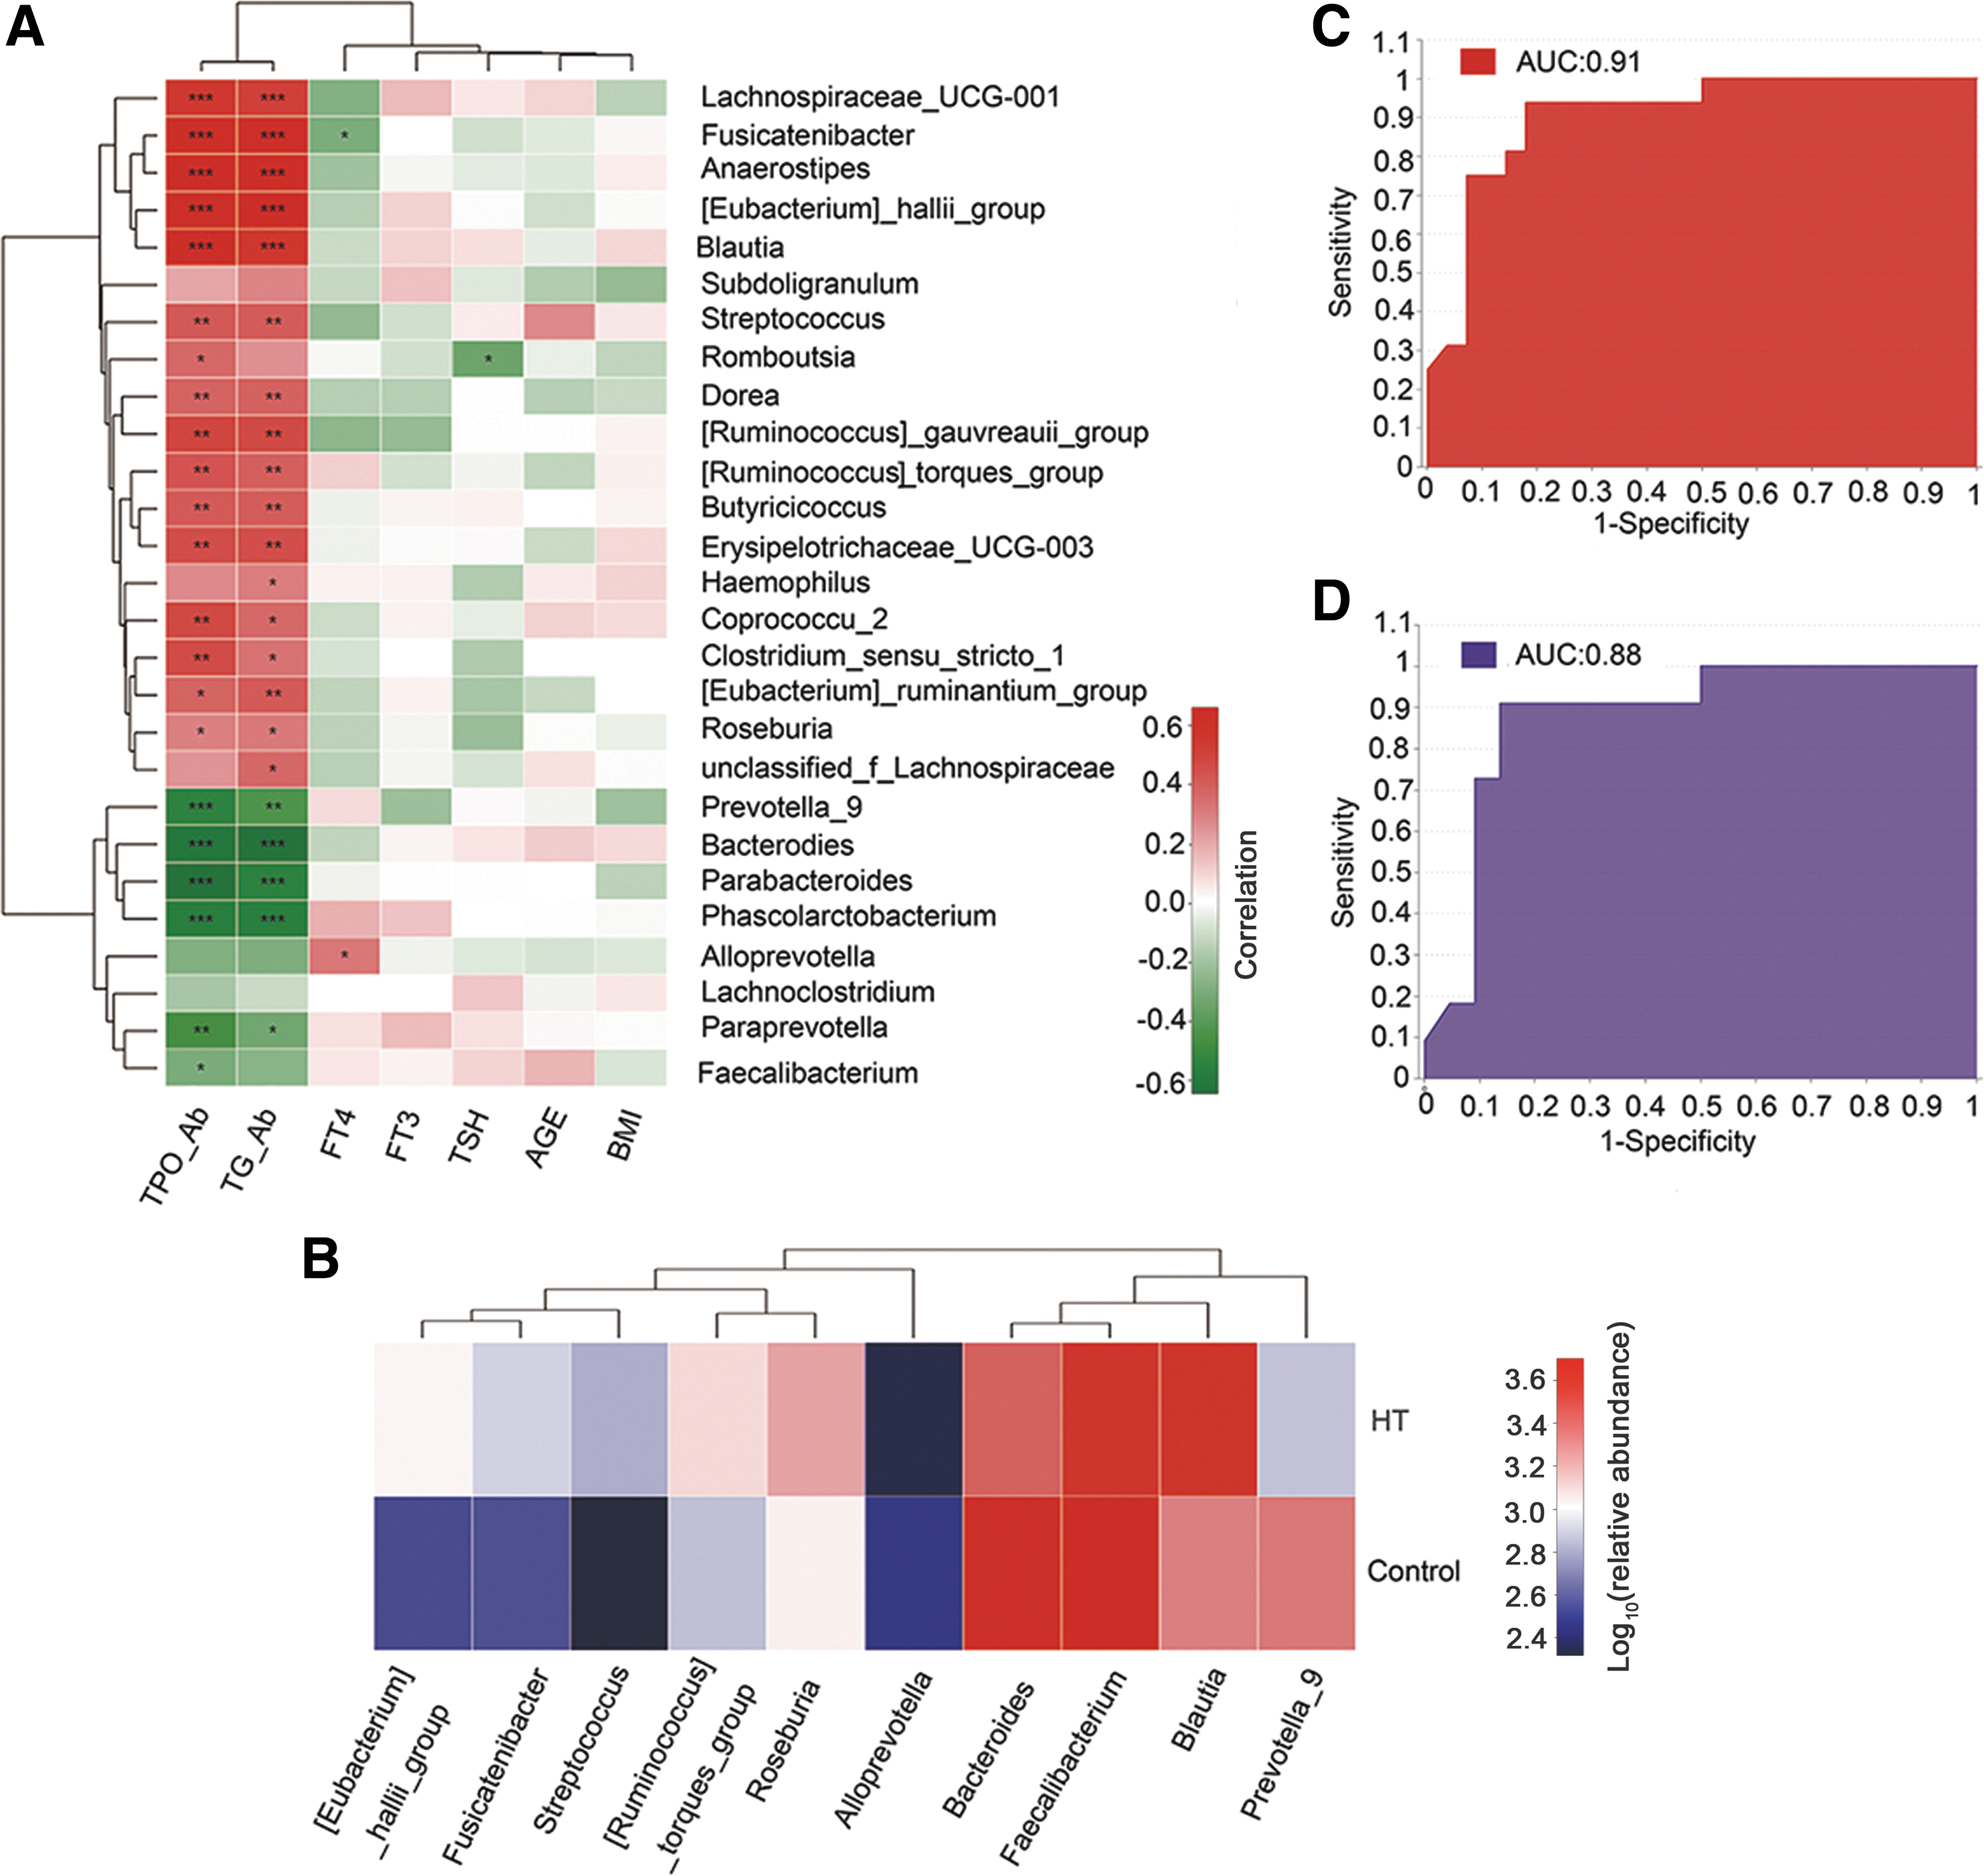
Spearman correlation analysis of environmental factors and the predictive model based on LEfSe analysis results. The relationships among seven clinical factors and the relative abundance of top 27 altered genera (Fig. 2B) in HT patients and healthy controls were estimated using Spearman correlation analysis. Heat maps showing correlations between clinical factors and gut microbiota at the genus level. Color intensity represents magnitude of correlation. Red, positive correlations; green, negative correlations. *Adjusted p-value <0.05; **adjusted p-value <0.01; ***adjusted p-value <0.001. TgAb, thyroglobulin antibody; TPOAb, thyroperoxidase antibody; fT3, free triiodothyronine; fT4, free thyroxine; TSH, thyrotropin (
Predictive model
The LEfSe analysis results revealed significant differences (LDA >3; p < 0.05) between the two groups for 27 genera, and the Spearman correlation test confirmed that 24 genera were significantly correlated with TPOAb or TgAb. Therefore, these differences in microbiota could serve as potential novel biomarkers for noninvasive monitoring and diagnosis of diseases. The performance of the model was assessed using ROC analysis. Finally, the first 10 species based on the LDA value were selected from the 27 different genera as biomarkers, achieving an AUC value of 0.91 (Fig. 3C). These species included members of Bacteroides (LDA = 4.55), Fecalibacterium (LDA = 4.34), Prevotella_9 (LDA = 4.31), Blautia (LDA = 4.31), Eubacterium_hallii_group (LDA = 3.90), Ruminococcus_torques_group (LDA = 3.74), Streptococcus (LDA = 3.67), Alloprevotella (LDA = 3.67), Roseburia (LDA = 3.63), and Fusicatenibacter (LDA = 3.62). Identification of the most prevalent genera in the earlier abundance analysis (Fig. 2B) indicated the robustness of both analyses. A heat map was generated based on the abundance levels of the first 10 species from the 27 different genera. Hierarchical clustering (Euclidean distance, complete linkage) shows that the two groups can be clearly separated (Fig. 3B), and HT patient samples generally clustered together (Supplementary Fig. S5). Subsequently, the discriminatory power of the model was evaluated using a validation cohort of 22 HT patients and 11 healthy controls, and an AUC value of 0.88 was achieved (Fig. 3D), confirming that the gut microbiota–based classifier can distinguish HT patients from controls.
Discussion
To date, no study has indicated a direct association between gut microbiota and HT. To bridge this gap, the 16S rRNA sequencing technique was used to characterize gut microbiota, and it was found that HT patients exhibit a gut microbiota composition distinct from that of healthy controls. A Spearman correlation analysis revealed correlations between altered gut microbiota and various clinical parameters. Moreover, a prediction model was proposed based on the LEfSe results, and high AUC values for both the exploration and the validation cohort were achieved. These results demonstrate that gut microbiota dysbiosis may play a role in the development of HT. Notably, all HT subjects in this study were euthyroid, whereas some previous studies revealed that changes in thyroid hormone concentrations in hypothyroidism or hyperthyroidism (16,17) may affect the composition of gut microbiota. Regarding hypo- and hyperthyroidism, the study was unable to reveal an intrinsic link between HT and gut microbiota. Therefore, only euthyroid HT patients were included in the study. However, in future studies, analyzing gut microbiota at various thyroxine concentrations may provide a better understanding of the changes in gut microbiota at different stages of the disease.
This cross-sectional study revealed that HT patients have greater gut microbiota richness and diversity (α-diversity) than healthy controls, although the differences did not differ significantly. In previous studies, increased bacterial diversity was also observed in hyperthyroid and hypothyroid patients and may be related to bacterial overgrowth in the intestinal tract (17,36). The similarity of the gut microbiota between HT patients and healthy controls was analyzed using cluster analysis (PCoA). The bacterial structures were clustered into two distinct groups, and the HT group displayed relatively high homology, indicating common characteristics among the HT patients. In this study, at the phylum level, Firmicutes were more abundant in the HT patients, whereas Bacteroidetes were less abundant. These findings are consistent with those of a previous study that reported significant increases in Firmicutes and decreases in Bacteroidetes species in obese, IBS, and MS patients (13,37,38). To the best of the authors' knowledge, the Firmicutes/Bacteroidetes ratio is considered representative of health status and may reflect eubiosis of the gastrointestinal tract. In this study, the F/B ratio was significantly increased in HT patients compared to healthy controls (Fig. 2C), but this increase showed no correlation with age or BMI (Fig. 2D–G). In addition, other studies have indicated that the intestinal flora of IBS patients has a higher F/B ratio (36,38). Therefore, it is thought that an increased F/B ratio corresponds to HT disease status.
At the genus level, it was found that the abundance levels of many genera were decreased in HT patients according to the LEfSe results (Fig. 2A). In previous studies, some species with decreased abundance levels were found to play important roles in maintaining human health. Similarly, other studies demonstrated that Bacteroides may efficiently ferment fiber into acetates and propionates (39) and that Phascolarctobacterium can produce short-chain fatty acids, which are intestinal epithelial-specific nutrients and energy components that protect the intestinal mucosal barrier and reduce inflammation (40). Fecalibacterium may also produce butyrate, which is essential for energy metabolism and the normal development of colonic epithelial cells, therefore exhibiting a protective role (41). Other studies have shown that Fecalbacterium prausnitzii supernatant, which contains a mixture of secreted products, has an anti-inflammatory effect (42) and may ameliorate colitis in mice by regulating Th17 cell differentiation and inhibiting the excretion of relevant inflammatory cytokines (43). A recent study indicated that F. prausnitzii levels were decreased in IBD patients (44). Prevotella and Oscillibacter are also known to produce anti-inflammatory metabolites, which subsequently reduce Th17 polarization and promote the differentiation of anti-inflammatory Treg/Tr1 cells in the gut (45). Moreover, decreased Prevotella levels have been reported in diseases such as MS, autism, and T1D (13,46,47). Alloprevotella are obligate anaerobic, nonmotile, Gram-negative bacilli. These strains are weakly to moderately saccharolytic and produce acetic and succinic acids as the end products of fermentation (48). Parabacteroides may reduce intestinal inflammation by inducing the anti-inflammatory cytokine interleukin (IL)-10 and suppressing the secretion of the inflammatory cytokines IL-17, IL-6, and interferon-γ (49). Decreases in Bifidobacterium were also observed in the HT group, although the difference was not significant (p = 0.5338). Bifidobacterium may beneficially affect a host by augmenting its intestinal microbial population, possibly inhibiting pathogens. Decreased levels of Bifidobacterium may lead to poor immune function (50). Therefore, in HT patients, decreased levels of these species may lead to intestinal mucosal barrier destruction, resulting in the translocation of bacteria and their products across the mucosal barrier and, consequently, the activation of immune responses.
According to the LEfSe results, the abundance levels of many genera were increased in HT patients (Fig. 2A).
Some species with increased abundance levels were shown to be related to autoimmune or inflammatory diseases in previous studies. Two Firmicutes, Blautia and Dorea, were more abundant in HT patients than in healthy controls. However, these species have been both positively (51) and negatively (52) linked to inflammatory diseases, and members of the genera Blautia and Dorea exhibited increased abundance levels in MS and Parkinson's disease (13,53). Ruminococcus_torques is a mucin-degrading member of the Clostridium_coccoides_group of Firmicutes in the human intestinal microbiota (54) and has been associated with Crohn's disease (55). The Ruminococcus_gauvreauii_group is a novel, strictly anaerobic, vancomycin-resistant, Gram-positive coccus group, and acetic acid is the sole product of glucose fermentation by these organisms (56). Coprococcus_catus, Eubacterium_hallii, and Anaerostipes_caccae were shown to use lactate as a substrate to produce propionate and butyrate (57,58). Fusicatenibacter saccharivorans (FS), a member of Clostridium cluster XIVa, is present at markedly lower levels in active ulcerative colitis (UC) than in quiescent UC. Lamina propria mononuclear cells (LPMCs) that were incubated with FS produced higher amounts of IL-10. FS also induced IL-10 production in human LPMCs isolated from UC patients. These results suggest that human-derived FS suppresses intestinal inflammation, probably through IL-10 induction, representing a possible future strategy of IBD bacteriotherapy to encourage these bacteria to colonize the intestines of IBD patients (59). Phylogenetically, Subdoligranulum is a member of Clostridium leptum and produces bacteriocins, which are protein toxins that suppress the growth of similar or closely related bacterial strains (60). Bacteriocins produced by this genus may play a role in suppressing Bifidobacteria growth during inulin fermentation.
Interestingly, the changes in gut microbial structure are similar between IBS and HT patients. Several recent comprehensive studies of the microbiota in IBS patients have reported increases in the relative abundance levels of Firmicutes, mainly Clostridium cluster XIVa (Blautia, Dorea, Eubacterium_rectale_group, and Ruminococcaceae), Ruminococcus_torques_group, Streptococcus, and Lachnospiraceae, and their abundance levels were positively correlated with bowel symptoms (38,61 –63). The question of whether the increased abundance levels of certain species can initiate HT in humans requires further investigation.
A heat map was used to visualize the relationships between species and clinical parameters, and the results show that some gut microbiota were notably correlated with HT-related clinical parameters (TPOAb, TgAb, fT4, and TSH), indicating that the gut microbiota are closely related to HT (Fig. 3A). These findings lay the foundation for research on the interaction between the gut microbiota and a host relative to the development of HT. A heat map based on the abundance of the first 10 genera (biomarkers) from 27 different genera was generated. Hierarchical clustering shows that the two groups could be clearly separated (Fig. 3B) and that HT patient samples generally cluster together (Supplementary Fig. S5), with an AUC value of 0.91 (Fig. 3C). Subsequently, good results were also obtained in the validation cohort (Fig. 3D), thus confirming that the gut microbiota can be used to identify patients accurately. Although this represents a new method for the early diagnosis of HT, large samples are needed to verify the accuracy of this method.
A key advantage of this study is that the 16S rRNA gene sequencing technique was used to characterize the gut microbiota of HT patients. Environmental factors were examined using Spearman correlation analysis, and a novel prediction model was proposed. However, this study has several limitations that must be addressed in future studies. First, this was a single-center, cross-sectional study involving a small number of samples. Second, the study was unable to observe variations among patients at different disease stages of HT because all patients in the cohort were euthyroid (most patients in the cohort were new-onset HT patients). Third, although HT patients were matched for age, sex, and BMI in the analysis, the results may be influenced by other confounding effects, such as stress and dietary factors. Fourth, microbiota analyses must include studies of the “virome,” “fungiome,” and so on. These factors warrant examination in future studies. Finally, the study does not include animal experiments or research regarding the possible mechanism linking gut microbiota dysbiosis to the development of HT. Therefore, further studies are needed with larger samples, multicenter designs, animal experiments, and the use of innovative research techniques (metagenomics and metabonomics) to explore the potential causal mechanisms between gut microbiota and HT, such as intestinal barrier dysfunction, microbiota translocation, and molecular mimicry in order to facilitate future scientific studies and provide guidance for the diagnosis, treatment, and prevention of HT.
Footnotes
Acknowledgments
This study was conducted at the First Affiliated Hospital of Harbin Medical University. This study was supported by Heilongjiang Provincial Science and Technology Department Funds for Distinguished Young Scholar JC201416 and the Translational Research Fund of Translational Medical Centre between China and Russia CR201514. We thank all the staff and participants for their important contributions.
Author Disclosure Statement
The authors declare no competing financial interests.