
Abstract
Background:
Papillary thyroid cancer (PTC) is the most common type of thyroid cancer. Unlike most cancers, its incidence has dramatically increased in the last decades mainly due to increased diagnosis of indolent PTCs. Adequate risk stratification is crucial to avoid the over-treatment of low-risk patients, as well as the under-treatment of high-risk patients, but the currently available markers are still insufficient. Kallikreins (KLKs) are emergent biomarkers in cancer, but their involvement in PTC is unknown.
Methods:
This study analyzed DNA methylation (HumanMethylation arrays) and gene expression (RNA-Seq) of KLKs, BRAF and RAS mutations, and clinical data from four published thyroid cancer data sets including normal and tumor tissues (n = 73, n = 475, n = 20, and n = 82) as discovery, training, and validation series. The C4.5 classification algorithm was used to generate a decision tree. Disease-free survival was estimated using Kaplan–Meier and Cox approaches. Specific analyses were performed using real-time polymerase chain reaction and immunohistochemistry.
Results:
The entire KLK family was deregulated in PTC, displaying a specific epigenetic and transcriptional profile strongly associated with BRAFV600E or RAS mutations. Thus, a decision-tree algorithm was developed based on three KLKs with >80% sensitivity and >95% specificity, identifying BRAF- and RAS-mutated tumors. Notably, tumors lacking these mutations were classified as BRAF- or RAS-like. Most importantly, the KLK algorithm uncovered a novel PTC subtype showing favorable prognostic features.
Conclusions:
The KLK algorithm could lead to a new clinically applicable strategy with important implications for the risk stratification of PTC and the management of patients.
Introduction
P
The exclusive activation of genetic alterations with an important structure–function correlation and clinical value has been identified. Most genetic alterations affect the MAPK and/or PI3K pathways, with BRAFV600E as the most common mutation (40–50%), followed by RET/PTC rearrangements (30–40%) and RAS mutations (10%) (4 –6). In addition to genetic alterations, epigenetic deregulation plays a crucial role in most cancers, and the best-studied epigenetic mechanism is DNA methylation (7,8). Recent genome-wide analyses in thyroid cancer, including the authors' (9), have revealed that DNA methylation profiles are specifically associated with histology and BRAFV600E and RAS mutations (9 –13). The largest and most complete study of PTC was performed by The Cancer Genome Atlas (TCGA) consortium (10). One of their major contributions was the development of a BRAFV600E –RAS score (BRS) based on a 71-gene expression signature that accurately identified BRAFV600E and RAS mutations in tumors (hereafter referred to as BRAF and RAS tumors). Most importantly, the application of the BRS to tumors lacking these mutations (BRAFWT RASWT , hereafter referred to as WT2 tumors) revealed a gene expression pattern resembling BRAF or RAS tumors, which could be considered as BRAF- or RAS-like tumors, showing profound implications for their classification (14).
These findings enhanced the current understanding of BRAF and RAS signaling pathways in PTC to improve patient staging system and identify molecules that could be used as biomarkers. Accordingly, in a previous genome-wide DNA methylation analysis (9), the kallikrein-10 (KLK10) gene was identified as specifically hypomethylated in BRAF tumors and in a subset of WT2 tumors. KLK10 is a secreted serine protease member of the human tissue kallikrein (KLK) family comprising 15 genes that cluster together on chromosome 19q13.4. KLKs are involved in a wide range of physiological and pathological processes (15), and interestingly, in recent years, these genes have emerged as important cancer biomarkers, with KLK3, encoding prostate-specific antigen, as the most recognized biomarker (16). However, the clinical significance of these genes in thyroid cancer is unknown.
The aim of the present study was to investigate the potential contribution of KLKs to the improvement of PTC risk stratification. The findings show a deregulation of the entire KLK family in PTC and a specific association of distinct KLK expression profiles with BRAF and RAS mutational state. Thus, a simple algorithm was developed based on three markers: the DNA methylation of KLK10 and the expression of KLK4 and KLK7, whose application to a large series of PTC recapitulated the BRS classification system of the TCGA study and, most importantly, uncovered a novel low-risk molecular subtype. These results underscore the potential of KLKs to improve thyroid cancer management and the easy implementation of the KLK algorithm in pathology laboratories.
Materials and Methods
Patients and data sets
The experimental design is illustrated in Supplementary Figure S1. Four independent and previously published thyroid cancer data sets were used: the Mancikova data set (9), TCGA data set (10), the Smallridge data set (17), and the Beltrami data set (13). The data comprised genome-wide DNA methylation, gene expression values, and the mutational state of BRAF and RAS. The baseline characteristics of the patients in each series are shown in Supplementary Table S1 (Supplementary Data are available online at
RNA isolation and quantitative reverse transcription polymerase chain reaction
Total RNA from seven normal tissue samples and 17 thyroid tumors (2 WT2, 5 RAS, and 10 BRAF) from the Mancikova series were kindly provided by Dr. M. Robledo (CNIO, Madrid, Spain). Five hundred nanograms of total RNA was reverse transcribed using Superscript III reverse transcriptase (Invitrogen, Carlsbad, CA) in a final volume of 20 μL according to the manufacturer's instructions. The expression of KLK4, KLK6, KLK7, and KLK10 and the reference genes Cyclophilin A (PPIA) and Pumilio RNA Binding Family Member 1 (PUM1) were analyzed using the LightCycler® 480 Real-Time PCR System (Roche, Mannenheim, Germany). The primers were designed using the Integrated DNA Technologies (IDT) tool (
Immunohistochemistry
Immunohistochemical staining with a monoclonal antibody against KLK10 (clone 1G8, dilution 1:100; H00005655-M01; Abnova, Aachen, Germany) was performed using the Ventana Benchmark XT System. Briefly, 4-μ-thick consecutive sections were deparaffinized in xylene and rehydrated in a graded alcohol series. Endogenous peroxidase was blocked with hydrogen peroxide at 5% and detection was performed using the Ultraview System following the manufacturer's instructions.
Differential DNA methylation analysis
Differential DNA methylation was analyzed through linear models using the R Bioconductor package limma v3.28-17 (19), and p-values were adjusted according to Benjamini and Hochberg's false discovery rate (FDR). Probes accomplishing an adjusted p-value of <0.05 and a β-value difference (Δβ-value) >0.2 or <–0.2 between a particular tumor group and normal tissue samples were considered hyper- or hypomethylated, respectively.
Clustering analysis
The gene supervised hierarchical clustering of KLK gene expression was based on fold changes in expression between tumors and normal tissue samples (calculated as the difference between the means of the log2[RSEM +1] of tumors and normal tissue samples) for every KLK gene in each of the 12 cancer data sets from TCGA. The Manhattan distance and ward.D2 method of clustering were used to generate all heatmaps. The heatmap was generated using the function “heatmap.2” from gplots R package v3.0-1 (20).
Differential gene expression
Differential gene expression analysis was performed using the R Bioconductor package DESeq2 (21), and p-values were adjusted according to Benjamini and Hochberg's FDR. Genes accomplishing an adjusted p-value of <0.05 and a log2(fold-change tumor/normal tissue) >1 or <–1 between two groups of samples were considered differentially expressed.
Algorithm development
Normal tissue samples, BRAF and RAS tumors, but not WT2 tumors, were used from the thyroid cancer TCGA series to develop the KLK algorithm (Supplementary Fig. S1B). TCGA series was randomly divided into one training subset and two validation subsets. The training subset included 16 normal tissue samples and 76 tumors with a percentage of tumoral nuclei (PTN) varying from 65% to 100%. The two validation subsets differed in the PTN of tumors: the high-purity validation (HPV) subset included 17 normal tissue samples and 116 tumors with a PTN varying from 86% to 100%, while the low-purity validation (LPV) subset included 17 normal tissue samples and 118 tumors with a PTN varying from 65% to 85%.
To obtain the KLK decision tree algorithm, C4.5 algorithm was used (“J48” function) implemented in RWeka (v0.4-24) (22). Briefly, the C4.5 algorithm was trained using gene expression and DNA methylation data from the training subset, namely, the (log2[RSEM +1]) value of the 15 KLK genes and the β-value of the 208 probes included in the Illumina Infinium HumanMethylation 450K array covering the KLK region.
To validate and evaluate the sensitivity, specificity, and predictive values of the generated KLK decision-tree algorithm, it was applied to the HPV and LPV subsets. Finally, the DNA methylation threshold value was validated using the series by Beltrami et al. (13).
Statistical analysis
All analyses were performed using R v3.1.0 (23). Values are expressed as means ± standard deviation (SD). Pearson's correlation coefficient (r) was calculated to evaluate the correlation between DNA methylation and gene expression levels. One-way analysis of variance (ANOVA), Kruskal–Wallis test, Mann–Whitney U-test, and Fisher's exact test were applied as appropriate after assessing data normality and heteroscedasticity (Bartlett's test); data independence was assumed. The Kruskal–Wallis test was performed using the “kruskal” function from the agricolae R package v1.2-3 (24). When appropriate, Kruskal–Wallis and one-way ANOVA were applied, followed by post hoc Mann–Whitney U-tests and Tukey's HSD tests, respectively, and p-values were adjusted with FDR. The significance level was established at p < 0.05 for all analyses.
The Kaplan–Meier method was used to plot the survival curves, and the likelihood-ratio test was used to evaluate the differences among the subgroups of tumors. The hazard ratio (HR) and confidence intervals (CI) were estimated using the Cox proportional hazard model. The functions “survfit” and “coxph” from survival R package v2.39-2 (25) were used. The endpoint was defined as the time (in months) between initial diagnosis and recurrence of the malignancy, with follow-up censored at last contact if no event had occurred.
Results
Epigenetic and transcriptional deregulation of the KLK cluster in PTC
Recently, a small region was identified within the promoter of the KLK10 gene specifically hypomethylated in BRAF tumors and in a subset of WT2 tumors (Fig. 1A and Supplementary Fig. S2A and B) (9). Here, these results were validated using an independent series from TCGA (Fig. 1B and Supplementary Fig. S2A and C). Moreover, its association with the upregulation of KLK10 at the RNA and protein levels was demonstrated (Fig. 1), suggesting the implication of DNA methylation in the regulation of this gene.
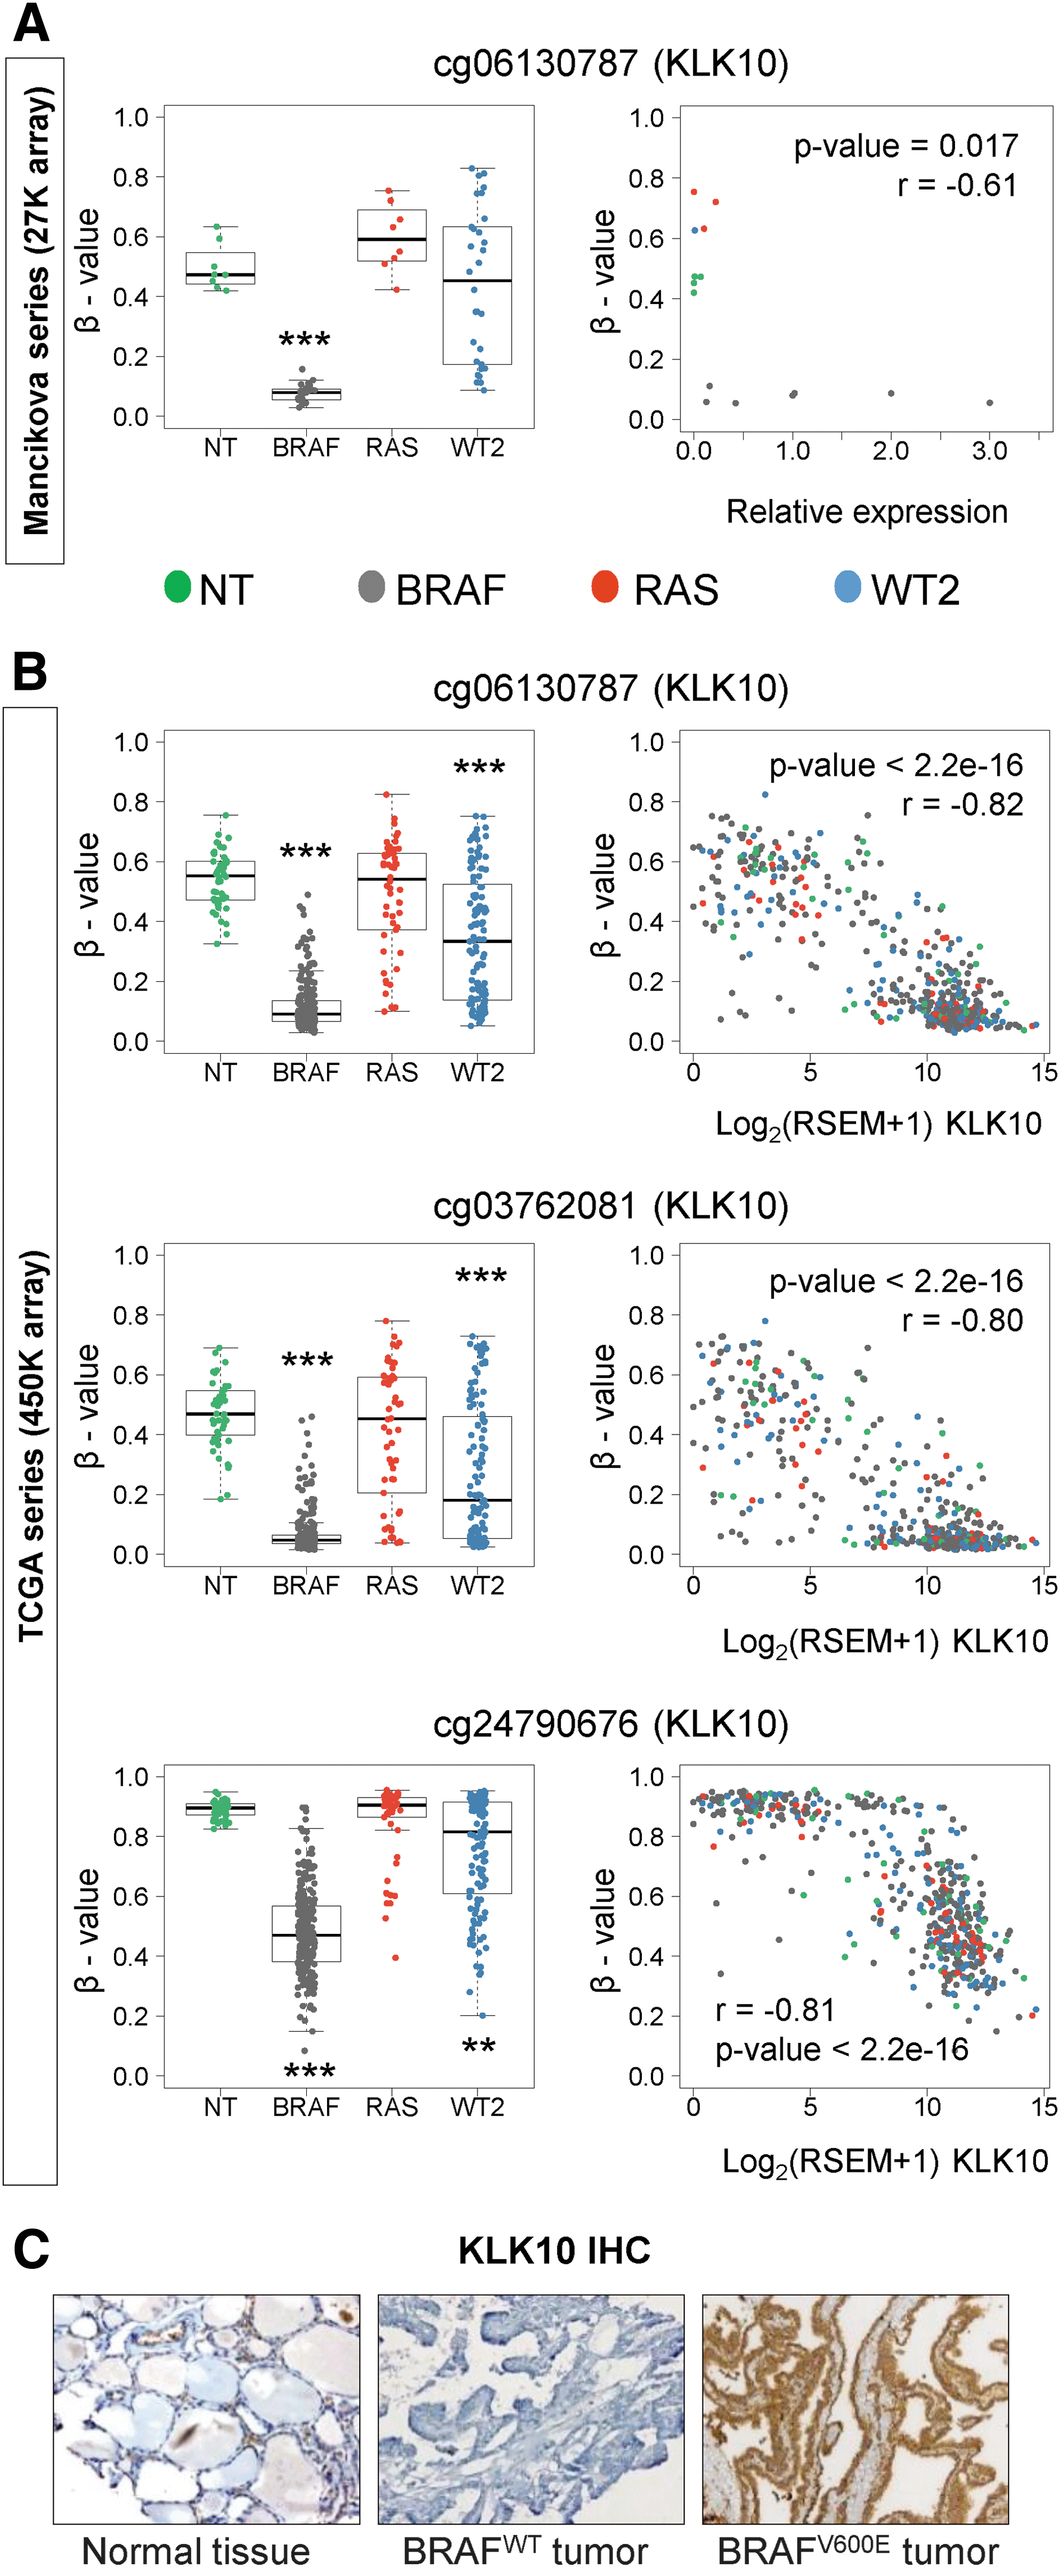
DNA methylation and expression of KLK10 in thyroid cancer. DNA methylation level represented as the β-value of different CpG sites within the KLK10 promoter (left) and its correlation with KLK10 mRNA expression (right) in thyroid normal (NT) and tumoral tissues from (
Next, the analysis of TCGA data was extended to the remaining 14 members of the KLK family. Among the 208 CpG sites analyzed within the KLK cluster, only seven CpGs in BRAF and one CpG in WT2 tumors were hypomethylated compared to normal tissue samples, while no hypomethylation was identified in RAS tumors (Supplementary Table S3). Interestingly, the only hypomethylated CpG in WT2 tumors was also present in BRAF tumors. Unlike BRAF and WT2 tumors that showed no hypermethylation, RAS tumors presented three hypermethylated CpGs. Next, the association of these alterations with the expression of the nearest KLK gene was investigated, revealing a correlation with hypomethylation but not hypermethylation (Supplementary Table S3).
Unlike DNA methylation, the expression profile of the entire family was dramatically deregulated. As shown in Figure 2A, three domains (A–C) were defined based on the KLK expression profile in the different mutational tumor groups. Thus, domain A (from KLK1 to KLK4) was characterized by a significant overall downregulation in all tumors compared to normal tissue. However, domains B (from KLK5 to KLK8) and C (from KLK10 to KLK13) were highly upregulated in BRAF tumors but not in RAS tumors. Regarding WT2 tumors, domain B showed an intermediate profile between that of BRAF and RAS tumors, and domain C was similar to RAS tumors (Fig. 2A, Supplementary Fig. S3, and Supplementary Table S4). Reinforcing these results, the expression pattern of KLK4, KLK6, KLK7, and KLK10, as representatives of the different domains, was confirmed using reverse transcription (RT-qPCR) in a subset of samples from the Mancikova series (Fig. 2B). Moreover, BRAFV600E -associated KLK expression profile was validated in the independent Smallridge series (Fig. 2C) (17).

KLKs signature. (
Additionally, the expression profile of KLKs was investigated in a broad variety of cancer types (Fig. 3 and Supplementary Fig. S4). Since the prevalence of BRAF and RAS mutations in these cancers was low and the inter-individual variability in some normal tissue samples was high, the average of paired normal-tumor samples was used. The results revealed expression alterations in most cancers, with colon, thyroid, and renal adenocarcinomas showing the most severe deregulation. Notably, the three domains (A–C) were maintained in all normal tissue samples and tumors, although displaying tissue- and cancer-specific patterns, respectively.
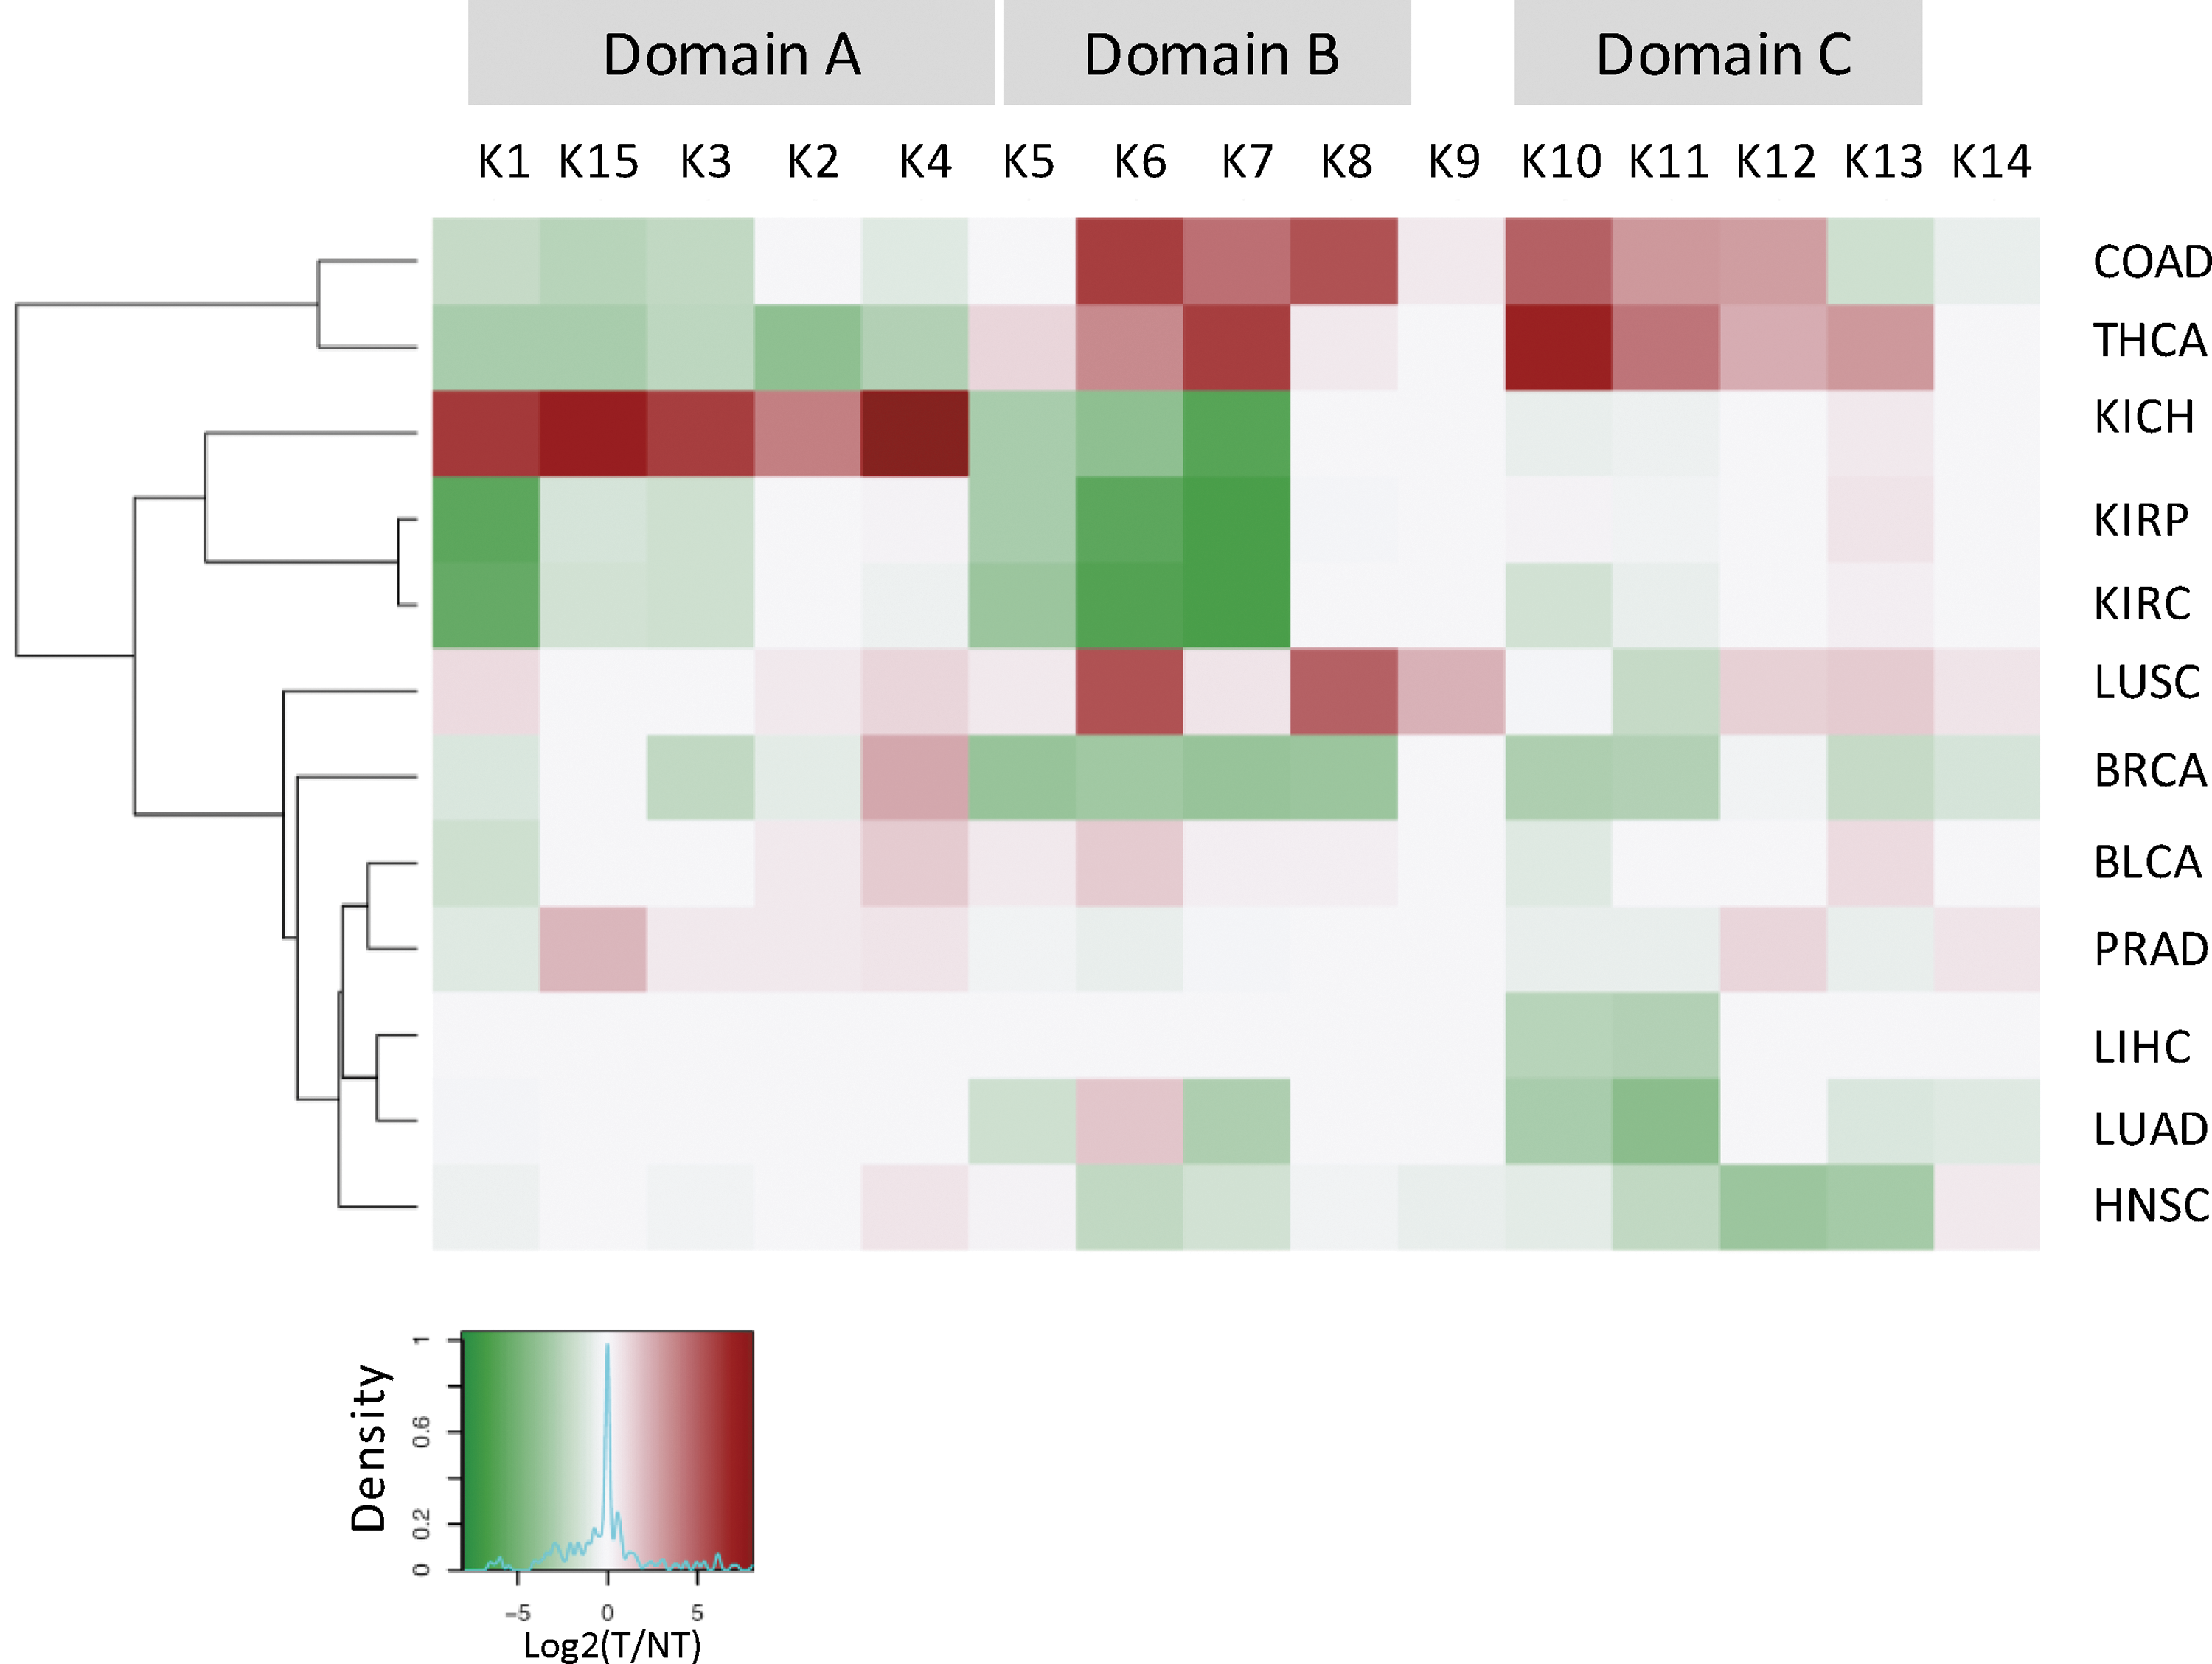
KLK expression signatures in different cancer types. Hierarchical clustering of KLK (K1–K15) gene expression based on TCGA RNA-Seq data using fold-change values (log2[tumor/normal tissue]) for 12 different cancer types. In all cases, the cluster can be divided into three domains (A–C) based on the expression profile.
Contribution of the KLK gene cluster to the molecular classification of PTC
The finding that KLK expression and, to a lesser extent, DNA methylation profiles in PTC were specifically associated with BRAF or RAS mutations prompted an exploration of whether thyroid cancer stratification based on KLK signatures could be of clinical use. Thus, an algorithm was developed using the expression of all KLKs and the DNA methylation of the KLK region of a training subset of TCGA samples including normal tissue samples and BRAF and RAS tumors (see Materials and Methods for details; Supplementary Fig. S1). A simple decision tree with as few as three features was obtained (Fig. 4A): the methylation level of a KLK10 promoter-associated CpG, and the expression of KLK7 and KLK4. Samples with low methylation in KLK10 CpG (≤0.204) and high levels of KLK7 (>3.98) were assigned to BRAF, whereas samples with low KLK7 expression (≤3.98) were classified as RAS. However, samples with highly methylated KLK10 CpG (>0.204) and highly expressed KLK4 (>4.91) were assigned as normal tissues, while samples with low KLK4 expression (≤4.91) were classified as RAS. Validation was performed using high- and low-purity (HPV and LPV, respectively) subsets of TCGA samples (see Materials and Methods for details; Supplementary Fig. S1), showing fairly good kappa statistics (HPV = 0.71; LPV = 0.63) according to Viera et al. (26) and very good sensitivity (HPV = 0.85; LPV = 0.83) and specificity (HPV = 0.93; LPV = 0.98) values independently of the purity. Moreover, the areas under the receiver operating characteristic curve were excellent (ranging from 0.88 to 0.96) in all groups, suggesting the potential of the KLK algorithm as a diagnostic tool (Fig. 4B, Supplementary Fig. S5A, and Supplementary Table S5).

KLK algorithm. (
Next, the KLK algorithm was applied to the 115 WT2 tumors from the TCGA series, of which 37 tumors were classified as BRAF and 47 as RAS. As shown in Supplementary Figure S6, their KLK expression profile was similar to that of BRAF and RAS tumors, respectively. As the KLK algorithm alone cannot determine the mutational state of BRAF or RAS but predicts the BRAF- or RAS-associated phenotype, all tumors classified as BRAF or RAS were called BRAF-like (BL) or RAS-like (RL), respectively, independently of the underlying mutation. Strikingly, the remaining 31 WT2 tumors were classified as normal tissue samples, and their KLK expression profile was similar to that of normal tissue samples (Supplementary Fig. S6). Accordingly, these tumors were called BRAF/RAS unlike (BRU) tumors. An enrichment of normal cells was discarded in BRU tumors (Supplementary Fig. S7). Interestingly, 24 BRAF and five RAS tumors were classified as BRU (Supplementary Table S6).
Comparing the KLK-based classification with that based on the BRS developed by TCGA revealed a relatively large overlap (78.6%). Nevertheless, BRU tumors contributed 69% of the non-overlapping samples (Supplementary Fig. S8). In addition, most BRAF tumors (20/28; 71.4%) from the series by Beltrami et al. (13) showed a β-value of <0.204 for KLK10 CpG, while the β-value was >0.204 in all normal tissue samples, confirming the threshold value used in the KLK decision tree. WT2 tumors showed a wide range of DNA methylation levels, likely reflecting the BRAF- and RAS-like phenotypes (Supplementary Fig. S9). Unfortunately, the full algorithm could not be applied to this data set, since it did not include RNA-Seq data.
BRU tumors constitute a favorable prognosis PTC subtype with specific molecular and clinicopathologic features
BRU tumors comprised approximately 14% of all cases analyzed. Thus, the question was raised as to whether these samples exhibited common differential characteristics. Therefore, their specific molecular and clinicopathologic features were investigated (Supplementary Table S7). First, the differential expression analysis between BRU tumors and the other groups revealed a total of 4390 differentially expressed genes (Supplementary Table S8), of which 886, 233, and 926 genes were unique to the comparison between BRU and BL, RL, or normal tissue samples, respectively (Fig. 5A). To characterize BRU tumors further, other molecular traits were analyzed, and significantly higher ploidy was found in BRU than in BL and RL tumors. Moreover, somatic copy number alterations showed a similar trend, although this was not statistically significant (Fig. 5B and Supplementary Fig. S10). Additionally, BRU tumors had a higher level of differentiation and lower MAPK over-activation based on differentiation and ERK scores from TCGA (10) than BL tumors.
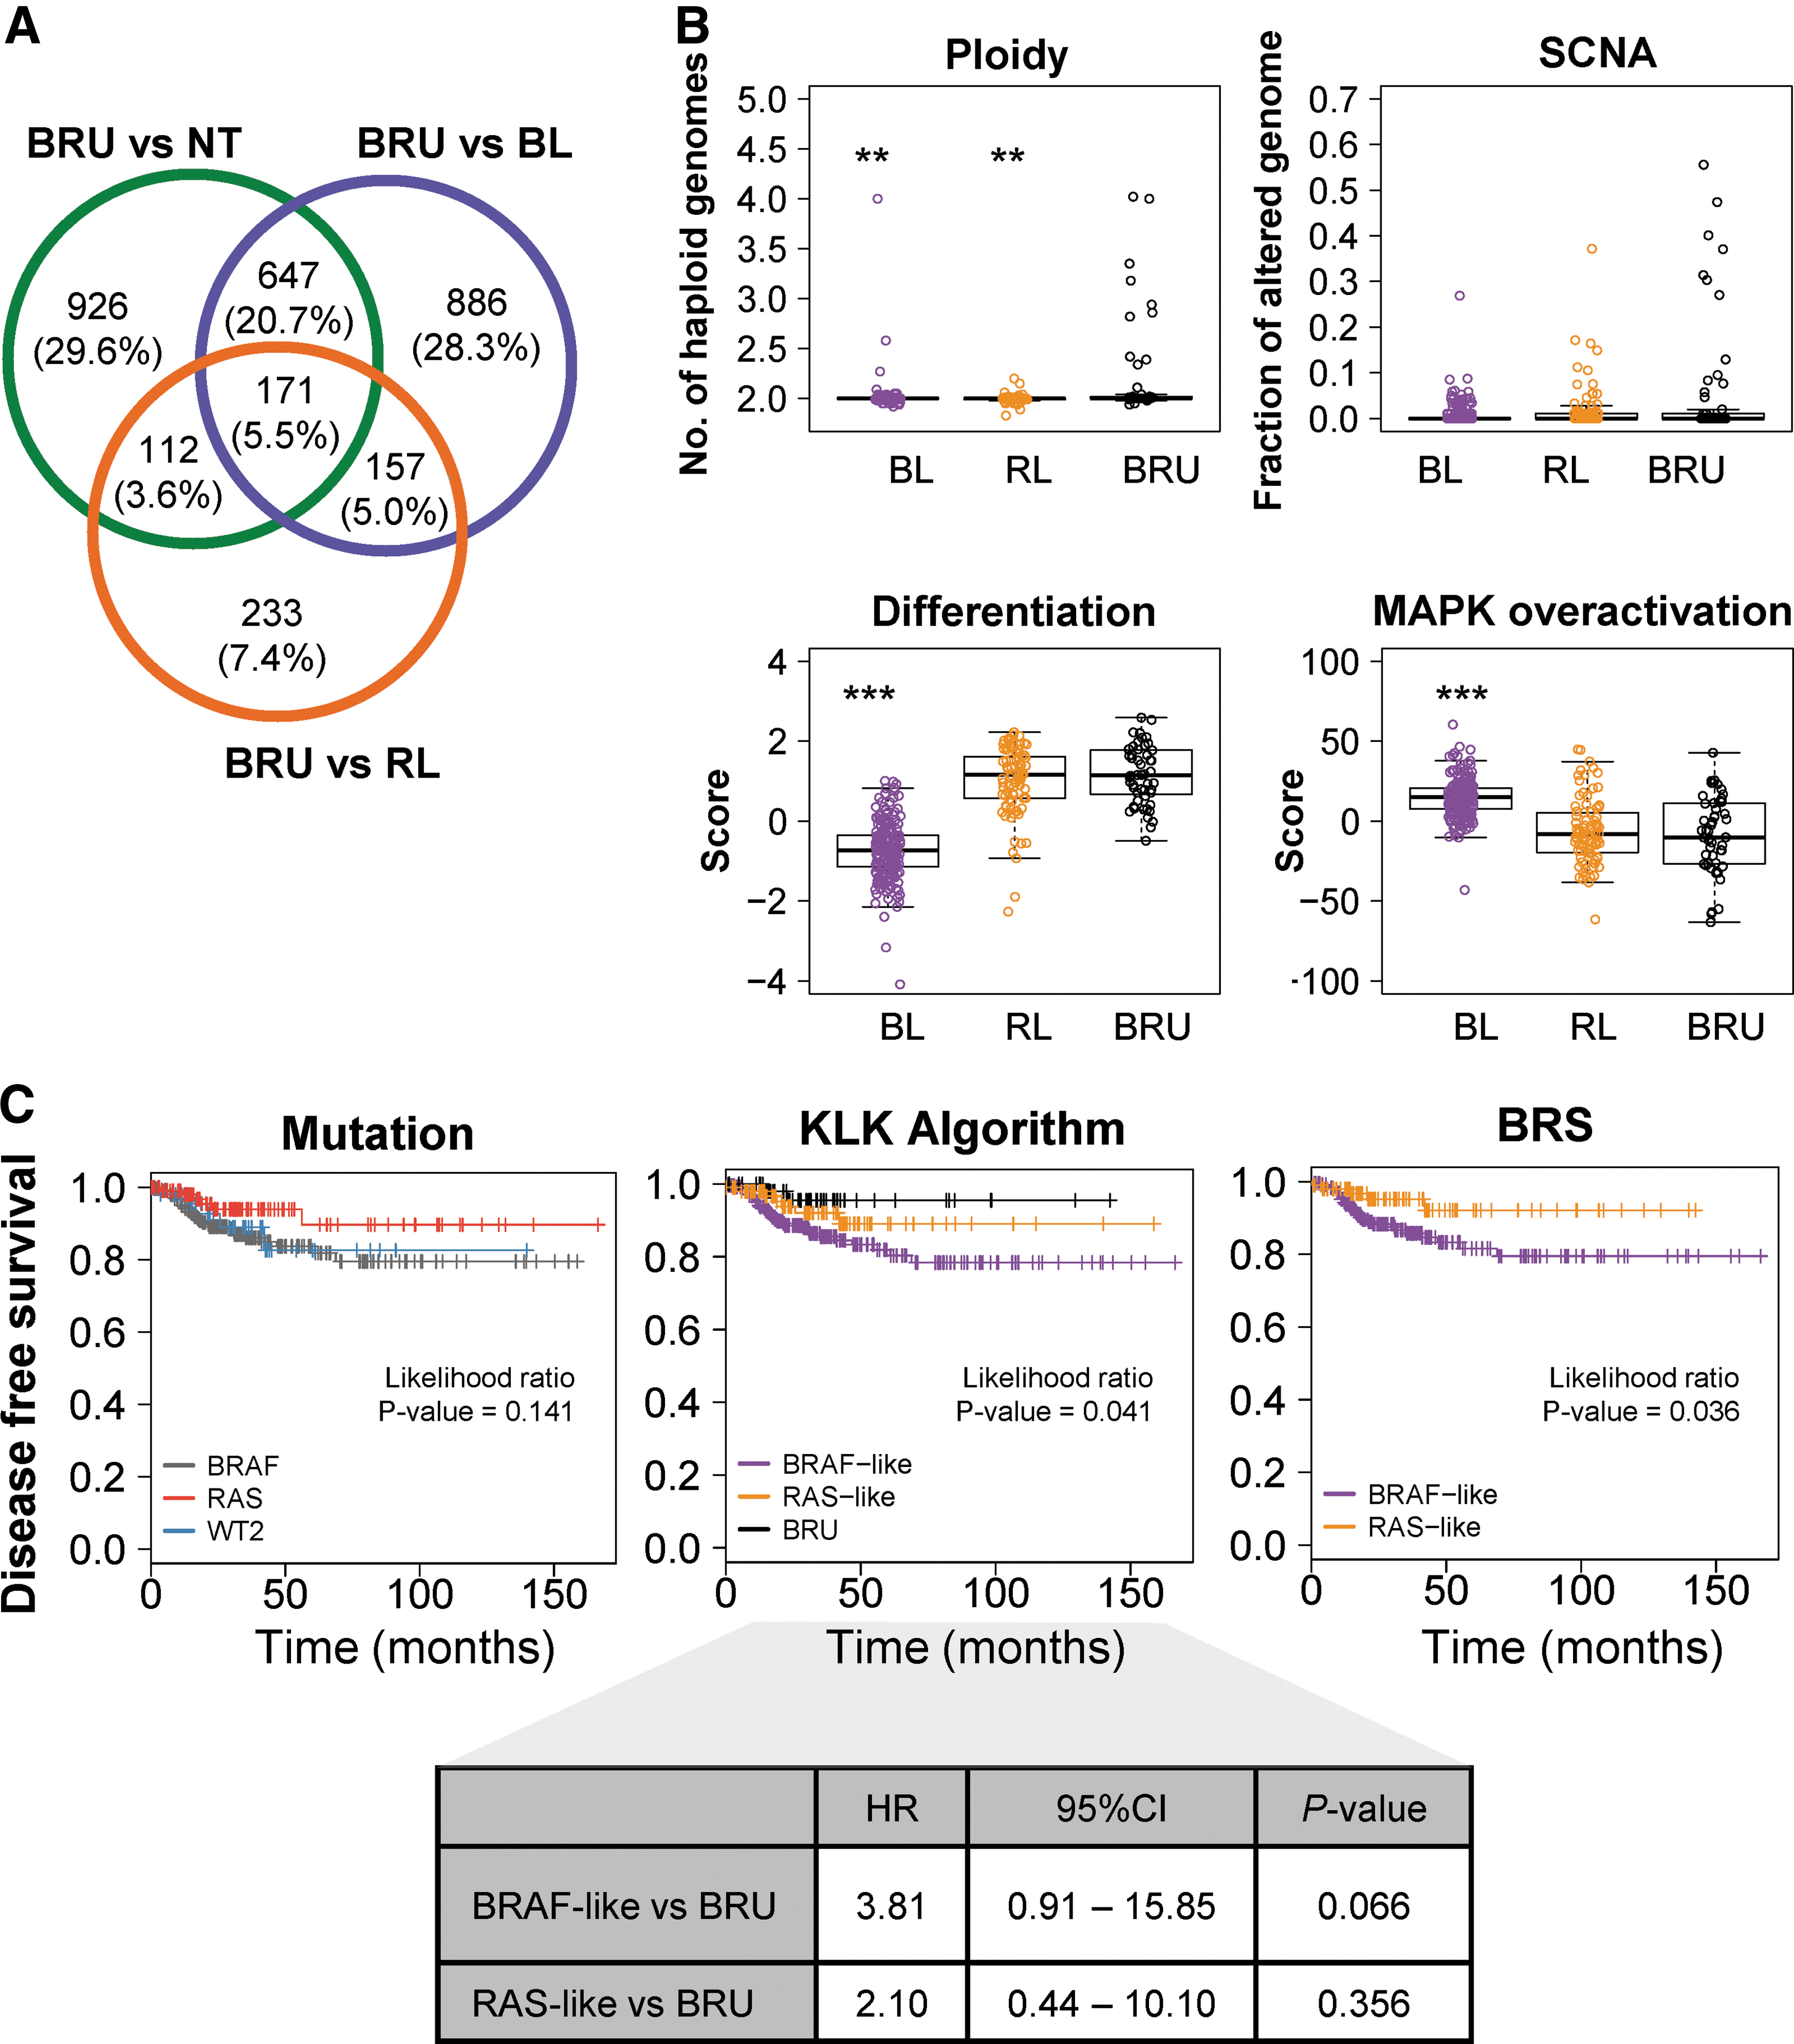
Molecular, clinicopathologic features, and prognostic value of PTC subgroups according to the KLK algorithm. (
Most importantly, BRU tumors showed distinctive clinicopathologic features (Table 1). Resembling RL tumors, BRU tumors included more follicular variants and less classical and tall-cell variants than BL tumors. Interestingly, the proportion of microcarcinomas was higher than observed in BL and RL tumors. Moreover, neither moderate nor advanced extrathyroidal extension was observed, and no tumors were high risk. Only one tumor was assigned to stage IV. The frequency of T3–T4 tumors was lower than in the BL group and similar to the RL group, while the presence of regional lymph node metastases was lower in the BRU group. In addition, the number of patients with recurrences or treated with radiation therapy was smaller in the BRU group. As some BRU tumors harbored a BRAFV600E mutation, despite the low number of BRAFV600E -BRU tumors, comparison with the BRAFV600E tumors in the BL group revealed statistically significant differences in some molecular and clinical features: BRAFV600E -BRU tumors were more differentiated, the proportion of microcarcinomas was higher, while the proportion of T3–T4 tumors was lower, and the number of patients treated with radioiodine was smaller in this group (Supplementary Fig. S10 and Supplementary Table S9). These findings suggest that BRU tumors might constitute a favorable prognosis PTC subtype.
Statistically significant values are shown in bold.
Fisher's exact test.
TCGA, The Cancer Genome Atlas; BRU, BRAF/RAS unlike tumors.
In addition, Kaplan–Meier survival curves of patients classified according to the mutational state of BRAF and RAS, the KLK algorithm, and the BRS were evaluated, respectively, showing statistically significant differences in disease-free survival (DFS) associated with the KLK algorithm and the BRS but not the mutation (Fig. 5). The DFS was longer in patients with BRU tumors than in patients with BL or RL tumors, although only the BL group showed a marginally significant worse DFS compared to BRU tumors (HR = 3.81 [CI 0.91–15.85]; p = 0.066).
Discussion
In recent years, the alteration of some KLKs has been associated with different cancer types, emerging as promising biomarkers (15). The present study showed the aberrant expression of the entire KLK family in PTC. Moreover, a simple algorithm was developed based on three KLKs, which classifies PTC in BRAF- and RAS-like tumors and, most importantly, defines a novel low-risk PTC subtype.
Although some specific KLKs are altered in thyroid cancer (27 –30), the data are scarce. To the best of the authors' knowledge, this study is the first to show the deregulation of the entire KLK cluster in PTC. Moreover, these results revealed the presence of three domains (A–C) whose expression is distinctive and specific to the BRAF and RAS mutational state. Domain A is downregulated in all tumors, while domains B and C are upregulated in BRAF and a fraction of WT2 tumors. Colorectal tumors harboring BRAFV600E mutation also overexpress KLK6 and KLK10 (domains B and C) (31), suggesting a common underlying BRAF-dependent regulation. Thus, further investigation is required to elucidate the mechanism linking BRAFV600E mutation and KLKs. In this regard, this study shows that the overexpression of KLK10 is associated with the hypomethylation of its promoter. Interestingly, in other cancer types, KLK10 is downregulated by the hypermethylation of the CpG island in exon 3 (32), reinforcing the role of DNA methylation in the regulation of this gene. However, only a few aberrantly methylated CpGs were identified along the KLK cluster, highlighting the involvement of other regulatory mechanisms. The identification of three expression domains suggests regional co-regulation. Accordingly, Bert et al. reported that the KLK cluster was deregulated in prostate cancer through a coordinated long-range epigenetic activation (LREA) mediated by histone marks (33).
Taking advantage of TCGA data, other malignancies were analyzed, and it was observed that the aberrant expression of the entire KLK cluster is a widespread phenomenon in cancer. Consistent with previous studies (34), this study shows that some KLKs are tissue-specific, while others are ubiquitous. Most importantly, the three expression domains identified in PTC were maintained in all analyzed normal and tumor tissues but displayed different profiles.
Although the prognosis of most PTC patients is excellent, prognostic markers are still needed. Recent studies have proposed mutational analysis, particularly in relation to BRAF and RAS, as an important tool to stratify the risk and determine the extent of surgery in PTC patients (5). This classification has been enhanced by the definition of BL and RL phenotypes by TCGA (10). Accordingly, in the present study, a classifier was developed that stratifies PTC in BL and RL tumors with high sensitivity and specificity, even tumors with a low purity, but instead of using a 71-gene expression signature such as TCGA, this classifier comprises the DNA methylation of KLK10 and the expression of KLK4 and KLK7. Of 256 BRAF tumors, 11 (4.2%) were classified as RL, and 3/54 (5.6%) RAS tumors were classified as BL, which could be due to a misclassification by the KLK algorithm. However, Yoo et al. classified some RAS tumors as BL and some BRAF tumors as RL as well (35). Moreover, this phenomenon was also noticed by Popovici et al. in colorectal cancer (31). Thus, further validation in independent series is required.
Furthermore, the application of the KLK classifier enabled the identification of a novel group of tumors displaying a KLK profile similar to normal thyroid tissue, referred to as BRU tumors. TCGA did not include data from normal thyroid tissues to develop the BRAF-RAS score, which probably hampered the identification of BRU tumors. Importantly, this BRU group has differential molecular traits and favorable prognosis features, such as no advanced extrathyroidal extension, no high-risk or stage IV tumors, or a higher DFS. Analysis of the transcriptome showed a BRU-specific expression profile, comprising 4390 differentially expressed genes compared to BL, RL, and normal tissue samples. Interestingly, 53.43% of these genes are included in the prognostic signature defined by Brennan et al. to distinguish between extremely good and extremely poor prognosis patients (36). Recently, Yoo et al. described a novel molecular subtype of thyroid tumors called non-BRAF-non-RAS (BNRN) associated with genetic alterations in DICER1, EIF1AX, IDH1, PTEN, SOS1, SPOP, and PAX8–PPARG (35). Although further analyses are required to elucidate the relationship between BNRN and BRU tumors, BRU tumors seem to be a different molecular subtype, since they are not associated with these genes (Supplementary Table S7).
Altogether, these findings indicate that BRU tumors represent a low-risk PTC subtype, which may benefit from less aggressive treatment, such as hemithyroidectomy, no radioactive iodine ablation, lower TSH suppression, and/or a less intense follow-up. This finding is particularly interesting for BRAFV600E tumors within the BRU group and could shed light on the controversy regarding the prognostic value of this mutation (4). In this regard, results revealed differences in some molecular and clinical features between BRAF-BL and BRAF-BRU tumors, suggesting better prognostic features for BRAF-BRU tumors. Moreover, patients with a BRU microcarcinoma, unless they show high-risk features, could be recommended for an active observation as alternative therapy to immediate surgery, as Ito et al. have previously proposed (37). Recent guidelines (38,39) advise against performing routine fine-needle aspiration (FNA) in nodules <1 cm, even if they present suspicious ultrasound features. Nevertheless, despite this, FNA in these small nodules and surgery on patients with microcarcinomas are still common in the clinical routine, probably because a small subset of microcarcinomas is associated with the development of distant metastases and poor outcomes. Thus, the KLK algorithm may be able to provide molecular data to the inclusion criteria of candidates for active surveillance. On the other hand, some microcarcinomas are found during histological review after surgery for benign disease (incidental microcarcinomas). The classification of these incidental microcarcinomas as BRU could help to ensure their low risk of progression, which, in turn, has implications for the follow-up of these patients.
Since the KLK algorithm is based on the DNA methylation of one CpG and the expression of two genes, which can be measured using simple and cheap techniques (sequencing, reverse transcription qPCR, and/or immunohistochemistry) available in most anatomopathologic laboratories, this algorithm may be easily implemented into routine clinical practice and, most importantly, applied to preoperative specimens such as FNA biopsies. Future studies are required to develop a new molecular tool based on the KLK algorithm. Although the results suggest that the mutational state of BRAF and RAS do not provide additional prognostic information to the KLK algorithm, a panel combining the KLK algorithm with mutational analysis of other genes such as the TERT promoter (40) may improve their prognostic value.
The study has several limitations. First, the development and application of the KLK algorithm has been performed with TCGA series, limiting the study to PTC. Thus, it would be interesting to extend these studies to other follicular cell-derived tumors. Preliminary analyses from previous work in adenomas and follicular carcinomas suggest similar results (9). Second, an independent large series of thyroid tumors outside of TCGA with DNA methylation and expression data obtained by HumanMethylation arrays and RNA-Seq, respectively, is not currently available as an external validation series of the full KLK algorithm. Therefore, TCGA series was divided into one training subset and two validation subsets. However, the KLK expression profile and DNA methylation changes were validated in independent series by different techniques. Third, TCGA series has limited power for prognostic studies, as the number of events (recurrences and deaths) is very low. Thus, further validation in independent series with a higher number of poor outcome cases is required, which will enhance the differential clinical traits of BRU tumors.
Conclusions
In summary, the first report is provided of the aberrant expression and DNA methylation of the KLK cluster in PTC. Moreover, a simple and clinically applicable algorithm was developed that classifies PTC into BRAF-like, RAS-like, and BRU tumors, with the latter being a novel low-risk subtype. Thus, the stratification of PTC patients using the KLK algorithm may have broad spectrum of applications, including diagnostic and prognostic preoperative evaluation. The clinical potential of the KLK algorithm has to be further validated in retrospective and prospective studies.
Footnotes
Acknowledgments
R.B. was supported by a FPI fellowship from the Ministerio de Economía y Competitividad. A.D.-V. was supported in part by a contract PTC2011-1091 from the Ministerio de Economía y Competitividad. This work was supported by grants from the Ministerio de Economía y Competitividad (SAF2015/64521-R to MAP), from the Instituto de Salud Carlos III, co-funded by ERDF/ESF, “Investing in your future” (FIS PI11/02421 to J.L.R. and FIS PI14/00308 to M.J.), and from CERCA Program / Generalitat de Catalunya. Funding bodies had no role in the design of the study and collection, analysis, and interpretation of data or in writing the manuscript.
We thank Iñaki Martínez de Ilarduya for his excellent technical assistance. We are grateful to Mònica Suelves for critical reading and interesting comments of the manuscript. We want to acknowledge the patients and the IGTP‐HUGTP Biobank integrated in the Spanish National Biobanks Network of Instituto de Salud Carlos III (PT13/0010/0009) and Tumor Bank Network of Catalonia for its collaboration. We also thank the IGTP-Histopathology and Electron Microscopy Core Facility and staff for their contribution to this publication. The results published here are in part based upon data generated by TCGA Research Network:
Author Disclosure Statement
M.A.P. is cofounder and equity holder of Aniling, a biotech company with no interests in this paper. The other authors declare that they have no competing interests.