
Abstract
Background:
Visual interpretation of ultrasound (US) images alone may not be sensitive enough to detect important features of potentially malignant thyroid nodules. The aim of this study was to develop a radiomics score using US imaging to predict the probability for malignancy of thyroid nodules as compared with the Thyroid Imaging, Reporting, and Data System (TI-RADS) scoring criteria proposed by the American College of Radiology (ACR).
Methods:
One hundred thirty-seven pathologically proven thyroid nodules from hospital 1 were enrolled as a training cohort, while 95 nodules from hospital 2 served as the validation cohort. A radiomics score using US images was developed from the training cohort. Two junior and two senior radiologists reviewed all images and scored each nodule according to the 2017 updated ACR TI-RADS scoring criteria. Univariate logistic regression analysis was used to develop the prediction models based on the radiomics score and ACR scores. The performance of the models was evaluated and compared with respect to discrimination, calibration, and clinical application in the validation cohort.
Results:
Univariate regression indicated that the radiomics score and ACR scores were predictors for thyroid nodule malignancy (all p < 0.001). Five prediction models were built based on the above scores. The radiomics score showed good discrimination with an AUC of 0.921 in the training cohort and 0.931 in the validation cohort, which was significantly better than the ACR scores of junior radiologists in both cohorts. Although five models showed good calibration (all p > 0.05), the model based on the radiomics score presented the lowest errors (E max = 0.073 or E aver = 0.028) in predicting and calibrating probabilities. Decision curve analysis demonstrated that the model using the radiomics score added more benefit than using the ACR scores of junior radiologists.
Conclusion:
Compared with ACR TI-RADS evaluation by junior radiologists, the radiomics score showed good performance in predicting malignancy of thyroid nodules in our set of histologically verified thyroid nodules from two tertiary hospitals.
Introduction
G
However, visual interpretation of US images is generally based on a radiologist's experience. In addition, informative features of the image, such as texture features or histogram-based parameters, may not be evaluated through visual interpretation. Previous studies have reported that radiomics features can be computed to characterize the texture and morphology of tumors from grayscale medical images (8 –11). Most of the quantitative features extracted through computerized algorithms are beyond visual interpretation but may be associated with important clinical outcomes (12 –14). Therefore, we hypothesized that these potential quantitative features extracted from US imaging could predict malignancy of thyroid nodules.
To the best of our knowledge, no published series has applied radiomics to predict the malignancy of thyroid nodules. In the present study, we developed a radiomics score using US images to predict malignancy of thyroid nodules and compared this computing score system with the subjective scoring criteria based on ACR TI-RADS (2017 edition).
Materials and Methods
Patient characteristics and thyroid nodules
Informed consent was waived for this retrospective study. The study was approved by the ethics committee of the hospital and complied with the Declaration of Helsinki. Between October 1, 2015, and March 1, 2016, consecutive patients with thyroid nodules in hospital 1 (First Affiliated Hospital of Sun Yat-sen University, Guangzhou, China) and hospital 2 (Sun Yat-sen University Cancer Center, Guangzhou, China) were included. The nodules were enrolled using the following inclusion and exclusion criteria.
Inclusion criteria: (1) The target nodule had undergone surgical resection; (2) histopathology of the surgical specimen was available; (3) US examination of the thyroid nodule was performed within 2 weeks before resection; (4) US examination was performed using the Philips iU22 system and the same linear array transducer with a 5–12 MHz frequency bandwidth (L12-5; Philips Ultrasound, Bothell, Washington); and (5) the gray image of the target nodule in the largest long axis cross section was available.
Exclusion criteria: (1) The pathological result of the surgical specimen was unclear; (2) the patient had undergone preoperative therapy (radiotherapy or chemotherapy); and (3) the target nodule was not completely visible in the image.
A Standards for Reporting of Diagnostic Accuracy diagram showing the numbers of patients included and excluded is shown in Figure 1. A total of 137 nodules from 137 patients (39 males and 98 females; mean age, 45.8 ± 11.8 years; range, 21 to 75 years) from hospital 1 were enrolled as the training cohort in our study. A total of 95 thyroid nodules from 95 patients (20 males and 75 females; mean age, 43.2 ± 11.1 years; range, 14 to 74 years) from hospital 2 were enrolled as the validation cohort.
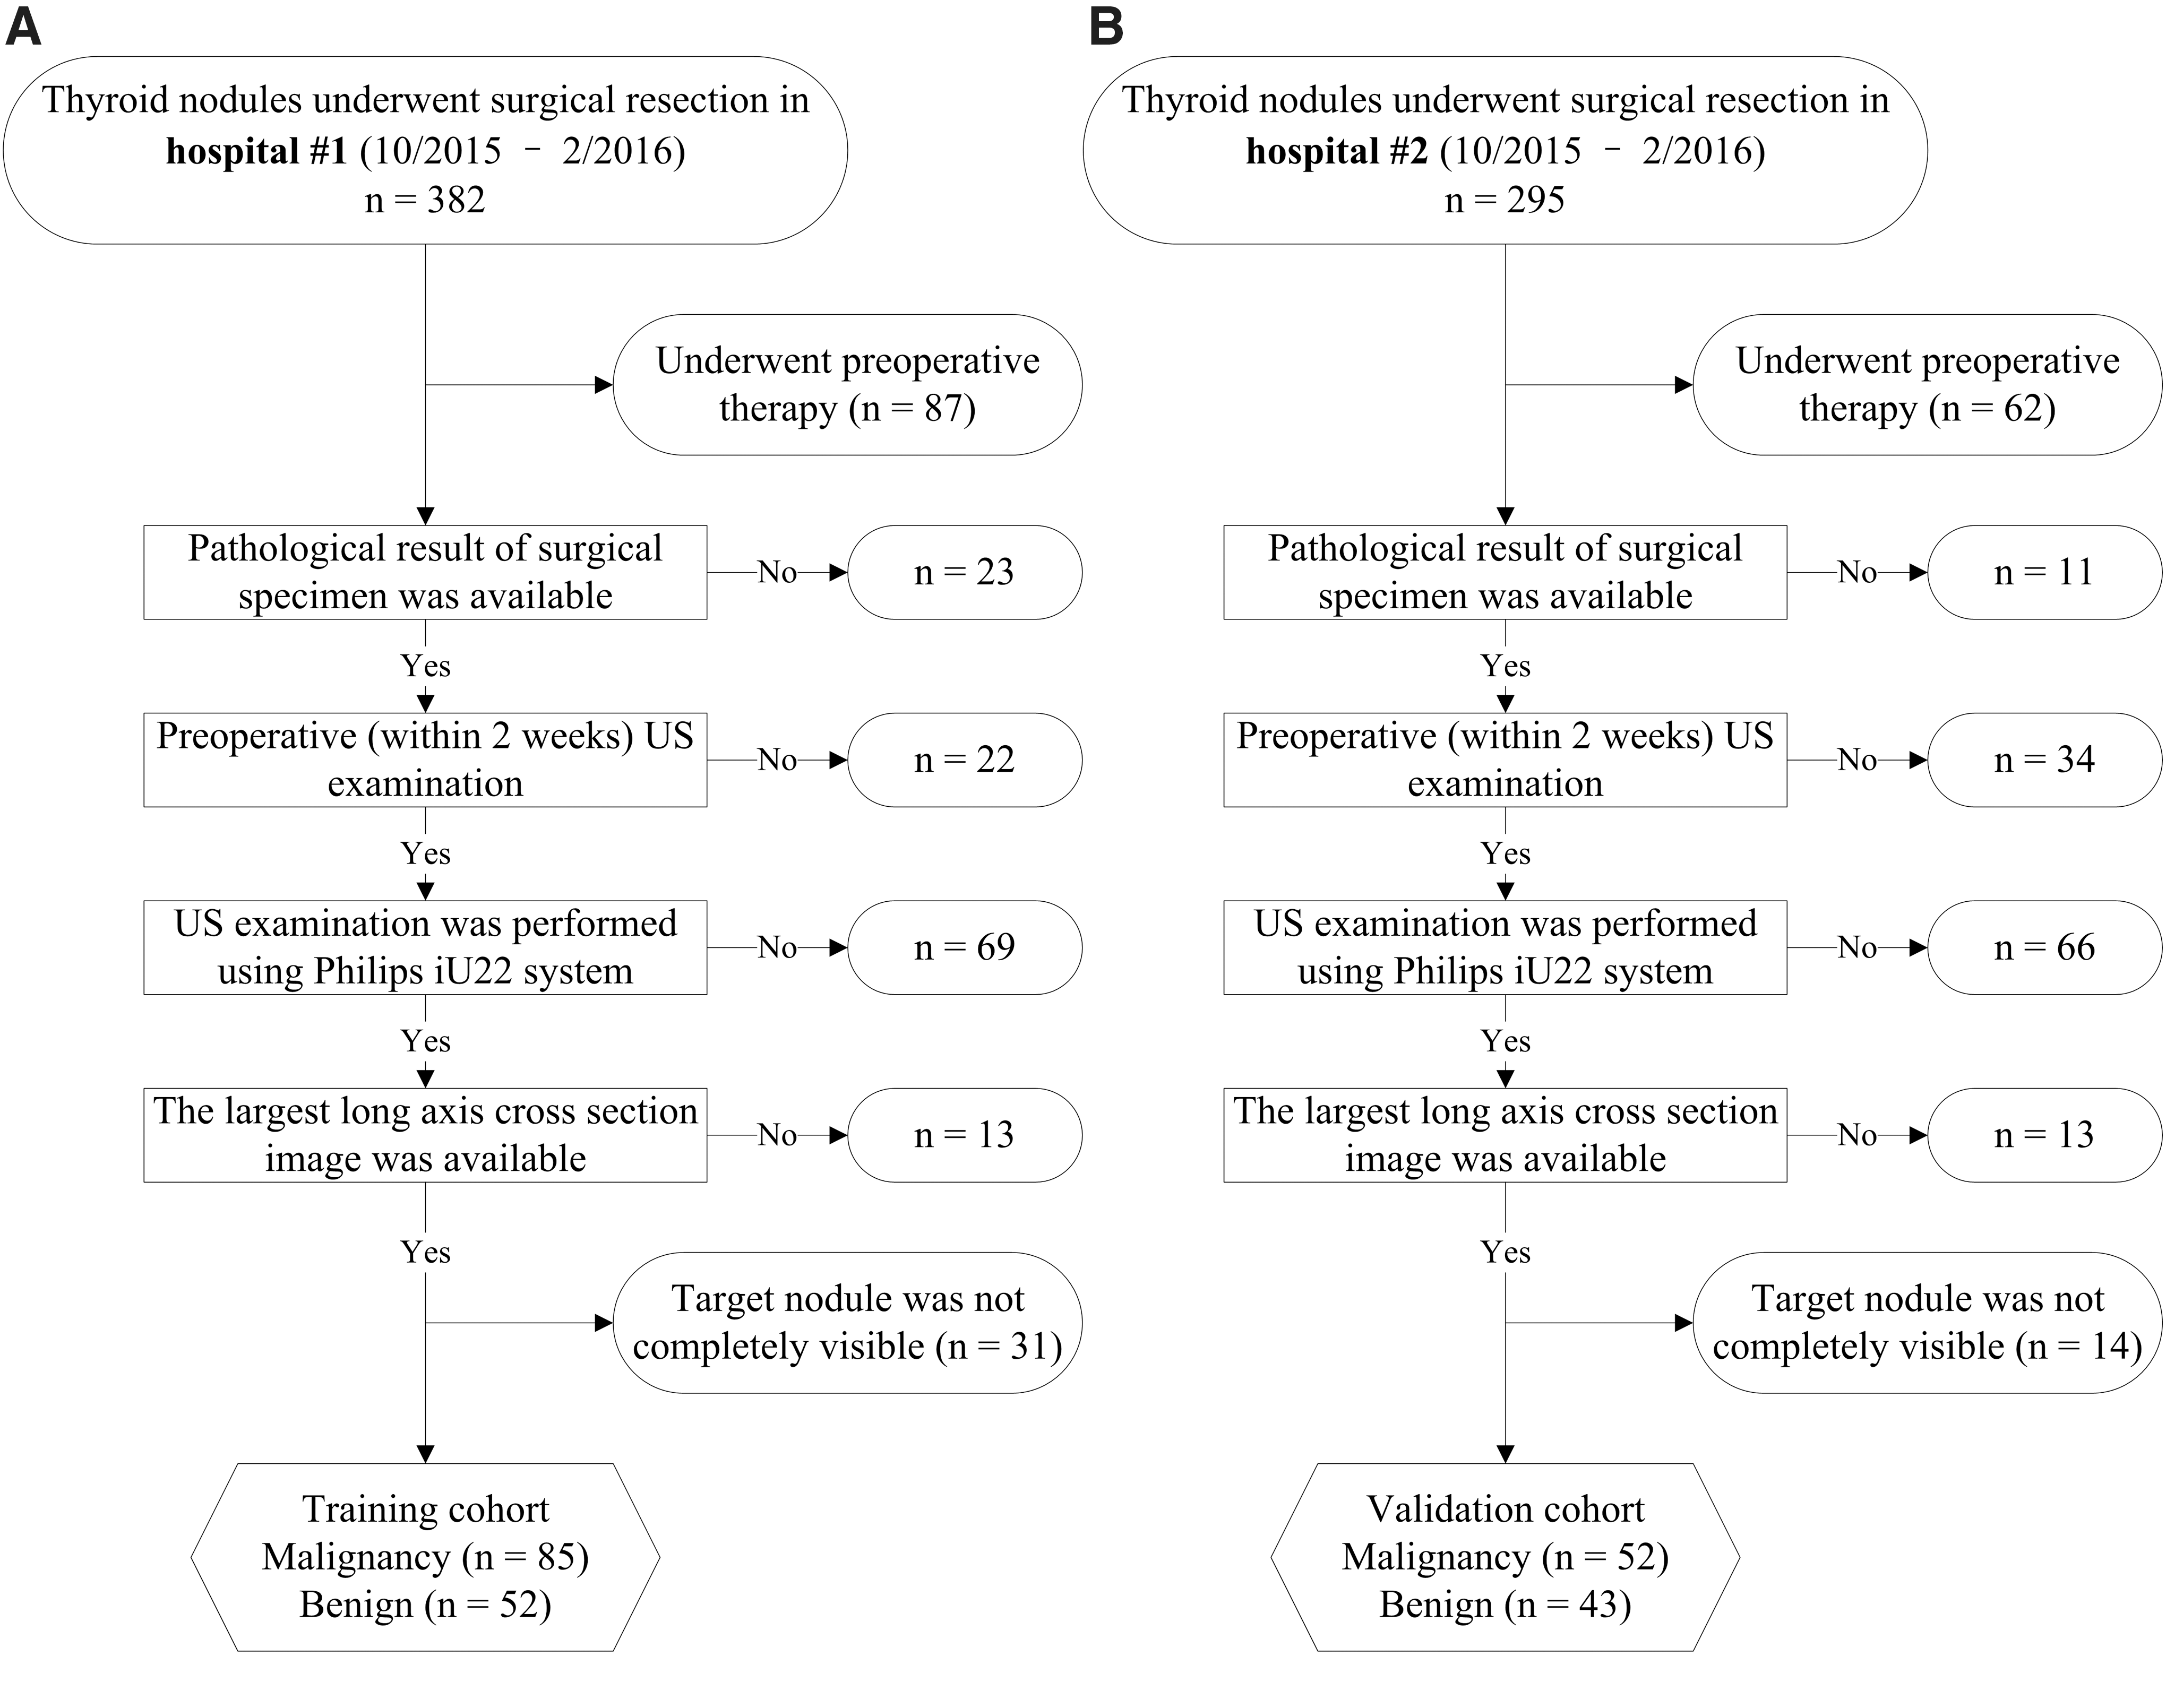
Standards for Reporting of Diagnostic Accuracydiagram for the study population. (
US examinations
In our study, US examinations were performed using the same Philips iU22 system and linear array transducer. Imaging parameters were adjusted by the radiologist performing the US examination and acquiring the images. Three images for each target nodule (one largest transverse cross-section, one largest long axis cross-section, and one color-flow image on the largest long axis cross-section) were routinely recorded. More images containing important features (calcification, halo, extrathyroidal extension, etc.) were also acquired by the radiologist. All images were stored into the Picture Archiving and Communication Systems (PACS).
Image analysis
Five radiologists (J.Y.L., L.Z.L., X.W.H., H.T.H., and Y.H.L., with 10, 10, 2, 2, and 2 years of experience, respectively, in performing thyroid US examinations) who were unaware of the pathological results analyzed the images. The location and boundary of each nodule in the largest long axis cross-section were confirmed by all radiologists in consensus. The radiomics score and the ACR scores were then analyzed and recorded.
Radiomics score
We built a formula to calculate a radiomics score for each nodule using the radiomics method. One radiologist (Y.H.L., with 2 years of experience in performing thyroid US examinations) delineated the region of interest (ROI) around the tumor outline (Fig. 2) using the AK software (Artificial Intelligence Kit, version 1.1, GE Healthcare, Little Chalfont, UK). For each nodule, only the gray image in the largest long axis cross-section was selected to delineate the ROI. Then, features were extracted from the ROI through computing algorithms. Least absolute shrinkage and selection operator (LASSO) regression was performed to select features (15). Finally, the radiomics score formula was built using the selected features. Supplementary Appendix S1 (Supplementary Data are available online at

Examples of delineating regions of interest (ROIs) on ultrasound images. The gray image (
ACR score
We also evaluated each nodule with the ACR TI-RADS (2017 edition) scoring criteria and assigned an ACR score (7). Figure 3 shows the flow chart of the scoring criteria. Each nodule was scored according to five lexicon categories (composition, echogenicity, shape, margin, and echogenic foci) as shown in the first row in Figure 3. For each category, different features were assigned with different scores. Annotation for each feature was detailed in the middle row in Figure 3. The scores were recorded for each nodule according to the five lexicon categories, respectively. The corresponding sums of scores reflect the ACR scores of the nodules.
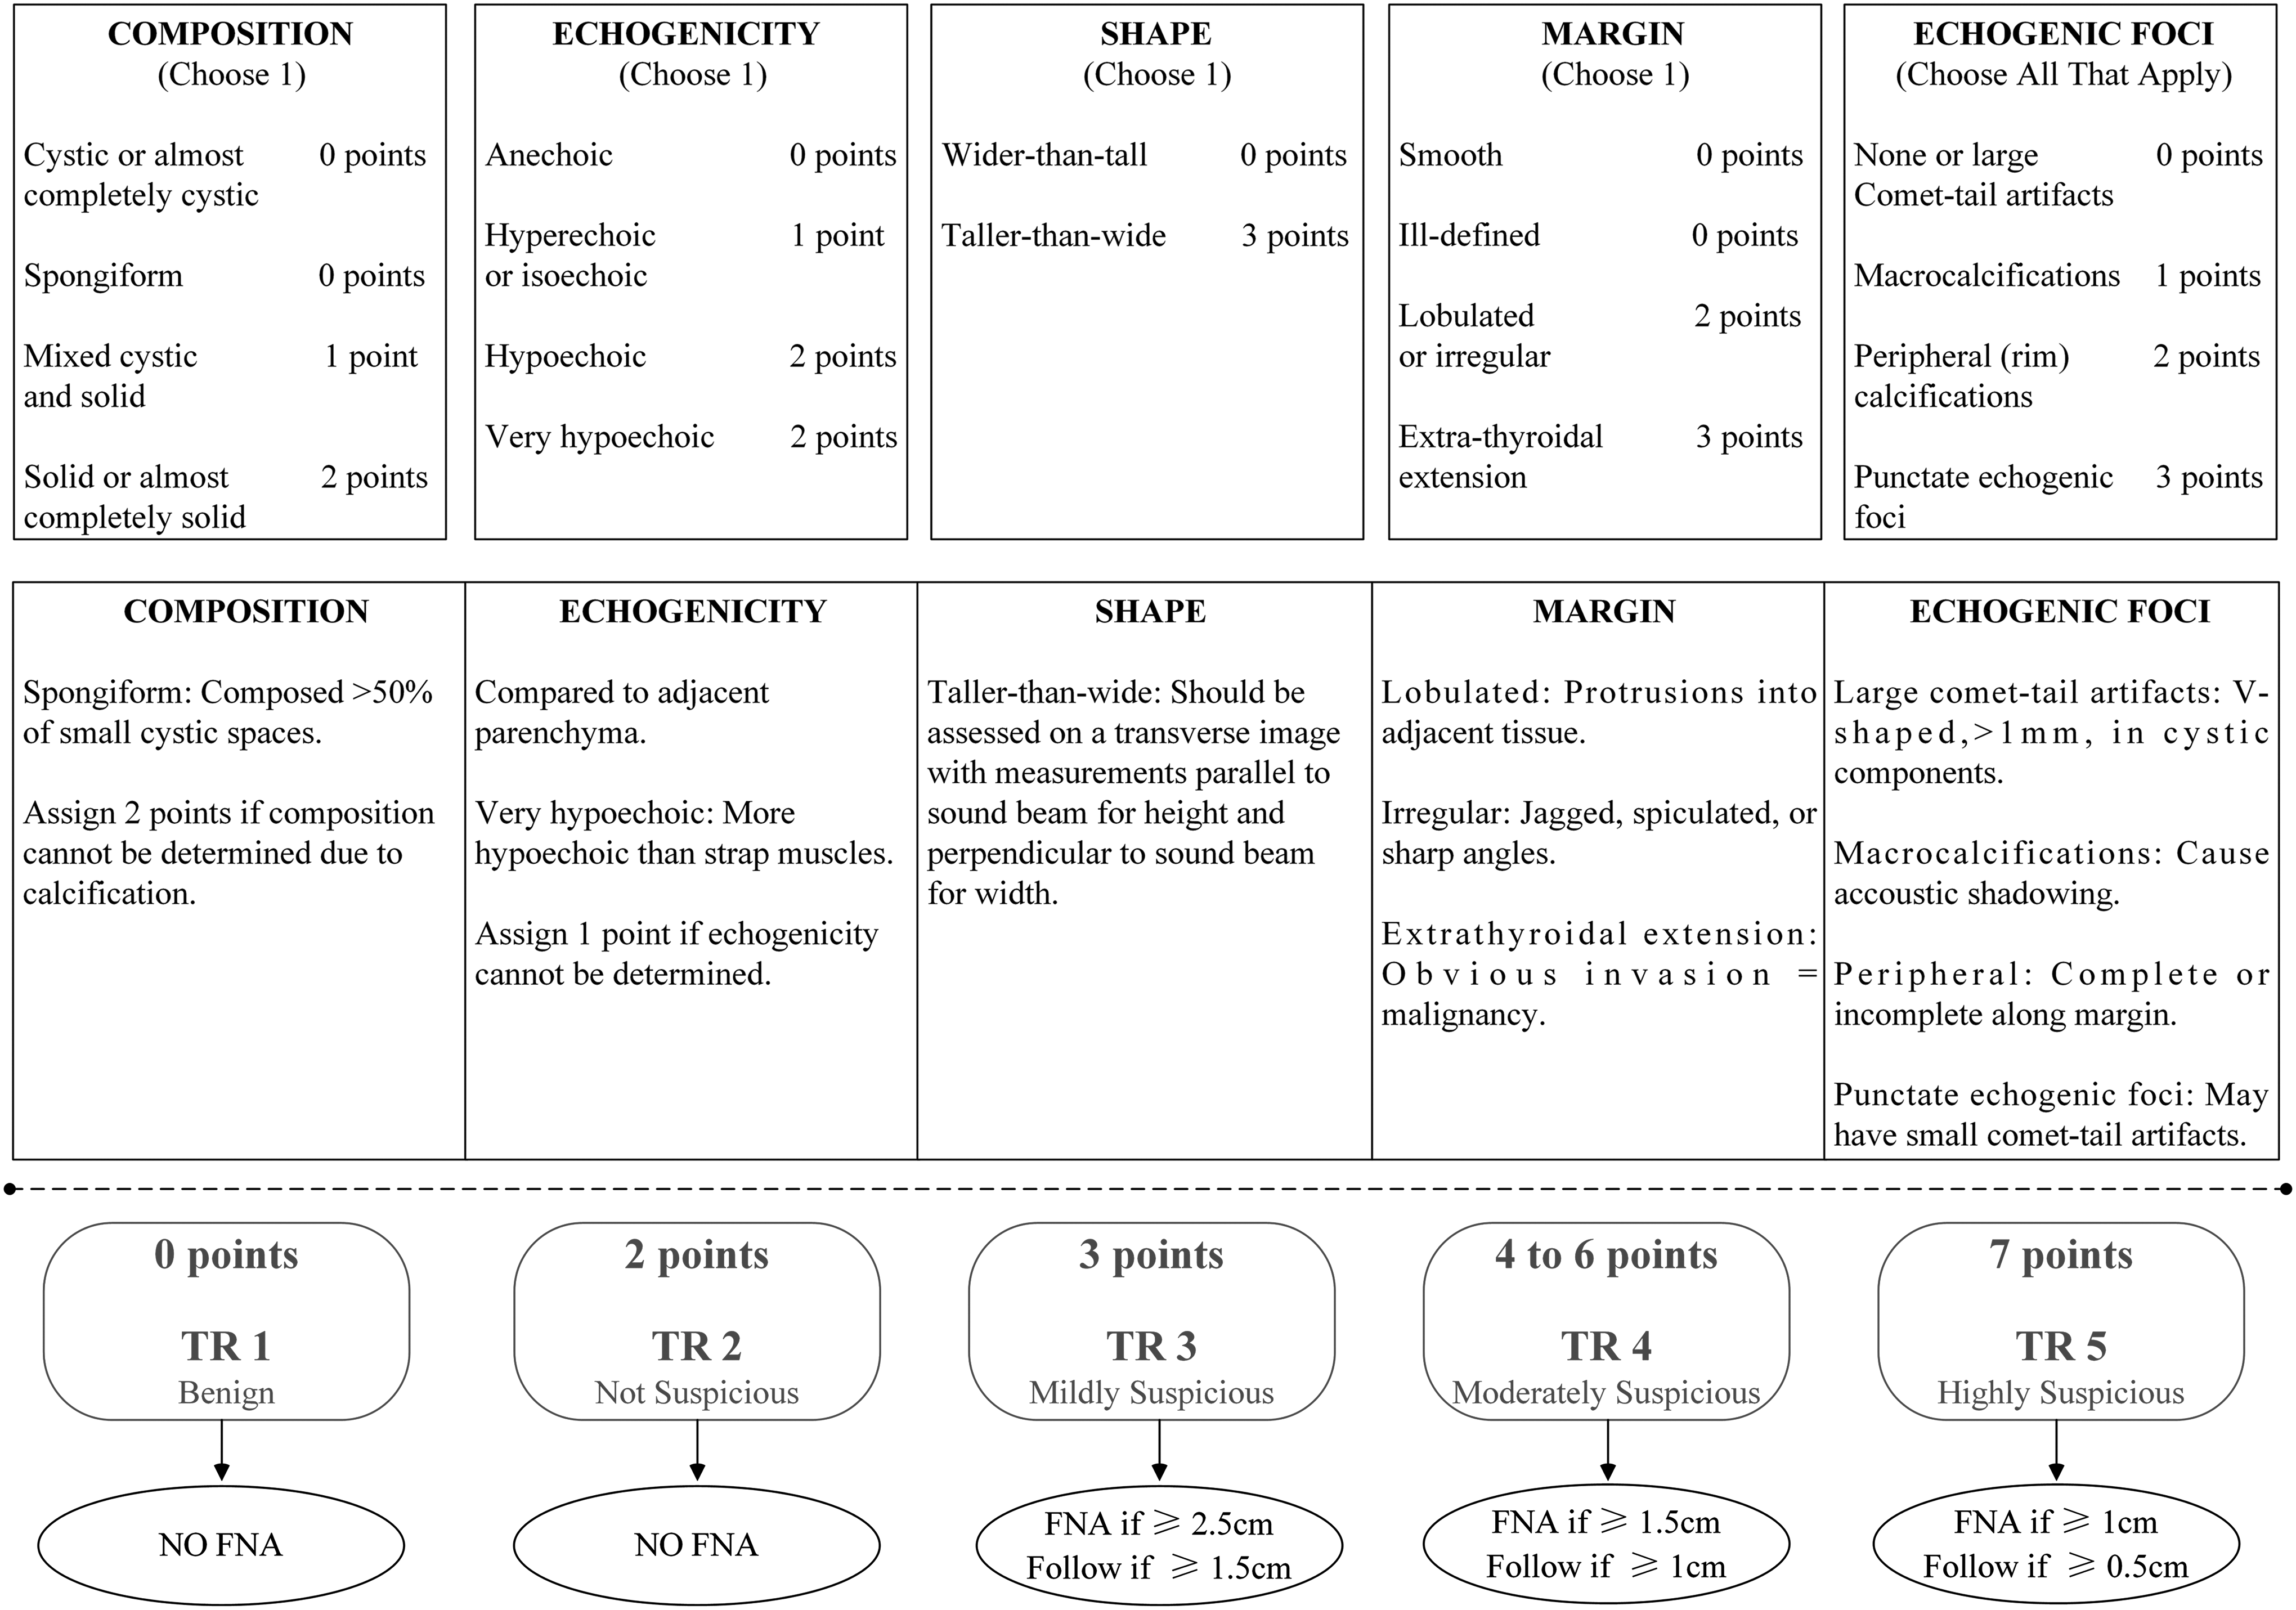
Chart showing five categories on the basis of the ACR Thyroid Imaging, Reporting and Data System (TI-RADS) lexicon, TR levels (ACR TI-RADS levels), and criteria for fine-needle aspiration or follow-up in the ultrasound. Explanatory notes appear at the bottom. (The figure is plotted according to Tessler et al. [7].)
In our daily routine workflow, operators store different cross-sectional static images of nodules in the PACS, but no dynamic series. Therefore, in this retrospective study, the ACR score was based on the existing images in the system rather than real time US. Four radiologists (J.Y.L., L.Z.L., X.W.H., and H.T.H., with 10, 10, 2, and 2 years of experience, respectively, in performing thyroid US examinations) assessed all 232 nodules according to the ACR TI-RADS scoring criteria. The four radiologists were blinded to the other evaluations and to the outcomes (referred to as ACR-Score1 for J.Y.L., ACR-Score2 for L.Z.L., ACR-Score3 for X.W.H., and ACR-Score4 for H.T.H.).
Statistical analysis
Statistical analysis was conducted with IBM SPSS 22.0 for Windows (IBM Corp, Armonk, New York) and R software (version 3.4.1; The R Foundation). SPSS was used to compare the variables between different cohorts. R software was used for building and evaluating the prediction models. p-Values of less than 0.05 (two-sided) were considered statistically significant. Supplementary Appendix S2 presents the detailed application of the SPSS and R software.
Prediction model building. Univariate logistic regression was applied in the training cohort to analyze the predictors for malignancy. The prediction model was built using the following univariate logistic equation: logit π = β0 + β1 × X, where X is the predictor, β1 is the regression coefficient of the predictor, β0 is the intercept, and π is the probability of malignancy of the nodule.
Performance of prediction model. The performance of the prediction model was evaluated with discrimination, calibration, and clinical application.
Discrimination
Receiver Operating Curves (ROC) were plotted to show the performance of the radiomics score, ACR-Score1, ACR-Score2, ACR-Score3 and ACR-Score4 in discriminating malignant from benign nodules in the training and validation cohorts. Discrimination was quantified with area under the curve (AUC) analysis. The optimal cutoff of the radiomics score calculated from the training cohort was applied in the validation cohort. Bar diagrams were plotted to intuitively display the discrimination performance of the radiomics score.
Calibration
Calibrations (i.e., the agreement between observed outcome frequencies and predicted probabilities) were plotted to explore the predictive accuracy of the models in the validation cohort. The unreliability (U) statistic was used to assess the calibration, and p values of more than 0.05 were considered well-calibrated (16). Average (E average [E aver]) and maximal errors (E maximal [E max]) between predictions and observations were obtained from calibration curves (16).
Clinical application
Decision curve analysis (DCA) was conducted to determine the clinical usefulness of the prediction models by quantifying the net benefits at different threshold probabilities in the validation cohort (17).
Results
Patient characteristics and thyroid nodules
The baseline information of the enrolled nodules in the training and validation cohorts is shown in Table 1. There was no significant difference between the training and validation cohorts for the frequency of malignant lesions [62.0% (85/137) vs. 54.7% (52/95), p = 0.27]. In addition, there were no significant differences between the two cohorts in sex, age, location, and diameter of nodules. We also investigated the above basic information between the malignant and benign nodules in the training and validation cohorts, respectively. Details are displayed in Table 2 and Supplementary Table A1. More details about the characteristics of the malignant nodules are shown in Supplementary Table A1.
p-Value reflects the differences between the training and validation cohorts.
Data in parentheses represents interquartile ranges.
ACR, American College of Radiology; FTC, follicular thyroid cancer; MTC, medullary thyroid cancer; PTC, papillary thyroid cancer;
p-Value reflects the differences between malignant and benign nodules.
Data in parentheses represents interquartile ranges.
Prediction models based on radiomics and ACR TI-RADS
Based on the training cohort, 1044 extracted features were reduced to 19 potential predictors using the LASSO regression model (Fig. 4). These 19 features were presented in the radiomics score formula (Supplementary Appendix S3). The radiomics score for each nodule in the training and validation cohorts was calculated using this formula. Distributions of the radiomics score and the 4 ACR-Scores for the malignant and benign nodules in the training and validation cohorts are shown in Table 2. Malignant nodules had significantly higher scores (p < 0.001).
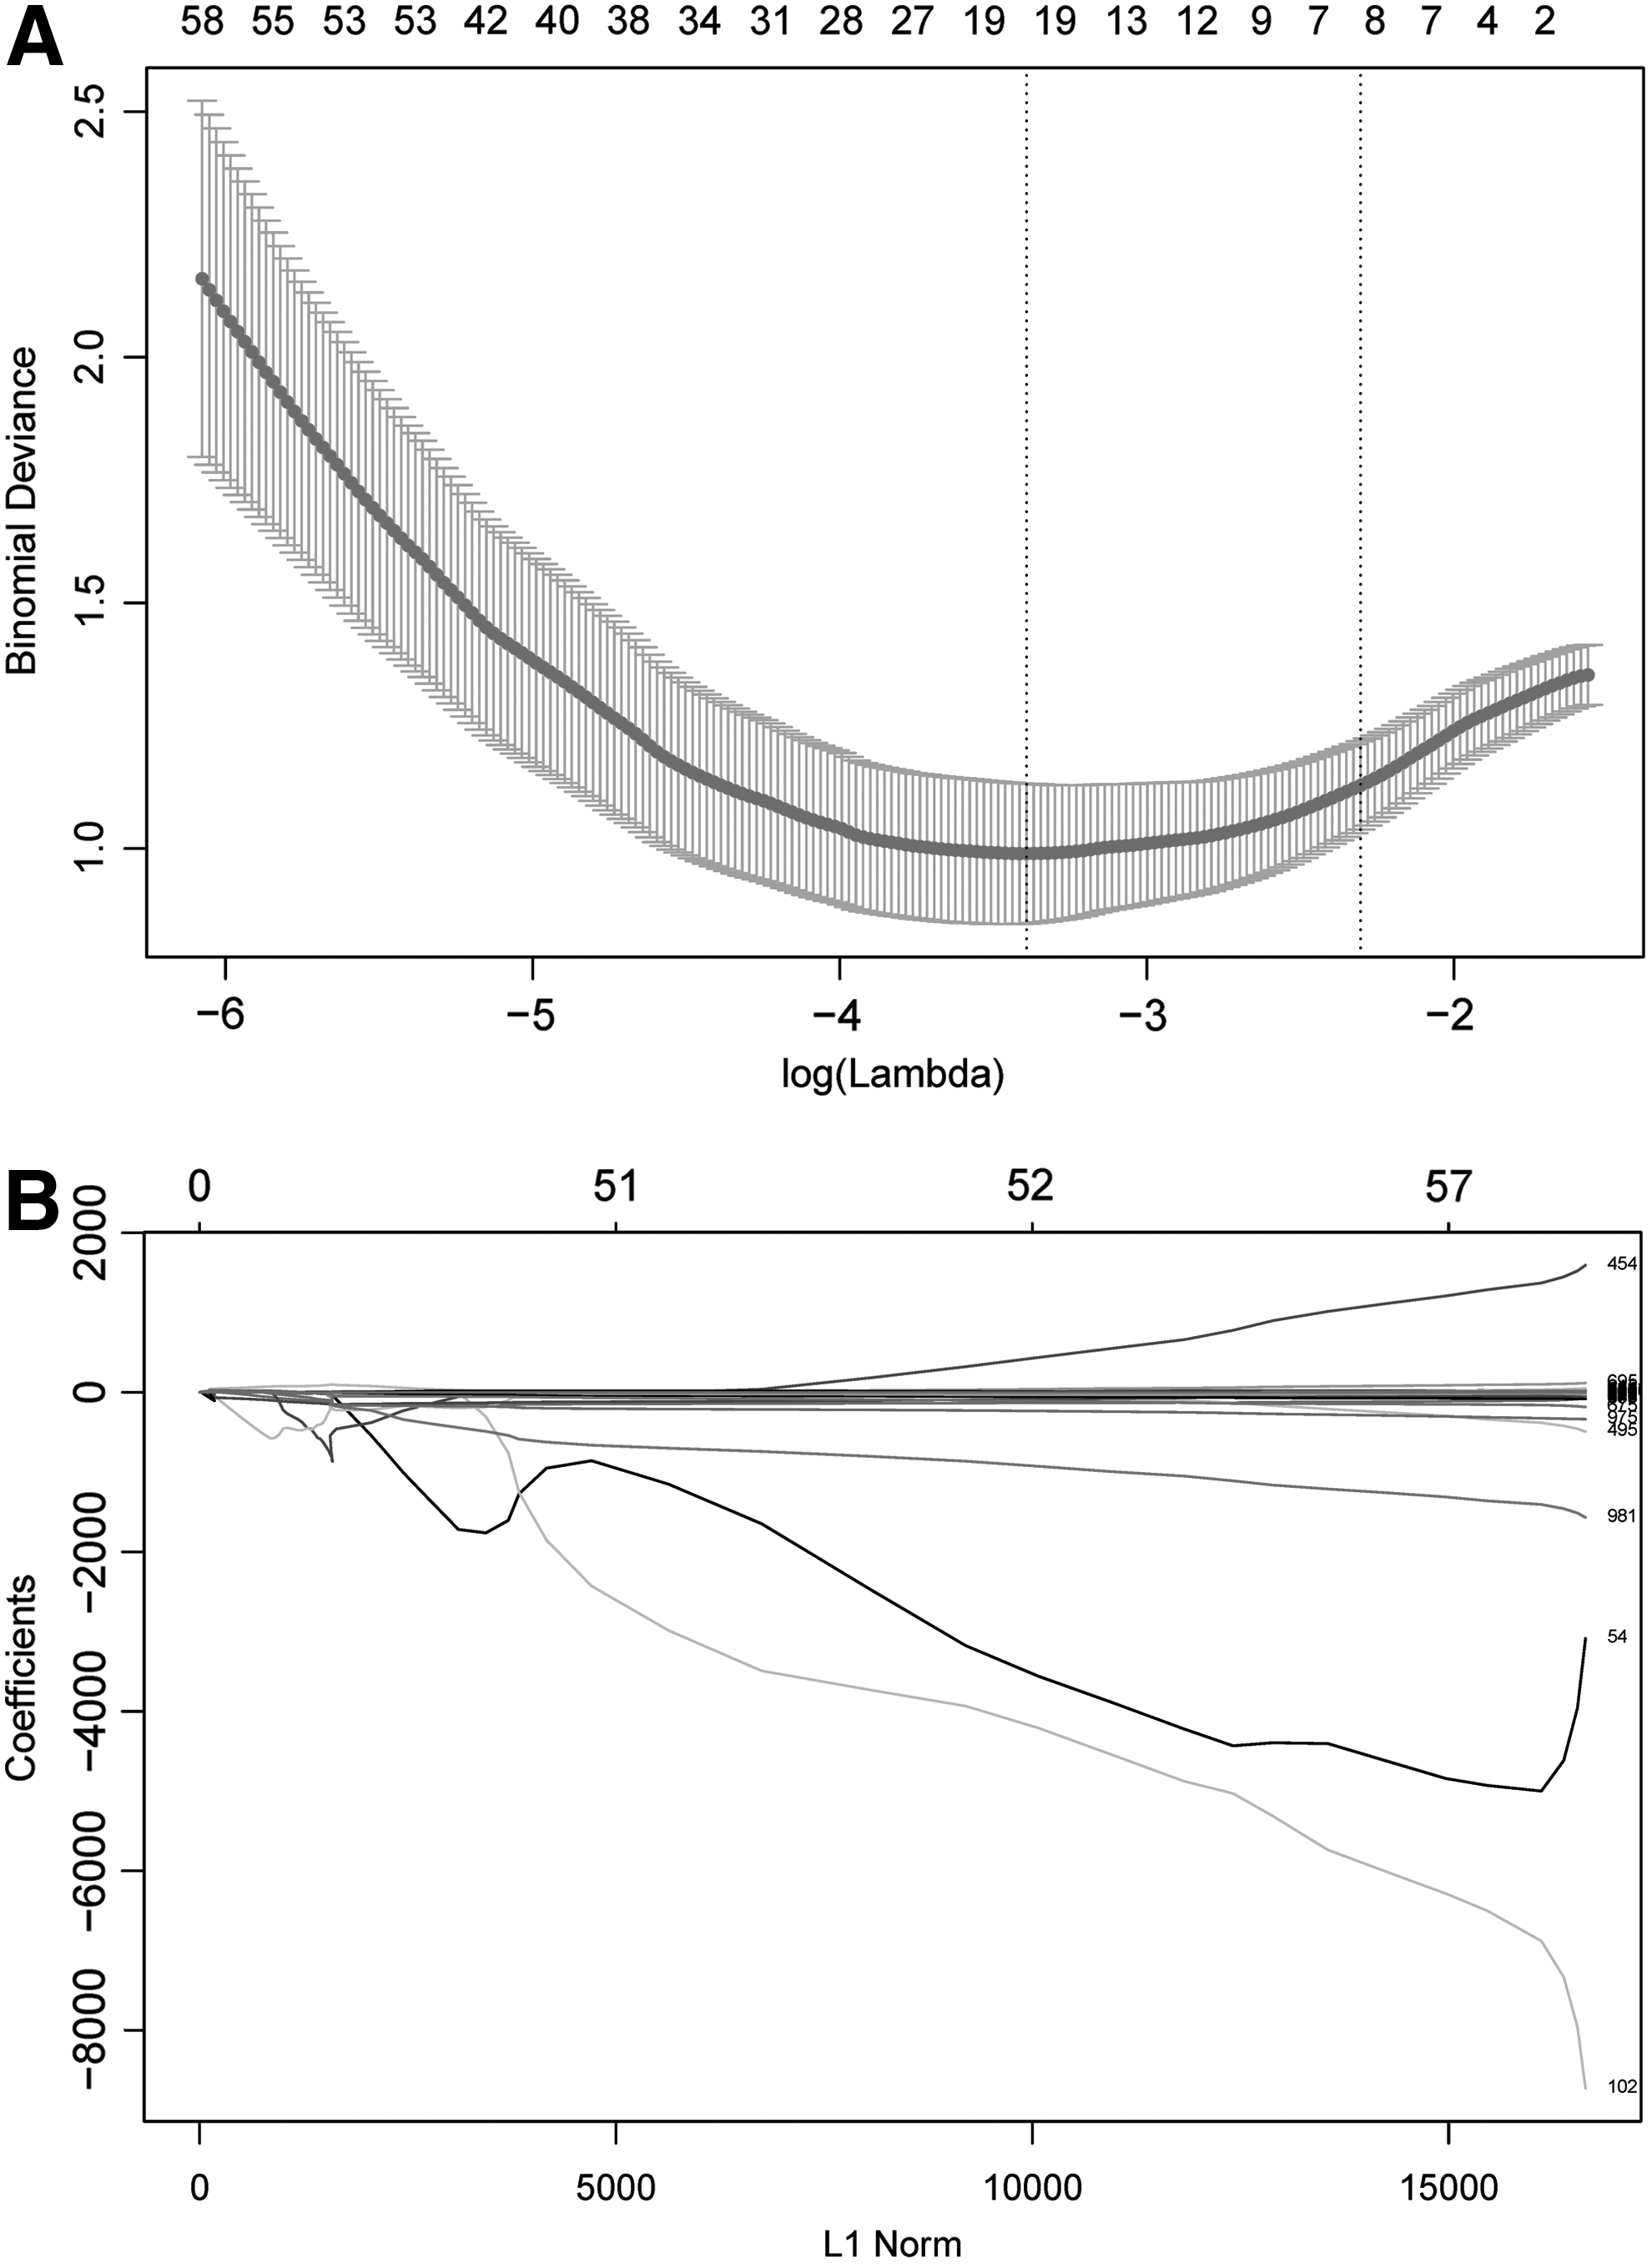
Ultrasound image feature selection using the least absolute shrinkage and selection operator (LASSO) logistic regression model in the training cohort. (
Table 3 shows the results of univariate logistic regression analysis for nodule malignancy in the training cohort. Radiomics scores and the 4 ACR-Scores were predictors for nodule malignancy (all p < 0.001). Then, prediction models based on the radiomics scores and the ACR-Scores were built respectively using the following univariate logistic regression equations:
β0, intercept univariate logistic regression, β1, regression coefficient of the predictor; CI, 95% confidence interval.
Radiomics score model: logit πradiomics score = −0.34 + 1.95 × radiomics score
ACR-Score1 model: logit πACR-Score1 = −2.92 + 0.62 × ACR-Score1
ACR-Score2 model: logit πACR-Score2 = −3.00 + 0.59 × ACR-Score2
ACR-Score3 model: logit πACR-Score3 = −2.69 + 0.60 × ACR-Score3
ACR-Score4 model: logit πACR-Score4 = −2.54 + 0.58 × ACR-Score4
Where πradiomics score, πACR-Score1, πACR-Score2, πACR-Score3 and πACR-Score4 are the predicted probability of nodule malignancy based on the radiomics score, ACR-Score1, ACR-Score2, ACR-Score3, and ACR-Score4, respectively.
Evaluating performance of prediction models
Discrimination
ROC curves of the radiomics score, ACR-Score1, ACR-Score2, ACR-Score3, and ACR-Score4 were plotted to show the performance of discriminating malignancy from benign nodules in the training (Fig. 5A) and validation (Fig. 5B) cohorts. Values of AUC were measured to quantify the discrimination performance of the radiomics score and the 4 ACR-Scores (Table 4). The radiomics score yielded an AUC of 0.921 [95% CI 0.877–0.965) in the training cohort and 0.931 [CI 0.884–0.977) in the validation cohort. There were no significant differences between the AUCs of the radiomics score and the ACR-Score1 or ACR-Score2 in the training cohort (p = 0.148 and p = 0.079, respectively), which was also confirmed in the validation cohort (p = 0.384 and p = 0.432, respectively). However, the AUC of the radiomics score was significantly higher than that of ACR-Score3 (p = 0.015) or ACR-Score4 (p = 0.007) in the training cohort, which was also confirmed in the validation cohort (p = 0.017 and p < 0.001, respectively). The ROC analysis revealed that the optimal cutoff value of the radiomics score discriminating malignant from benign nodules was 0.36 in the training cohort. We used this cutoff value to plot radiomics score bar diagrams in the training (Fig. 6A) and validation (Fig. 6B) cohorts. The bar diagrams demonstrate the outstanding discrimination performance of the radiomics score.
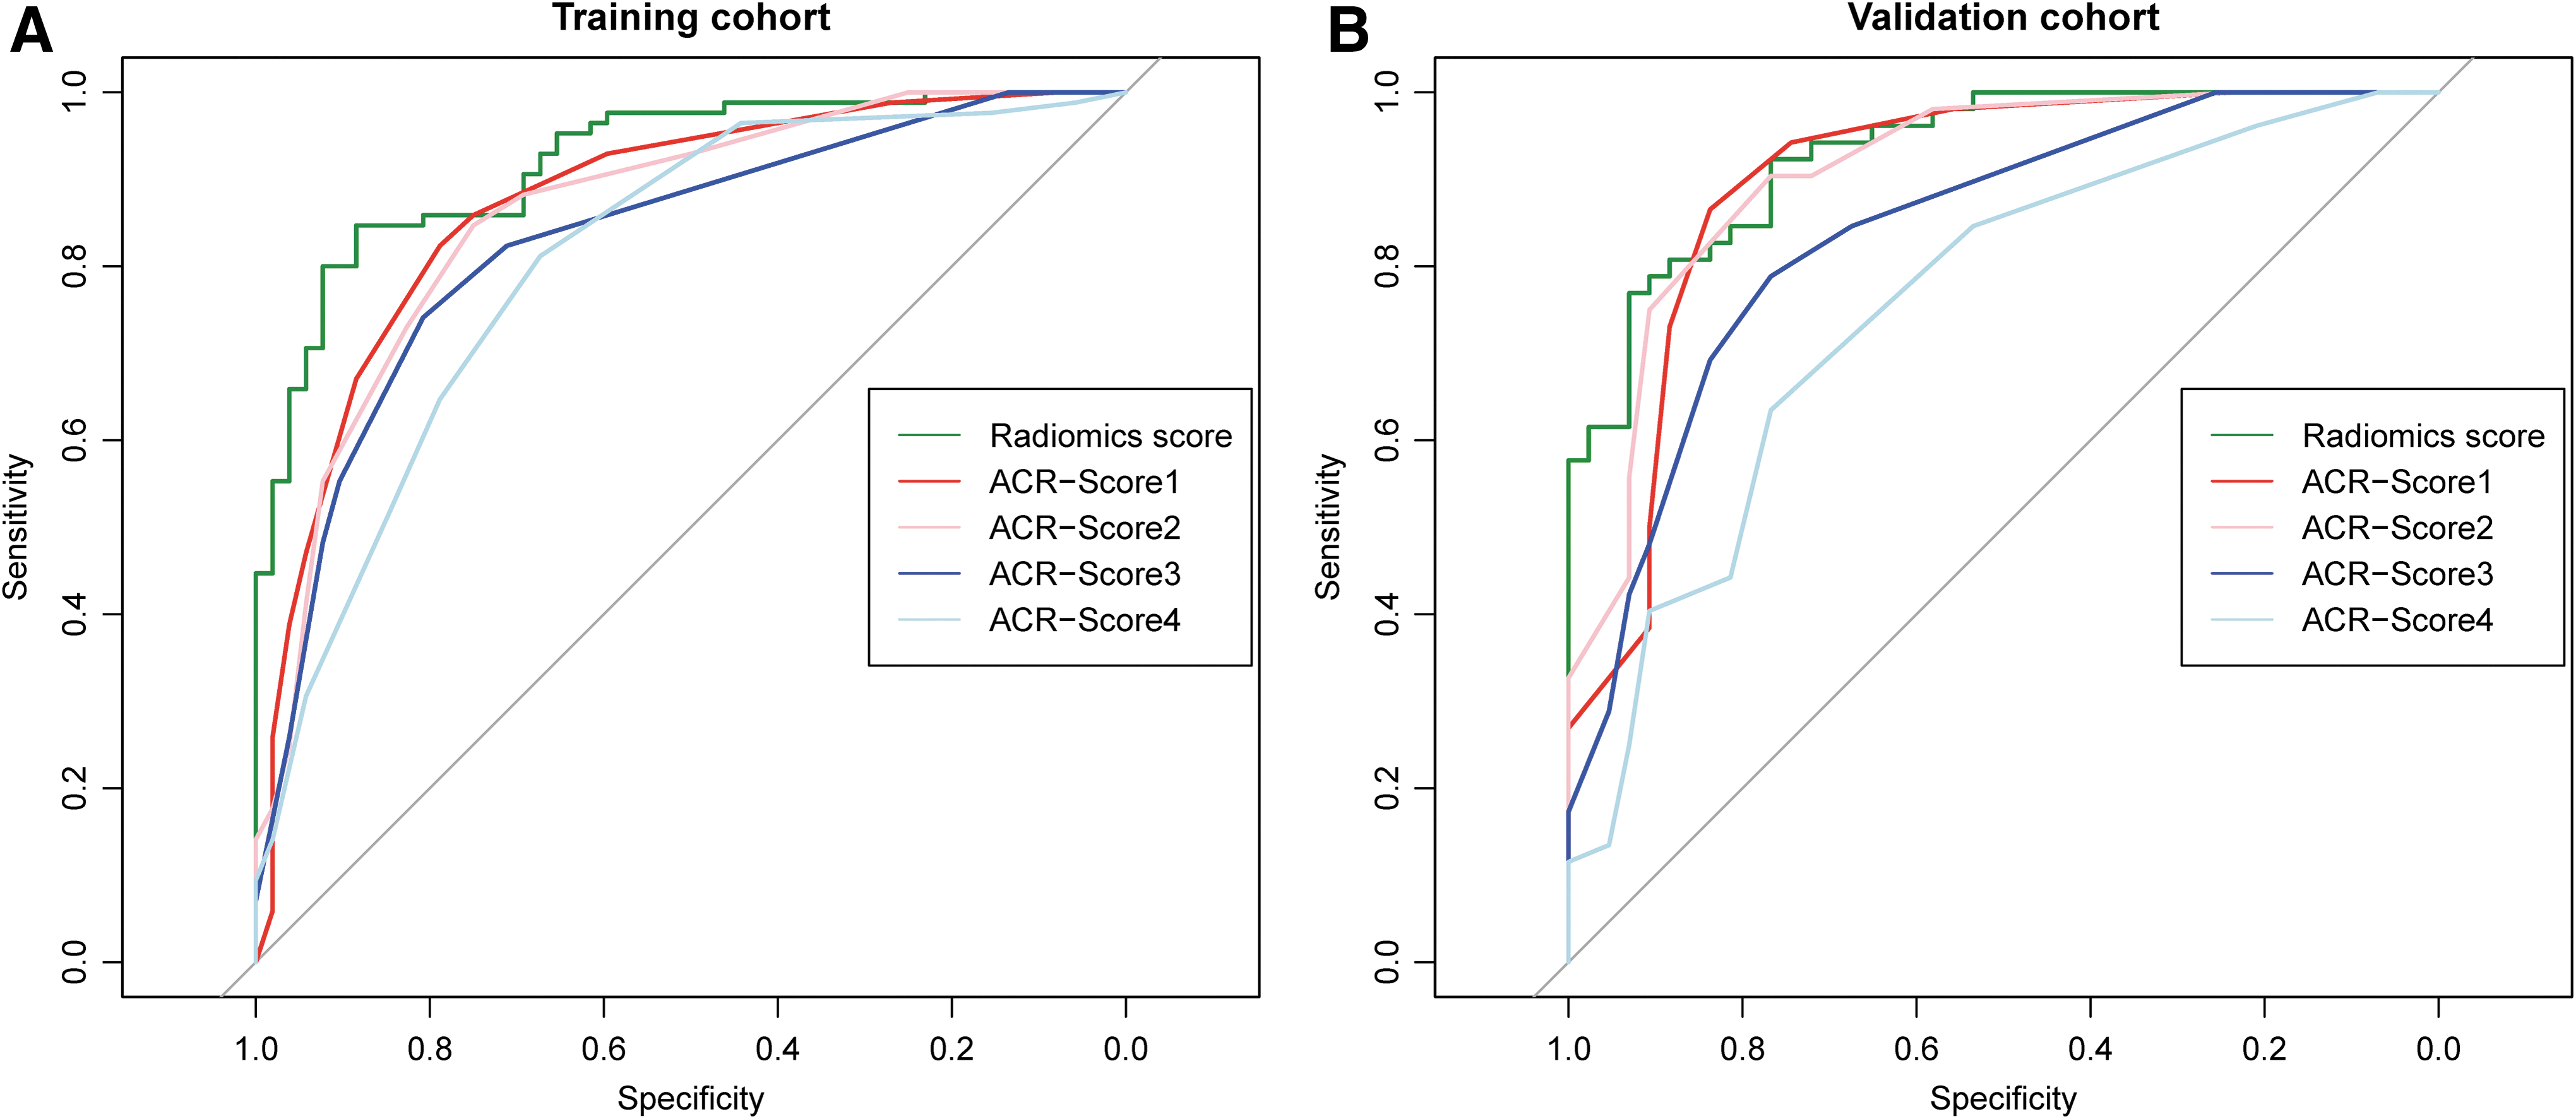
Receiver operating characteristic curves of the radiomics score (green lines), ACR-Score1 (red lines), ACR-Score2 (pink lines), ACR-Score3 (blue lines), and ACR-Score4 (light blue lines) in the training (
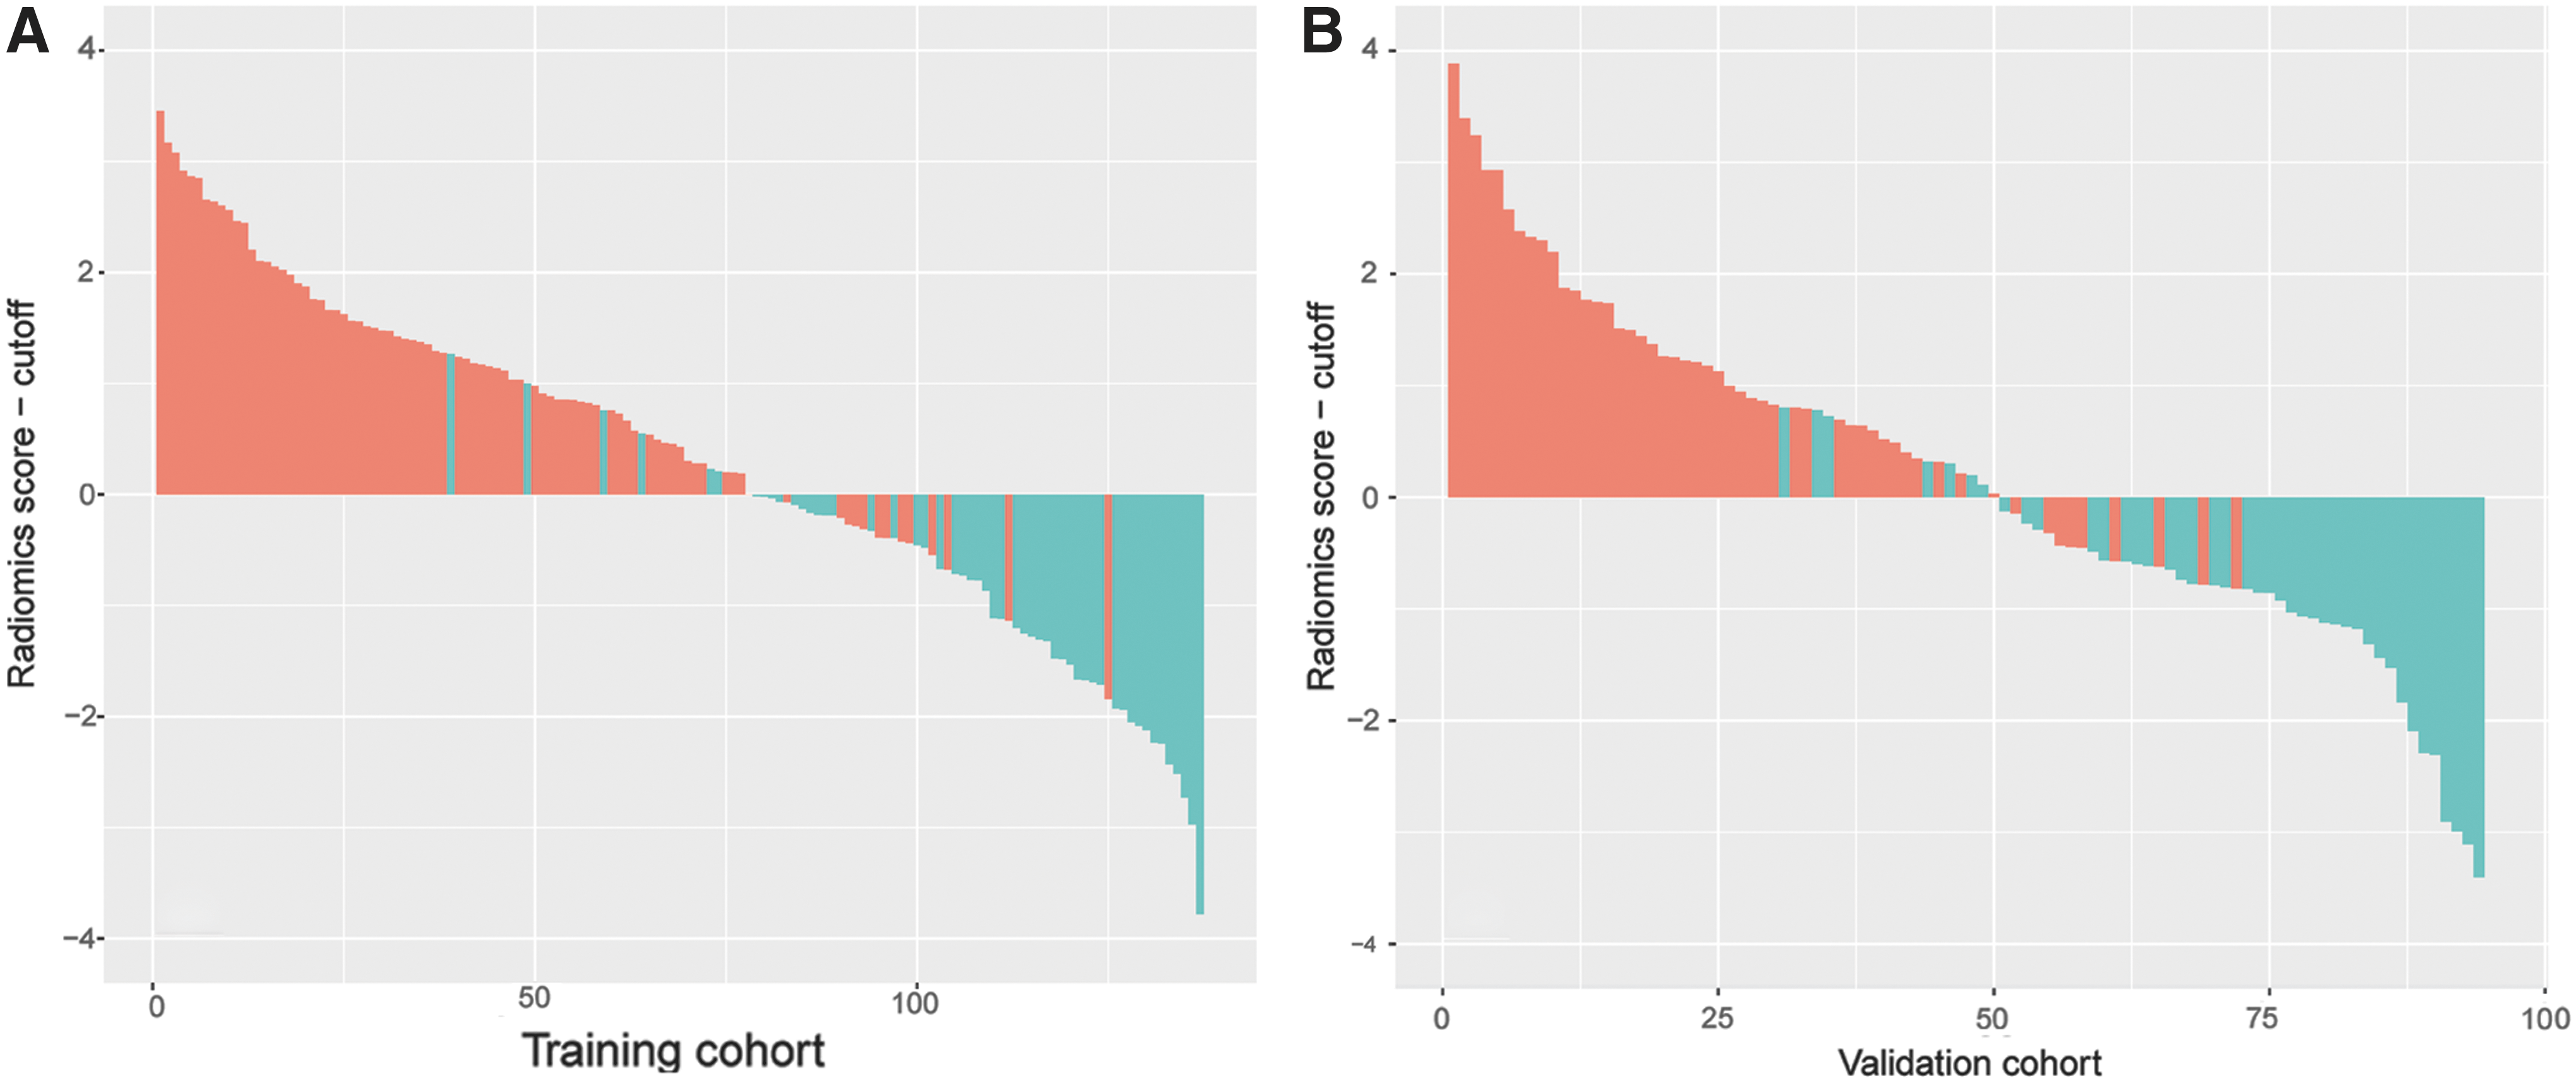
Bar diagrams in training (
p-Value reflects the differences between the radiomics score and each ACR score.
AUC, area under the curve.
Calibration
The calibration curves of the radiomics score and the four ACR-Score models applied to the validation cohort are shown in Supplementary Figure S1. To evaluate whether the prediction models were well-calibrated or not, the unreliability (U) statistics were calculated to reflect the reliability of the calibration curves (Table 5). All five models showed reliable results for the calibration curves (all p > 0.05), meaning that all models showed a good agreement between prediction and observation. We also found that the radiomics score model had minimal errors (E max = 0.073 or E aver = 0.028) as compared with the four ACR-Score models. This indicates the smallest difference in predicted and calibrated probabilities when using the radiomics score model to predict the probability of malignancy of thyroid nodules.
Calibration curve can be approximated by a regression line with intercept α and slope β. These parameters can be estimated in a logistic regression with the event as outcome and the linear predictor as the only covariate. Well-calibrated models have α = 0 and β = 1. Therefore, a sensible measure of calibration is a likelihood ratio statistic testing the null hypothesis that α = 0 and β = 1. The statistic (unreliability [U] statistic) has a χ2 distribution with 2df, and p values of more than 0.05 were considered well-calibrated. E, difference in predicted and calibrated probabilities: E max, maximal error; E aver, average error.
Clinical application
DCA for the radiomics score and the four ACR-Score models was performed in the validation cohort (Fig. 7). The decision curve showed that if the threshold probability was between 20% and 80%, using the radiomics score or any one of the ACR-Score models to predict probability for malignancy added more benefit than either the treat-all scheme (assuming all nodules are malignant) or the treat-none scheme (assuming all nodules are benign). In addition, to predict the probability of malignancy, the radiomics score model added more benefit than using the ACR-Score3 or ACR-Score4 at any given threshold probability. If the threshold probability was >70%, the radiomics score model added more benefit than that using any one of the ACR-Score models.
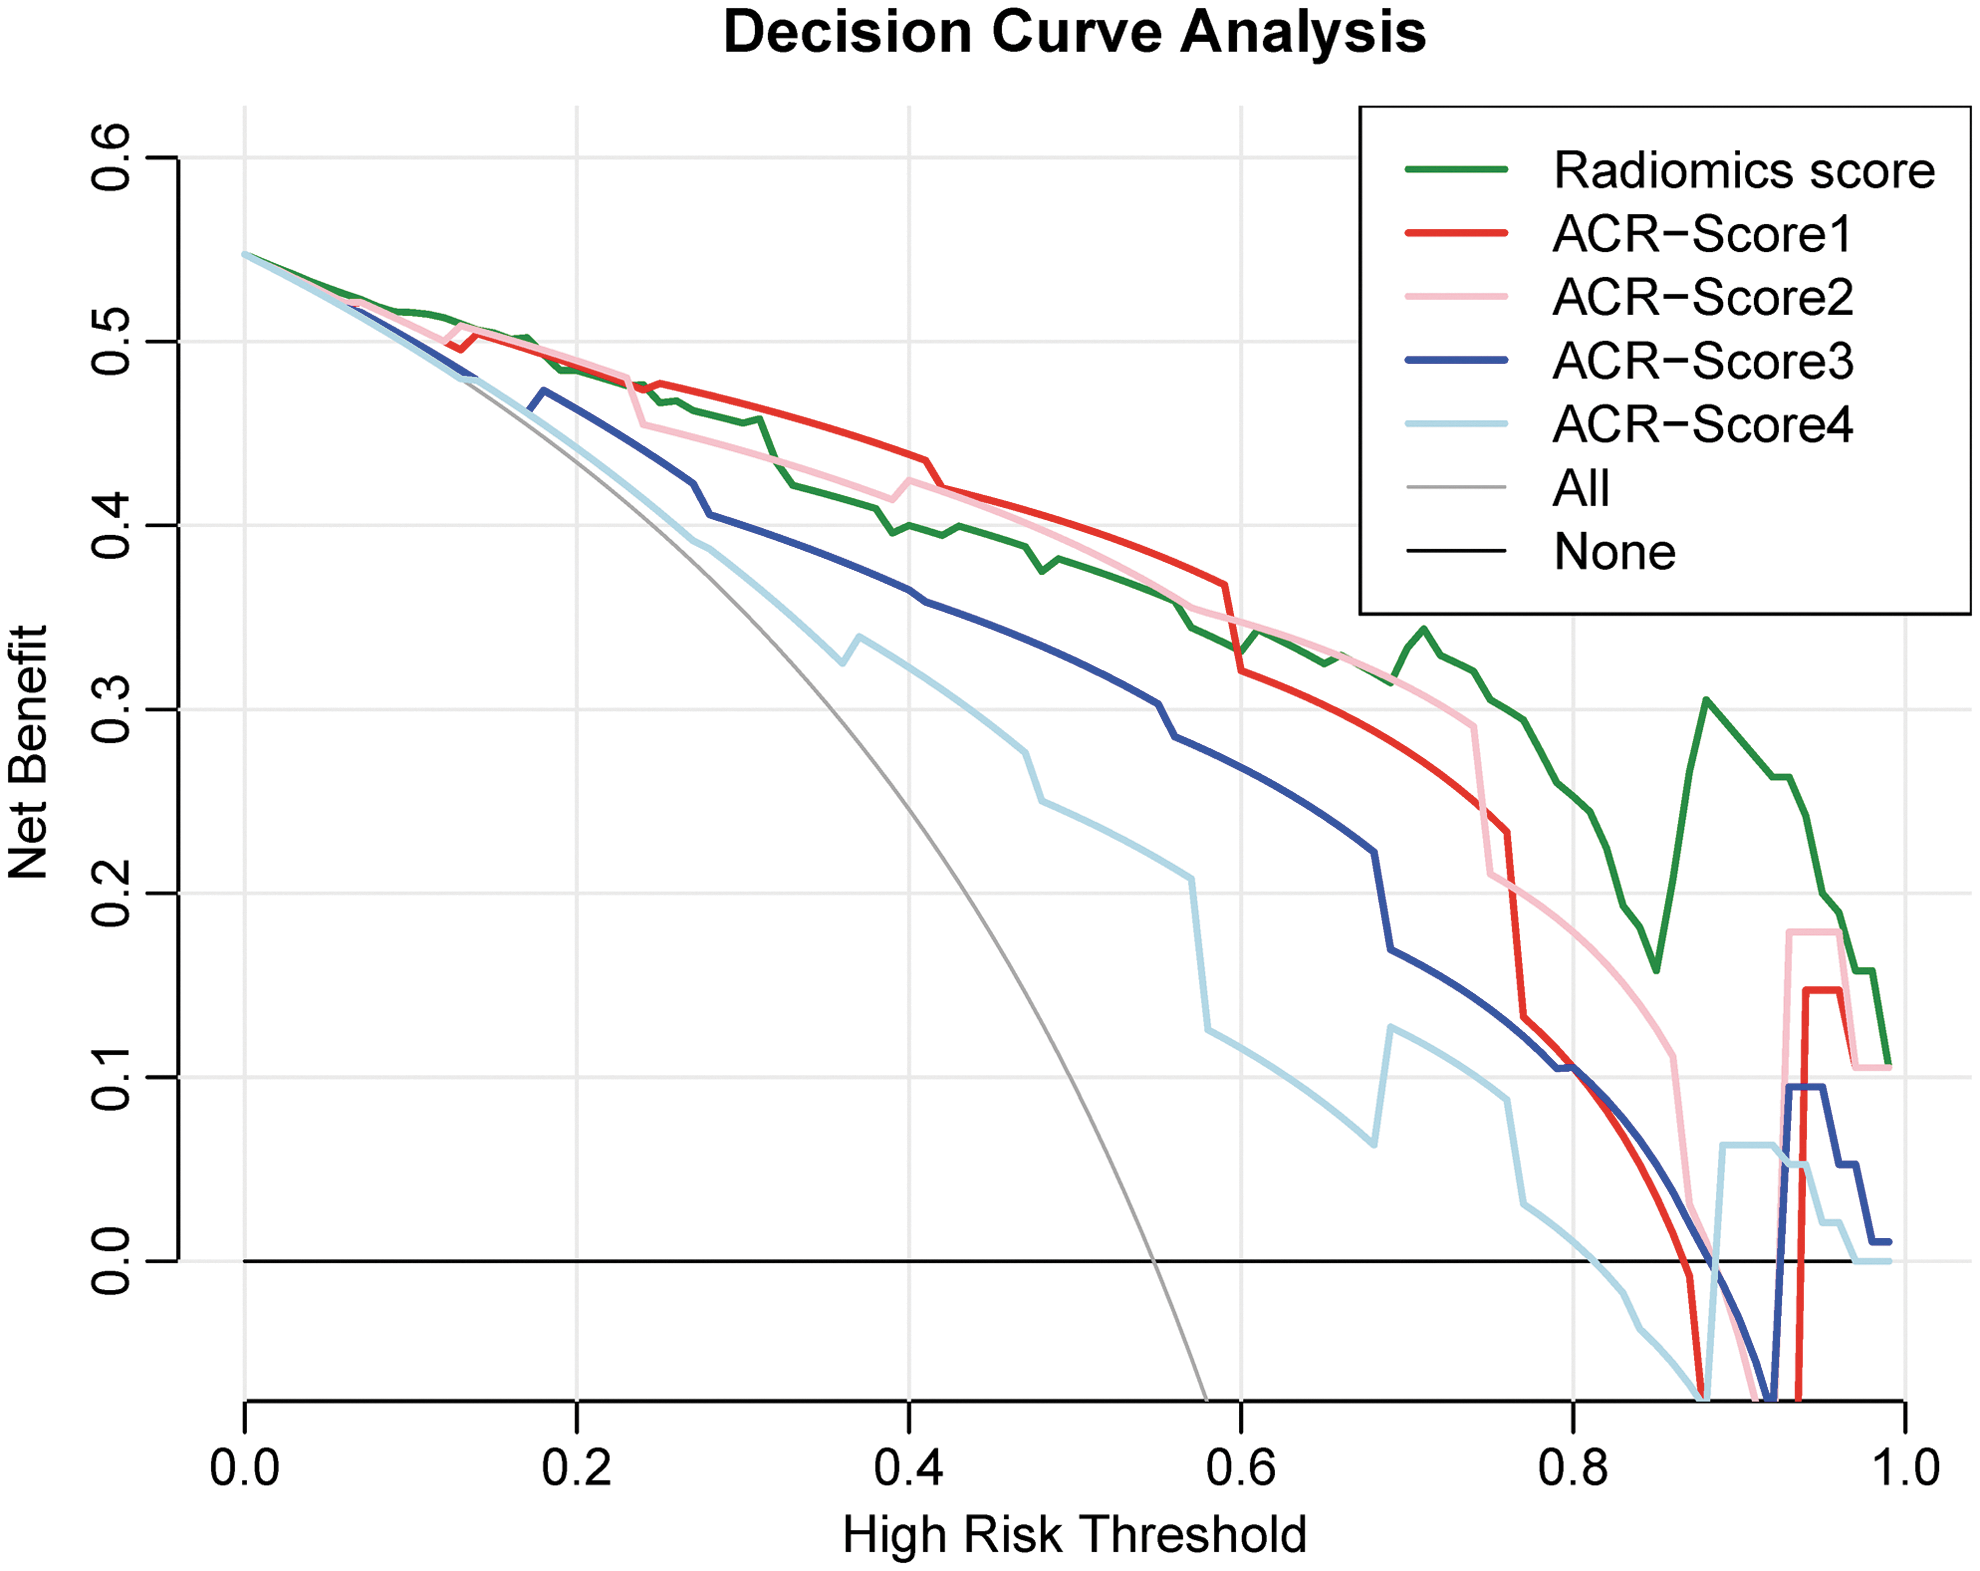
Decision curve analysis for the radiomics score (green line), ACR-Score1 (red line), ACR-Score2 (pink line), ACR-Score3 (blue line), and ACR-Score4 (light blue line) models. The y-axis measures the net benefit. The net benefit is determined by calculating the difference between the expected benefit and the expected harm associated with each proposed model [Net benefit = true positive rate − (false positive rate × weighting factor), Weighting factor = threshold probability/(1 − threshold probability)]. The gray line represents the assumption that all nodules were malignant (the treat-all scheme). The black line represents the assumption that all nodules were benign (the treat-none scheme). Using the radiomics score model to predict malignancy adds more benefit than using the ACR-Score3 model or the ACR-Score4 model at any given threshold probability. If the threshold probability is >70%, using the radiomics score model to predict malignant probability adds more benefit than using any one of the ACR-Score models.
Discussion
In our study, we developed a radiomics score model to predict the malignancy of thyroid nodules. The performance of this model was validated in an external validation cohort with respect to discrimination, calibration, and clinical application. The radiomics model was superior to ACR TI-RADS scored by junior radiologists.
In the present study, the AK software was used to extract imaging features of each thyroid nodule. A total of 1044 features were extracted for each image. For calculation of the radiomics score, 1044 features were reduced to 19 potential predictors by LASSO regression. This method is generally used in radiomics, which allows the high-throughput extraction of informative imaging features to quantify differences in intratumor heterogeneity and phenotype (8 –11). Then, a formula was built to calculate a final radiomics score for each nodule. The radiomics score demonstrated outstanding discrimination in both the training (AUC 0.921; [CI 0.877–0.965]) and validation (AUC 0.931; [CI 0.884–0.977]) cohorts. The high AUC suggested that the radiomics score was a potential marker to discriminate malignancy from benign nodules. In addition, the ACR TI-RADS scoring criteria were compared with radiomics scores. In our study, ACR-Score1, ACR-Score2, ACR-Score3, and ACR-Score4 were calculated respectively by radiologists who had 10, 10, 2, and 2 years of experience in thyroid US. However, only the scores from the junior radiologists were significantly inferior in performance compared with the radiomics score (Table 4). Therefore, the radiomics score model we developed may particularly improve the ability of discrimination for junior radiologists in predicting malignancy of thyroid nodules.
Prior studies have reported models incorporated US and clinical characteristics for prediction of thyroid malignancy (18,19). Maia et al. developed a prediction model that incorporated characteristics of age, border irregularity, microcalcifications, and nodule size (18). The model showed an accuracy of 81.7% in discriminating malignant from benign nodules. Witczak et al. retrospectively reviewed the demographic, biochemical, and ultrasound characteristics of 536 thyroid nodules (19). They reported that serum thyrotropin, sex, microcalcifications, and margin were independent predictors of malignancy. A model consisting of these variables and age group was developed and demonstrated an AUC of 0.77. Both the studies by Maia et al. (18) and Witczak et al. (19) illustrated the potential of combining US and clinical characteristics for prediction of thyroid malignancy. In our study, the univariate analysis showed that sex, age, and nodule diameter were not predictors for thyroid malignancy in the training cohort. The reason for this remains unclear. However, the radiomics and ACR scores, which were both derived from the same US images, were independent predictors for thyroid malignancy. The radiomics score demonstrated an AUC of 0.921 in the training cohort, which was statistically similar to the AUCs of ACR score assessed by senior radiologists. The good discrimination performance of the radiomics score was confirmed in the validation cohort. Therefore, our results prove the important role of US imaging information for the characterization of thyroid nodules. The high performance of the radiomics score demonstrates the potential of radiomics techniques to extract more predictive information from ultrasound images than visual interpretation by a human operator.
The calibration curve of the prediction model demonstrates good agreement between the predictive and actual probability when the p value is more than 0.05. In addition, average (E aver) and maximal errors (E max), calculating the difference between prediction and calibration, provided a confidence interval for the predicted probability (16). In our study, the radiomics score model showed a high accuracy of individual predictions in the validation cohort as well as in the ACR-Score models (Table 5, Supplementary Fig. S1). However, the ACR-score models had larger errors (both E max and E aver) than the radiomics score (Table 5). In other words, the radiomics score model potentially provides a more exact prediction than the 4 ACR-Score models.
DCA was used to assess whether the radiomics score or ACR-Score models would improve individual benefit. This novel method offers an insight into clinical consequences on the basis of threshold probability, from which the net benefit could be derived. Net benefit is defined as the proportion of true positives minus the proportion of false positives, weighted by the relative harm of false-positive and false-negative results (20). Notably, the decision curve shows that the model using the radiomics score adds more benefit to predicting thyroid malignancy than that using the ACR-Score3 or ACR-Score4 models at any given threshold probability. Therefore, for junior radiologists, the radiomics model was superior to ACR TI-RADS.
Our study has several limitations. Firstly, this two-center study is retrospective. Inevitably, some bias may exist or may have affected the analysis. Secondly, the restriction of inclusion criteria to surgically verified nodules limited the external validity of our data. We chose surgical histopathology rather than fine-needle biopsy (FNB) as the gold standard for histology of thyroid nodules because many patients with thyroid nodules underwent surgery without preoperative FNB in hospital 1 and hospital 2. Hospital 1 (offered training cohort) is a tertiary referral center and hospital 2 (offered validation cohort) is an oncology center. Many patients with suspicious nodules had undergone FNB in other hospitals. They came to our hospitals just for surgical therapy. This situation may limit the external validity of our data in other tertiary referral or oncology centers. Therefore, although this study provides initial evidence that radiomics can be useful for predicting malignancy of thyroid nodules, more prospective studies should be performed to validate our results.
Conclusion
In conclusion, the present study in a retrospective series of surgically treated thyroid nodules provides initial evidence that radiomics can be useful for predicting malignancy in thyroid nodules, and that radiomics may outperform ACR TI-RAD scoring, at least when performed by junior radiologists.
Footnotes
Acknowledgments
We thank Drs. Jia Luo and Jie Li for their helpful and valuable comments on this study.
Author Disclosure Statement
The authors have no actual or potential conflicts of interest or financial ties to disclose.