
Abstract
Background:
This study analyzed big data for serum thyrotropin (TSH), free triiodothyronine (fT3), and free thyroxine (fT4) concentrations in patients who had attended the outpatient clinic of Ito Hospital (Tokyo, Japan) during a recent six-year period (between January 1, 2010, and December 31, 2015) in order to investigate for seasonal changes.
Methods:
The serum TSH concentrations were reviewed for all 135,417 patients aged >20 years. Patients with any thyroid diseases were included, irrespective of whether they were receiving drug therapy. In total 1,637,721 serum samples were analyzed for TSH, 1,626,269 for fT3, and 1,669,381 for fT4.
Results:
It was observed that the TSH concentrations showed annual changes during the six-year period. They decreased during the summer, while they increased during the winter. The TSH concentrations were negatively correlated with the daily temperatures (Spearman rank correlation coefficient −0.4486; p < 0.0001). The same applied for the correlation between fT3 concentrations and daily temperatures.
Conclusions:
The fact that the TSH concentrations show annual changes in areas where the temperature ranges during the year are rather wide should be borne in mind for interpretation of results.
Introduction
T
Seasonal variations in serum TSH and thyroid hormone concentrations have been investigated before in healthy adults (7 –14). The results showed that total triiodothyronine (T3) was higher in winter, but the results for seasonal variation in TSH varied among the studies. A recent study showed seasonal changes of TSH in Belgian, British, and Japanese laboratories (15). The present study reviewed big data comprising 1.6 million serum TSH, free T3 (fT3), and free thyroxine (fT4) concentrations in patients who had attended the authors' outpatient clinic during a recent six-year period in order to investigate the thyroid hormone concentrations for seasonal changes. Analyzing big data for this purpose is useful because it minimizes the influence of individual biologic variations, sex, age, or background thyroid disorders.
Methods
The serum TSH concentrations were reviewed of all 135,417 patients aged >20 years who had attended the outpatient clinic of Ito Hospital (Tokyo, Japan) between January 1, 2010, and December 31, 2015. Since the hospital specializes in thyroid disorders, the median number of serum samples collected per day was 903 (range 283–1969). A total of 1,637,721 samples were analyzed for TSH, 1,626,269 for fT3, and 1,669,381 for fT4. All patients with thyroid disease were included, irrespective of whether they were receiving medication such as levothyroxine (LT4) or an antithyroid drug (ATD) that affects thyroid hormone concentrations.
Blood samples were collected during outpatient service between 8:00am and 5:00pm and analyzed immediately. The average time between blood sample collection and measurement was seven minutes. The serum TSH, fT3, and fT4 concentrations were measured by electrochemiluminescence immunoassays (ECLusys TSH, ECLusys fT3, and ECLusys fT4; Roche Diagnostics GmbH, Mannheim, Germany). The manufacturer's reference limits were 0.2–4.5 mIU/L, 2.2–4.3 pg/mL, and 0.8–1.6 ng/dL, respectively. Since quality assessment of clinical laboratories is very important, data performance standard testing at the hospital is strictly assessed throughout the year. The temperature of the measurement room was kept at a constant 20°C (range 18.8–21.8°C) by air conditioning.
Median TSH, fT3, and fT4 concentrations were calculated daily. The mean air temperature, hours of sunshine, and rainfall for each day and each month in Tokyo were obtained from the Japan Meteorological Administration. “Spring” was defined as being from March to May, “summer” from June to August, “autumn” from September to November, and “winter” from December to February.
Statistical analysis
Median values, standard deviations (SD), percentiles, p-values, and confidence intervals were calculated using JMP software v12.0.2, (SAS Institute, Inc., Cary, NC). The daily median TSH, fT3, and fT4 values were calculated. The Wilcoxon/Kruskal–Wallis test was used to compare TSH, fT3, and fT4 concentrations between different seasons. Multiple comparisons were performed using Dunn's post hoc test to examine differences between the TSH, fT3, and fT4 concentrations between the four seasons, and the analysis of means (ANOM) with transformed ranks was used to demonstrate differences between the seasons. Spearman rank correlation coefficients were used to assess associations between daily median TSH, fT3, and fT4 concentrations and mean air temperatures, highest temperatures, mean temperatures, hours of sunshine, and rainfall for each day. A p-value of <0.05 was considered significant.
Results
Figure 1 shows the daily median TSH, fT3, and fT4 concentrations during the entire six-year period. The median TSH concentrations showed annual changes. Figure 2 shows monthly median TSH level for each year. The median TSH concentration decreased during the summer and increased during the winter. Next, the median TSH, fT3, and fT4 concentrations were compared by season. They are listed in Table 1 for each of the four seasons.

Daily median (
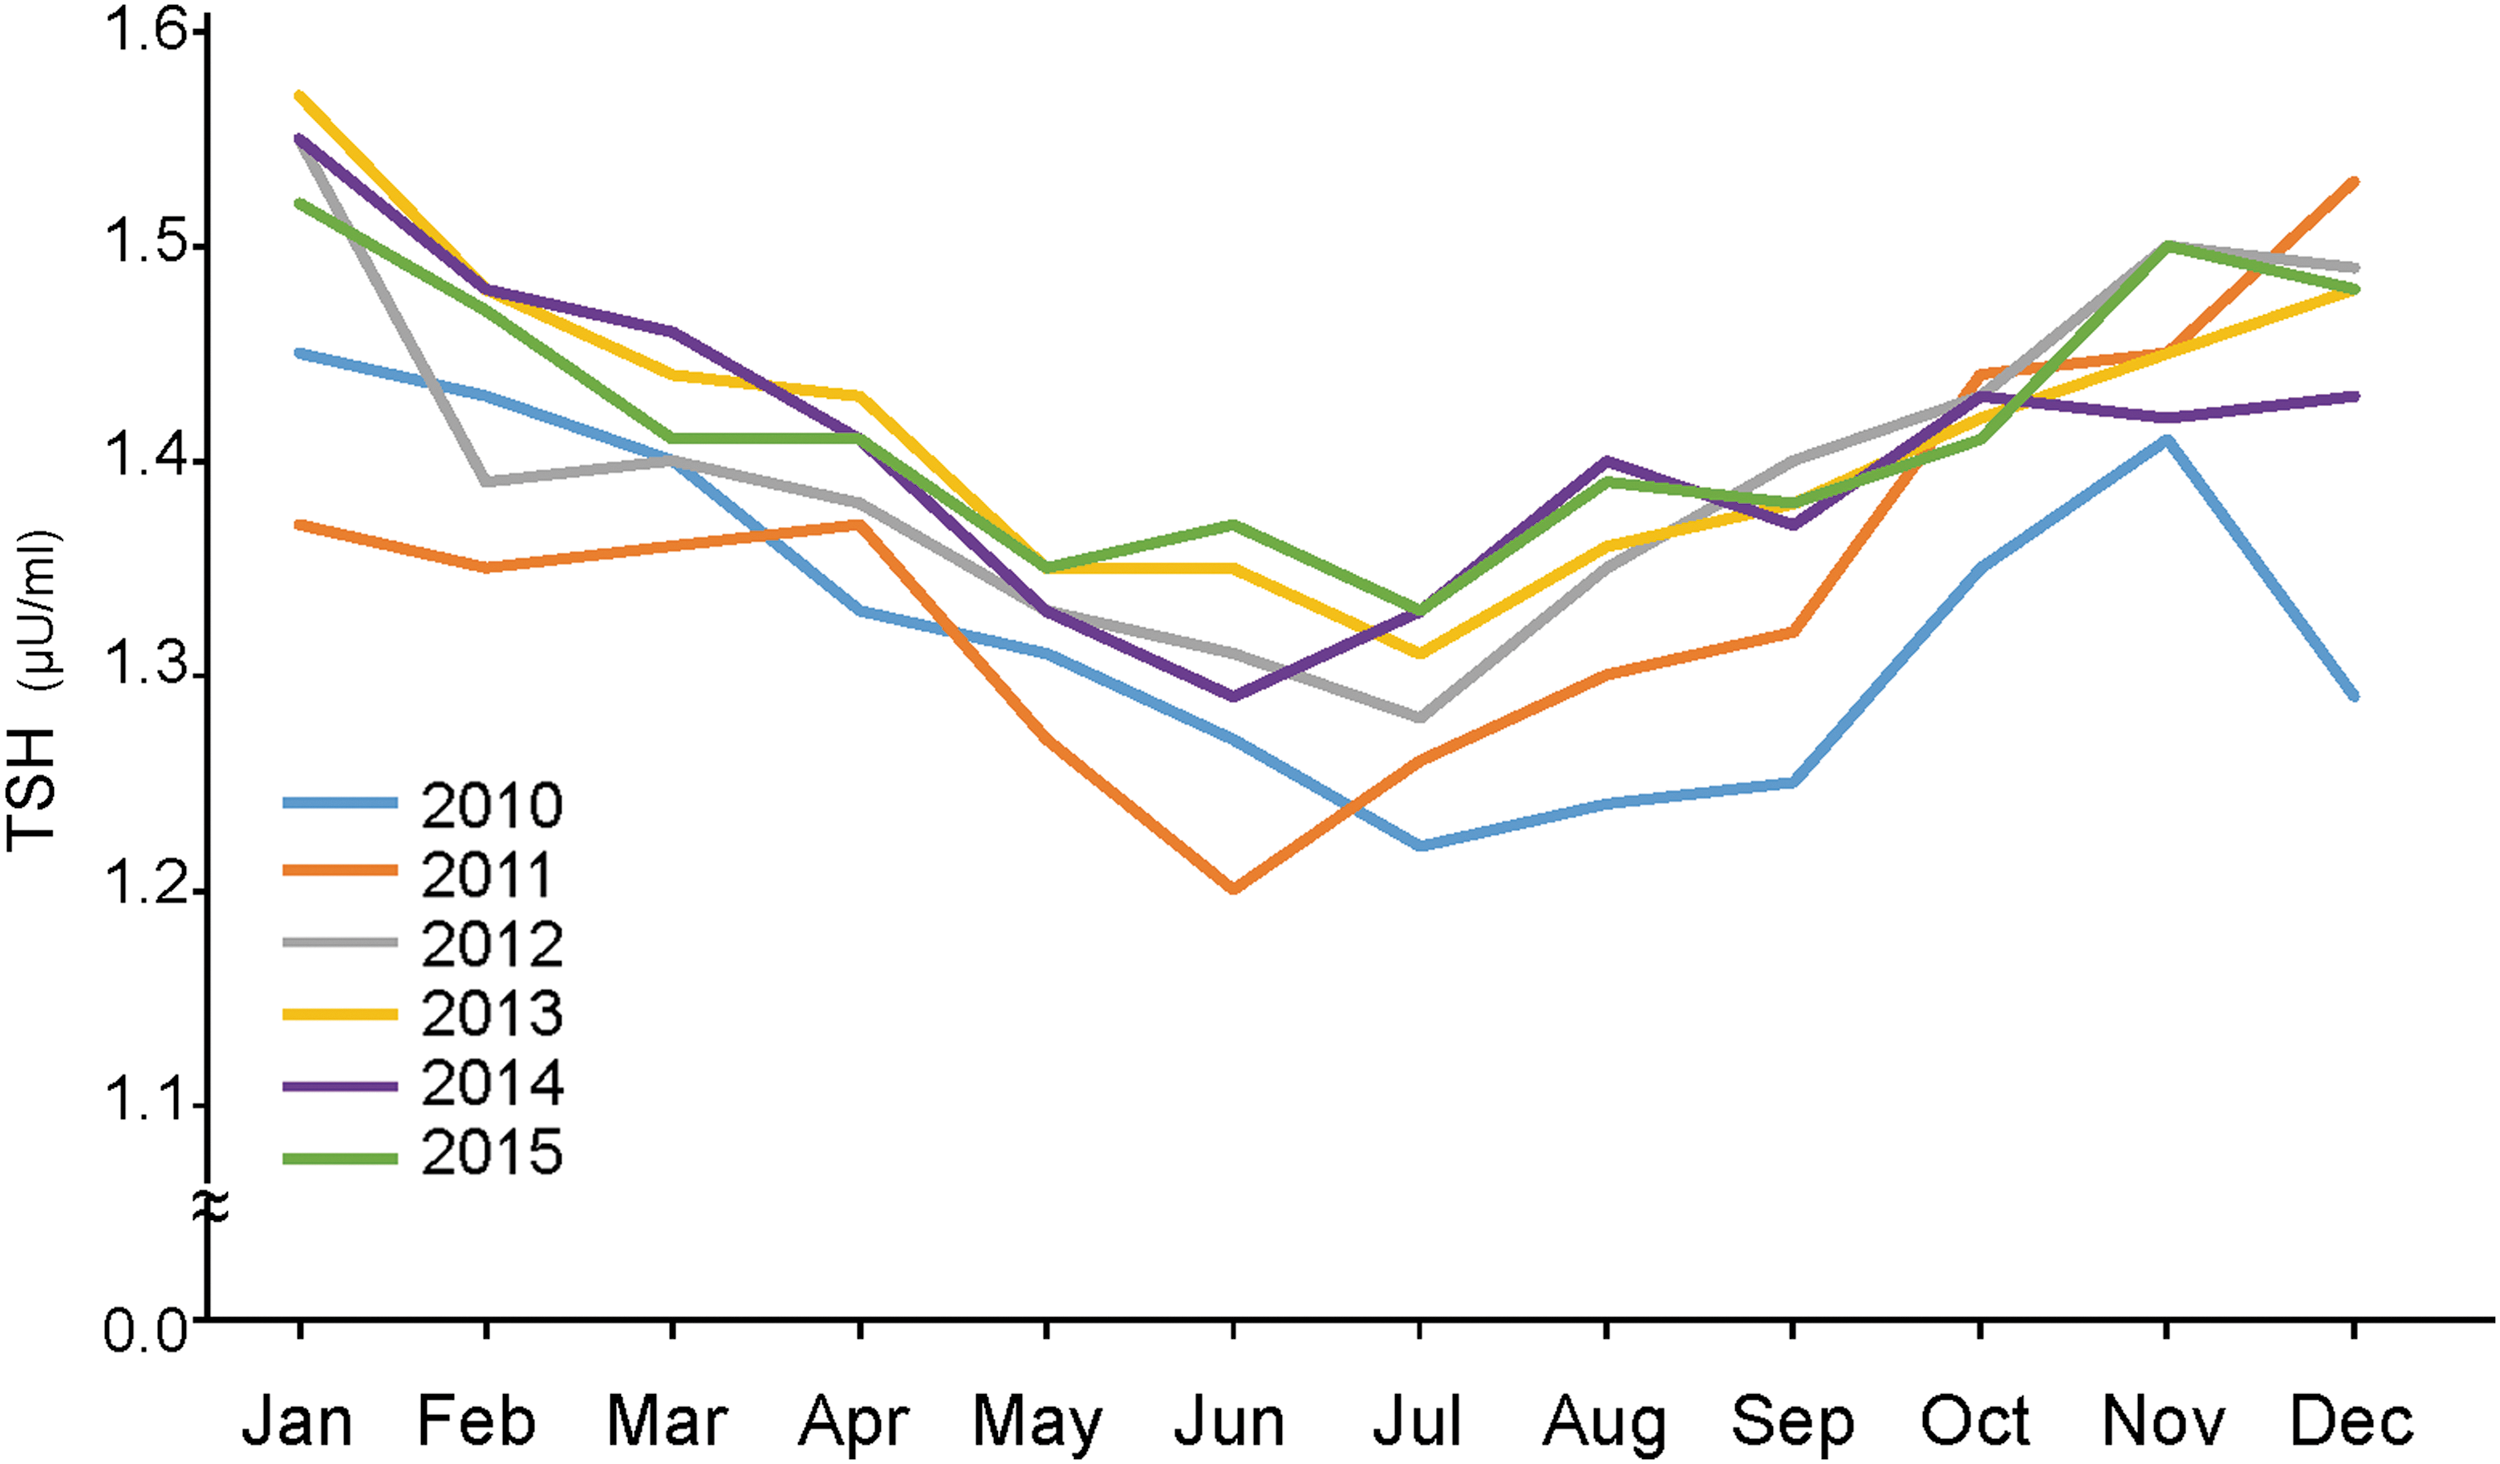
Monthly median TSH concentration in each year.
TSH, thyrotropin; fT3, free triiodothyronine; fT4, free thyroxine.
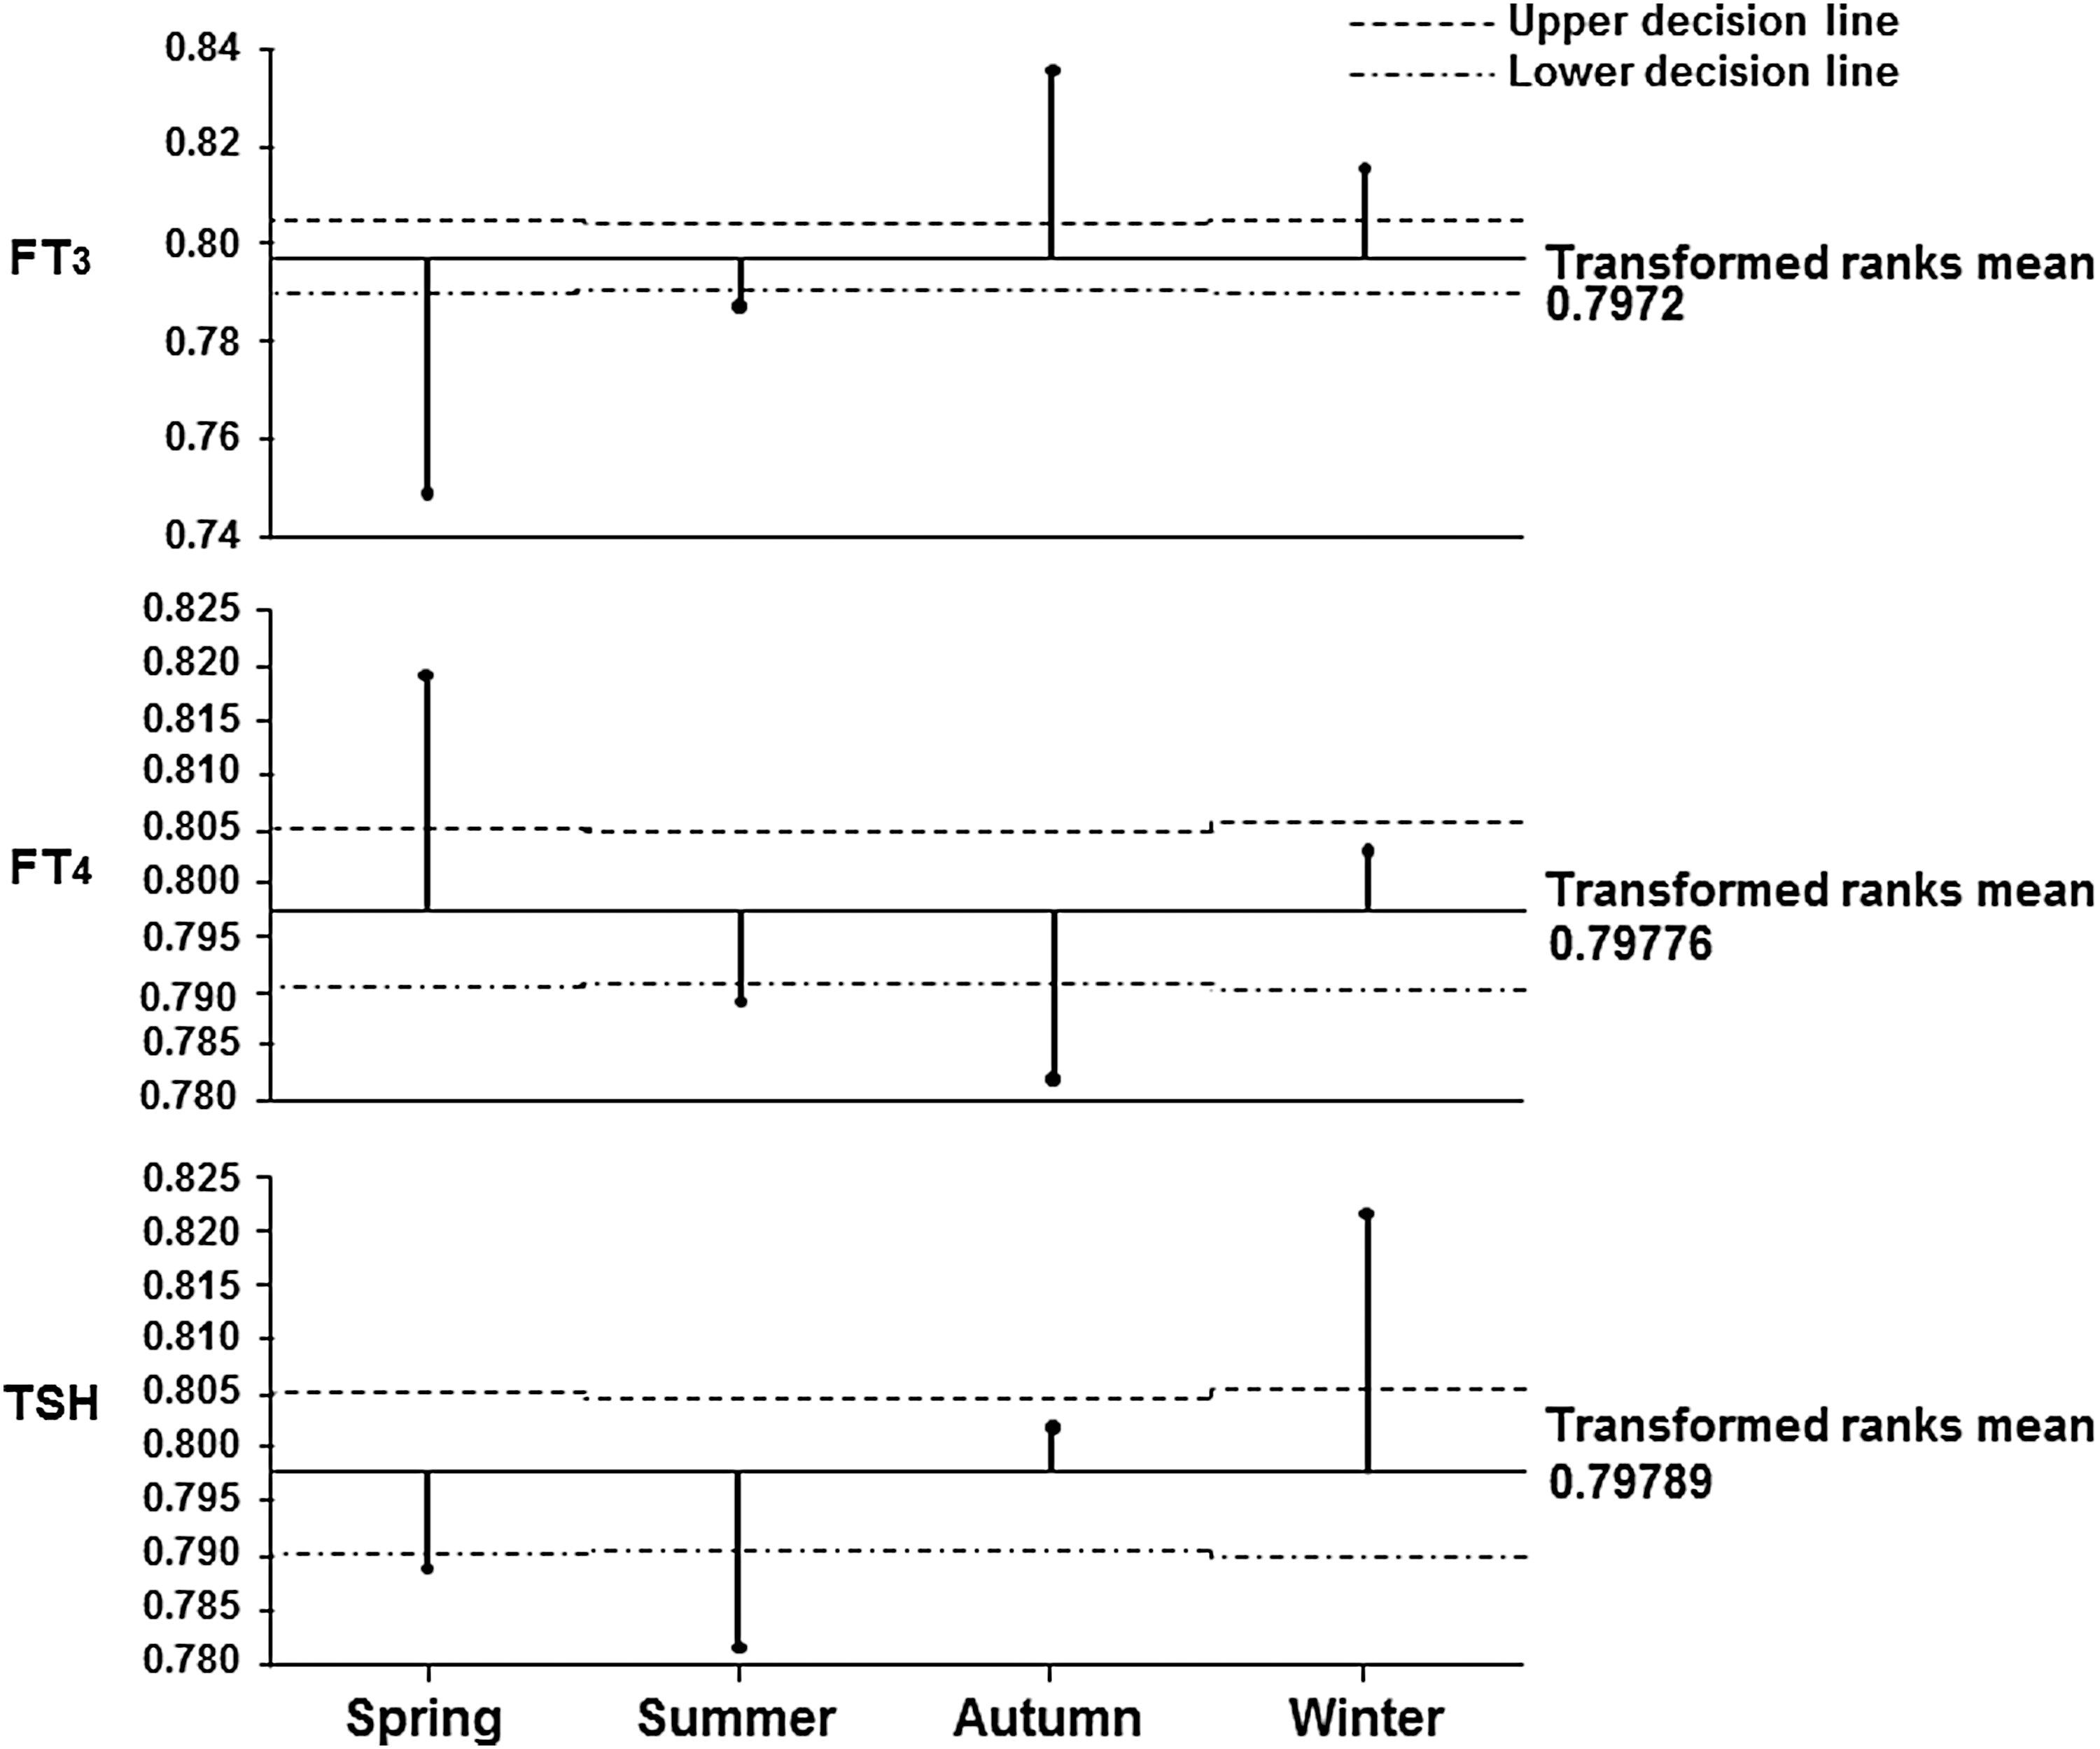
The analysis using the Wilcoxon/Kruskal–Wallis test showed significant differences in TSH, fT3, and fT4 concentrations between the four seasons. Therefore, the ANOM analysis was added to clarify the differences in TSH, fT3, and fT4 concentrations between the four seasons (Fig. 3). The TSH concentrations were significantly higher in the winter and significantly lower in the summer. The fT3 concentrations were significantly higher in the winter and significantly lower in the summer. The fT4 concentrations were higher in the summer and lower in the autumn than in the other seasons.
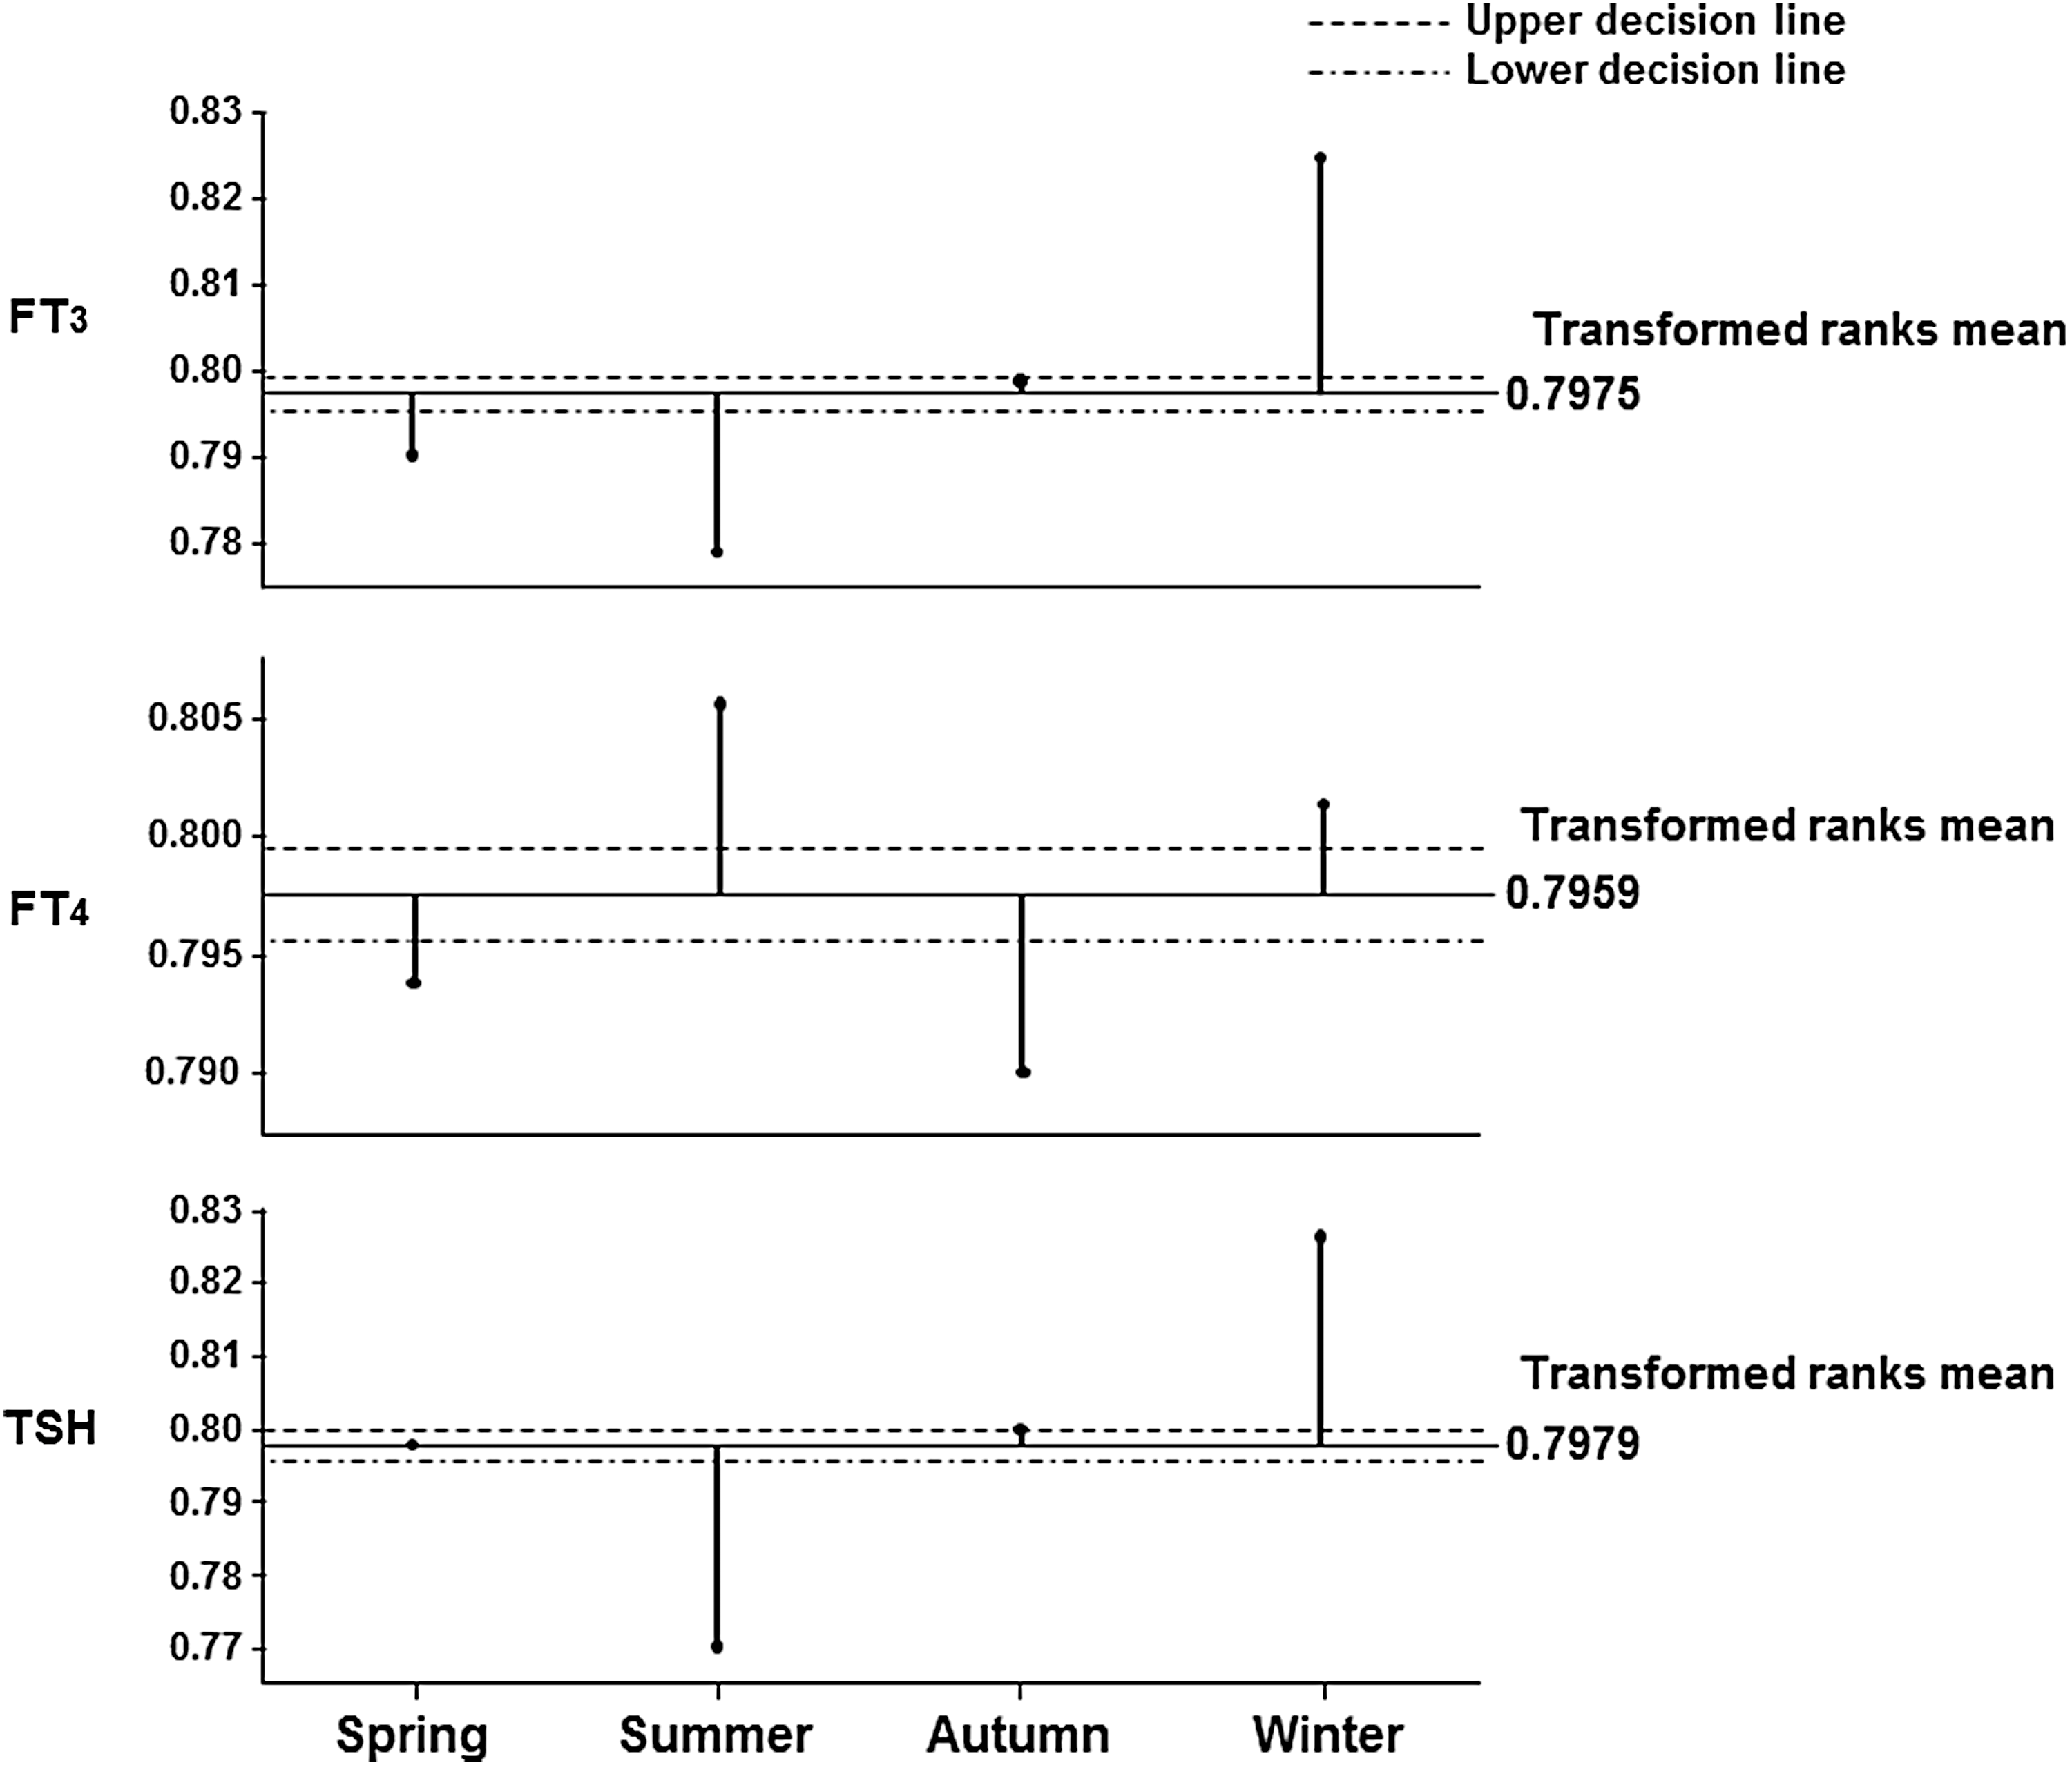
The analysis of means (ANOM) with transformed ranks of TSH, fT3, and fT4 concentrations among the four seasons.
As shown in Table 2, Spearman rank correlation coefficients for associations with daily median TSH concentrations were −0.4486 (p < 0.0001) for mean air temperatures, −0.4398 (p < 0.0001) for highest temperatures, −0.4467 (p < 0.0001) for lowest temperatures, 0.0251 (p = 0.2970) for hours of sunshine, and 0.0127 (p = 0.6967) for rainfall. Daily median TSH concentrations were negatively correlated with daily median fT3 and daily median fT4 concentrations, but the correlation coefficient was low. Spearman rank correlation coefficients for associations with daily median fT3 concentrations were −0.2853 (p < 0.0001) for mean air temperatures, −0.2882 (p < 0.0001) for highest temperatures, −0.2837 (p < 0.0001) for lowest temperatures, −0.0507 (p = 0.0349) for hours of sunshine, and −0.0274 (p = 0.4001) for rainfall. Spearman rank correlation coefficients for associations with daily median fT4 concentrations were −0.1031 (p < 0.0001) for mean air temperatures, −0.1070 (p < 0.0001) for highest temperatures, −0.0973 (p < 0.0001) for lowest temperatures, −0.0756 (p = 0.0016) for hours of sunshine, and −0.1140 (p = 0.0004) for rainfall. There was a strong correlation between daily median TSH concentrations and daily mean air temperatures.
Statistically significant figure are indicated with an asterisk.
Since the data set was derived from patients with thyroid diseases, an additional subset analysis was performed of the data obtained from the subjects who attended the hospital in 2015. A total of 297,191 blood samples was collected in 2015, the largest number in the six consecutive years. The results of the ANOM analysis to clarify differences between the TSH, fT3, and fT4 concentrations between the four seasons in each group are shown in Figures 4 –7.
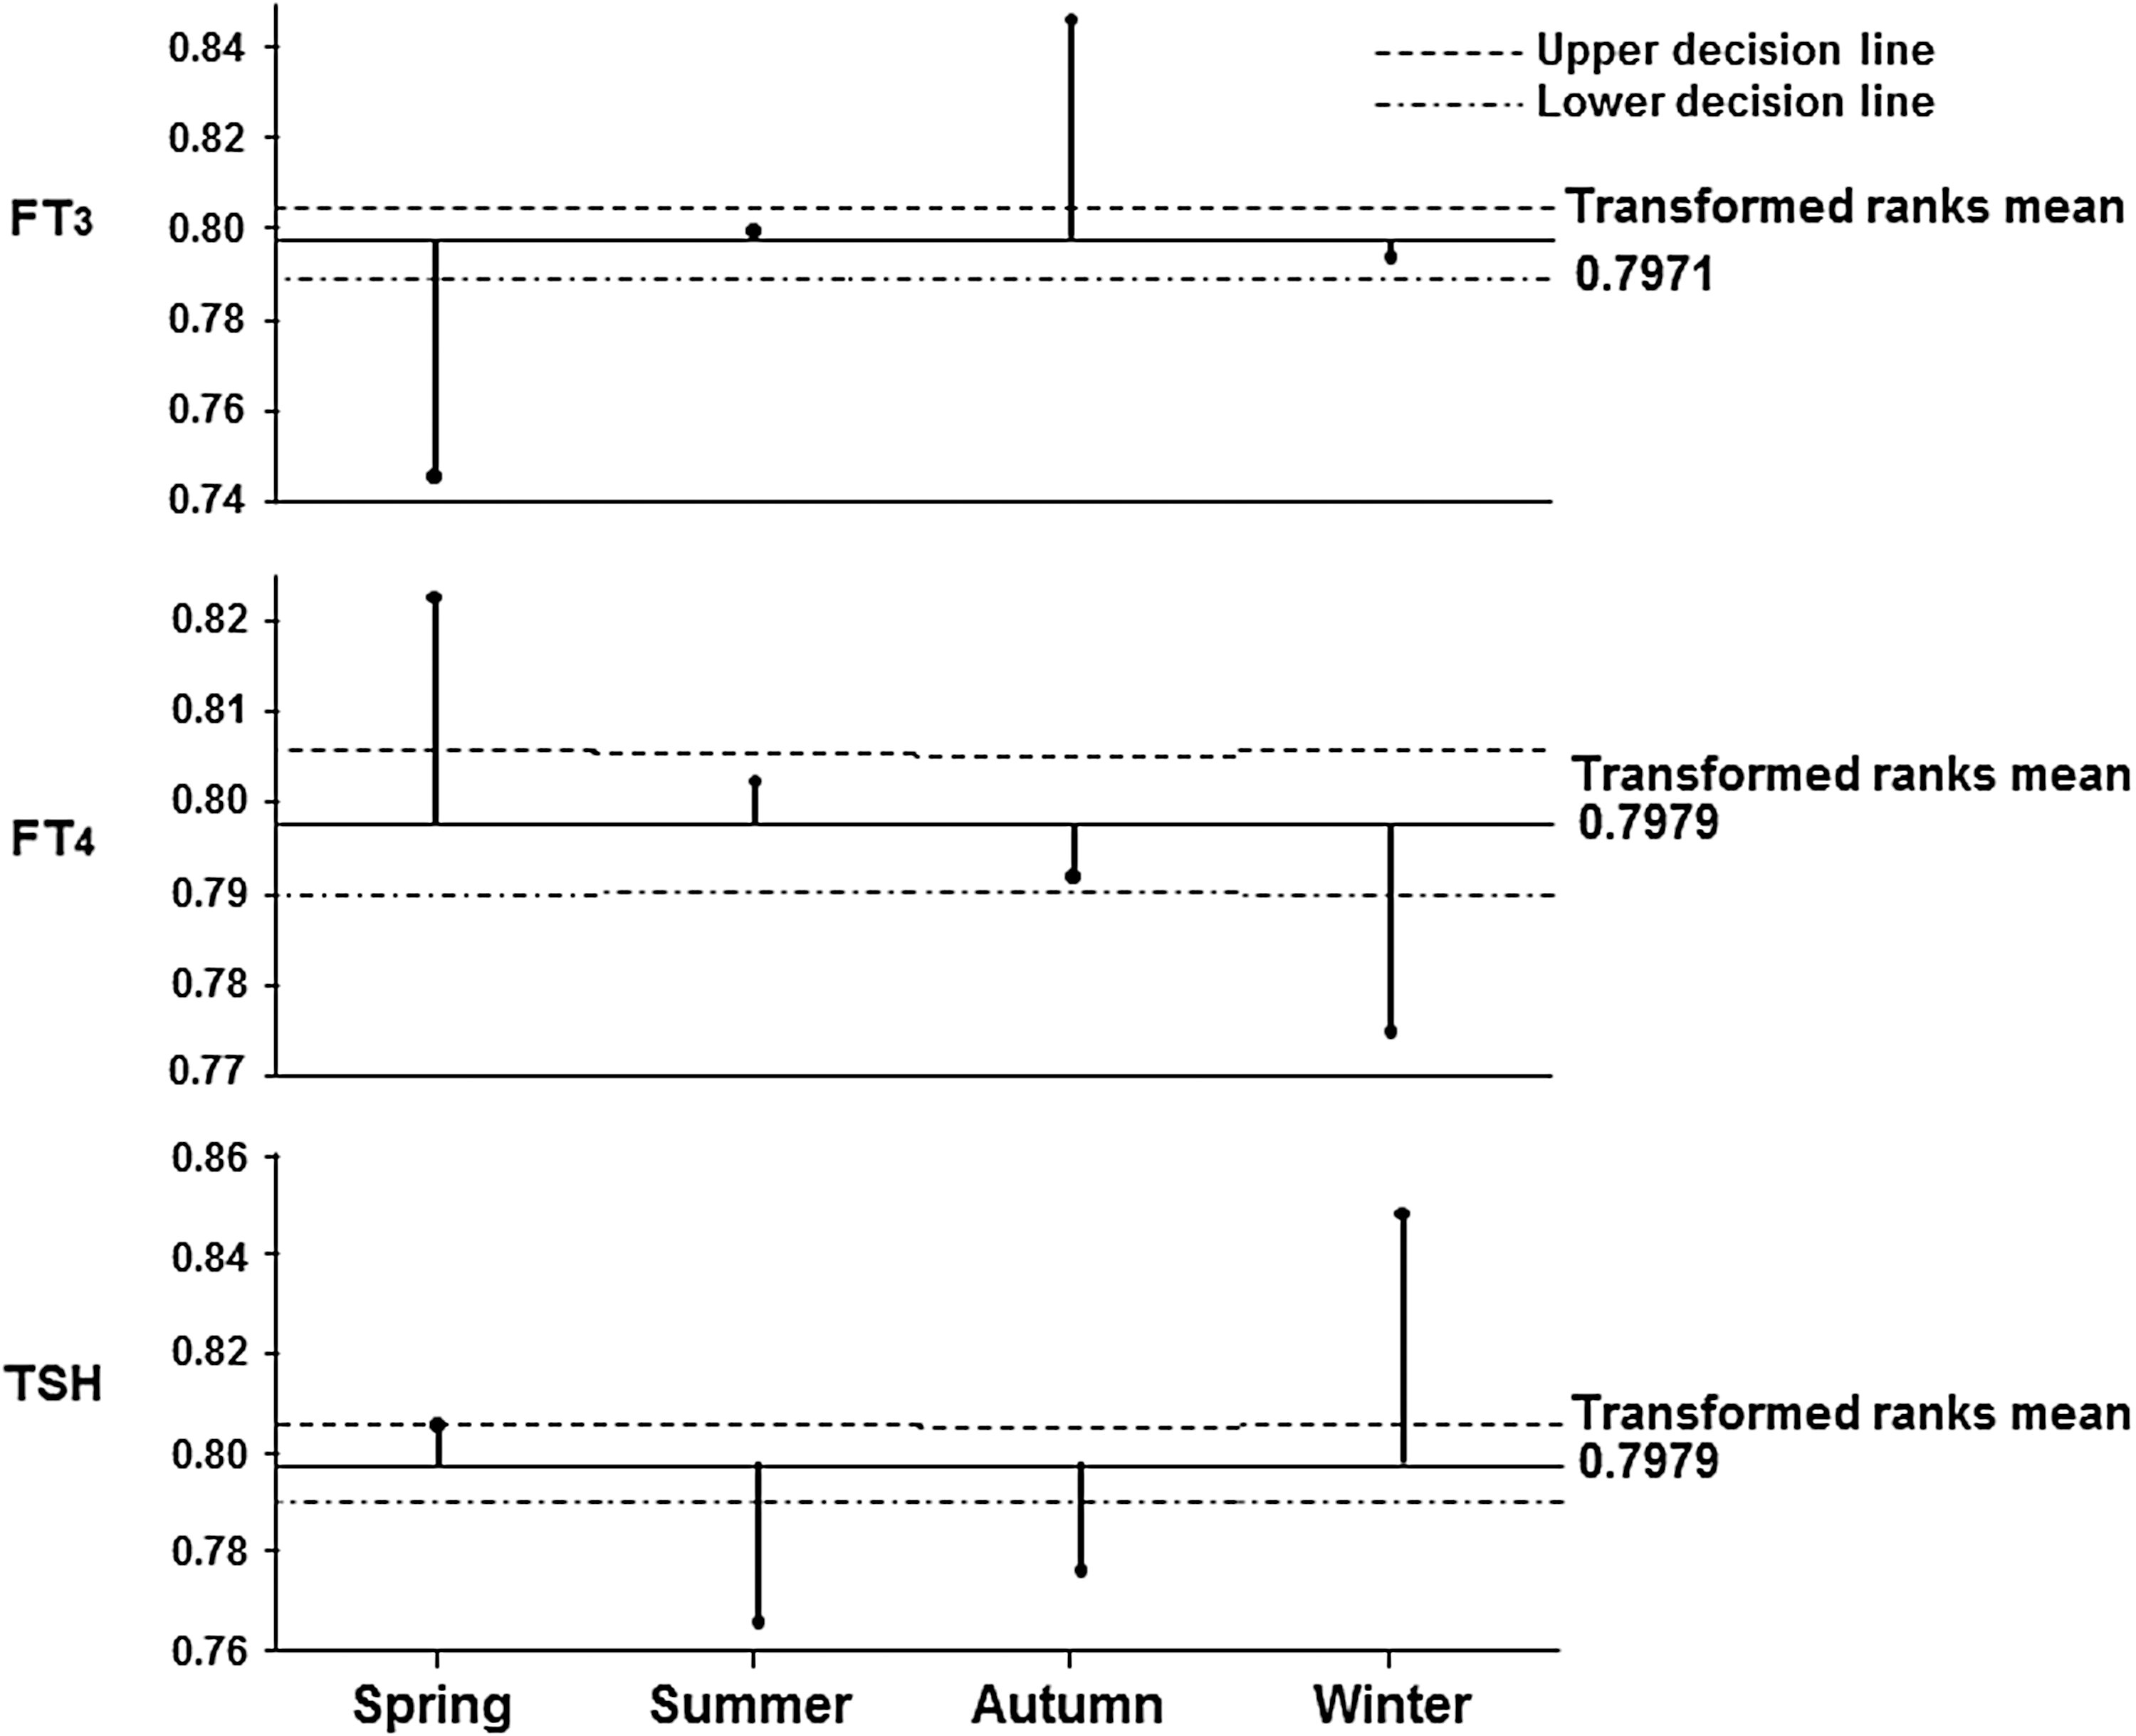
The ANOM with transformed ranks of the differences in the TSH, fT3, and fT4 concentrations among the four seasons in the group of patients being treated with levothyroxine (LT4).
The ANOM with transformed ranks of the differences in the TSH, fT3, and fT4 concentrations among the four seasons in the group of patients being treated with antithyroid drugs.
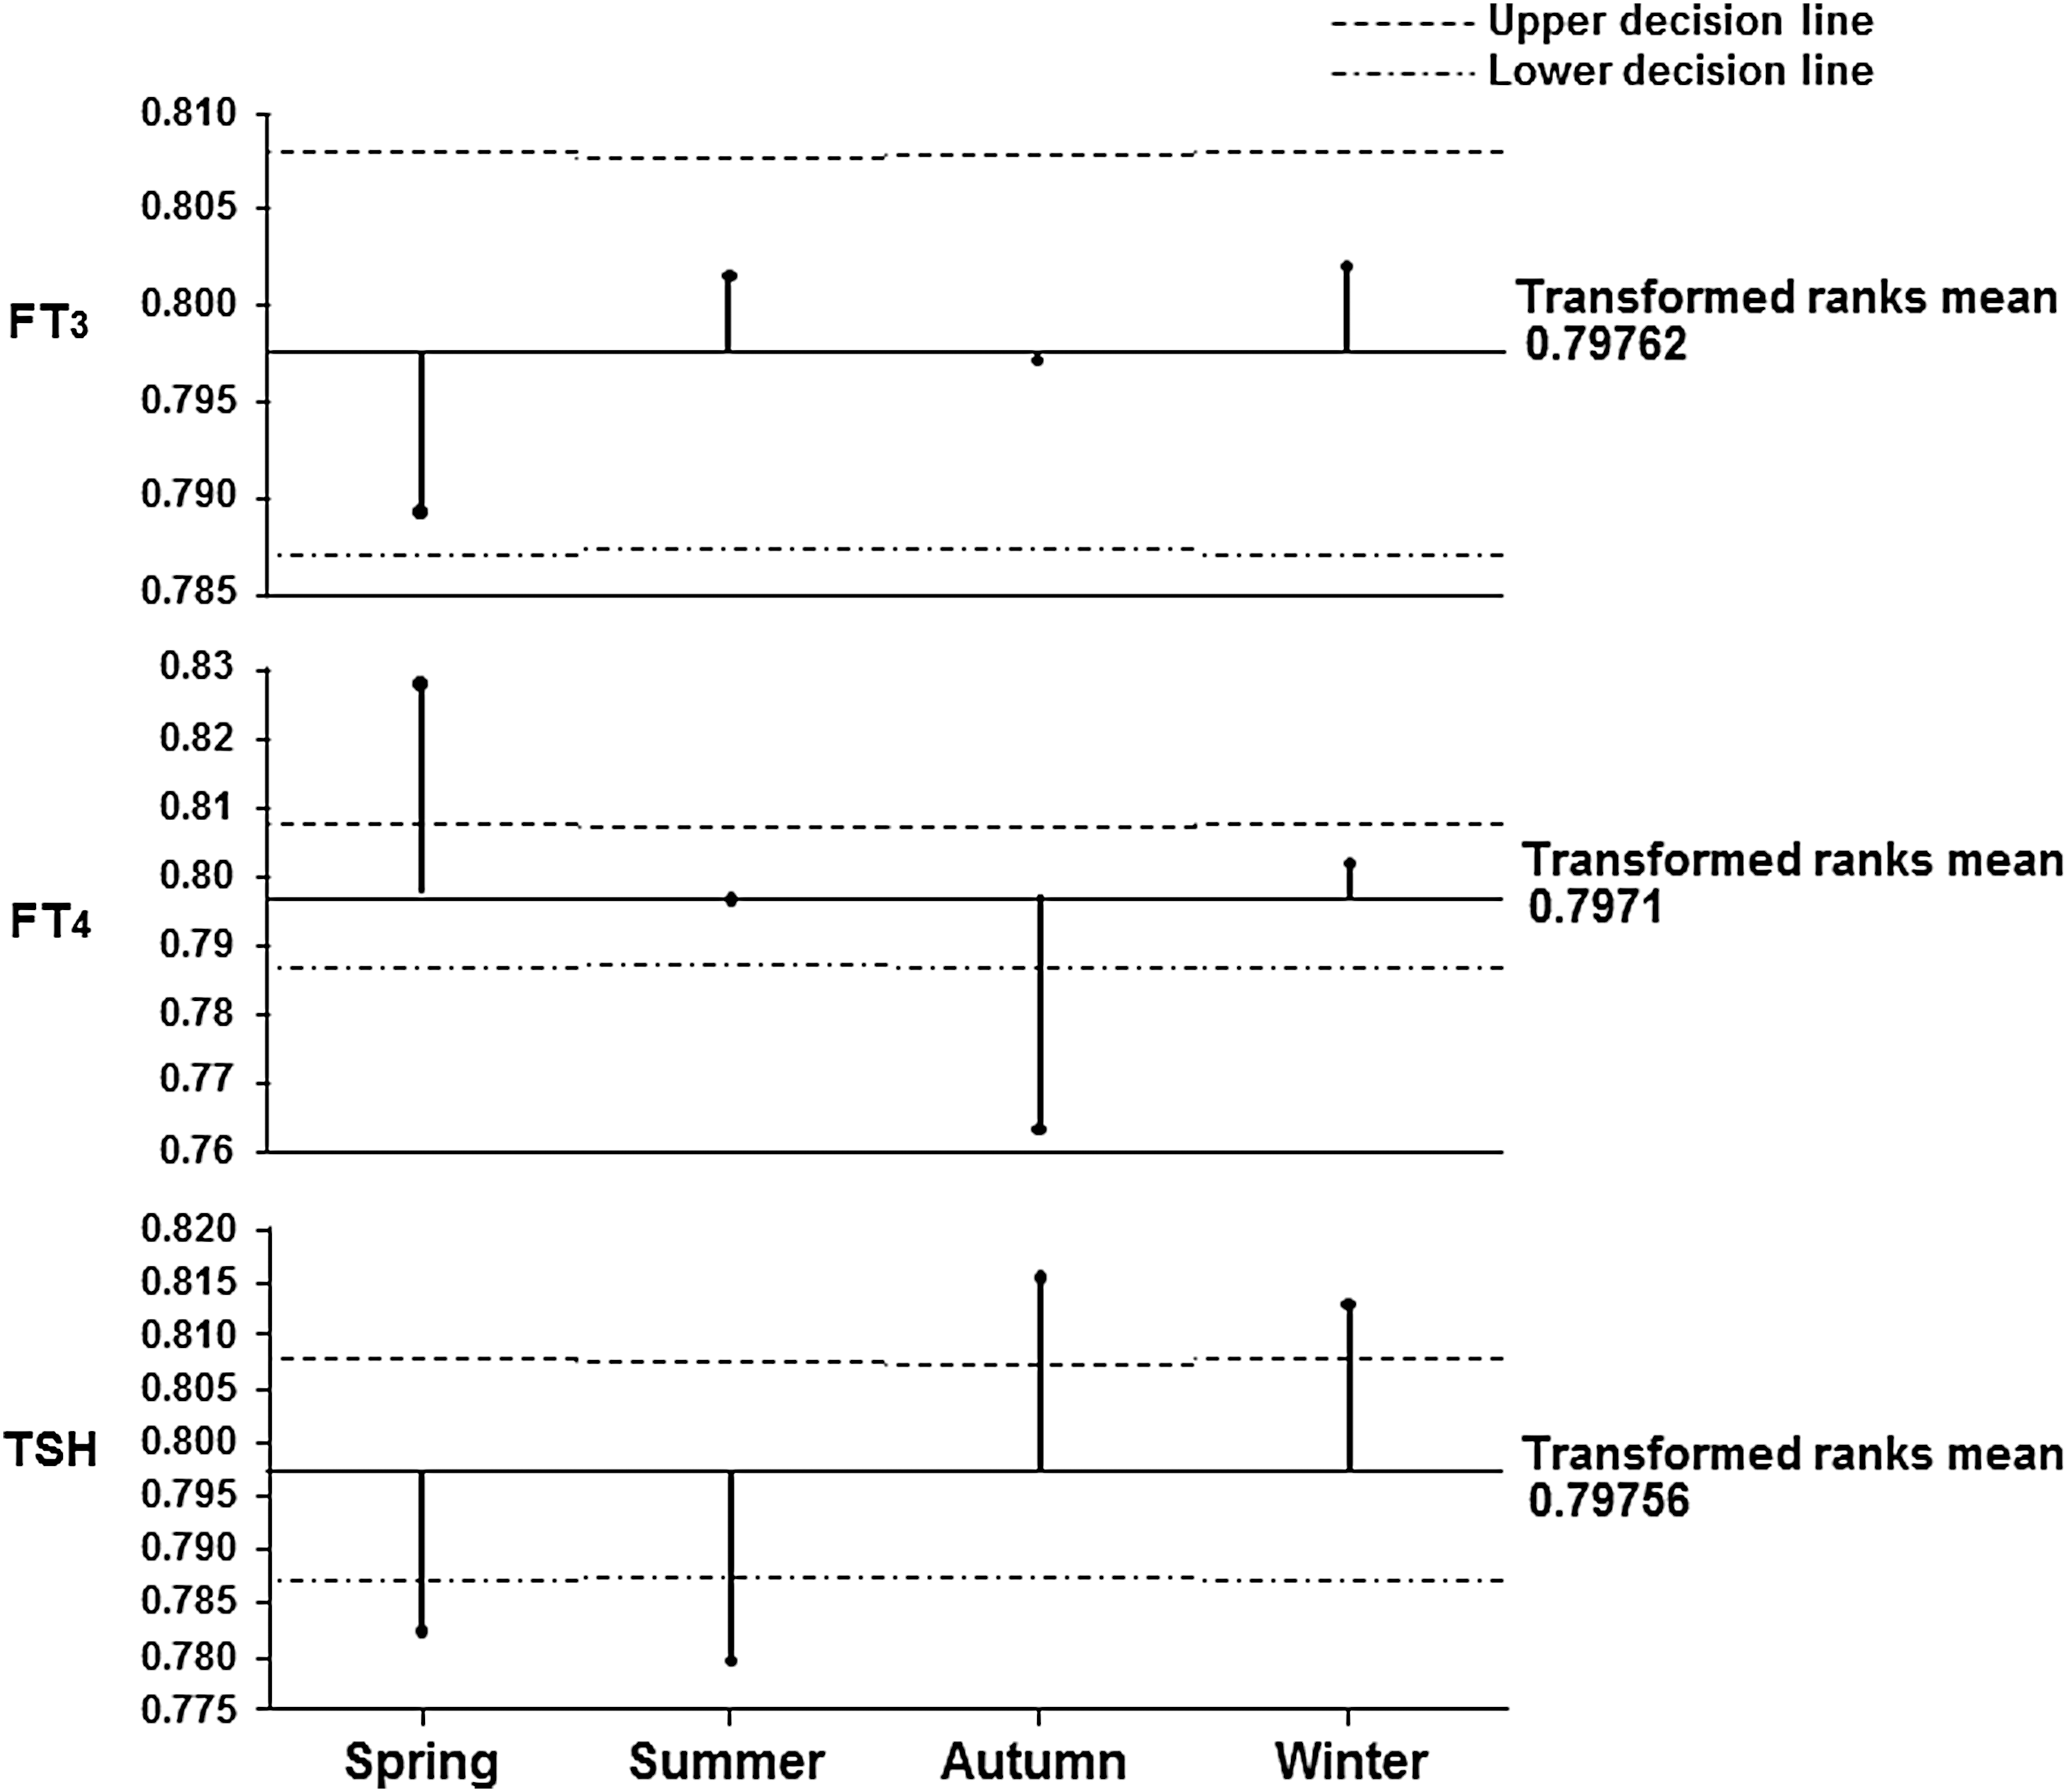
The ANOM with transformed ranks of the differences in the TSH, fT3, and fT4 concentrations among the four seasons in the group of patients not being treated with medication.

The ANOM with transformed ranks of the differences in the TSH, fT3, and fT4 concentrations among the four seasons in the group of patients being treated with LT4 because of having undergone total thyroidectomy.
The samples collected from subjects being treated with LT4 consisted of 12,344 samples from men and 97,132 samples from women. According to the results of the Dunn analysis, the fT3 level was significantly lower in spring and higher in autumn. The fT4 level was significantly lower in winter in both men and women. The TSH level was lower in autumn and higher in winter in both men and women (Fig. 4).
The samples collected from patients being treated with ATDs consisted of 11,355 samples from men and 51,524 samples from women. There were no significant seasonal differences between the fT3 levels in either men or women, but the fT4 level was significantly higher in spring in both men and women. There were no significant seasonal differences between the TSH levels of the men treated with ATDs, but the TSH levels of the women treated with ATDs were significantly higher in winter and lower in summer (Fig. 5).
The samples obtained from the patients not being treated with medication consisted of 15,470 samples from men and 109,366 samples from women. The fT3 levels of both the men and women were significantly lower, and their fT4 levels were significantly higher in spring. The TSH levels of both men and women were significantly higher in winter and lower in summer (Fig. 6). The fT3, fT4, and TSH levels of the women not being treated with medication were analyzed according to age group. The TSH level of the women in the 20- to 40-year-old group was lower in spring. The TSH level of the women in the 40- to 60-year-old group was significantly higher in winter. The TSH level of the women in the >60-year-old group was significantly higher in winter and lower in summer.
There were 10,525 samples from subjects who had undergone total thyroidectomy in the past and were being treated with LT4. As shown in Figure 7, their TSH level was significantly higher in winter. Their fT3 level was low in spring and high in autumn, and there was no difference between their fT3 level in summer and winter. There were no significant seasonal differences between their fT4 levels.
Discussion
Analysis of big data from thyroid function tests in the present study showed that the TSH concentrations exhibited annual changes during the six-year period. They decreased during the summer and increased during the winter. There was a significant negative correlation between TSH concentrations and daily temperatures. The same applied to the correlation between fT3 concentrations and daily temperatures. Since most of the subjects lived near Tokyo, the data are representative of Japanese patients in the Tokyo area where the temperature range during the year is rather wide.
When the observations were compared to other studies, it was found that a study of Antarctic residents showed that a six-month stay in Antarctica caused an increase in serum T3 production and clearance, a decrease in serum fT4 concentrations, and an increase in serum TSH concentrations. The same study also showed that in Antarctic residents, the serum thyroglobulin concentration increased, as well as the concentrations of T3 and TSH, presumably due to the increased need for thyroid hormone by peripheral tissues (16 –18). Seasonal changes in TSH and fT3 levels have also been reported in the past (19 –24), and the present findings agree with prior observations. A longitudinal study of subjects participating in a healthcare screening program from Korea (25), where seasonal temperature changes are similar to those in Japan, also showed that serum TSH concentrations changed in a biphasic pattern, that is, increase during the winter–spring season and decrease during the summer–fall season. During a median 36-month follow-up period, 57.9% of the baseline subclinical hypothyroid subjects reverted to euthyroidism, and 4.3% of the euthyroid subjects developed subclinical hypothyroidism.
The photoperiod has also been suggested as a factor that causes seasonal differences in thyroid function. Melatonin is known to drive changes in neuroendocrine pathways (26 –28). However, the present study failed to show associations between daily serum TSH, fT3, and fT4 concentrations and hours of sunlight. A correlation is known to exist between mean daily temperatures and daily hours of sunlight. The results of this study showed a correlation between TSH levels and mean temperatures, but not between TSH levels and hours of sunlight. Since the effects of ambient temperature on human physiology are influenced by clothing, heating, and environmental circumstances, the effects of socioeconomic factors on the seasonal variations may have affected the results.
Gullo et al. recently reported finding that athyreotic patients treated with a steady dosage of LT4 monotherapy had significantly higher serum TSH values in the cold season, when the fT3 and fT4 values were significantly lower. They hypothesized that reduced LT4 absorption in winter might explain their findings (29).
In the present study, 10,525 samples obtained from athyreotic subjects who attended the hospital in 2015 and who were being treated with LT4 were identified. Since information about LT4 dosage was unavailable, it was not possible to investigate whether their replacement requirements changed during the course of the year. Their TSH level was significantly higher in winter. There was no difference between their fT3 level in summer and winter, and there were no significant difference between their fT4 level in the four seasons. A circannual study of the thyroid hormone levels and LT4 dosage of patients lacking a thyroid gland is needed.
The fact that the data were retrospective and collected from patients with thyroid disease is a limitation of this study. Its strengths include its multiyear duration, use of a large cohort of healthcare recipients, and a single analytic method for measurement of TSH to exclude inter-assay variation as source of variation in the measurements. Although the iodine status of all of the subjects was not measured, Japan is known to be an iodine-sufficient country throughout the year. Seasonal changes in TSH concentration, that is, an increase during winter and decrease during summer, have also been reported in Belgium, the United Kingdom, and Korea (15,25). Although these countries have similar seasonal temperature changes, since their iodine status may be different, it was concluded that air temperature is a strong factor in causing seasonal changes in TSH concentration.
In conclusion, big data of 1.6 million serum TSH values from six consecutive years showed annual changes and a significant negative correlation between TSH concentrations and daily temperatures. The fact that serum TSH concentrations change within the year in areas where the temperature ranges widely during the year should be borne in mind when interpreting the results of thyroid hormone level.
Footnotes
Author Disclosure Statement
The authors report no conflicts of interest in this work.