




Abstract
Background:
The purpose of the current study was to investigate the diagnostic performance of technetium-99m (Tc-99m) methoxy-isobutyl-isonitrile (MIBI) for differentiation of malignant thyroid nodules (TN) through a systematic review and meta-analysis.
Methods:
The MEDLINE/PubMed and EMBASE database, from the earliest available date of indexing through January 31, 2018, were searched for studies evaluating the diagnostic performance of Tc-99m MIBI for TN. The sensitivities and specificities were determined across studies, positive and negative likelihood ratios (LR+ and LR–) were calculated, and summary receiver operating characteristic curves were constructed.
Results:
Across 22 studies (2421 patients), the pooled sensitivity for Tc-99m MIBI thyroid scan was 0.87 [confidence interval (CI) 0.76–0.93] with heterogeneity (I 2 = 92.3) and a pooled specificity of 0.78 [CI 0.67–0.86] with heterogeneity (I 2 = 96.4). LR syntheses gave an overall LR+ of 4.0 [CI 2.5–6.3] and LR– of 0.17 [CI 0.09–0.32]. The pooled diagnostic odds ratio was 24 [CI 63–176]. The hierarchical summary receiver operating characteristic curve indicates that the area under the curve was 0.90 [CI 0.87–0.92]. In meta-regression analysis, no definite variable was the source of the study heterogeneity.
Conclusion:
The current meta-analysis shows a moderate sensitivity and specificity of Tc-99m MIBI thyroid scan for differentiation of malignant TN. However, the diagnostic odds ratio was relatively low and the LR scattergram indicated that Tc-99m MIBI thyroid scan is not useful for confirming the presence of malignant TN or for its exclusion. Therefore, Tc-99m MIBI thyroid scans should be used restrictively and interpreted cautiously when assessing TN for malignancy.
Introduction
T
The evaluation of TN includes fine-needle aspiration cytology (FNAC) and measurement of serum thyrotropin (TSH). FNAC is the most important diagnostic test in the initial evaluation of a patient with a TN and has high diagnostic accuracy. However, a number of reports have shown that 11–42% of FNAC results are reported as indeterminate (7,8). These indeterminate TN present a clinical dilemma to the evaluating clinicians. Therefore, the next step in the current management of these patients with TN is usually surgical excision.
Technetium-99m (Tc-99m) methoxy-isobutyl-isonitrile (MIBI) is a lipophilic monovalent cationic agent that is used for myocardial perfusion for the diagnosis of coronary artery disease (CAD) (9), the assessment of prognosis of CAD (10 –12), and the assessment of myocardial viability (13,14). After reports of uptake of Tc-99m MIBI in benign and malignant lung tumors (15), many studies have reported on the diagnostic utility of Tc-99m MIBI in various tumors (16 –20).
Tc-99m MIBI is increasingly used for thyroid nodular disease and may help differentiate benign from malignant nodules. Several previous studies have reported that Tc-99m MIBI has a wide range of sensitivity, specificity, positive predictive value, and negative predictive value (21 –31). Despite its high sensitivity for thyroid tumors, Tc-99m MIBI is not used routinely in clinical practice because of its low specificity (22,23,30,31).
The purpose of this study was to perform a meta-analysis of published data on the diagnostic accuracy of Tc-99m MIBI for the differentiation of benign from malignant thyroid nodules in order to provide more evidence-based data and to provide a foundation for further studies.
Methods
Data sources and search strategy
An electronic English language literature search was conducted of MEDLINE/PubMed and the Embase database from the earliest available date of indexing through January 31, 2018. The reference lists of identified publications were also hand-searched for additional studies. A search algorithm was used based on a combination of terms: (i) “Thyroid” OR “Thyroid Nodule”; and (ii) “Technetium Tc-99m Sestamibi” OR “MIBI” OR “Sestamibi” OR “methoxyisobutylisonitrile.”
Study selection
The inclusion criteria for relevant studies were as follows: Tc-99m MIBI thyroid scan had been used to evaluate the TN; sufficient data to reassess sensitivity and specificity of Tc-99m MIBI thyroid scan for differentiating the TN or absolute numbers of true-positive (TP), true-negative (TN), false-positive (FP), and false-negative (FN) data had been presented; and no data overlap.
Duplicate publications were excluded, as were publications such as review articles, case reports, conference papers, and letters, which do not contain original data. Two researchers independently reviewed titles and abstracts of the retrieved articles, applying the above-mentioned selection criteria. Articles were rejected if clearly ineligible. The same researchers independently evaluated the full text of the included articles to determine their eligibility for inclusion in the current review.
Data extraction and quality assessment
Information about the basic study (authors, year of publication, and country of origin), study design (prospective or retrospective), patients' characteristics, and technical aspects were collected.
Each study was analyzed to retrieve the number of TP, TN, FP, and FN findings of Tc-99m MIBI thyroid scans for the characterization of the TN, according to the reference standard (i.e., the final histology). Only studies providing complete information were included in the meta-analysis.
The overall quality of the included studies in this review was critically appraised by two authors independently based on the 15-item modified Quality Assessment of Diagnostic Accuracy Studies (QUADAS2) tool (32). Discrepancies between the researchers were resolved by discussion.
Data synthesis and analysis
All data from each eligible study were extracted. The primary objective was to estimate the sensitivity and specificity, and the positive and negative likelihood ratios (LR+ and LR–, respectively) with confidence intervals (CIs), and diagnostic odds ratios (DORs) with CIs. A DOR can be calculated as the ratio of the odds of positivity in a disease state relative to the odds of positivity in the non-disease state, with higher values indicating better discriminatory test performance (33). Between-study statistical heterogeneity was assessed using I 2 and the Cochrane Q-test on the basis of the random-effects analysis (34). Publication bias was examined using the effective sample size funnel plot and associated regression test of asymmetry described by Deeks et al. (35). The bivariate random-effects model was used for analysis and pooling of the diagnostic performance measures across studies, as well as comparisons between different index tests (36,37). The bivariate model estimates pairs of logit transformed sensitivity and specificity from studies, incorporating the correlation that might exist between sensitivity and specificity. Each data point of the summary receiver operator characteristic (SROC) graph comes from an individual study. Then, the SROC curve is formed based on these points to form a smooth curve to reveal pooled accuracy (38). When statistical heterogeneity was substantial, meta-regression was performed to identify potential sources of bias (39). Pooled estimates were also calculated for subgroups of studies that were defined according to specific study designs. Informativeness was represented graphically by a LR scattergram or matrix (40). The LR scattergram shows the summary point of LRs obtained as functions of mean sensitivity and specificity (41). Two-sided p-values of ≤0.05 were considered statistically significant. Statistical analyses were performed with a commercial software program (STATA v13.1; StataCorp LP).
Results
Literature search and selection of studies
After the comprehensive computerized search was performed and references lists were extensively cross-checked, the research yielded 2726 records, of which 721 records of duplicated abstracts were excluded after reviewing the title and abstract. Also, 815 non-relevant studies, 246 case reports, 441 conference abstracts, 64 letters, 27 editorials, 31 notes, and 312 review articles were excluded. The remaining 39 full-text articles were assessed for eligibility, and 17 articles were excluded due to insufficient data for the calculation of sensitivity and specificity of Tc-99m MIBI thyroid scans in patients with TN. Finally, 22 studies were selected and were eligible for the systematic review and meta-analysis, and no additional studies were found screening the references of these articles (21 –31,42 –52). The characteristics of the included studies are presented in Table 1. The detailed procedure of study selection in the current meta-analysis is shown in Figure 1.
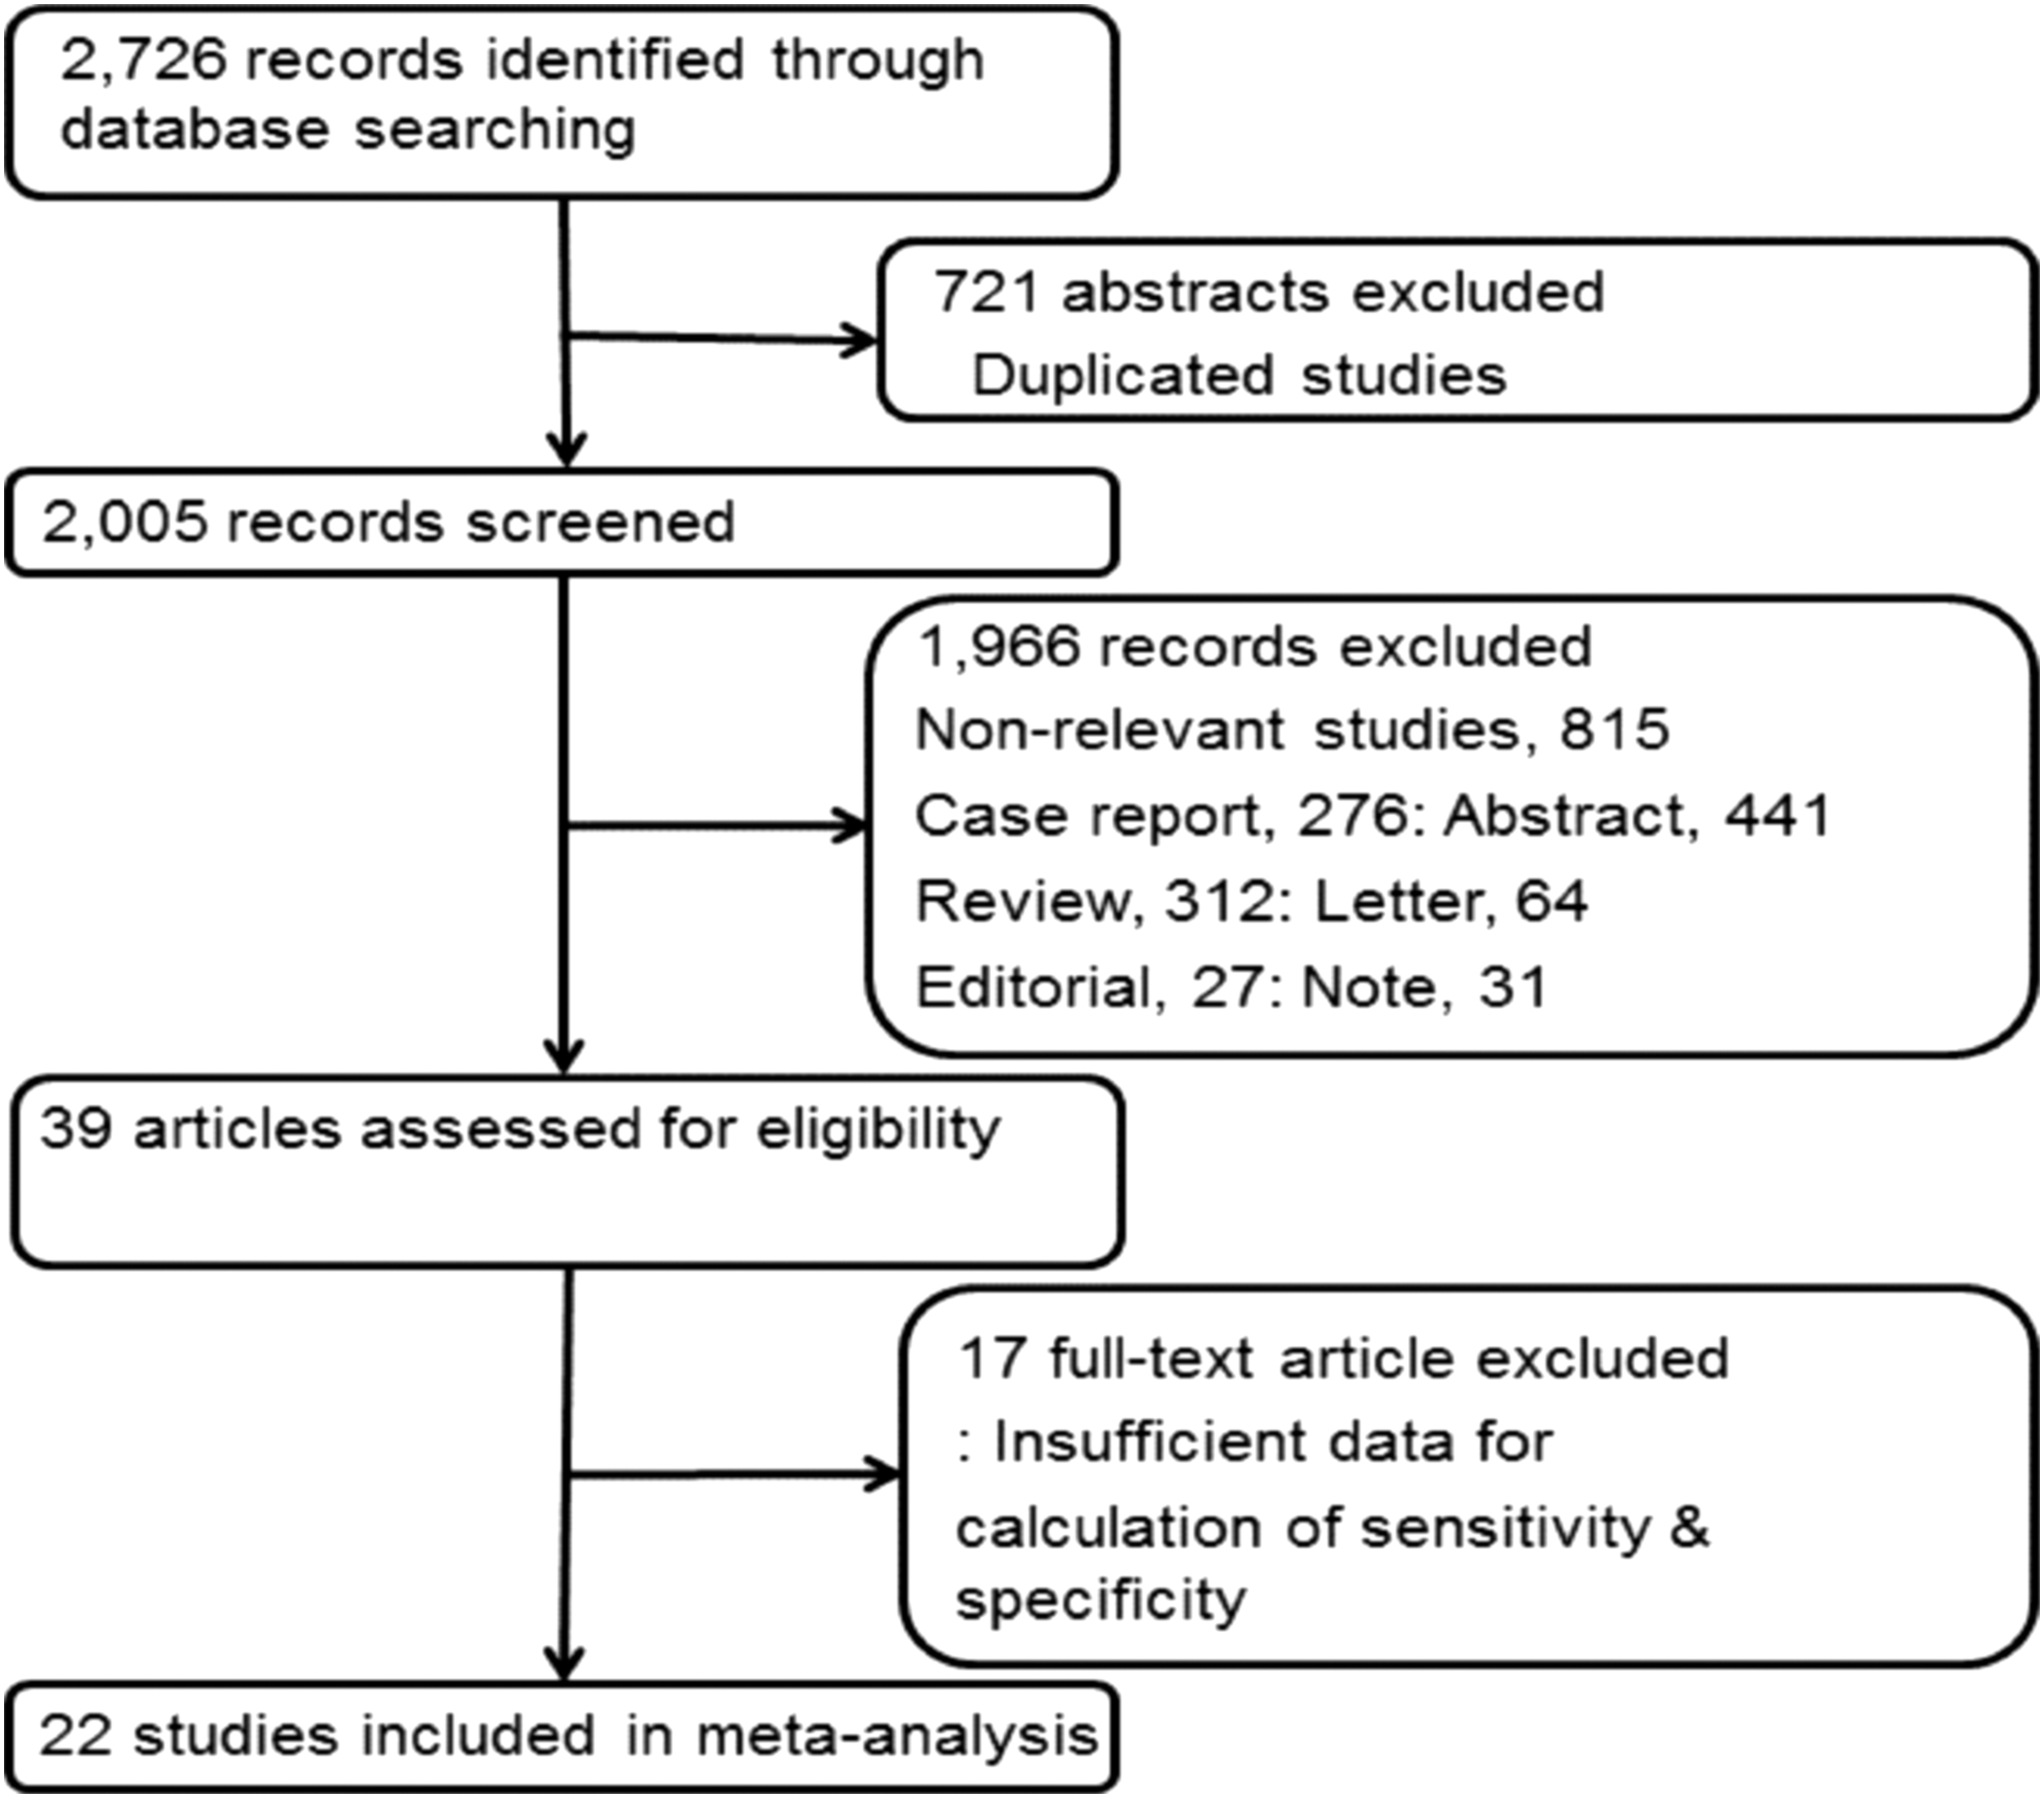
Flow chart of the search for eligible studies on the diagnostic performance of technetium-99m (Tc-99m) methoxy-isobutyl-isonitrile (MIBI) thyroid scan for differentiation of malignant thyroid nodules (TN).
Tc-99m, technetium-99m; MIBI, methoxy-isobutyl-isonitrile; FNAB, fine-needle aspiration biopsy; LB, lesion based; PB, patient based; NA, not available; NR, not reported; R, retrospective study design; P, prospective study design; VA, visual analysis; SQA, semi-quantitative analysis; RI, retention index; RR, retention ratio; T/N, tumor to normal ratio; WOind, MIBI washout index; C-TN, cold thyroid nodule; Ind-C, indeterminate FNAB cytology.
Study description, quality, and publication bias
All analyses were conducted based on per-patient data and/or per-lesion data analysis. Among the 22 studies included in the current review, 20 conducted patient-based analysis of Tc-99m MIBI thyroid scans in patients with TN (21 –27,29 –31,42 –52). Two studies conducted a lesion-based analysis (28,47). There were a total of 2628 patients in the included studies, and their ages ranged from 16 to 86 years. A total of 312 patients were male, and 1217 patients were female. Six studies did not report the number of male and female patients in their cohorts (22,28,3142,49,51). Among the 22 studies, 15 enrolled patients retrospectively (21 –23,28 –31,42 –44,47,49 –52). Eight studies (22,29,31,42,44,49 –51) used a single-phase acquisition Tc-99m MIBI thyroid scan, and 14 studies (21,23 –28,30,43,45 –48,52) used a dual-phase method. In 16 studies (21,22,26,27,29 –31,42 –44,46,47,49 –52), a Tc-99m MIBI thyroid scan was performed in patients with cold TN, and in six studies (23 –25,28,45,48), the Tc-99m MIBI thyroid scan was performed in patients with indeterminate FNAC. Five studies (25 –27,47,48) used a semi-quantitative method for interpretation of the Tc-99m MIBI thyroid scans, and 15 studies (21 –24,28 –31,42 –46,49 –52) used a visual interpretation method. The semi-quantitative analysis group used the washout index (WOind) (25), retention ratio (RR) (26), retention index (RI) (27, 28), and tumor to normal ratio (T/N) (47) as semi-quantitative indexes. The principal characteristics of the 22 studies included in the meta-analysis are included in Table 1. To assess possible publication bias, Deeks's funnel plot asymmetry tests were designed. The nonsignificant slope indicates that no significant bias was found. The p-value was 0.93 (Fig. 2).
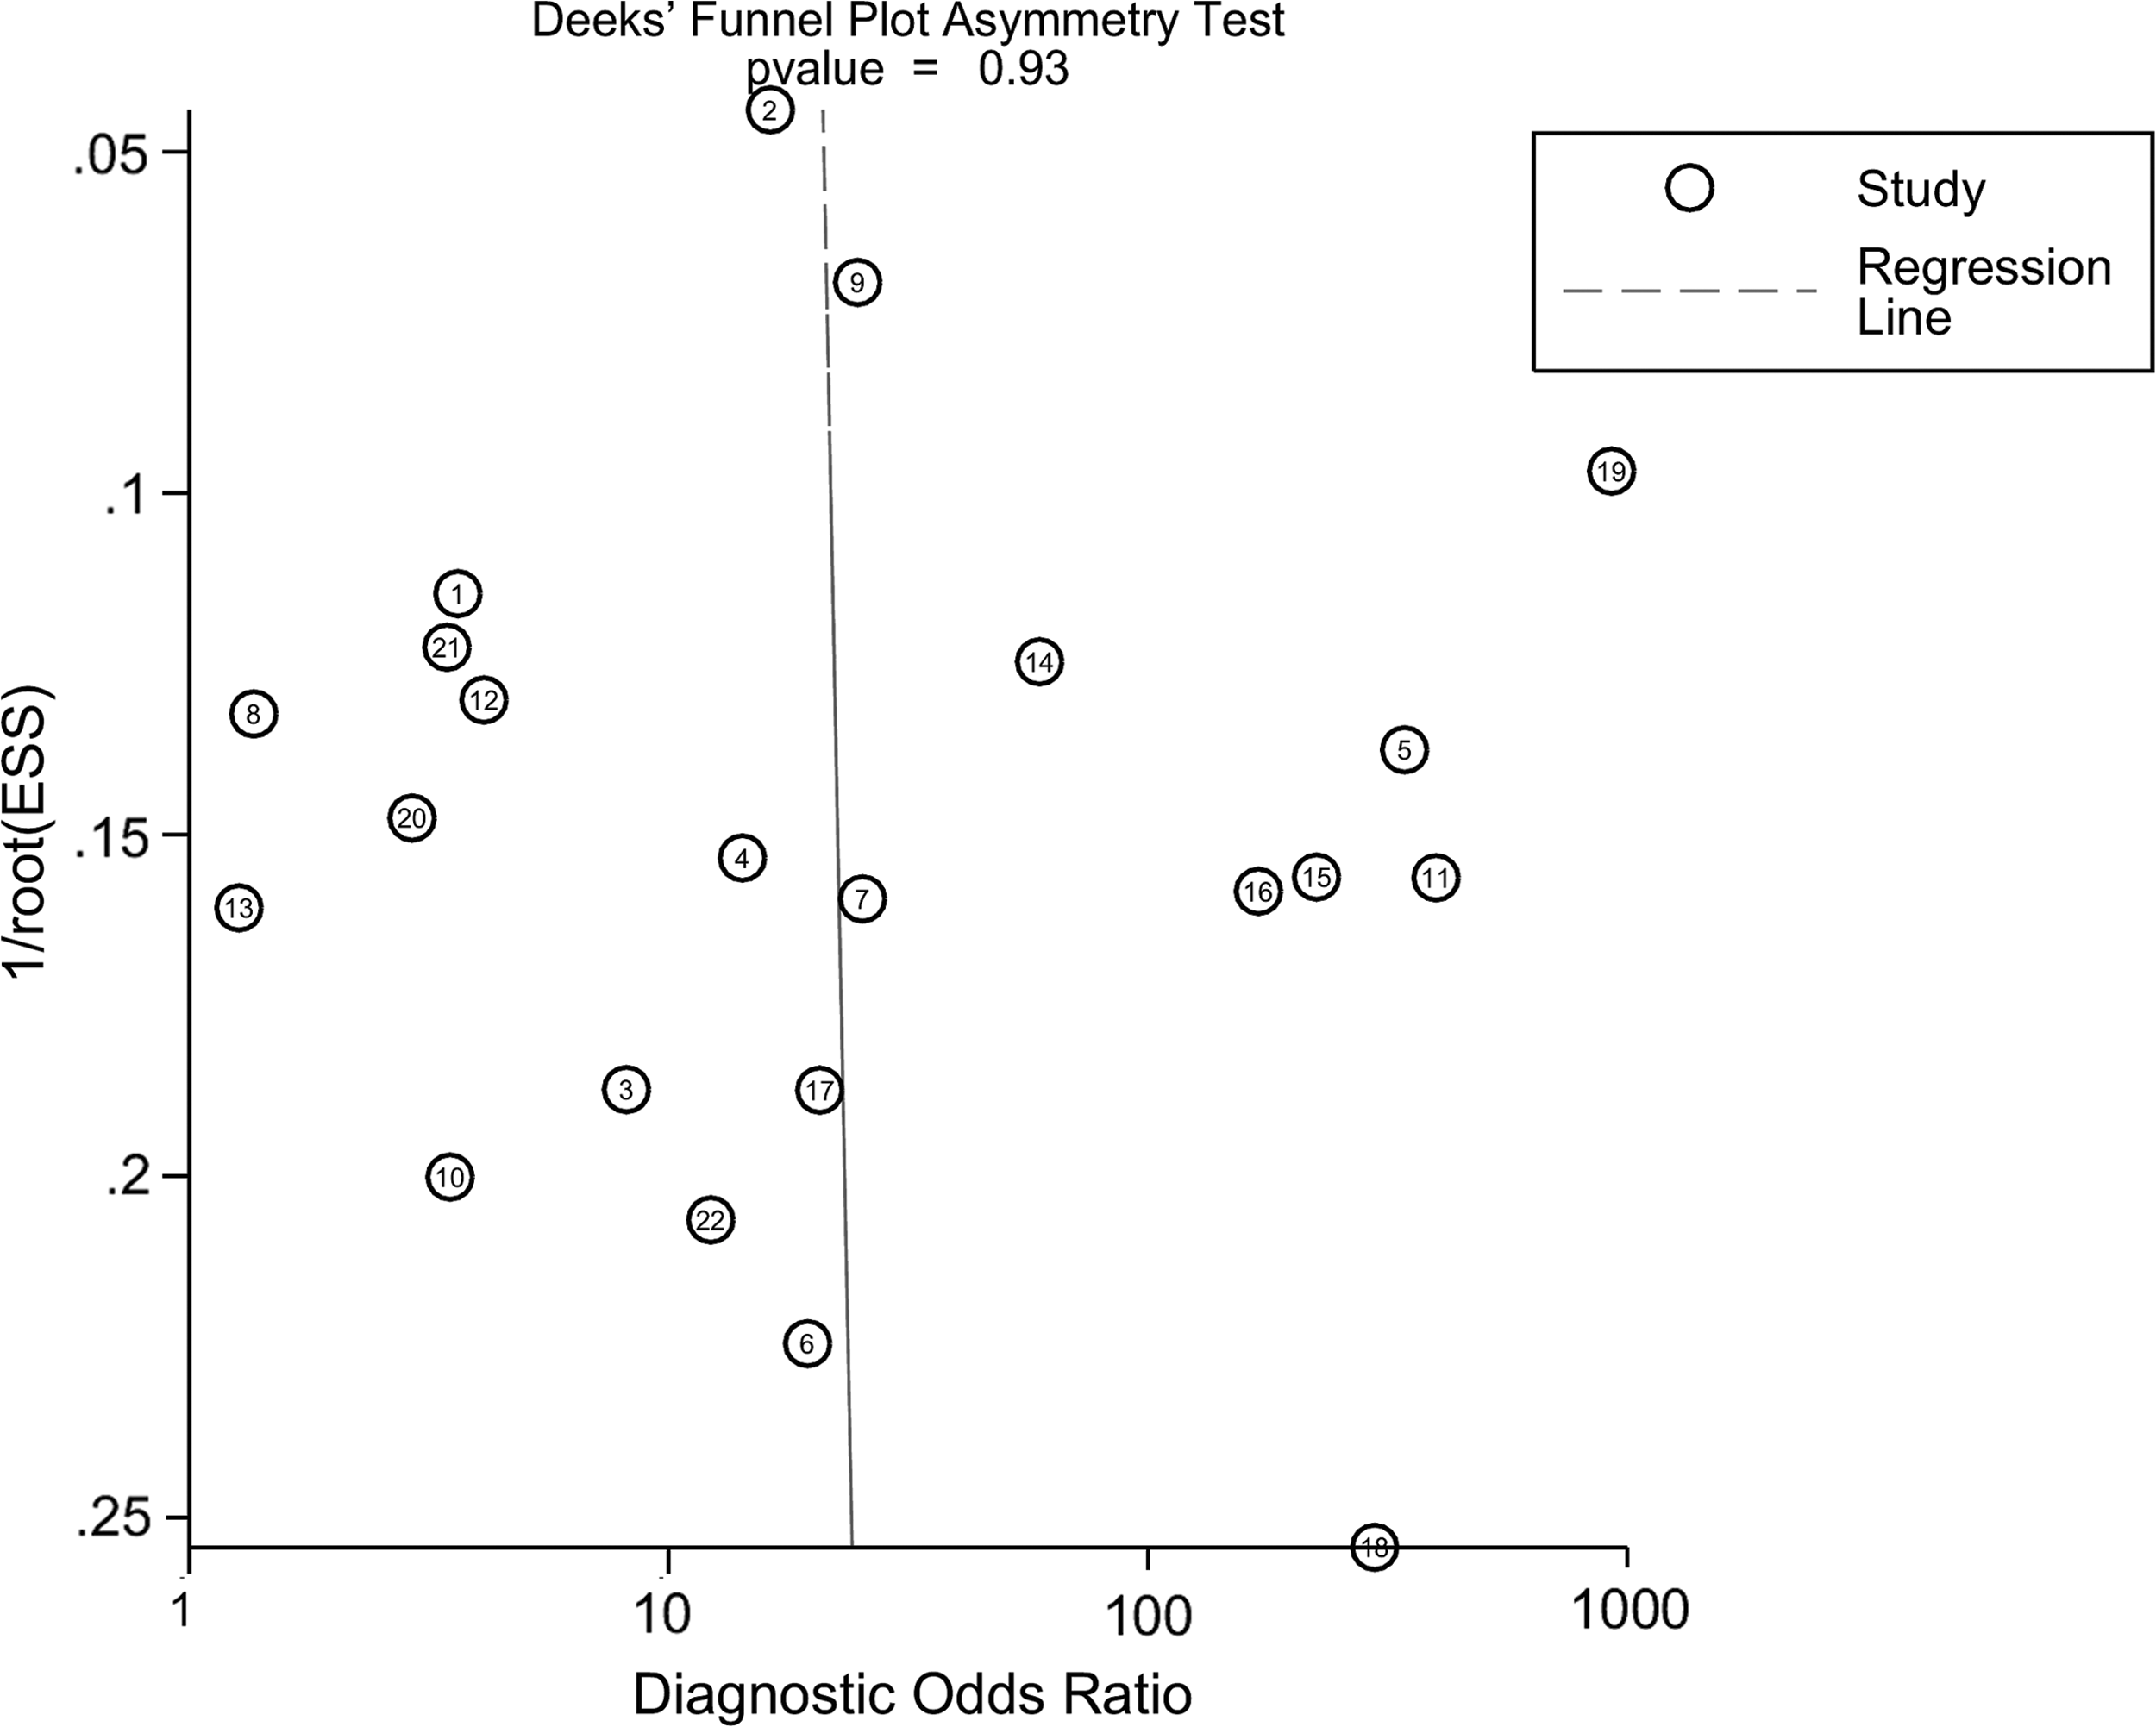
Results of Deeks's funnel plot of asymmetry test for publication bias. Nonsignificant slope indicates that no significant bias was found. ESS, effective sample size.
Methodological quality assessment
Figure 3 shows the risk of bias and applicability concerns summary of the included studies, and overall the quality of the included studies was deemed satisfactory.
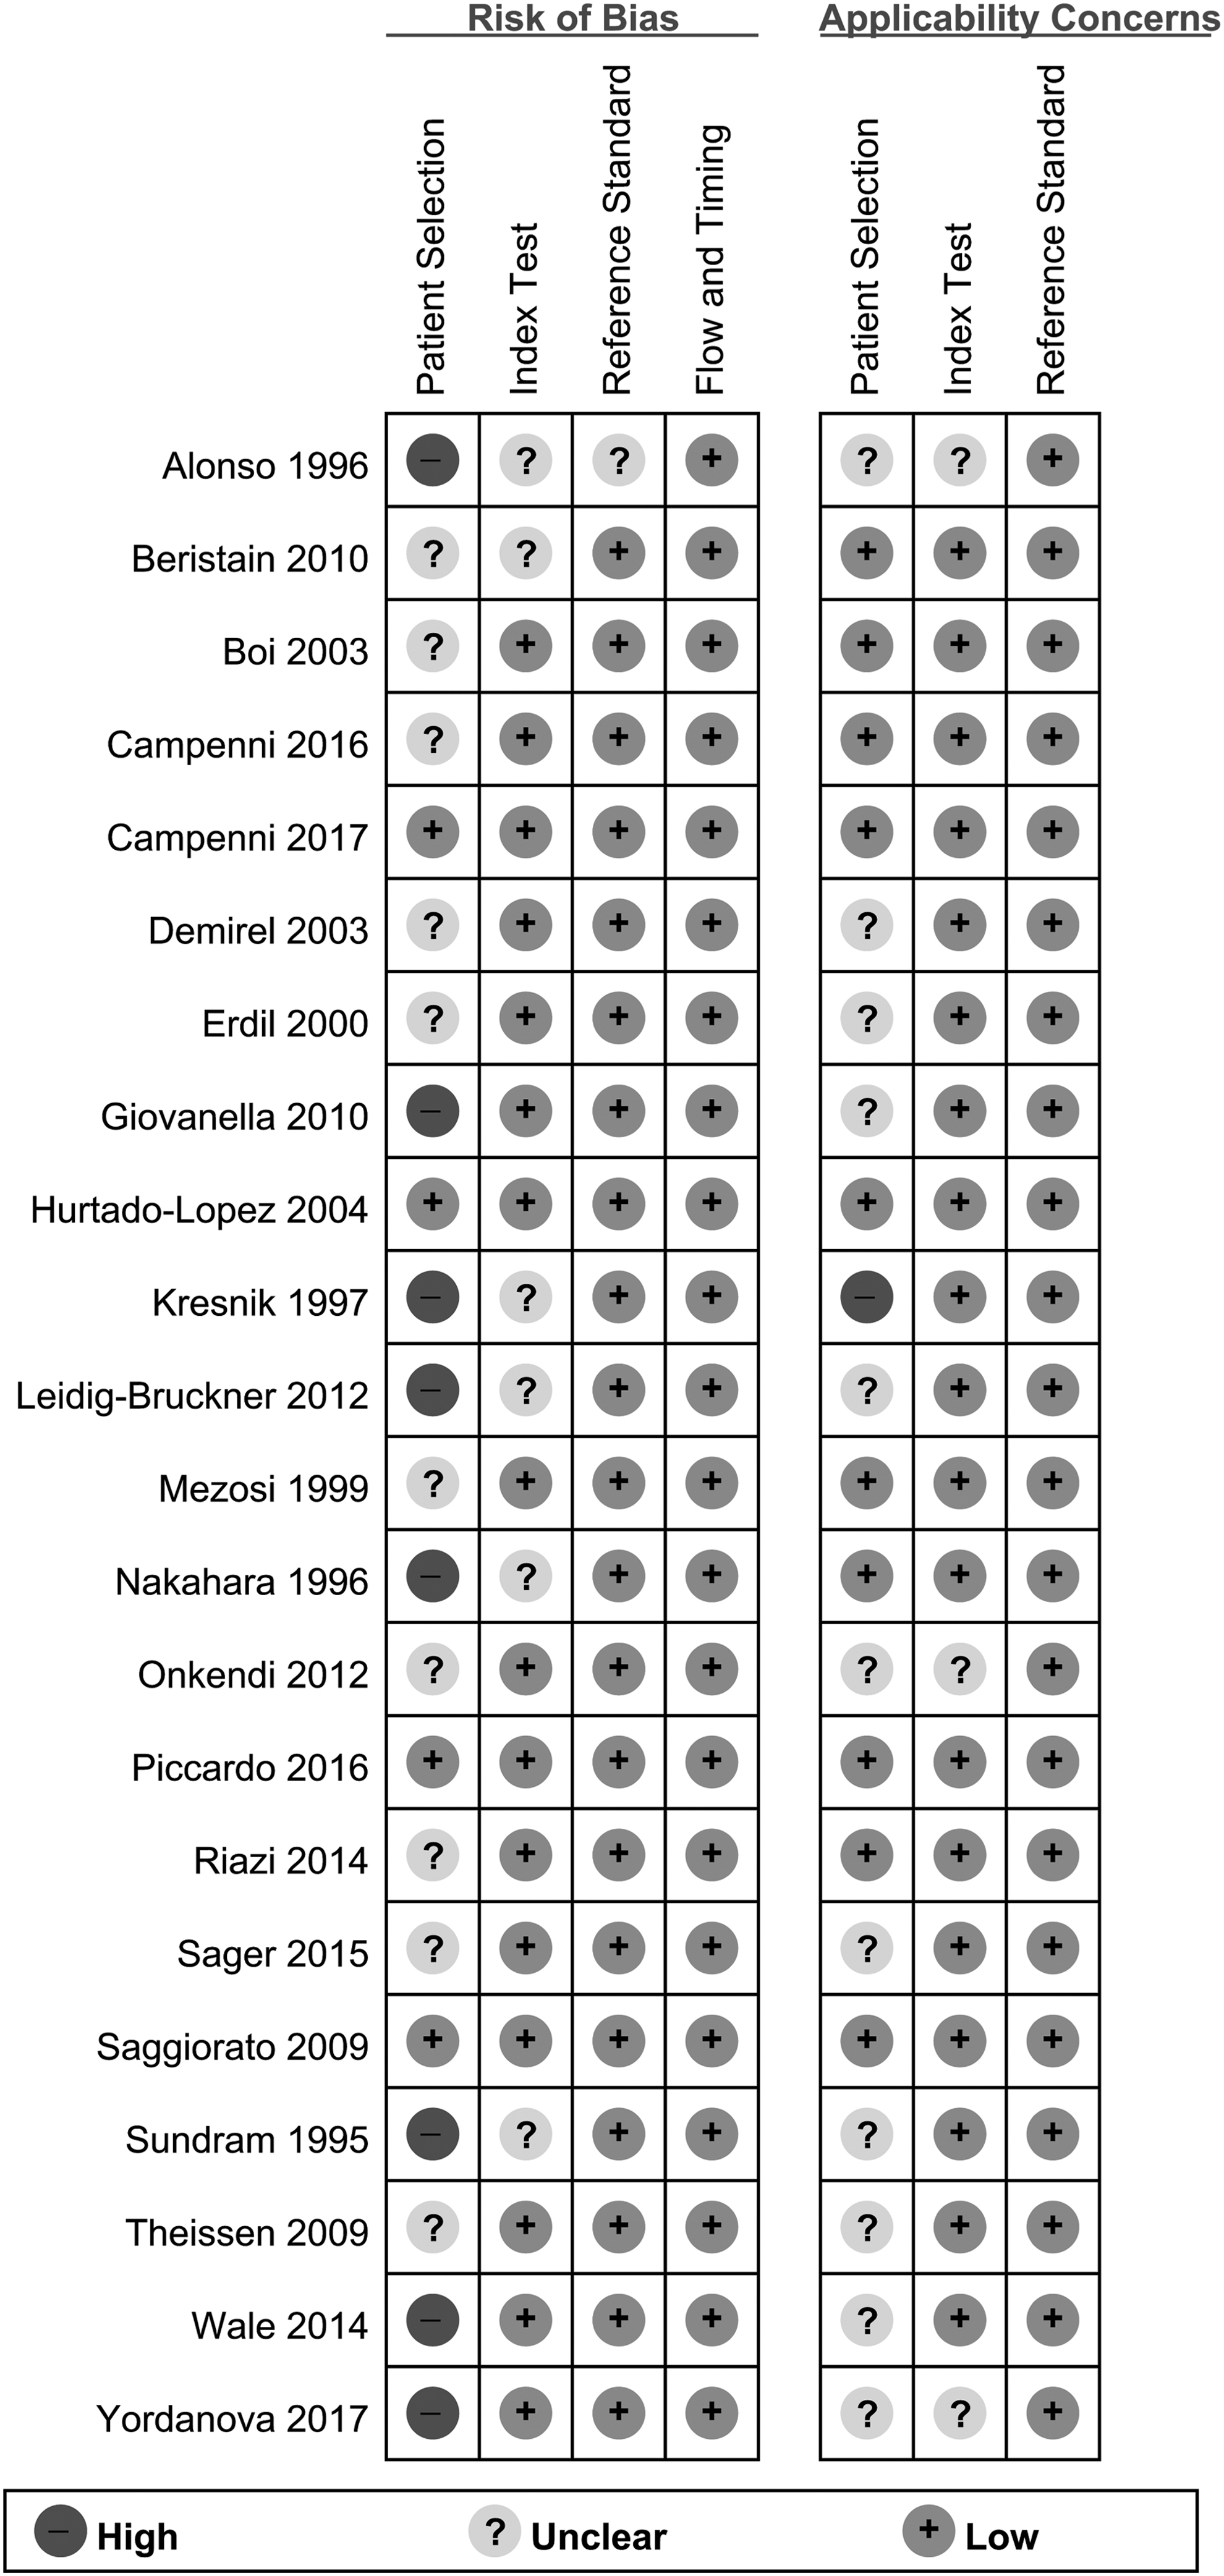
Risk of bias and applicability concerns summary.
Diagnostic accuracy of Tc-99m MIBI thyroid scan
The diagnostic performance results of Tc-99m MIBI thyroid scans for the characterization of TN in the 22 included studies in the meta-analysis are presented in Figure 4. The pooled sensitivity for Tc-99m MIBI thyroid scan was 0.87 [CI 0.76–0.93] with heterogeneity (I 2 = 92.3 [CI 90.15–94.64]) and a pooled specificity of 0.78 [CI 0.67–0.86] with heterogeneity (I 2 = 96.4 [CI 95.62–97.28]). LR syntheses gave an overall LR+ of 4.0 [CI 2.5–6.3] and LR– of 0.17 [CI 0.09–0.32]. The pooled DOR was 24 [CI 63–176]. Forest plots of the sensitivity and specificity of Tc-99m MIBI thyroid scans for the differentiation of benign and malignant TN are shown in Figure 4. Figure 5 shows the hierarchical summary receiver operating characteristic (ROC) curve and indicates that the area under the curve was 0.90 [CI 0.87–0.92].
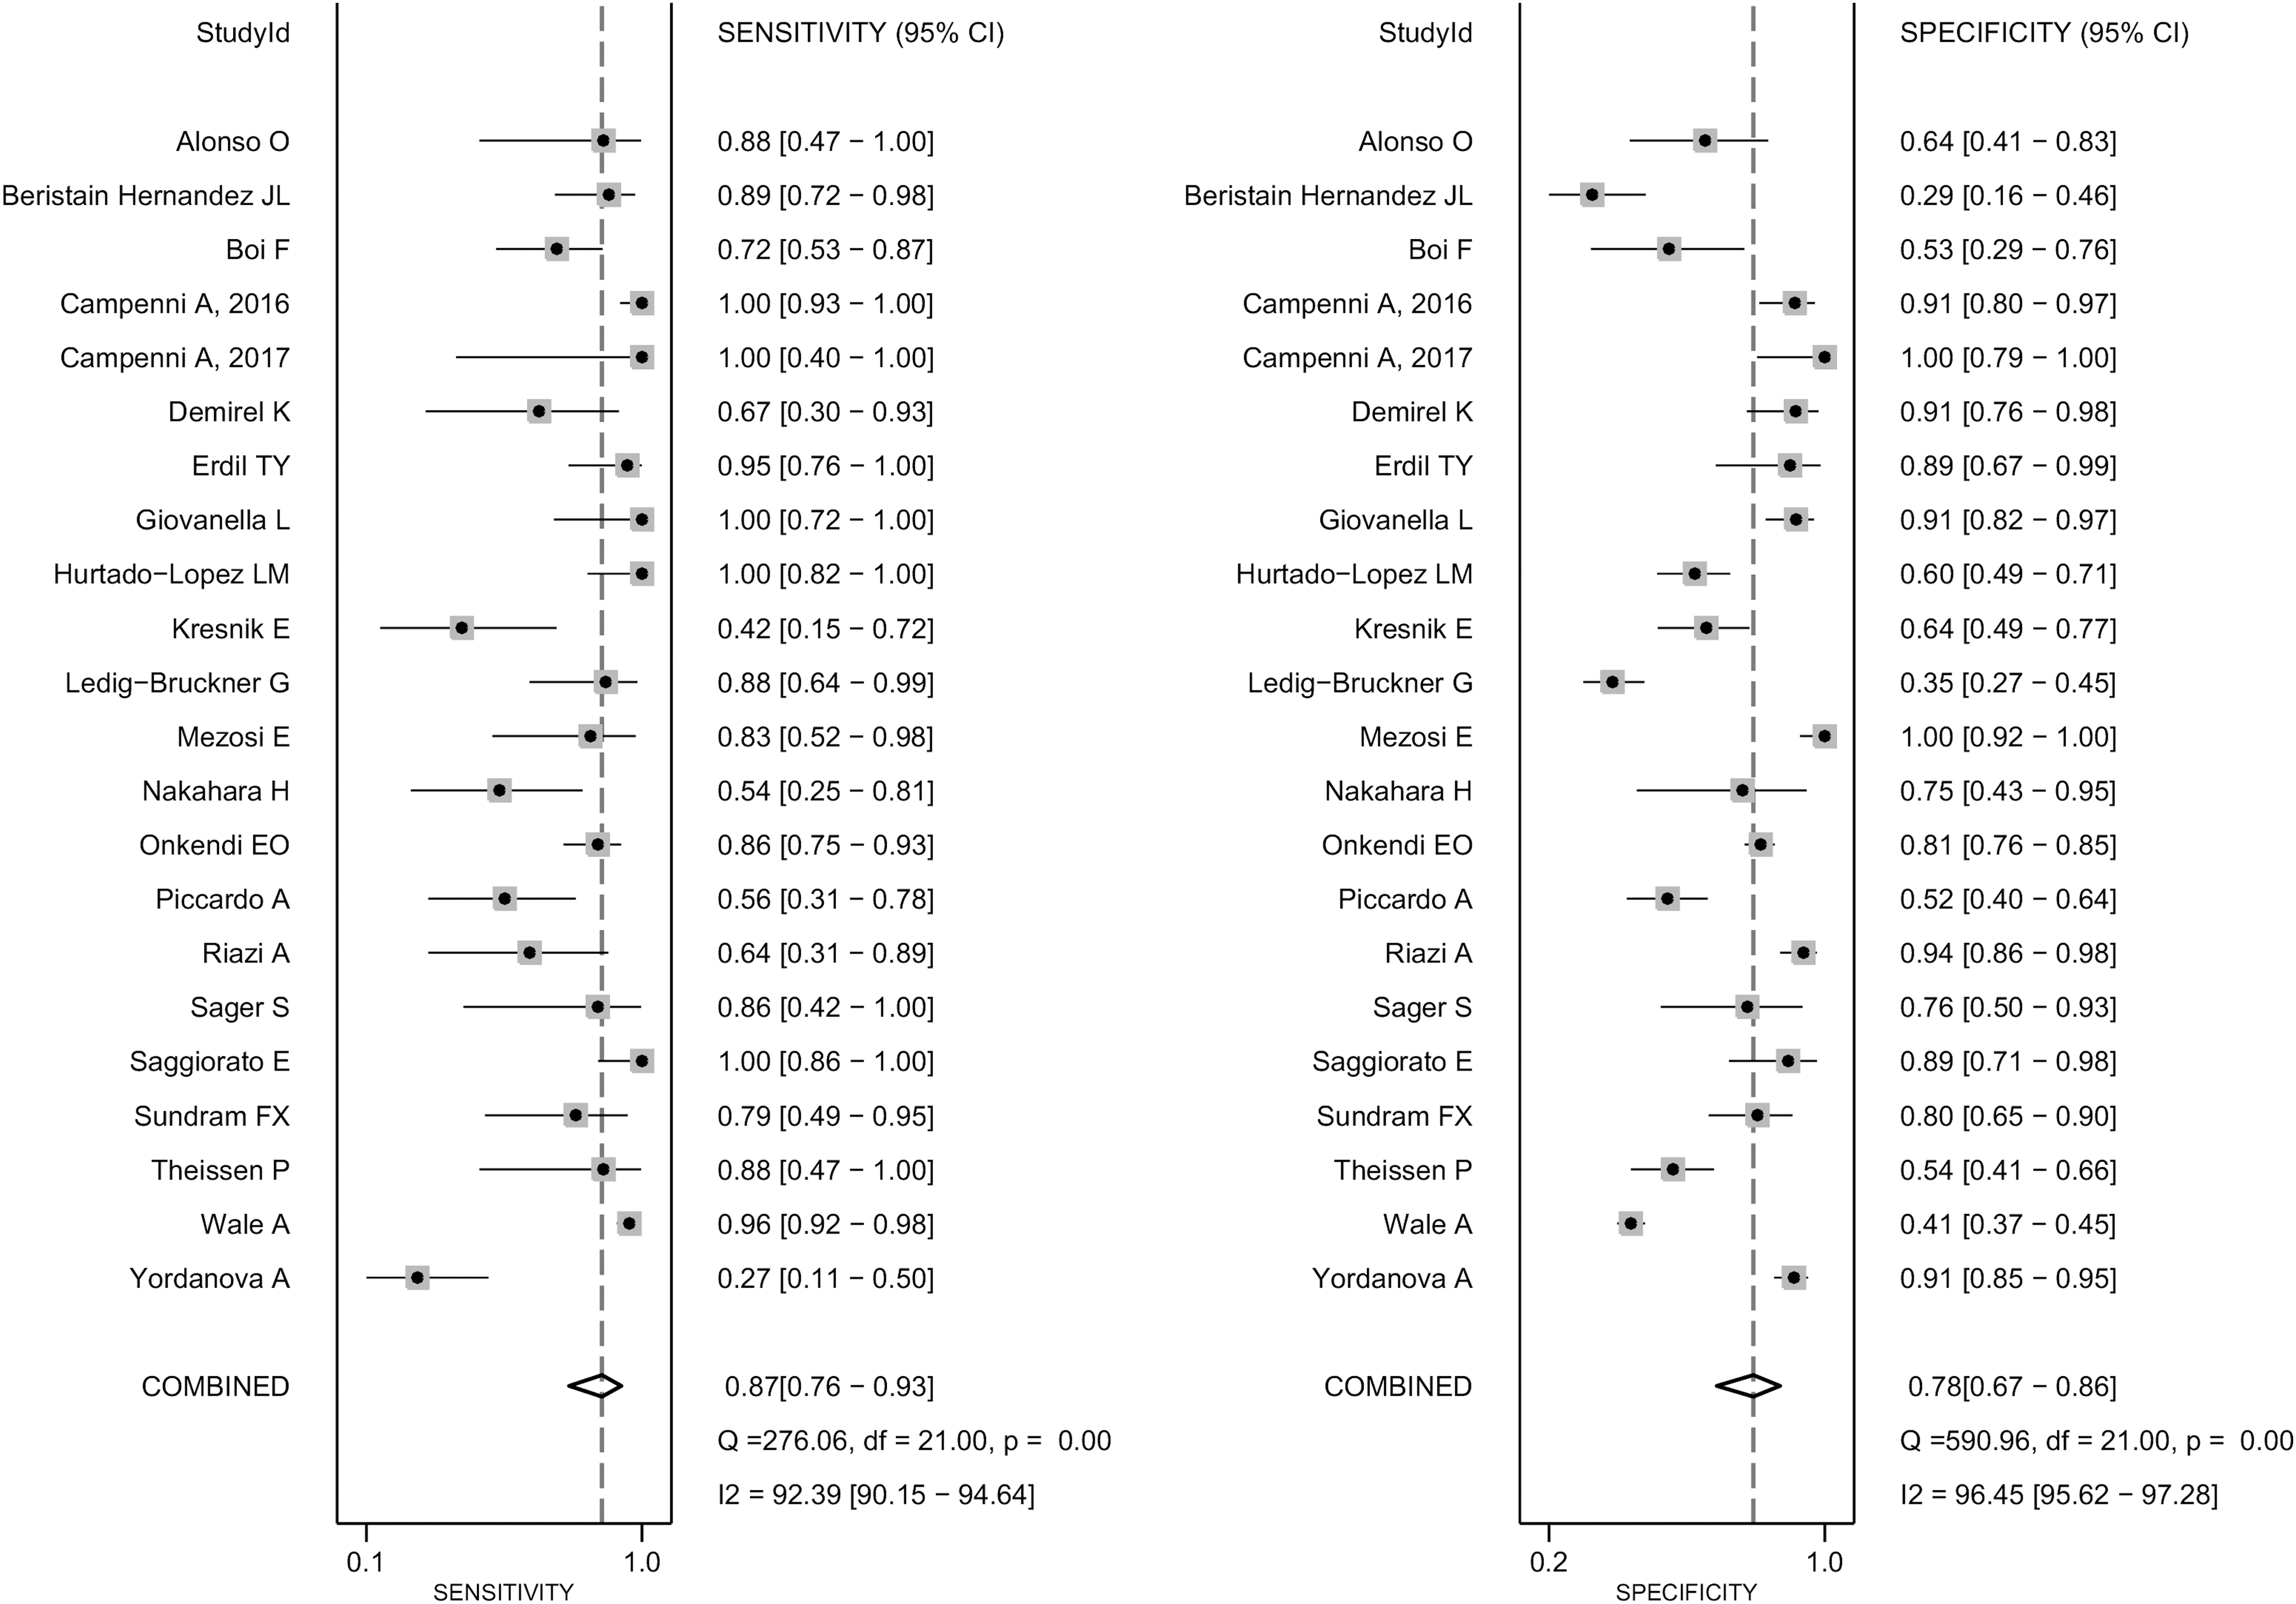
Forest plot of pooled sensitivity and specificity of Tc-99m MIBI thyroid scan for differentiation of malignant TN.
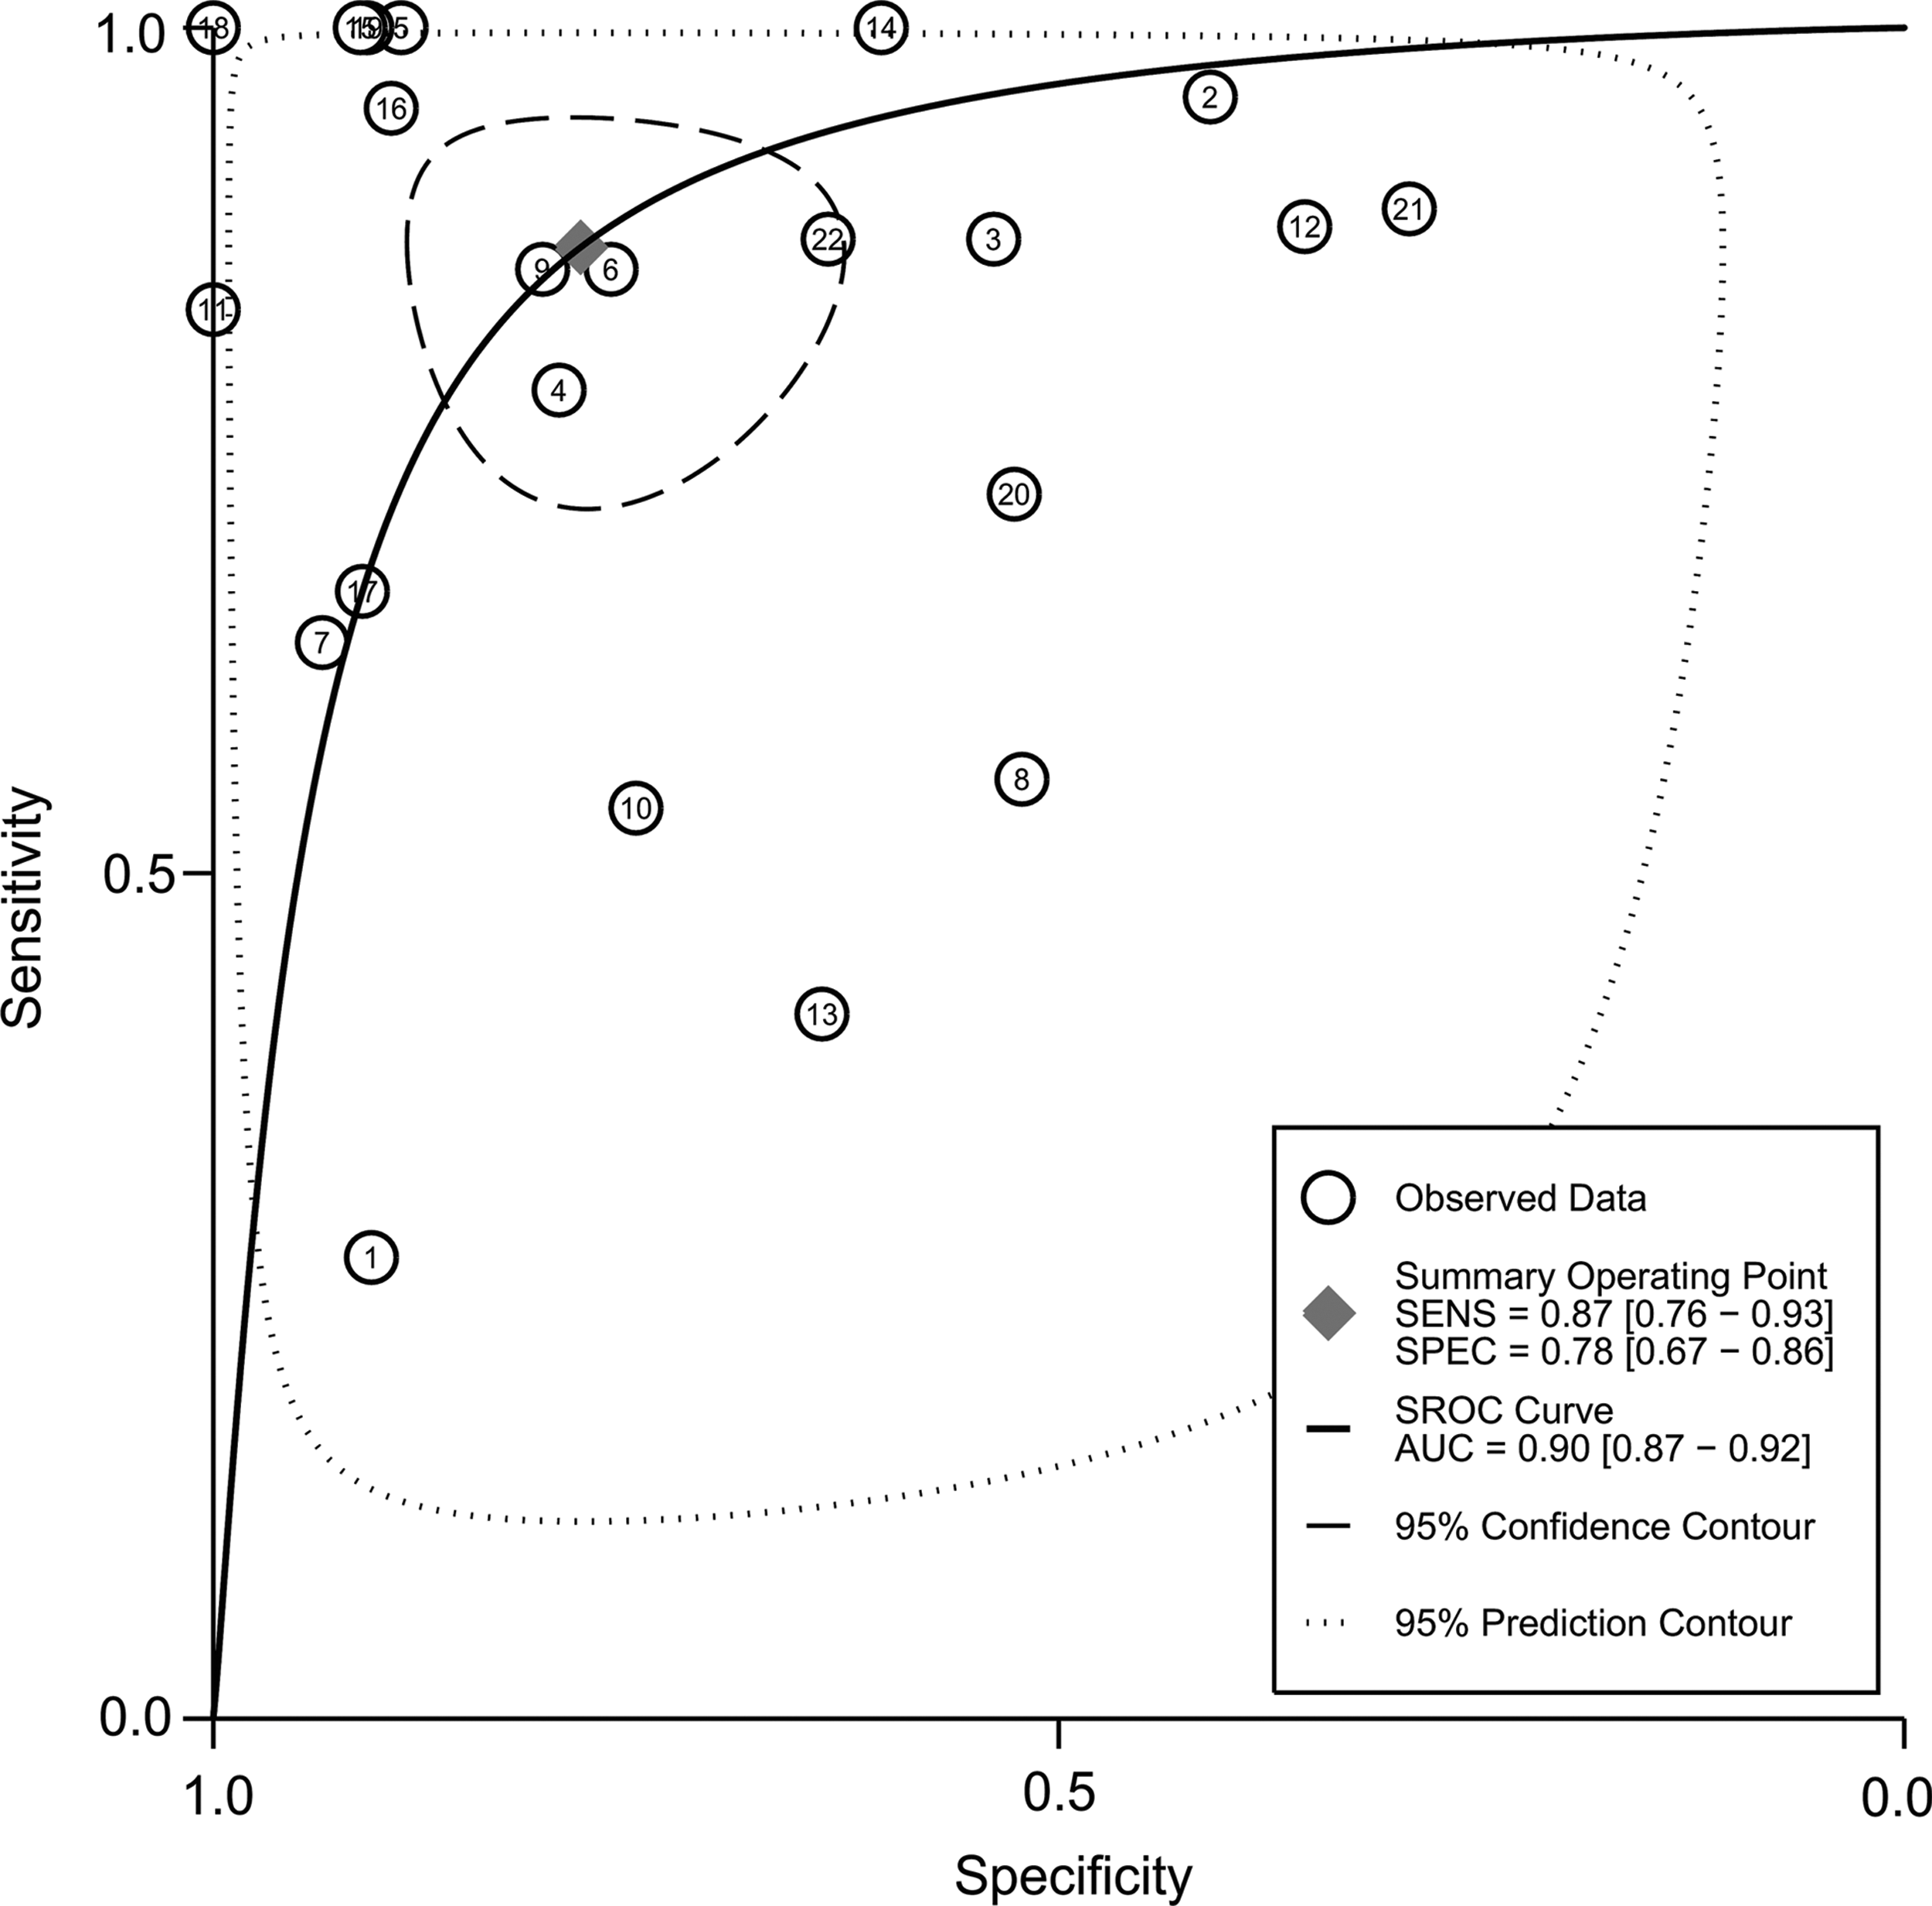
Hierarchical summary receiver operating characteristic (HSROC) curves of Tc-99m MIBI thyroid scan for differentiation of malignant TN.
Heterogeneity evaluation and meta-regression analysis
Between-study heterogeneity was present for sensitivity and specificity among studies using Tc-99m MIBI thyroid scans for the characterization of TN. A meta-regression analysis was performed to explore other sources of heterogeneity in the studies using Tc-99m MIBI thyroid scans. Meta-regression showed that no definite variable was the source of heterogeneity in the current meta-analysis (Table 2).
Number of patients (1, >65 vs. 0, ≤65); study design (1, prospective vs. 0, retrospective); thyroid scan method (1, dual phase vs. 0, single phase); interpretation (1, visual vs. 0, semi-quantitative analysis); analysis (1, patient based vs. 0, lesion based); publication year (1, after 2000 vs. 0, before 2000); indication of Tc-99m MIBI (1, cold thyroid nodule vs. 0, indeterminate cytology).
Regression coefficient.
p-Value of random effect meta-regression using maximum likelihood estimation (ML) between study variances and the weighted least squares of study size for regression model estimation.
DOR, diagnostic odds ratio; SE, standard error; CI, confidence interval.
LR scattergram
Figure 6 shows the LR scattergram, which displays the summary point of LRs obtained as functions of mean sensitivity and specificity in the right lower quadrant, suggesting that Tc-99m MIBI thyroid scan is not useful for the diagnosis of a malignant TN (when positive) of for the exclusion of a malignant lesion (when negative).
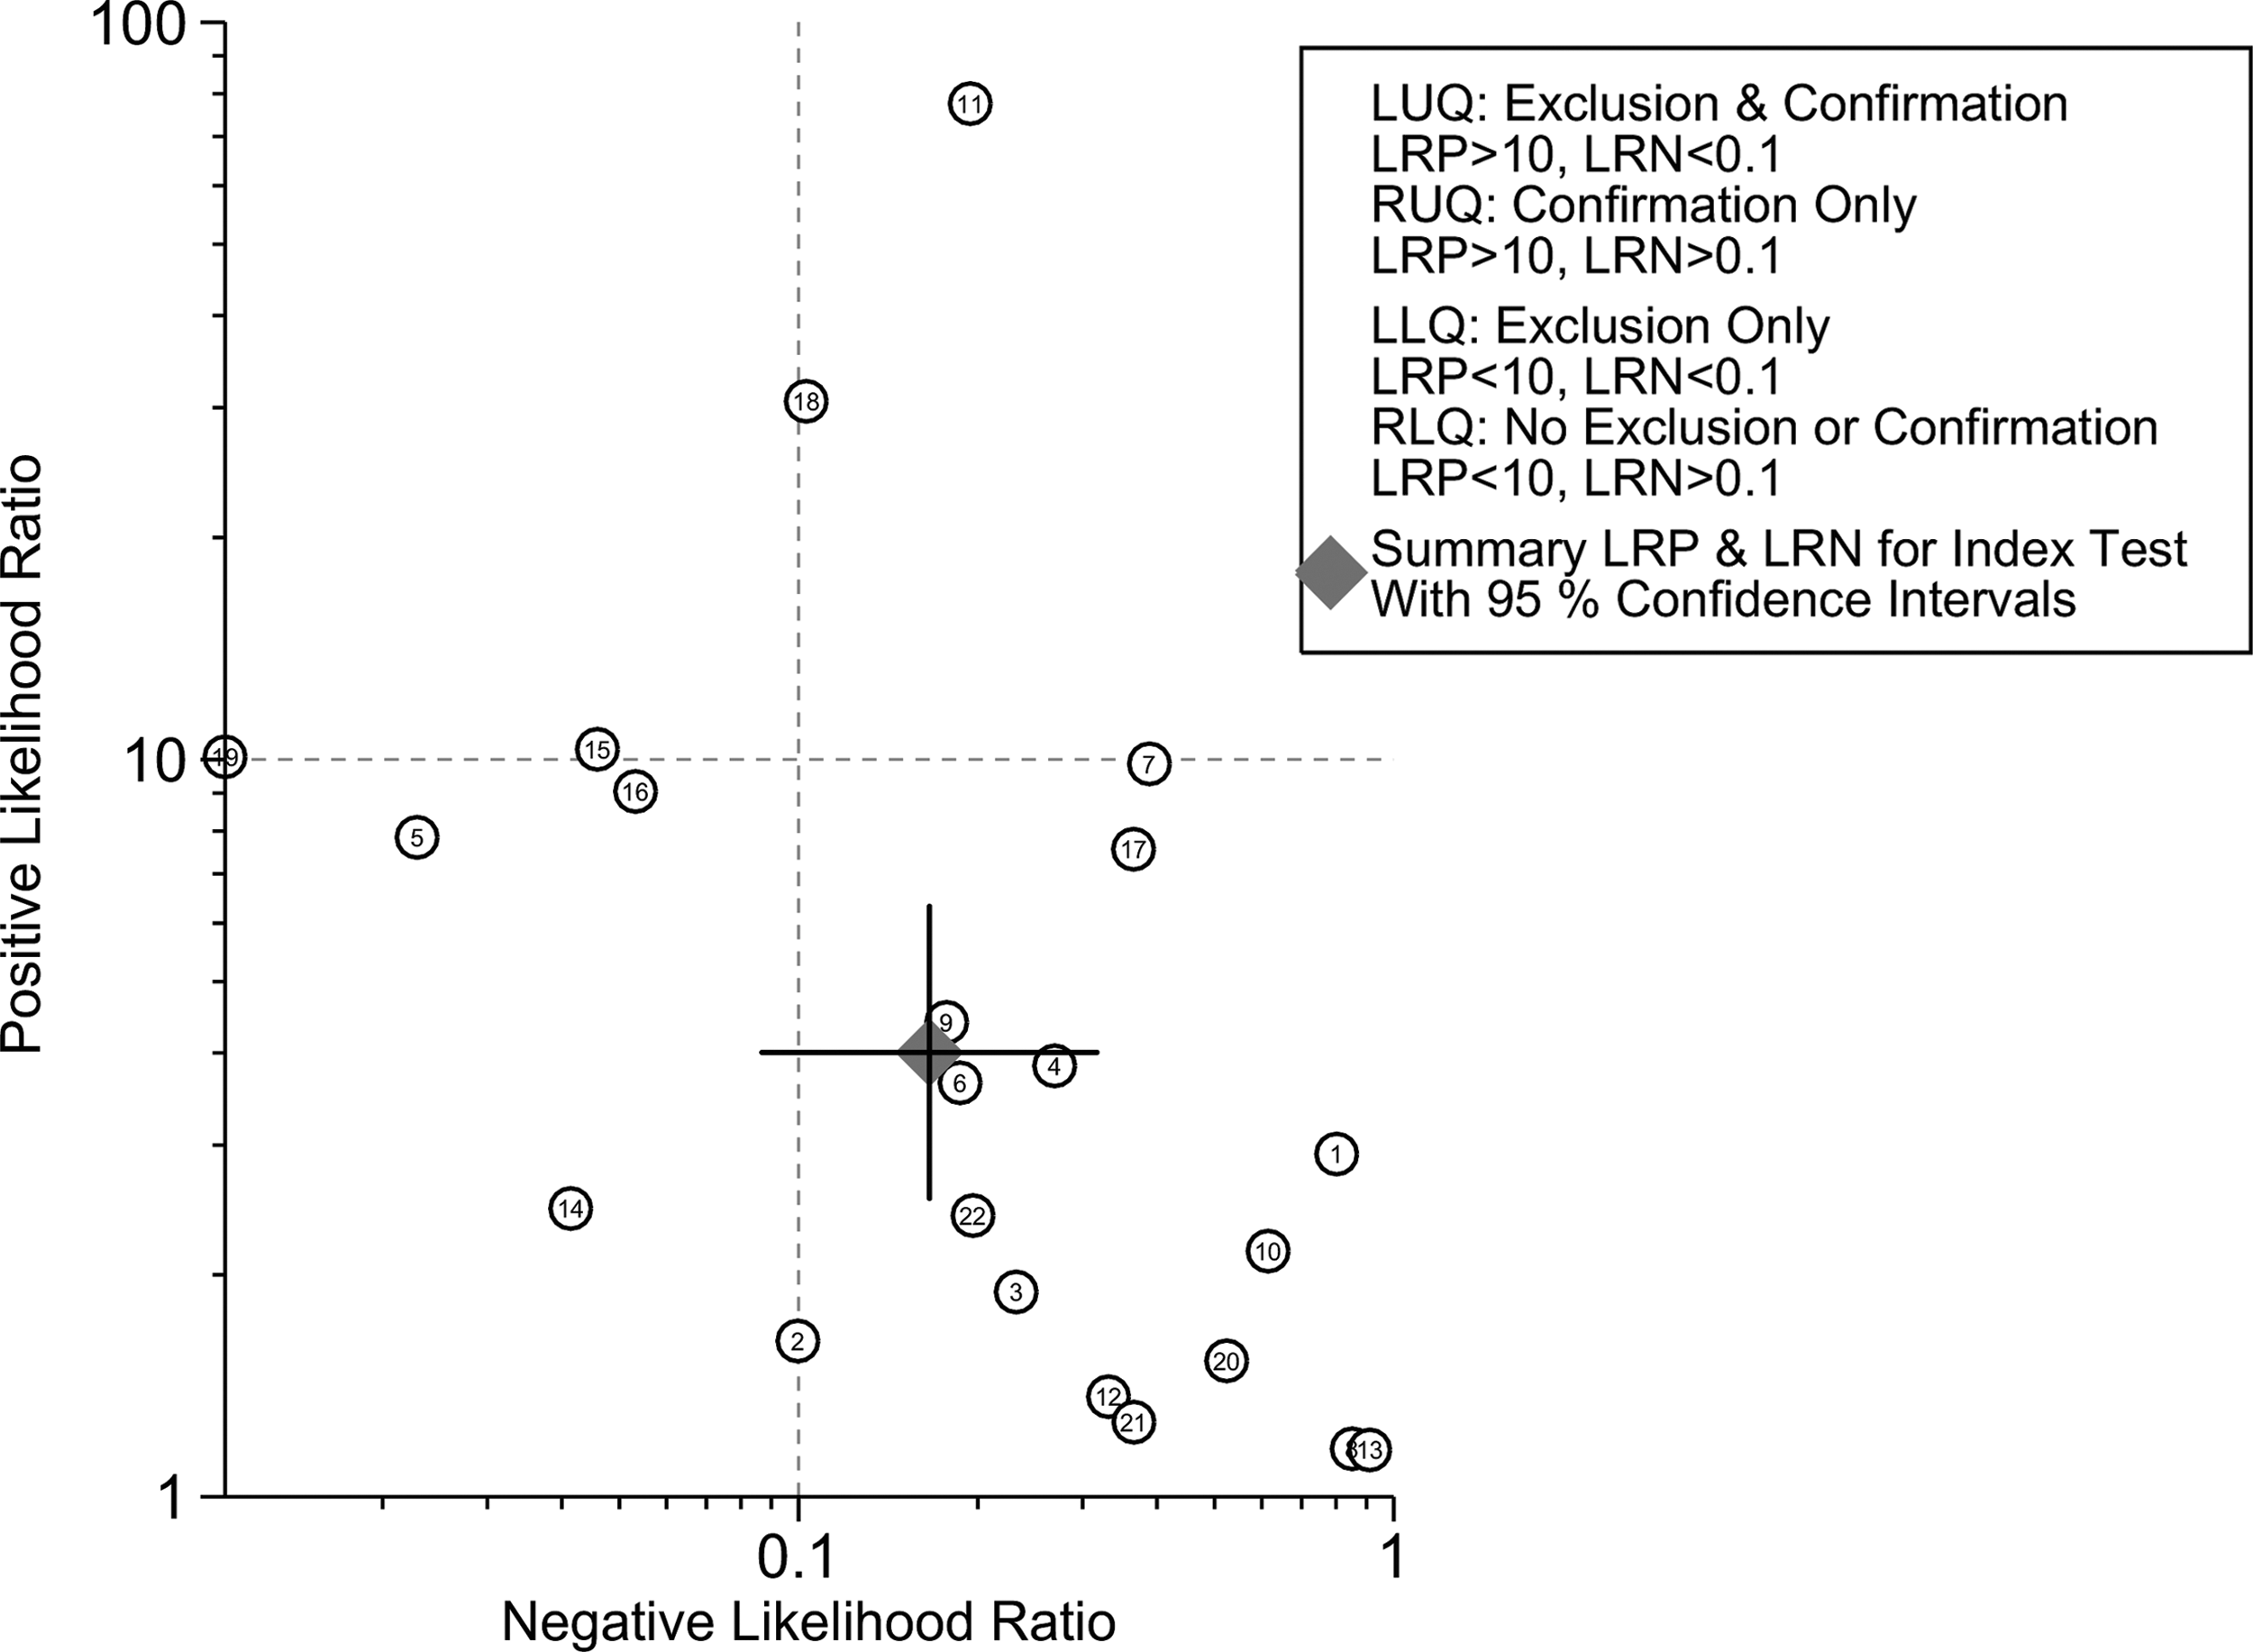
Likelihood ratio scattergram of Tc-99m MIBI thyroid scan for differentiation of malignant TN.
Discussion
The current meta-analysis reveals a moderate sensitivity and specificity of Tc-99m MIBI thyroid scans for the characterization of TN. Moreover, the DOR was relatively low, and the LR scattergram indicates that Tc-99m MIBI thyroid scanning is not useful for the diagnosis of a malignant TN or for its exclusion.
TNs are common, occurring in at least 4–7% of the population (53). Most TNs are benign lesions, but up to 20% of TNs are thyroid carcinomas, and the risk of malignancy has been estimated to be approximately 4% (54,55). The goal of evaluating a TN is to determine whether it is malignant. Early detection and diagnosis are crucial for an optimal treatment, since delays in diagnosis can be associated with increased mortality (56). The initial evaluation of TN includes US, measurement of TSH, and FNAC. Although FNAC is considered to be the gold standard for the evaluation of a TN, a number of reports have shown that between 10% and 30% of FNAC results are reported as indeterminate findings (7).
Tc-99m MIBI scanning has been proposed as an imaging modality to evaluate the risk of malignancy in cold TN (21,26,27,29,30,42,49,50). An early study in suspicious TN showed that Tc-99m MIBI uptake was not specific for thyroid cancer and that the uptake depends on the viability of the thyroid tissue (57). Some previous studies reported a high sensitivity and specificity of Tc-99m MIBI thyroid scanning for the differentiation of benign and malignant TN (24,25,27,28,48). Contrarily, other studies reported a low sensitivity (30,43,45,52) and a low specificity (22,23,31,45,50,51). Comparing Tc-99m MIBI scanning and FNAC, Tc-99m MIBI has been reported to have a very high negative predictive value ranging from 88% to 100%, with a mean of 97% (51). Furthermore, Tc-99m MIBI scanning for the evaluation of TN may lead to considerable cost savings (51) while not significantly affecting outcomes such as life expectancy (51).
A recent meta-analysis and systematic review by Treglia et al. found that the pooled sensitivity and specificity of Tc-99m MIBI scan in detecting malignant thyroid nodules was 85.1% [CI 81.1–88.5%] and 45.7% [CI 42.7–48.7%], respectively (58). The authors suggested that Tc-99m MIBI scan is a sensitive diagnostic tool in predicting malignancy in TN. Therefore, this imaging method could be helpful in patients with TN in which malignancy is suspected on the basis of conventional diagnostic techniques. Although Treglia et al. suggested that Tc-99m MIBI scanning is useful for the prediction of malignancy in TN, the authors reported a high heterogeneity of sensitivity and specificity in their meta-analysis (58). However, they did not explore the potential sources of heterogeneity of their meta-analysis. Furthermore, without any basis, they performed subgroup analysis of Tc-99m MIBI scan for predicting malignancy in TN. Moreover, they did not report the pooled DOR of Tc-99m MIBI scans and just reported an AUC of 0.81 in their ROC analysis, which is lower than the one found in the present study. A lower DOR was found in the current meta-analysis, and the SROC curve shows a broad and wide 95% prediction contour. In contrast to the study by Treglia et al. (58), a LR scattergram analysis was conducted, which demonstrates that Tc-99m MIBI thyroid scanning is not useful for the diagnosis of a malignant TN (when positive) or for its exclusion (when negative).
The criteria for the interpretation of Tc-99m MIBI thyroid scans are also a major concern in the characterization of TN. The use of a semi-quantitative index based on Tc-99m MIBI thyroid scans has been attempted previously, and Saggiorato et al. showed how a semi-quantitative analysis greatly improved the diagnostic accuracy of positive Tc-99m MIBI scans, showing a better sensitivity and specificity than visual analysis in differentiating benign from malignant TN in patients with non-oncocytic follicular lesions (100% and 90.48% vs. 73.33% and 80.95%).
The current meta-analysis showed a considerable heterogeneity of sensitivity and specificity between studies. The included studies were statistically heterogeneous in their estimates of sensitivity and specificity. This heterogeneity is likely caused by diversity in methodological aspects between different studies, and differences between the patients in the included studies may also have contributed to the observed heterogeneity of the results. A further major limitation is the considerable heterogeneity of the interpretation criteria of Tc-99m MIBI thyroid scans for the characterization of TN in the included studies (i.e., visual analysis vs. quantitative analysis). However, in meta-regression analysis of the current review, the interpretation criteria of Tc-99m MIBI thyroid scans did not result in heterogeneity. To minimize bias in the selection of studies and in the data extraction, reviewers who were blinded to the journal, author, institution, and date of publication independently selected articles based on the inclusion criteria, and scores were assigned to study design characteristics and examination results by using a standardized form that was based on the QUADAS2 tool (32). Also, publication bias is a major concern in all meta-analyses, as studies reporting significant findings are more likely to be published than those reporting nonsignificant results. The publication bias in the analysis was assessed by using funnel plots, which showed no definite asymmetry.
Conclusion
The current meta-analysis shows a moderate sensitivity and specificity of Tc-99m MIBI thyroid scans for the diagnosis of malignant TN. The DOR was relatively low, and the LR scattergram indicates that Tc-99m MIBI thyroid scanning is not useful for the diagnosis of a malignant TN or for its exclusion. Therefore, Tc-99m MIBI thyroid scans should be used restrictively and interpreted cautiously when assessing TN for malignancy.
Footnotes
Author Disclosure Statement
The authors declare that there is no conflict of interest that could be perceived as prejudicing the impartiality of this study.