
Abstract
Background:
The 2015 American Thyroid Association (ATA) guidelines recommend using a classification based on sonographic patterns to set the size threshold for biopsies. Each pattern is associated with a distinct estimated rate of malignancy that it was hypothesized should stratify the risk of malignancy of cytologically indeterminate thyroid nodules (ITNs).
Methods:
Ultrasound images of 463 ITNs (38% atypia/follicular lesions of undetermined significance; 62% follicular neoplasms) with histological follow-up consecutively evaluated between October 2008 and June 2015 at the authors' academic cancer center were independently evaluated by three observers and classified into one of the five sonographic patterns proposed by the ATA. Nodules with sonographic patterns not defined in the classification were grouped into a non-ATA pattern category. Differences in clinical and histological findings between the sonographic patterns were assessed. The prevalence of malignancy and odds ratio for malignancy were calculated for each sonographic pattern (low and intermediate patterns were collapsed for the analysis).
Results:
The distribution of size and cytological diagnosis was significantly different between sonographic patterns (p < 0.001). The overall rate of malignancy was 27%. The rate of malignancy for the very low, low/intermediate, high, and non-ATA patterns were 0%, 19%, 56%, and 36%, respectively, and were all significantly different. Compared to the low/intermediate suspicion patterns, the odds ratios for malignancy were 2.35 for the non-ATA and 5.18 for the high suspicion patterns (p < 0.001). The odds ratio of the non-ATA pattern was 0.45 over the high suspicion pattern (p = 0.04). Results were similar in both cytological categories and for each observer separately. Sonographic patterns were associated with distinct histopathological profiles (p < 0.001).
Conclusions:
ATA sonographic patterns are associated with distinct clinical features and pathological outcomes, and effectively stratify the cancer risk in ITNs. Thus, the ATA sonographic patterns should be used not only to set the size threshold for biopsy, but also to personalize management after the biopsy.
Introduction
T
Once a thyroid nodule is biopsied, management relies primarily on the cytological diagnosis. If cytology is benign, the nodule is usually observed; if it is malignant or suspicious for malignancy, the nodule is usually resected (1 –3). However, 20% of the biopsies render an indeterminate cytology: either atypia/follicular lesion of undetermined significance (AUS/FLUS) or follicular/Hürthle cell neoplasm (FN/HCN) (5). Although indeterminate categories of thyroid cytology encompass a very heterogeneous group of nodules, they are usually clustered for management recommendations (1,6).
Because the pretest probability influences the posttest probability of any diagnostic test, it was hypothesized that different ATA sonographic patterns associated with different rates of malignancy should be able to stratify the risk of malignancy of cytologically indeterminate thyroid nodules (ITNs; AUS/FLUS and FN/HCN). If the hypothesis held true, the ATA sonographic patterns would be useful not only to set the size threshold for biopsy, but also to personalize management after an indeterminate cytological result.
Methods
Study cohort
The charts of the patients with 3325 thyroid nodules with consecutive cytological evaluation between October 2008 and April 2015 at the authors' institution were retrospectively reviewed. Of those, 861 were AUS/FLUS or FN/HCN. The study included all nodules resected before June 2015, with clear cytological–histological correlation (i.e., the biopsied nodule matched the resected specimen by tumor size and location) and presurgical thyroid ultrasound images available for review (Fig. 1). In this retrospective Institutional Review Board–approved study, a waiver of consent was granted.
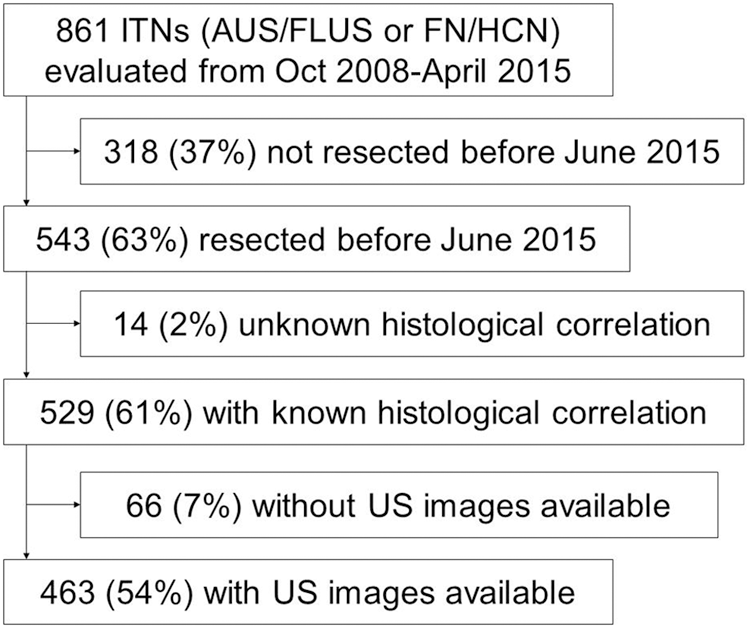
Cohort selection process. AUS/FLUS, atypia/follicular lesion of undetermined significance; FN/HCN, follicular/Hürthle cell neoplasm; ITNs, cytologically indeterminate thyroid nodules (AUS/FLUS and FN/HCN); US, thyroid ultrasound.
Sonographic evaluation
Images of all thyroid ultrasounds were independently reviewed by three observers: one endocrinologist and two radiologists. A list with the medical record number, date of last thyroid ultrasound before surgery, nodule location, and tridimensional size was facilitated to ensure evaluation of the same nodule in the same exam by all observers. Presurgical neck ultrasound was also reviewed when available. Composition, echogenicity, margins, calcifications, extrathyroidal extension, and presence of suspicious lymph nodes (when cervical ultrasound was available) were assessed in all nodules blinded to the final histological results. The following were considered suspicious sonographic features: hypoechogenicity; irregular, microlobulated, or infiltrative margins; microcalcifications or interrupted rim calcifications; presence of extrathyroidal extension; presence of suspicious lymph nodes; and shape taller than wide in the transverse view. Echogenicity was classified into four categories: hypoechogenicity, isoechogenicity, hyperechogenicity, and heterogeneous echogenicity (heteroechogenicity) with respect to the normal thyroid parenchyma. Composition was classified into four categories: solid (or predominantly solid), mixed, cystic, or spongiform. Margin was classified into four categories: regular, irregular, microlobulated, and infiltrative. Calcifications were classified into: none; microcalcifications; macrocalcifications; micro- and macrocalcifications; rim calcifications; interrupted rim calcifications; and comet tails. Extrathyroidal extension and suspicious lymph nodes were classified into two groups: present or absent. The shape of the nodule was classified as taller than wide or wider than tall in the transverse view based on the tridimensional measurements given to locate the nodule. Thus, the interpretation of this feature was the same for all observers. It was considered taller than wide in the transverse view when the measurement difference was ≥2 mm to avoid small artifactual differences.
Nodules were classified into the 2015 ATA sonographic patterns using the description of the sonographic features (1). Spongiform or partly cystic nodules without eccentric solid areas or other suspicious features were classified as very low suspicion sonographic pattern. Nodules interpreted as pseudonodules during imaging review (one nodule overall) were also considered very low suspicion pattern and were grouped with this category for analysis. Iso- or hyperechoic solid or partly cystic nodules with eccentric solid areas without suspicious features were classified as low suspicion pattern. Hypoechoic solid nodules without other suspicious features were classified as intermediate suspicion pattern, whereas in the presence of at least one other suspicious feature they were classified as high suspicion pattern. Other scenarios not described in the 2015 ATA classification were grouped into a separate category that will be referred to as non-ATA patterns. These scenarios included heteroechoic nodules with or without other suspicious features and iso- or hyperechoic nodules with at least one suspicious feature.
The final interpretation of each sonographic feature and of the sonographic pattern was done by consensus of two or more observers. When there was no consensus (at least two observers) through the independent assessment, the image was reviewed jointly and a consensus reached.
Pathological evaluation
The cytological diagnosis of all specimens was done by board-certified cytologists at the authors' institutional Department of Anatomic Pathology. All cytological diagnosis followed the 2009 Bethesda System for Reporting Thyroid Cytopathology (7). Histological diagnosis was issued by board-certified pathologists at the Department of Anatomic Pathology with experience in head and neck pathology in 451 (97%) nodules, and was retrieved from external reports in another 12 (3%). Histology was reviewed blinded to ultrasound characteristics in all cases with malignant diagnosis, with slides available for review (87%; 110/126). Follicular variant papillary thyroid carcinomas (FVPTCs) were reclassified as noninvasive follicular thyroid neoplasms with papillary-like nuclear features (NIFTPs) or as conventional variant of papillary thyroid carcinoma (CVPTC) as appropriate (8). The last cytological diagnosis was used for cytological–histological correlation in nodules with multiple biopsies. Resected nodules with an unclear cytology–histology correlation were excluded from the study.
Malignancies were classified into three groups according to their histological features. Low-risk cancers were defined as completely excised intrathyroidal T1–T2 differentiated thyroid carcinomas, without vascular invasion (<4 foci for minimally invasive follicular thyroid carcinomas [FTCs]), clinical N0 (includes patients with ≤5 lymph node metastases all ≤2 mm), and without distant metastasis. High-risk cancers were differentiated thyroid carcinomas with any of the following: gross extrathyroidal extension, lymph node metastases >1 cm or in the lateral compartments, or distant metastases. Medullary thyroid carcinomas were also considered high-risk cancers. All other thyroid malignancies were considered intermediate-risk.
Statistical analysis
All analyses were performed using SAS v9.4 (SAS Institute, Cary, NC) and R v3.3.1 (The R Foundation for Statistical Computing, Vienna, Austria). Descriptive statistics and percentages are presented in the tables. Comparisons were performed using chi-square tests and Fisher's exact tests for categorical variables. The Van der Waerden one-way analysis test was used to compare means of continuous measures. Odds ratios (ORs) and associated confidence intervals (CIs) were calculated from the contingency tables and could not be calculated for the very low suspicion sonographic pattern due to absence of events. p-Values were adjusted for multiple comparisons with Holms' method. They are two-sided and were considered statistically significant at the 0.05 level.
NIFTPs are considered premalignant lesions and thus surgical disease. However, these tumors do not fit well into the binary benign versus malignant histology. Thus, rates of malignancy and ORs were calculated in duplicate, with NIFPTs considered benign and with NIFTPs considered malignant.
Results
Study cohort
A total of 463 ITNs in 415 patients were included in this study. The mean age at the time of biopsy was 53 years, and 76% (n = 317) were female (Table 1). Thyroid function was unknown in 40 (10%) patients at the time of biopsy. In the other 375 patients, thyroid function was normal (thyrotropin [TSH] within reference range) in 288 (77%) patients; 69 (18%) were hypothyroid (TSH above reference range, or patient on levothyroxine treatment); and 18 (5%) were hyperthyroid (TSH below reference range, or patient on antithyroid drugs).
Percentages are calculated for 415 patients, unless a different number of patients with information available is specified in parentheses next to the variable.
Includes patients with previous contralateral lobectomy.
The sonographic pattern was classified as very low suspicion in 25 (5%), low suspicion in 159 (34%), intermediate suspicion in 74 (16%), high suspicion in 36 (8%), and non-ATA in 169 (37%). The mean nodule size, determined by the largest dimension in ultrasound, was 2.6 cm (Table 2). Five percent of the nodules were <1 cm, 34% were between 1 and 2 cm, 46% were between 2 and 4 cm, and 15% were ≥4 cm. There were significant differences (p < 0.001) in nodule size by sonographic pattern with smaller nodules among intermediate and high suspicion sonographic patterns, and larger nodules among non-ATA patterns. Cytological diagnosis was AUS/FLUS in 176 (38%) and FN/HCN in 287 (62%). There was also a significantly different (p < 0.001) distribution of cytological diagnosis between the patterns, with most (84%) very low suspicion pattern nodules being AUS/FLUS and most (76%) intermediate suspicion pattern nodules being FN/HCN.
Sonographic pattern as characterized by at least two of the observers.
Van der Waerden one-way analysis (normal scores test).
AUS/FLUS, atypia/follicular lesion of undetermined significance; FN/HCN, follicular/Hürthle cell neoplasm; Interm., Intermediate suspicion sonographic pattern; Non-ATA, see description in Methods section; SD, standard deviation; US size, largest dimension in presurgical ultrasound evaluation.
Differences in prevalence and risk of malignancy between sonographic patterns
The prevalence of malignancy was 27% (n = 126), falling to 17% (n = 78) if NIFTPs were not considered malignant (Table 2). Differences in the prevalence of malignancy were not statistically significant between AUS/FLUS and FN/HCN specimens, when NIFTPs were considered either malignant (26% vs. 28%; p = 0.66) or benign (18% vs. 16%; p = 0.67). The prevalence of malignancy was not significantly different between the low and intermediate suspicion patterns with NIFTPs considered either malignant (20% vs. 18%; p = 0.65) or benign (11% vs. 11%; p = 0.98). For that reason, both patterns were collapsed for the comparisons with other groups. All other comparisons of the prevalence of malignancy between the sonographic patterns considering NIFTPs malignant were statistically significant (Table 3). Most NIFTPs had a low/intermediate suspicion or non-ATA sonographic pattern. Therefore, when considering NIFTPs benign, the prevalence of malignancy in those groups dropped by nearly half, whereas it remained almost unchanged in the very low and high suspicion sonographic patterns. In this scenario, all differences in the prevalence of malignancy remained significant except between the very low and low/intermediate sonographic patterns (0% vs. 11%; p = 0.15). Similar findings were observed for AUS/FLUS and FN/HCN specimens when analyzed separately, although some comparisons did not reach statistical significance.
Because no cancers were detected in the very low suspicion pattern, odds ratios could not be calculated for comparisons with this group. The low and intermediate sonographic patterns were grouped for comparisons with other patterns because their rates of malignancy were not significantly different.
CI, confidence interval; ITNs, cytologically indeterminate thyroid nodules (both AUS/FLUS and FN/HCN); Low/intermediate, low/intermediate suspicion sonographic patterns; NA, not applicable; NIFTP, noninvasive follicular thyroid neoplasm with papillary-like nuclear features; OR, odds ratio.
Compared to the low/intermediate suspicion patterns, the risk of malignancy of nodules was 1.35 (OR = 2.35) and 4.18 (OR = 5.18) times higher for nodules in the non-ATA or high suspicion patterns, respectively, whereas the risk of malignancy was 55% lower in the non-ATA pattern compared to the high suspicion pattern (OR = 0.45). If NIFTPs were considered benign, the differences in the risk of malignancy with the high suspicion pattern would be even greater but would remain unchanged for the low/intermediate versus non-ATA patterns comparison (Table 3).
Correlation between histological diagnosis and sonographic patterns
The distribution of histological diagnoses was significantly different between AUS/FLUS and FN/HCN specimens (p < 0.001) and within different sonographic patterns (p < 0.001; Fig. 2A and Supplementary Table S1; Supplementary Data are available online at
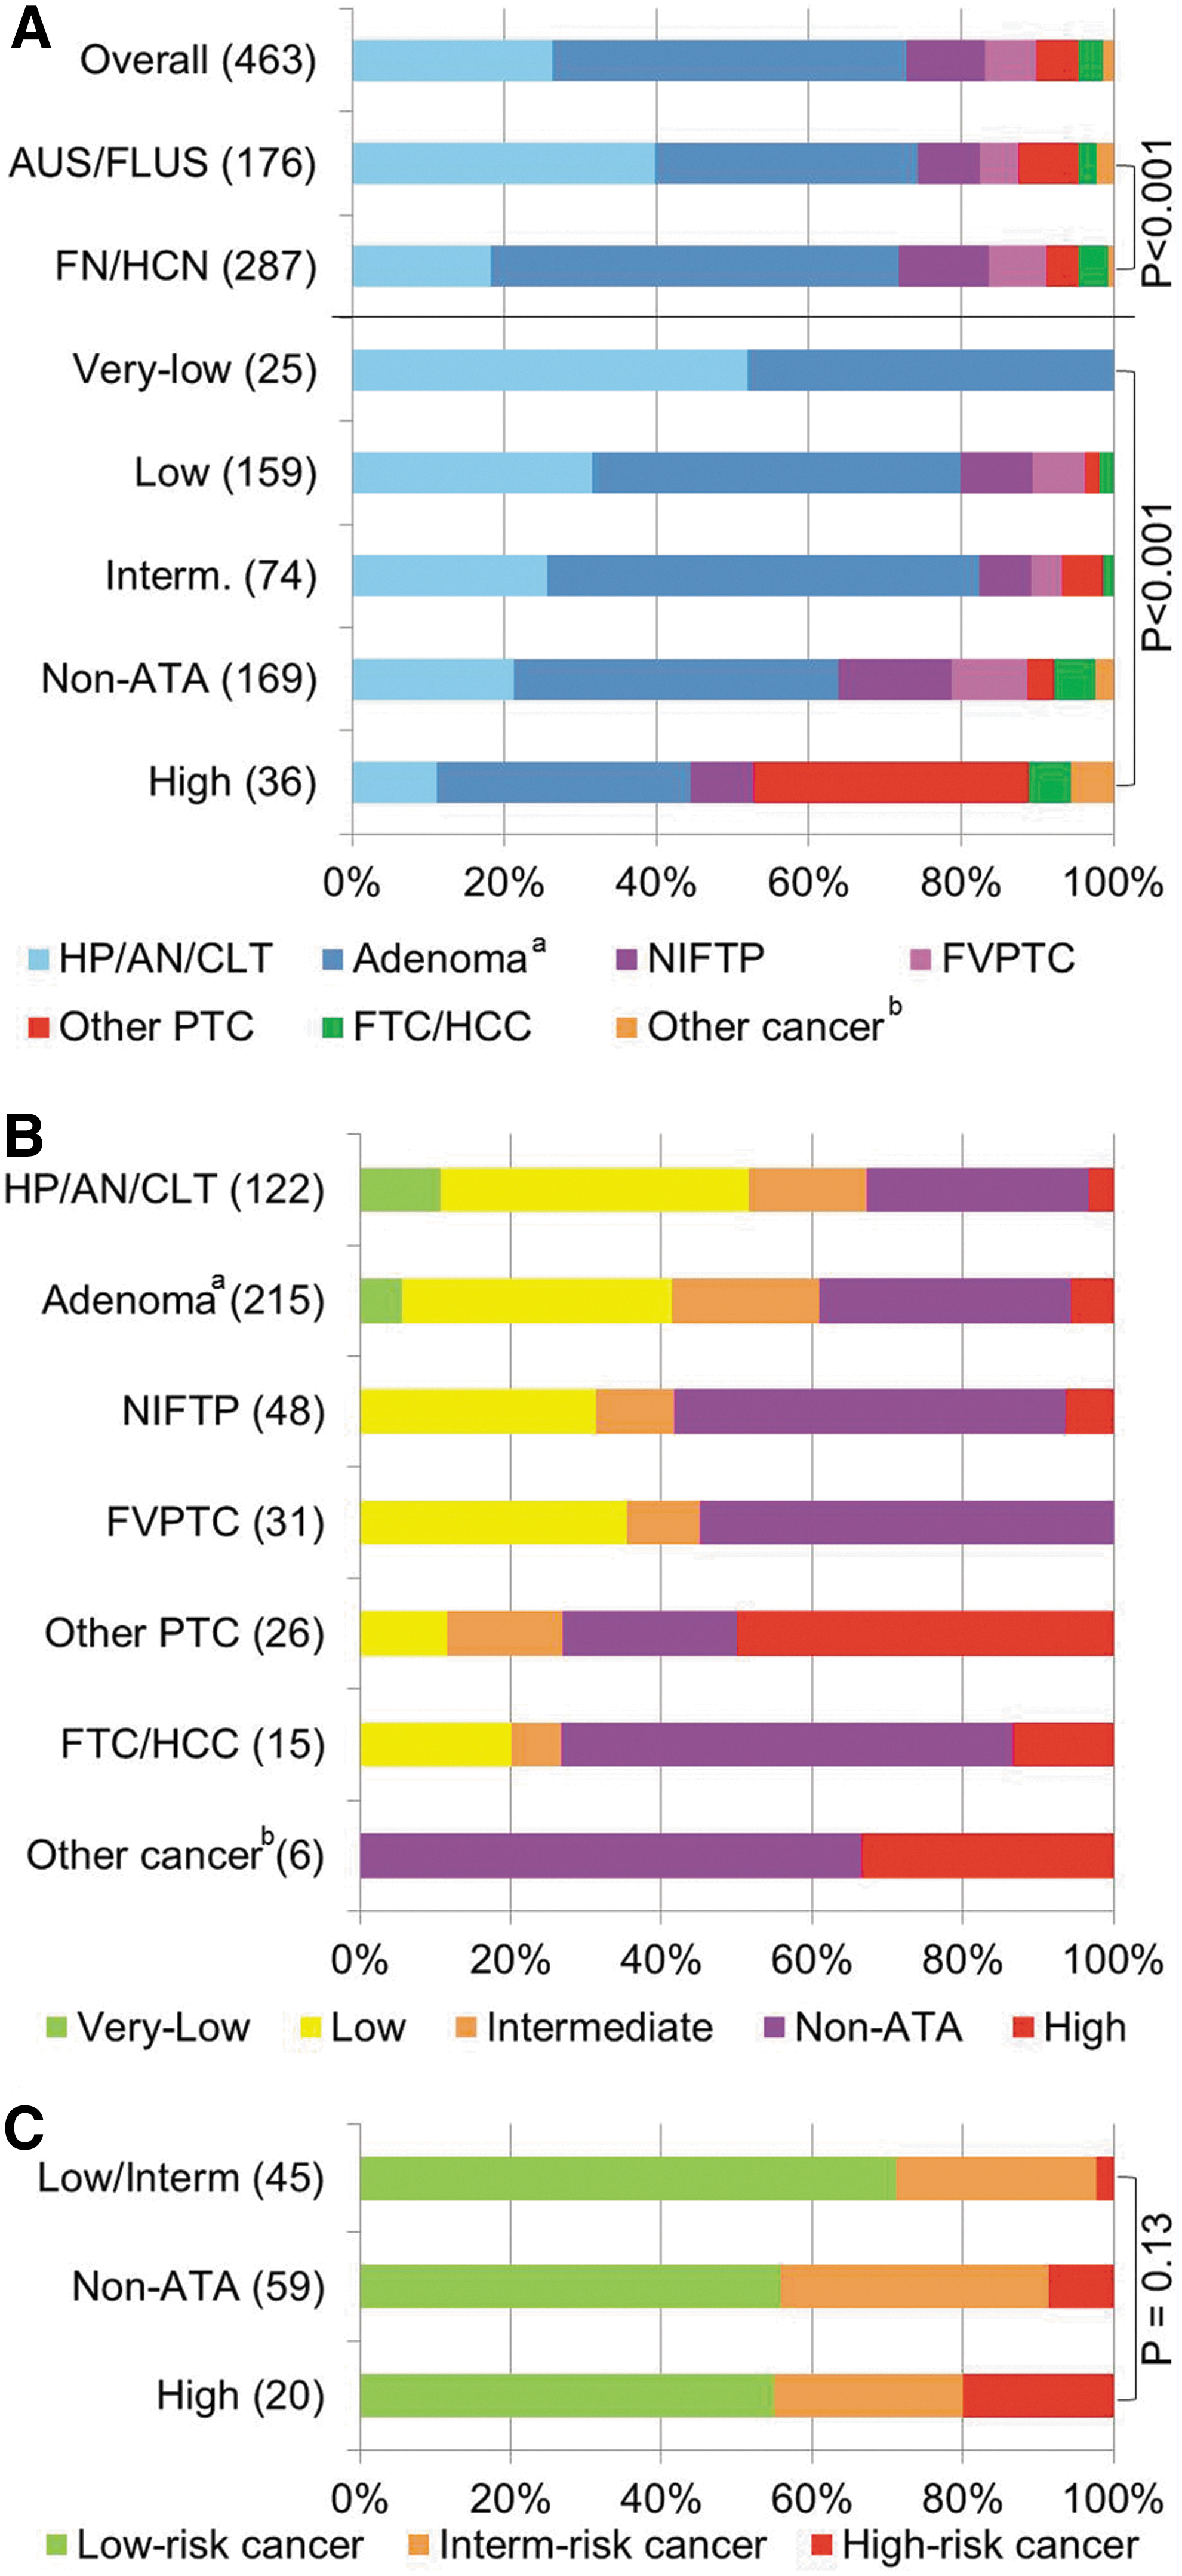
Distribution of histological diagnoses by sonographic pattern. (
Of the 124 thyroid malignancies, 61% were low-risk cancers; 31% were intermediate-risk cancers, and 8% were high-risk cancers (Fig. 2C and Supplementary Table S2). Differences in the distribution of these groups of cancer aggressiveness by sonographic pattern did not reach statistical significance (p = 0.13). The rates of high-risk malignancies, however, were 2%, 8%, and 20% in the low/intermediate, non-ATA, and high suspicion sonographic patterns, respectively. The ORs of having a high-risk cancer in the non-ATA and high suspicion sonographic patterns compared to the low/intermediate sonographic patterns were 4.07 ([CI 0.46–36.17]; p = 0.23) and 11.0 ([CI 1.14–105.92]; p = 0.028).
Differences in frequency and malignancy rates of sonographic patterns between observers
The intraclass correlation coefficient for absolute agreement of the distribution of the sonographic patterns between the observers was poor (r = 0.32 [CI 0.26–0.38]). The frequency with which ITNs were classified in the very low, low, intermediate, high, and non-ATA pattern ranged between 2% and 9%, 19% and 37%, 11% and 34%, 6% and 12%, and 24% and 62%, respectively. The correlation of the patterns was moderate between observers #1 and #3 (r = 0.46; p < 0.001) and weak between observer #2 and observers #1 (r = 0.23; p < 0.001) and #3 (r = 0.20; p < 0.001). The rates of malignancy of each sonographic pattern were, however, very consistent between all three observers, considering NIFTPs either malignant or benign (Table 4). Considering NIFTPs as malignant, the rate of malignancy ranged between 0% and 5% for the very low, 20% and 27% for the low, 14% and 21% for the intermediate, 43% and 51% for the high, and 29% and 41% for the non-ATA sonographic patterns. Only the rate of malignancy of non-ATA pattern nodules was significantly different between observers (p = 0.04). Considering NIFTPs as benign, differences were even smaller and not significantly different between observers, ranging between 0% and 5% for the very low, 10% and 12% for the low, 8% and 14% for the intermediate, 29% and 41% for the high, and 20% and 21% for the non-ATA sonographic patterns.
ICC, intraclass correlation coefficient with confidence interval; PoM, prevalence of malignancy (considering NIFTPs as malignant or benign) for each sonographic pattern and observer.
Discussion
In this study, the prevalence of malignancy of ITNs was effectively stratified by sonographic patterns. Moreover, the sonographic patterns were associated with distinct histopathological outcomes. They are therefore likely to improve the cytology–histology correlation. Differences in the proportion of these sonographic patterns could explain some of the observed interinstitutional variability in the risk of malignancy of the indeterminate categories of thyroid cytology and in the diagnostic performance of molecular marker tests.
Strengths and limitations
This study was done on a large series of consecutively evaluated ITNs with histological correlation, and ultrasound images were independently assessed by three different observers blinded to the histological diagnosis, mitigating the limitations of a single-center retrospective design. Nonetheless, the authors acknowledge that the results could be different in other sites or with other observers. All cytological diagnoses and most (97%) histological diagnoses were made by board-certified, experienced pathologists at the authors' institution. Although it cannot be ascertained that the original histological diagnoses were blinded to the ultrasound features, this was likely the case. Moreover, the histology of most (87%) malignant diagnoses was reviewed blinded to the ultrasound characteristics in order to assure compliance with current diagnostic criteria, particularly for FVPTC/NIFTP. Nonetheless, it is acknowledged that the expertise of the pathologists cannot overcome the limitations of light microscopy, particularly for follicular pattern lesions (9 –12).
Sonographic patterns stratify the risk of malignancy of ITNs
Several studies in recent years have suggested the use of ultrasound patterns to stratify the risk of malignancy of ITNs (13 –22). Most of them have used one of the Thyroid Imaging Reporting and Data System (TIRADS) classifications, which, unlike the ATA classification, are based on scoring systems. The ATA classification, however, has been used in some recent studies with smaller cohorts and conflicting results (18,21,23,24). In the present study, three observers independently assessed the ultrasound images of 463 thyroid nodules blinded to the histological outcomes, and the ATA sonographic pattern was decided by agreement or consensus of two or more observers. The correlation of the ATA sonographic patterns between observers was weak to moderate in this study. Whereas this might have significant implications for setting biopsy thresholds, it seems to have little impact for cancer risk stratification of nodules with indeterminate cytology, which was very consistently achieved by all observers, particularly if NIFTPs are not considered malignant. Multivariate backward elimination logistic regressions were run using all variables listed in Table 1, and the cytological category searching for the contribution of other variables to the differences observed in the risk of malignancy between different sonographic patterns (data not shown). Only sex and/or age seemed to contribute to these differences for some but not all the comparisons. This information was not added to the manuscript because the effects of age and sex were small and clinically insignificant, and could be driven by the small sample size in the high suspicion pattern. Furthermore, these findings could be artifactual, as some patients had several nodules biopsied, and thus the characteristics of the same patient could be present in two different sonographic patterns or twice in the same one.
Hypoechogenicity alone does not seem to improve risk stratification of ITNs, as there were no differences in prevalence of malignancy between nodules with either low (iso/hyperechoic) or intermediate (hypoechoic) suspicion patterns. However, any other suspicious sonographic feature significantly increases the risk of malignancy of ITNs. Moreover, non-ATA sonographic patterns seem to be very prevalent among ITNs (37% in our series) and have a prevalence of malignancy higher than the low and intermediate suspicion sonographic patterns. Given the heterogeneity of the group, it is possible that different non-ATA patterns have different histological findings. Nodules with non-ATA patterns were on average larger than nodules with other sonographic patterns, and had a higher proportion of nodules >4 cm. This could mean that nodules tend to get more heterogeneous in echotexture as they grow, or that heterogeneous nodules are more likely to grow, which could be relevant for clinical management. Observational studies are needed to clarify this. On the other hand, hypoechoic nodules (intermediate and high suspicion patterns) were smaller than the nodules in other groups. This finding might be related to the fact that hypoechogenicity has been recognized as a risk factor for many years, which may have triggered the biopsy earlier than in nodules with other echogenicity (25 –27).
In this study, there could be an overrepresentation of more suspicious sonographic patterns, and the observed rates of malignancy could be overestimated because only resected ITNs were included. In the authors' opinion, this is unlikely because the sonographic features/patterns have been traditionally used to select nodules for biopsy but not to guide management once cytology is available. The overall rate of malignancy of ITNs in the present study is within the expected range and is consistent with previously published series (6,28), and it dropped approximately by half in the low, intermediate, and non-ATA patterns when NIFTPs were considered benign, whereas it was unchanged in the very low and high suspicion patterns.
Association of sonographic patterns with histological diagnoses and implications for molecular tests
This study found that the histological diagnoses associated with each pattern were significantly different. Although differences were also statistically significant between AUS/FLUS and FN/HCN nodules, larger differences were seen in the classification of benign nodules as either hyperplastic/adenomatous or adenomas, whereas the distribution of specific histological diagnoses of malignant nodules was less evident than when nodules were segregated by sonographic pattern. Although most malignancies were low-risk cancers in all sonographic patterns, the probability of aggressive histological features increased with the degree of sonographic suspicion. This indicates that sonographic patterns are likely to improve the cytology–histology correlation, which could impact the diagnostic performance and interpretation of molecular tests results. At the authors' institution, oncogene panels were used routinely after 2014 (29,30). As previously described, these were mainly used to decide the extent of surgery rather than to avoid resection (31). However, only 17% of this cohort was evaluated with oncogene panels, which is insufficient to evaluate the impact of sonographic patterns on the oncogene panels' results. Thus, future studies are needed to investigate this topic.
In the authors' opinion, molecular markers might not be useful for the presurgical evaluation of ITNs with very low or high suspicion sonographic patterns, which represent 13% of all ITNs in this series. In nodules with very low suspicion pattern, the pretest probability of cancer was already ≤5%, which is similar to a benign cytology and, according to National Comprehensive Cancer Network and ATA guidelines, sufficient to elect observation (1,4). On the other hand, in nodules with high suspicion sonographic pattern, the pretest risk of malignancy is theoretically too high to achieve a low enough negative predictive value to avoid surgery with any of the currently available tests, and a positive result might be insufficient to modify the extent of surgery (32). Furthermore, other factors, such as the presence or absence of nuclear atypia, architectural atypia, or oncocytic changes in the cytological specimen, seem to impact on molecular marker tests results (33,34). The correlation of these cytological scenarios and the sonographic patterns is currently unknown and needs to be further defined to optimize patient management in the era of personalized medicine.
Conclusion
The 2015 ATA sonographic patterns effectively stratify the risk of malignancy of thyroid nodules with indeterminate cytology and are associated with distinct clinical and histological features. These results have important implications for the evaluation and management of ITNs and suggest that the sonographic pattern should not only have a role in selecting nodules that need to be biopsied, but also in deciding management after cytological diagnosis. Sonographic patterns are likely to impact the performance of molecular marker tests. Future studies will need to study this interaction to restrict the use of these expensive tests to clinical scenarios in which they may be useful.
Footnotes
Acknowledgments
This work has been supported in part by the Biostatistics Core Facility at the H. Lee Moffitt Cancer Center & Research Institute; an NCI designated Comprehensive Cancer Center (P30-CA076292).
Author Disclosure Statement
No competing financial interests exist.