
Abstract
Background:
Among subtypes of follicular variant of papillary thyroid carcinoma (FVPTC), encapsulated FVPTC (EFVPTC) shows more indolent behavior than infiltrative FVPTC (IFVPTC). In particular, noninvasive EFVPTC, now designated as noninvasive follicular thyroid neoplasm with papillary-like nuclear features (NIFTP), tends to have an excellent prognosis. However, it remains unclear whether the molecular pathogenesis or signature of the various forms of FVPTC is different. By massively parallel sequencing analysis, this study comprehensively characterized the transcriptional and mutational landscape of FVPTC and established correlations with phenotypic subtypes.
Methods:
This study included 48 FVPTCs: 17 NIFTPs, 13 invasive EFVPTCs (I-EFVPTCs), and 18 IFVPTCs. For comparison, 55 classical papillary thyroid carcinomas (cPTCs) harboring a BRAFV600E mutation, six follicular adenomas (FAs), and 15 minimally invasive follicular thyroid carcinomas (miFTCs) with RAS mutations were also included.
Results:
In NIFTP, the BRAFV600E mutation was not found, but RAS and other alterations were present in 64.7% and 17.6% of cases, respectively. However, in I-EFVPTC and IFVPTC, the proportions of BRAFV600E mutation (38.5% and 38.9%, respectively) and of RAS mutations (38.5% and 38.9%, respectively) or other alterations (15.4% and 16.7%, respectively) were similar. On a molecular level, RAS-mutated FVPTCs were all RAS-like except for one IFVPTC case. Transcriptomic profiles of NIFTP, I-EFVPTC, and FA/miFTC were comparable, although the profile of RAS-mutated IFVPTC was altered to activate molecular pathways involved in cell adhesion and invasion. Interestingly, 80% of BRAFV600E -mutated I-EFVPTCs were also classified as RAS-like, whereas all BRAFV600E -mutated IFVPTCs were BRAF-like and indistinguishable from cPTC. Molecular pathways associated with cell adhesion and invasion were also differentially activated in BRAFV600E -mutated IFVPTC.
Conclusions:
Molecular profiles of NIFTP and I-EFVPTC may be shared with FA/miFTC, while IFVPTC seems to be associated with a similar profile as cPTC. Activation of cell adhesion and invasion pathways may play a key role in the development of invasive phenotypes of FVPTC.
Introduction
T
Recently, because of the indolent biologic behavior of the noninvasive subset of EFVPTC, which is characterized by virtually nonexistent metastases, recurrence, and mortality (4 –6), a revision of the nomenclature from noninvasive EFVPTC (NI-EFVPTC) to noninvasive follicular thyroid neoplasm with papillary-like nuclear features (NIFTP) was suggested by a panel of experts in endocrine pathology (6). This modification could have considerable impact on histopathologic classification systems (7,8) and could lead to a reduction in the number of patients considered to have thyroid carcinoma (6). Nonetheless, it is challenging to diagnose FVPTC subtypes using preoperative fine-needle aspiration biopsy and postoperative tissue samples based solely on cytopathologic or histological findings. Thus, transcriptomic and genomic characterization of each subtype of FVPTC may help in more accurately distinguishing between low- and high-risk neoplasms and in understanding the underlying molecular pathogenesis.
This study analyzed the transcriptomic characteristics of FVPTCs by using massively parallel sequencing to delineate changes in gene expression according to subtype and to identify the molecular pathogenesis underlying clinicopathologic characteristics of each subtype.
Methods
Patients
Forty-eight patients with FVPTC for whom RNA sequencing data were available from previous research were studied (9). The studied specimens were obtained from the included patients whose freshly frozen tissues were collected after thyroid surgery from March 2007 to January 2014. For comparison of gene expression profiles, 55 cPTCs with the BRAFV600E mutation, six FAs, and 15 minimally invasive FTCs (miFTCs) with RAS mutation were included. This study was approved by the Institutional Review Board of the Seoul National University Hospital, and was conducted in accordance with the Declaration of Helsinki (approved ID: H-1108-041-372).
Definition of histologic subtype of FVPTC
FVPTCs were defined as tumors with nuclear features of PTC that were predominantly (>50% of the tumor) composed of follicles and lacked well-formed papillae. FVPTC is classified as NI-EFVPTC, invasive EFVPTC (I-EFVPTC), or IFVPTC (10), and a subset of NI-EFVPTC can now be reclassified as NIFTP (6,11). Tumors that were entirely surrounded by a fibrous capsule were classified as EFVPTC, and those with invasive tongues infiltrating the thyroid parenchyma, with or without partial encapsulation, were defined as IFVPTC (2). In a previous study (9), EFVPTC was not classified into two subtypes, and it was reported that the capsular invasion was found in only two cases. However, for this FVPTC-focused study, the pathological classification of each FVPTC subtype was reevaluated with submission of the entire tumor capsule for histological examination by two expert pathologists (J.K.W. and K.C.J.) independently. None of the tumors obtained through thyroidectomy had a positive resection margin, and the considered lesions were completely included in the samples. Especially in the case of EFVPTC, the periphery of the tumor was entirely sectioned to 3 mm thickness and processed for slide examination to check for the presence of invasion (12). EFVPTC with neither capsular nor vascular invasion was subclassified as NI-EFVPTC, and all of the NI-EFVPTCs included in this study met the diagnostic criteria of NIFTP (6,11). If invasion was observed, the tumor was classified as I-EFVPTC. Ultimately, capsular invasion was found in 13/17 cases of EFVPTC, and thus EFVPTC was subcategorized into NIFTP and I-EFVPTC.
RNA sequencing and mutational analysis
RNA preparation, sequencing, and analysis were performed as in the previous study (9). Briefly, total RNA was extracted from frozen tissue using the QIAcube and RNeasy Mini Kit (Qiagen, Hilden, Germany) or the Easy Spin RNA extraction kit (Intron, Daejeon, Korea). RNA quality and concentration were examined with an RNA 6000 Nano LabChip on a 2100 Bioanalyzer (Agilent, Palo Alto, CA). The sequencing libraries were sequenced with paired end read using an Illumina HiSeq 2000 platform (Illumina, San Diego, CA). After preprocessing, read pairs were aligned to GRCh37.p13 human reference genome using the STAR two-pass method (13), and polymerase chain reaction duplicates were removed by Picard tools (
Somatic single-nucleotide variants (SNVs) were identified using MuTect (15) or GATK's HaplotypeCaller. All variants were annotated with information using ANNOVAR (16) and GATK's DepthOfCoverage was used for counting alternative allele of mutation hotspots in common oncogenes. To obtain driver mutations in thyroid cancers, the following filtration criteria were applied: (i) not or rarely shown in public databases of normal individuals; (ii) nonsilent SNVs (nonsynonymous and splice-site) and frameshift indels; and (iii) genes that were annotated in COSMIC70 or PTC data set of The Cancer Genome Atlas (TCGA) project (17).
For TERT promoter sequencing, among 48 FVPTCs, 40 tumor DNA samples were available in sufficient quantities for further analysis, and Sanger sequencing was performed for the detection of TERT promoter mutations by a previously described method (18).
Gene expression profiling and molecular subtyping
The counted numbers of reads aligned to each gene were normalized via the regularized log (rlog) transformation method of DESeq2 (19). Principal component analysis (PCA) was used to visualize variation between expression analysis samples using the most variable 500 genes. The tumor samples were classified into three molecular subtypes, as was done in a previous study (9): BRAF-like and RAS-like, which were proposed by TCGA study, and non-BRAF-non-RAS (NBNR). Three molecular subtypes were obtained through K-means clustering using the first and second principal components of 180 thyroid tumors included in the previous study. These molecular subtypes showed a clear separation of tumor samples by driver genes, and an exceedingly similar result was demonstrated in TCGA data set.
Differentially expressed gene analysis
The differentially expressed genes (DEGs) were determined by DESeq2 to have a q-value <0.05, |Log2 (fold change)| ≥1, and baseMean ≥100, and were illustrated using volcano plots showing the magnitude and statistical significance of the differential translation for each gene. The calculated p-values were adjusted to q-values for multiple testing using the Benjamini–Hochberg correction. For heatmap display, the centered rlog values were applied to the K-means clustering algorithm using cluster 3.0 (20). To identify molecular pathways that were significantly enriched in DEGs, the Kyoto Encyclopedia of Genes and Genomes (KEGG) pathway database was used (21).
Thyroid differentiation, ERK, MAPK, and PI3K-Akt scores
The thyroid differentiation score (TDS) was developed to quantify associations between thyroid differentiation and genetic or epigenetic events in TCGA study. As described in TCGA study, TDS was calculated using mRNA expression levels for a selected set of 16 thyroid-specific genes associated with thyroid metabolism and function by estimating the mean of the median-centered rlog across the 16 genes (22). The extracellular signal-regulated kinase (ERK) score is derived from mRNA expression of a gene set previously known to be responsive to mitogen-activated protein kinase kinase (MAPK kinase, MEK) inhibition. The identical method was used to calculate TDS for the ERK score by estimating the mean of the median-centered rlog across 52 genes (22). For MAPK and phosphatidylinositol 3-kinase (PI3K)-Akt scores, the enrichment score was obtained via single-sample gene-set enrichment analysis (ssGSEA) (23) with the KEGG pathway gene sets. The calculation of the ES was available as a GenePattern module ssGSEAProjection, v4 (
Statistical analysis
To compare the clinicopathologic characteristics of patients according to histologic subtype, Pearson's chi-square test or Fisher's exact test (if the number was <5) was used for categorical variables, and the analysis of variance test or the Kruskal–Wallis test was used for continuous variables.
Results
Genomic and clinicopathologic characteristics of FVPTC
In total, 48 patients with FVPTC were included in the study, including 17 NIFTPs, 13 I-EFVPTCs, and 18 IFVPTCs. The major genetic alterations of FVPTC were RAS mutations (47.9%), followed by BRAFV600E mutation (25.0%; Table 1). The TERT promoter mutation was found in 3/40 (7.5%) FVPTCs, all of which were C228T not C250T. The most common RAS mutations were NRAS Q61R (33.3%), followed by NRAS Q61K (12.5%), HRAS Q61R (8.3%), and HRAS Q61K (6.3%). Other genetic alterations were detected in 16.7% of FVPTCs, and 10.4% of FVPTCs lacked apparent oncogenic driver alterations. The frequency of the BRAFV600E mutation differed according to the subtypes of FVPTC (p = 0.006), but there was no significant difference in the frequency of RAS mutations (p = 0.226). The BRAFV600E mutation was found in 5/13 (38.5%) I-EFVPTCs and 7/18 (38.9%) IFVPTCs but not in any NIFTPs. In contrast, RAS mutations were observed in 11/17 (64.7%) NIFTPs, 5/13 (38.5%) I-EFVPTCs, and 7/18 (38.9%) IFVPTCs. All of the cases with the TERT promoter mutation harbored coexistent mutations: one NIFTP, a HRAS mutation; one IFVPTC, a BRAFV600E mutation; and one IFVPTC, an NRAS mutation. In tumors with wild-type BRAFV600E and RAS, the following fusion genes were found: ETV6-NTRK3 in one NIFTP and three IFVPTCs, PAX8-PPARG in one NIFTP, EZR-ERBB4 in one NIFTP, FGFR2-KIAA1598 in one I-EFVPTC, and THADA-LOC100505678 in one I-EFVPTC.
p-Values for comparisons among groups of NIFTP, I-EFVPTC, and IFVPTC.
p-Values for trend across groups of NIFTP, I-EFVPTC, and IFVPTC.
I-EFVPTC, invasive encapsulated follicular variant of papillary thyroid carcinoma; IFVPTC, infiltrative follicular variant of papillary thyroid carcinoma; IQR, interquartile range; NIFTP, noninvasive follicular thyroid neoplasm with papillary-like nuclear features; SD, standard deviation; TNM, tumor-node-metastasis; ATA, American Thyroid Association.
Clinicopathologic characteristics of FVPTC according to histologic subtypes showed no significant difference in age, sex, tumor size, tumor multifocality, distant metastasis, tumor-node-metastasis stage, or MACIS prognostic score. However, significantly increasing trends in the proportion of extrathyroidal extension and lymph node metastasis from NIFTP to I-EFVPTC to IFVPTC were observed (p = 0.021 and 0.006, respectively; Table 1). Moreover, when clinicopathologic features were examined according to mutational status of BRAFV600E and RAS, the two major genetic alterations in FVPTC, the BRAFV600E mutation-harboring IFVPTC was smaller but had higher rates of extrathyroidal extension and lymph node metastasis than RAS mutation-harboring IFVPTC, though there was no statistical significance because of the small sample size (Table 2). Among three FVPTCs with the TERT promoter mutation, two IFVPTCs showed extrathyroidal extension and lymph node metastasis and one of them had distant metastasis, while the single NIFTP in this subgroup did not.
Transcriptomic characteristics of FVPTC
On classification of molecular subtypes according to the method used in TCGA (22) and a previous study (9), all RAS-mutated FVPTCs were RAS-like (closed blue dots in Fig. 1A) except for one IFVPTC (blue arrow, an open blue triangle in Fig. 1A). Interestingly, 80% (4/5) of BRAFV600E -mutated I-EFVPTCs were also classified as RAS-like (closed red squares in Fig. 1A), unlike all IFVPTCs with the BRAFV600E mutation showing BRAF-like properties (open red triangles in Fig. 1A). Only one BRAFV600E -mutated I-EFVPTC (red arrow, an open red square in Fig. 1A) was classified as the BRAF-like subtype, but it was also located near the other BRAFV600E -mutated I-EFVPTCs showing RAS-like profiles on the PCA plot.
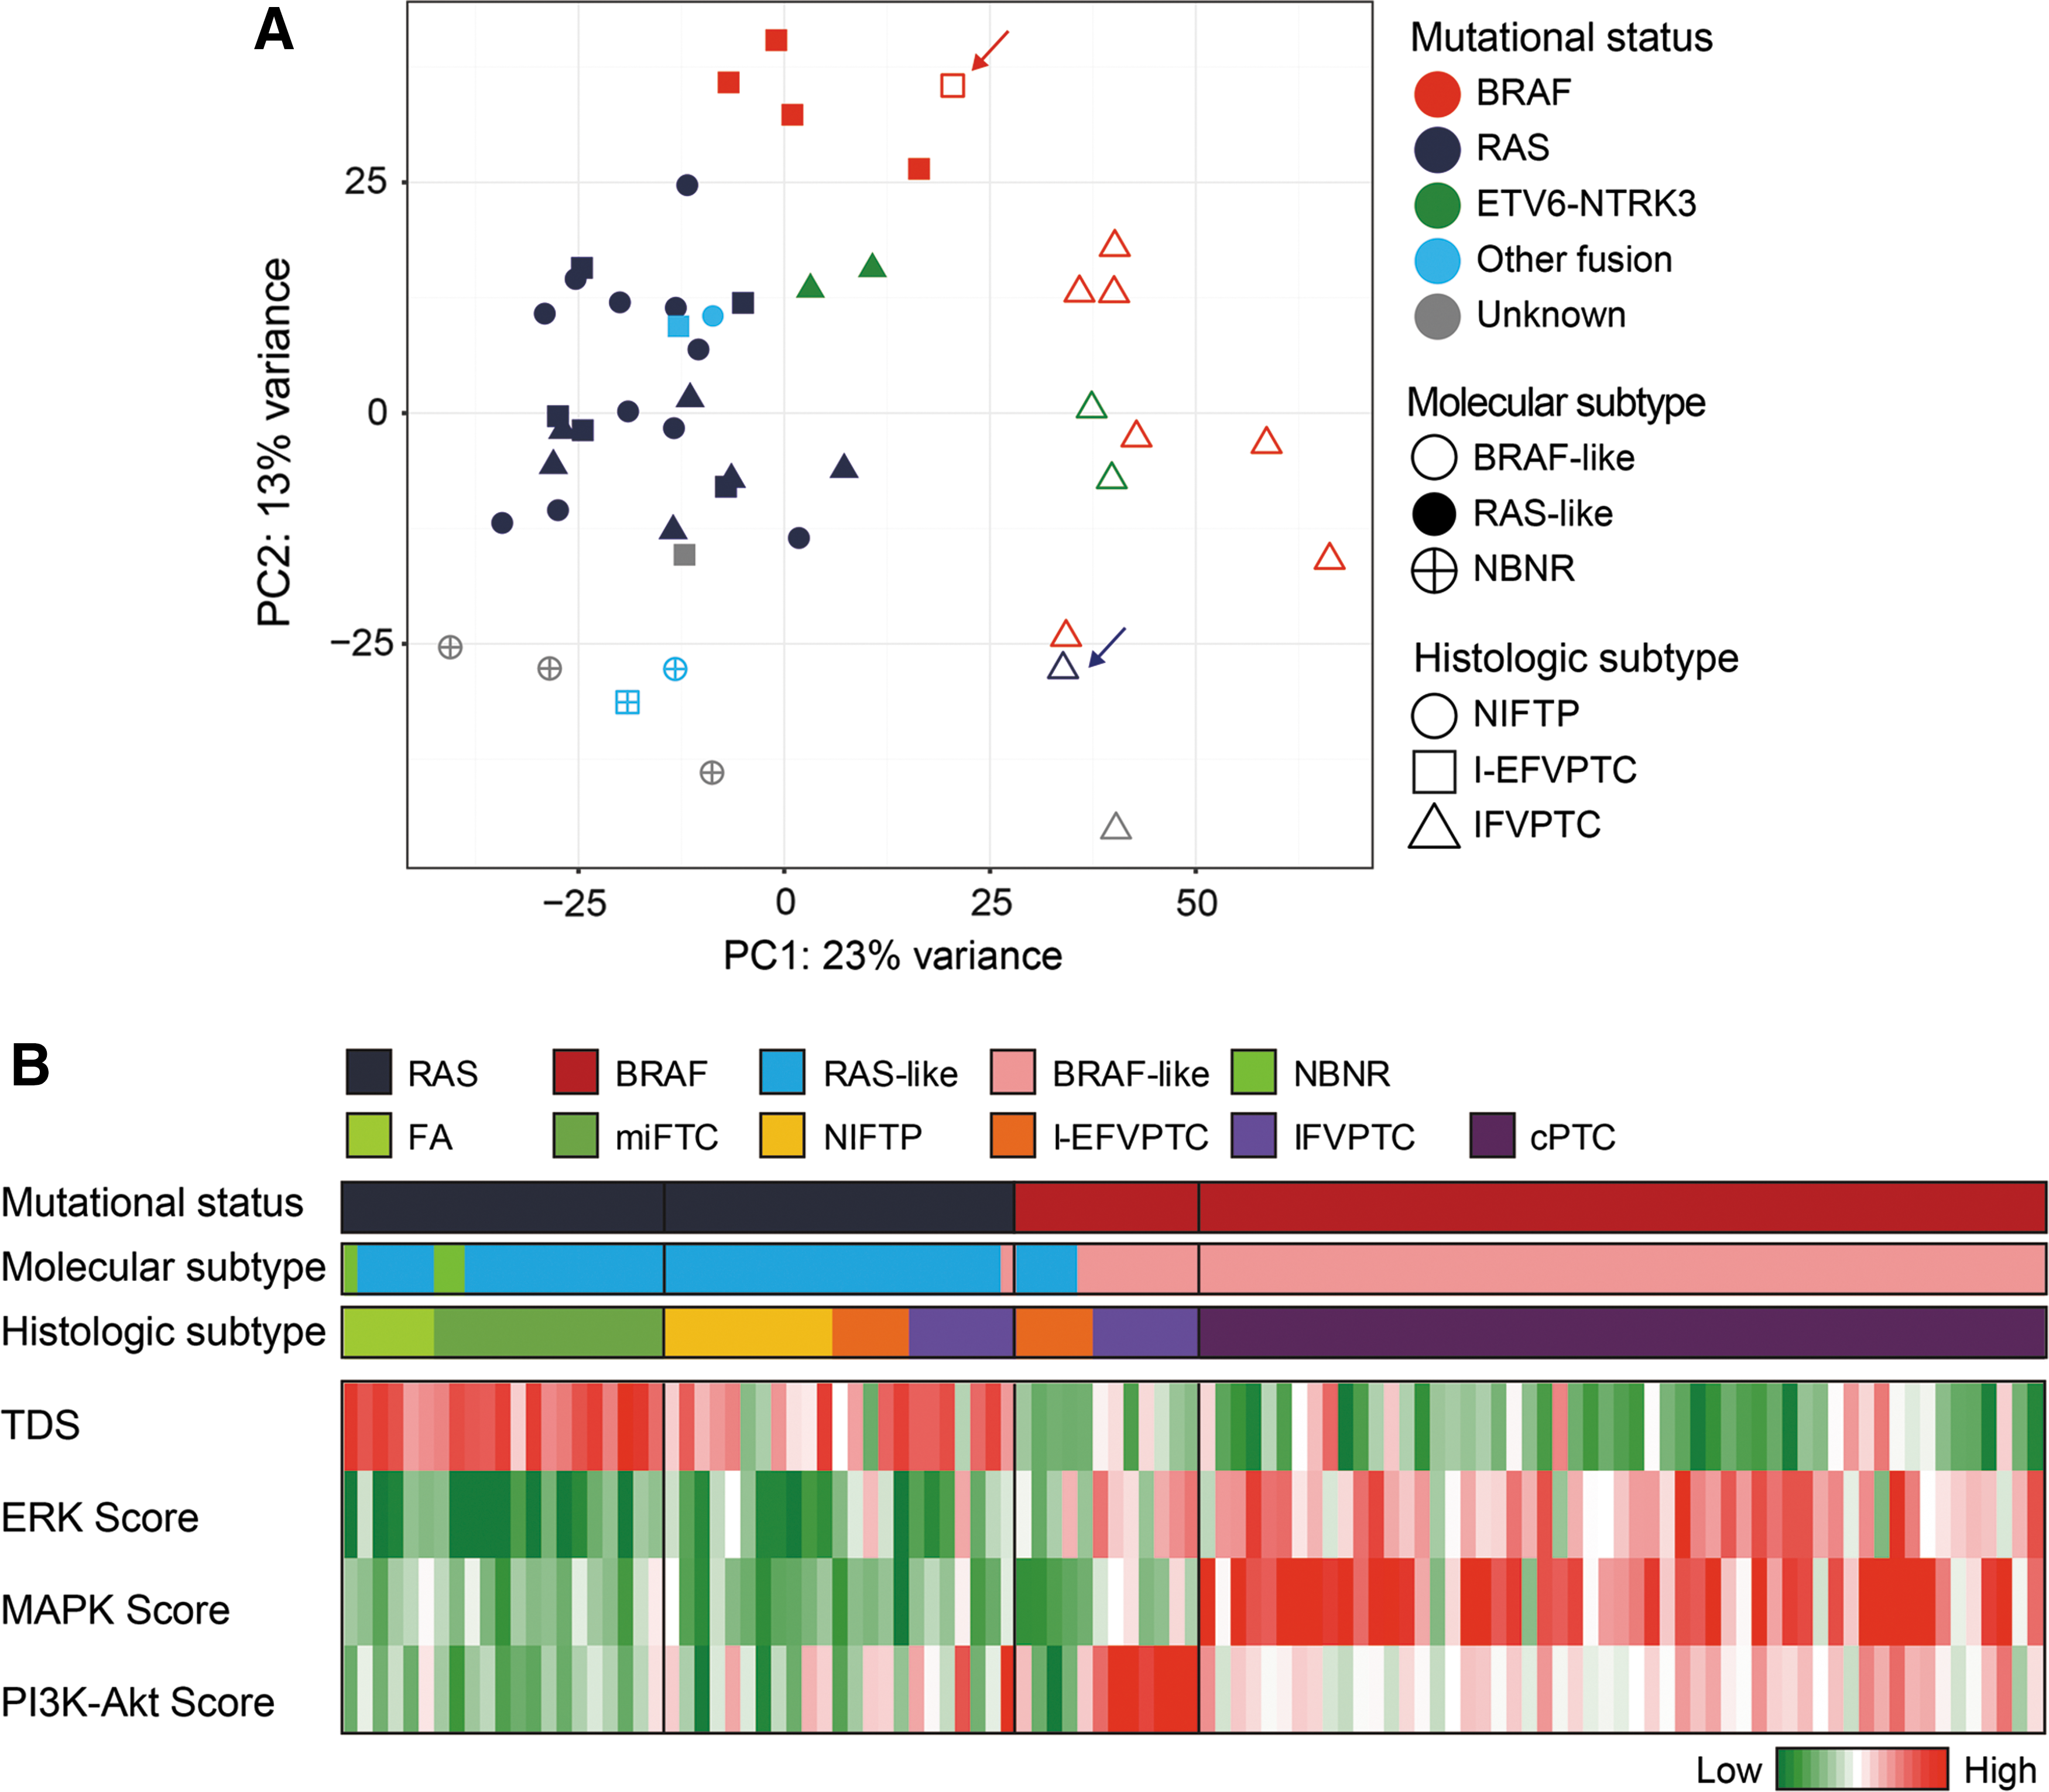
Transcriptomic and genomic profiles of follicular variant of papillary thyroid carcinoma (FVPTC). (
Next, the TDS and ERK, MAPK, and PI3K-Akt scores were investigated, reflecting the activation of intracellular signaling pathways involved in thyroid cancer pathogenesis and progression (Fig. 1B). In FVPTC with RAS mutations, EFVPTC and IFVPTC were not clearly distinguished. Relatively high TDS and low ERK, MAPK, and PI3K-Akt scores were observed, but heterogeneous patterns were detected in each group. The patterns resembled those of FA/miFTC with RAS mutations rather than FVPTC with the BRAFV600E mutation. Conversely, in FVPTC with the BRAFV600E mutation, both EFVPTC and IFVPTC showed low TDS and high ERK scores, similar to cPTC with the BRAFV600E mutation, whereas the increment in the ERK score was more dominant in IFVPTC. EFVPTC and IFVPTC harboring the BRAFV600E mutation were distinguishable based on MAPK and PI3K-Akt scores: relatively low scores were observed in EFVPTC and high scores in IFVPTC.
Comparison of transcriptomic profiles among subtypes of FVPTC with RAS mutations
FVPTC was classified according to the status of the major mutations in RAS and BRAF, and transcriptomic profiles were analyzed through DEG analysis for each mutation group. The transcriptomic profiles of FVPTC with RAS mutations (n = 23) were compared according to their histologic subtypes. In EFVPTC harboring RAS mutations, NIFTP and I-EFVPTC had no significant transcriptional difference (Fig. 2A). There were only four DEGs, but these showed a modest difference: JAM2 was downregulated and ATF5, RTN2, and MACROD2 were upregulated in I-EFVPTC compared to NIFTP. Therefore, EFVPTC was compared to FA/miFTC without subgrouping into NIFTP or I-EFVPTC, and it was confirmed that the transcriptomic profile of EFVPTC and FA/miFTC was not significantly different (Fig. 2B).
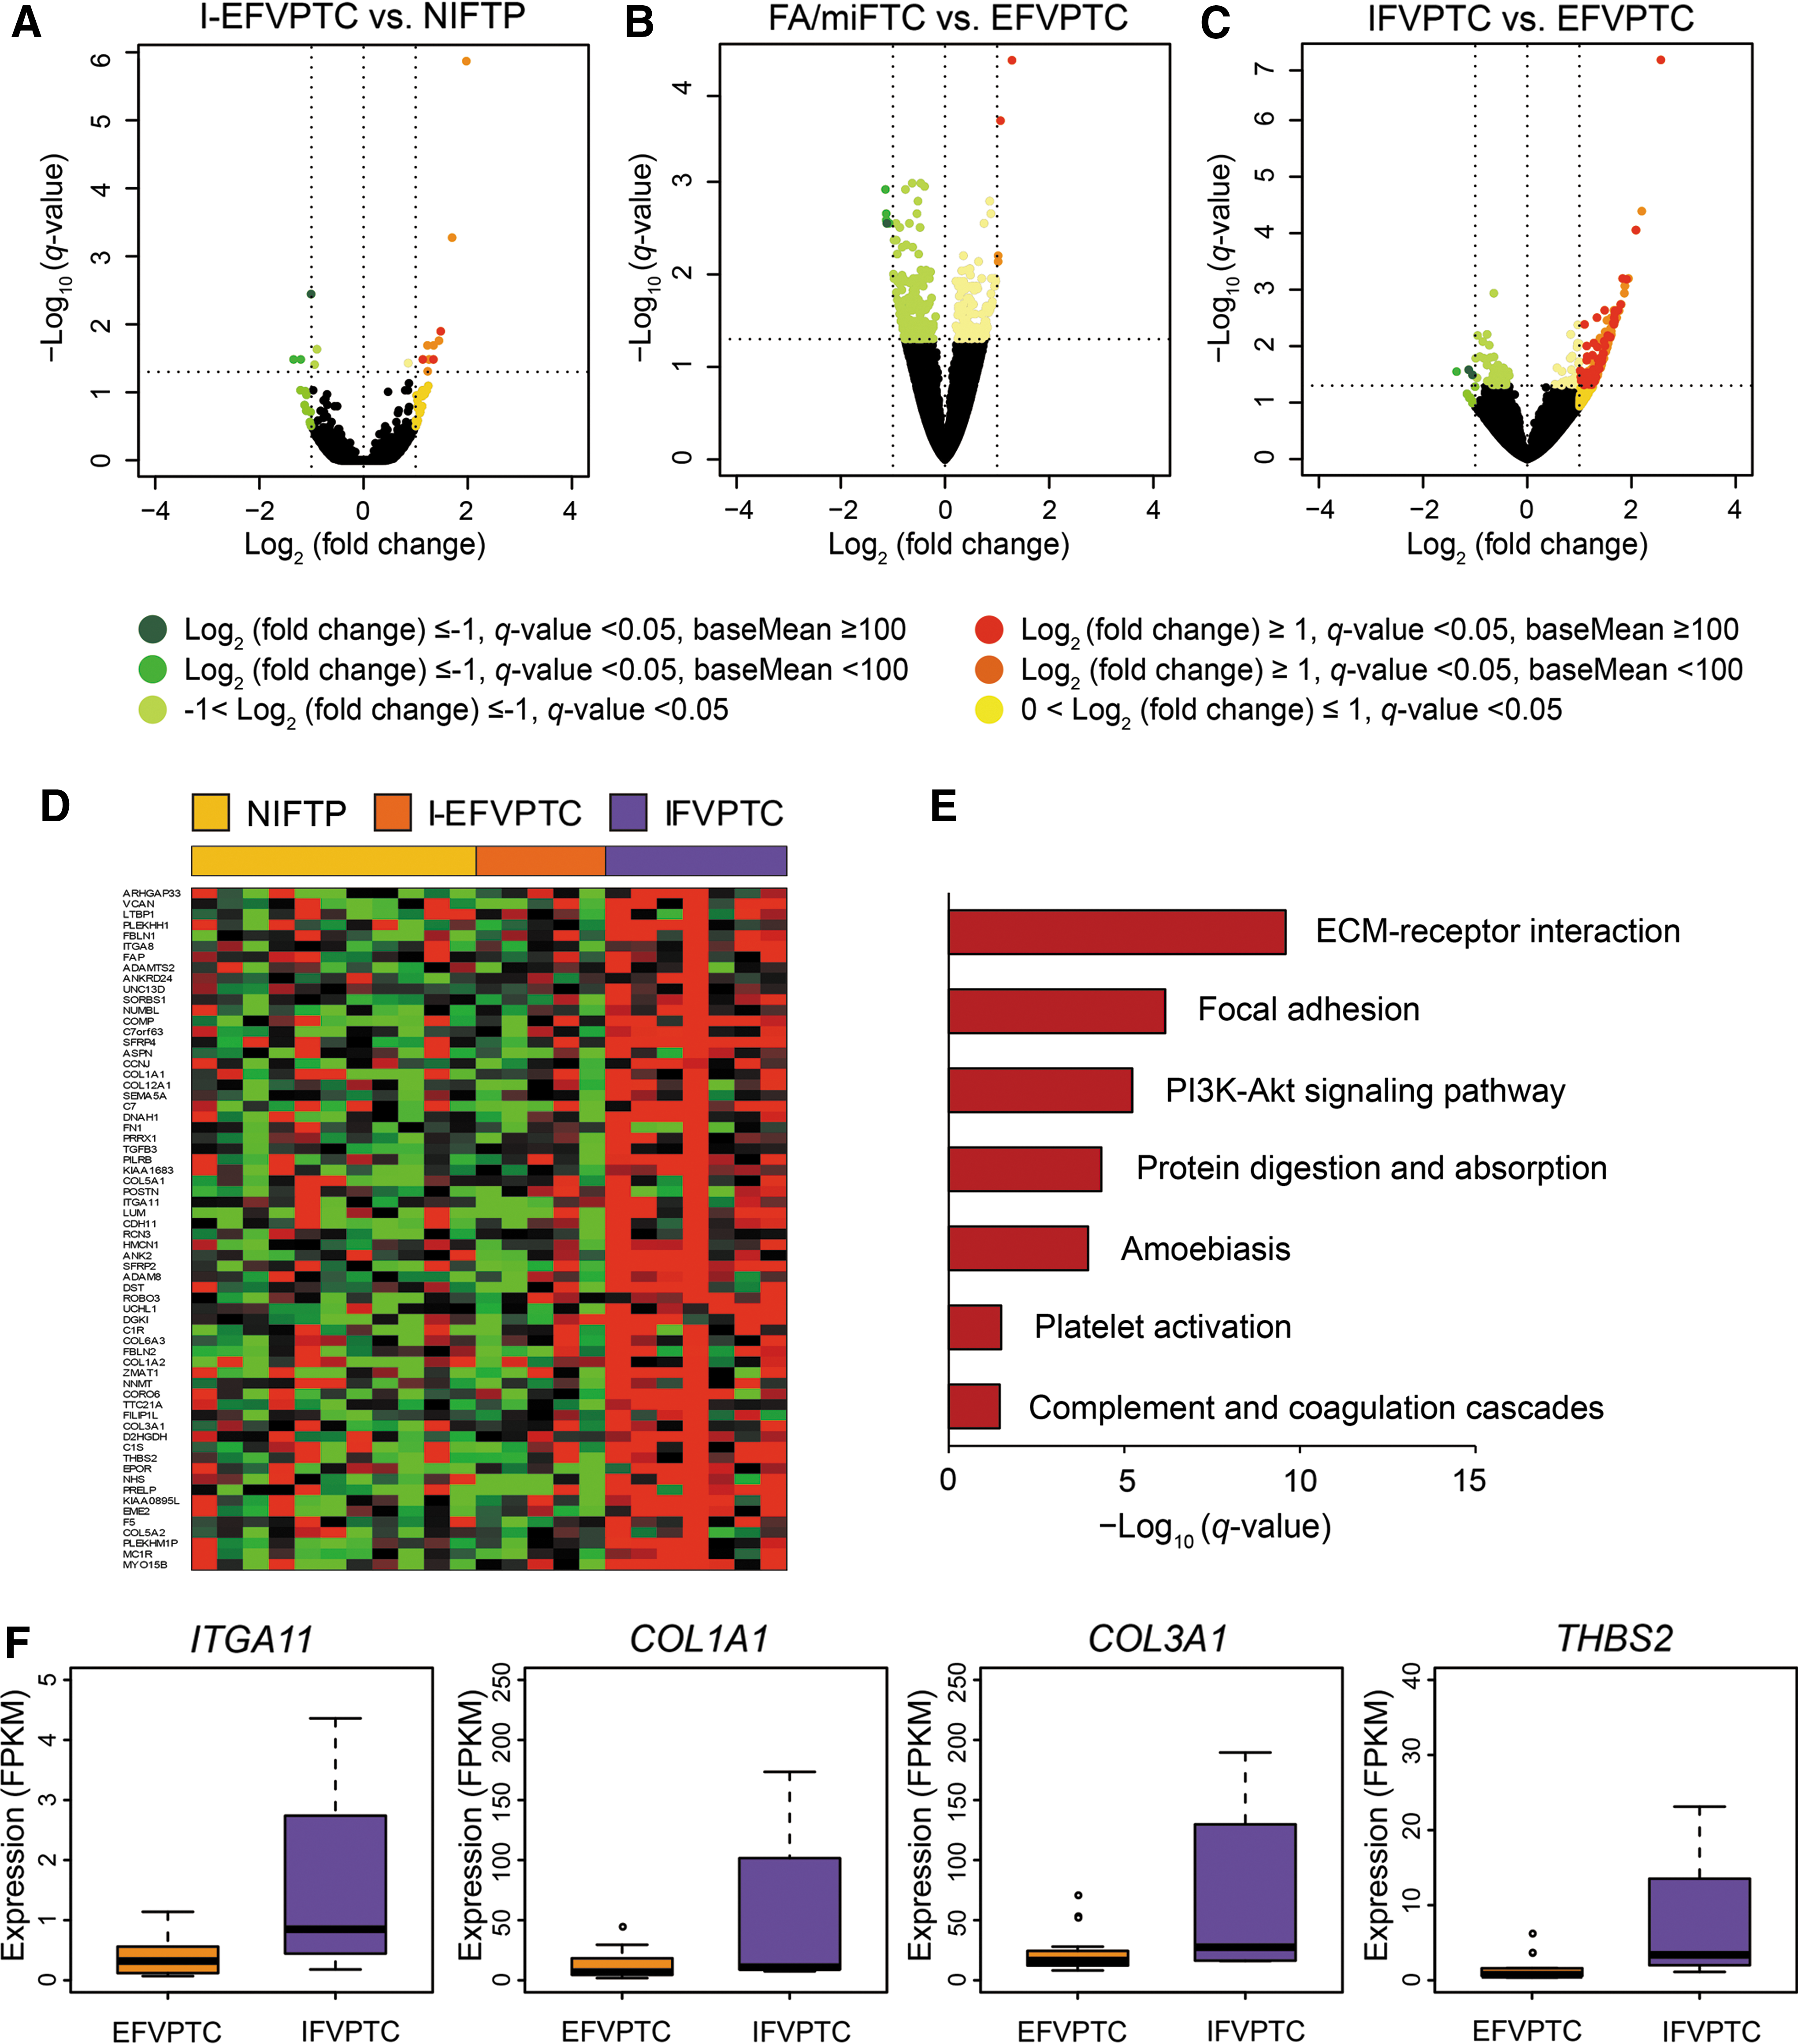
Comparison of transcriptomic profiles in FVPTC with RAS mutations. (
However, in comparing gene expression profiles of EFVPTC and IFVPTC with RAS mutations, a relatively large number of upregulated DEGs were observed (Fig. 2C and D), although most were RAS-like (Fig. 1). Next, functional enrichment analysis was performed with the upregulated DEGs, and it was noted that genes related to the extracellular matrix (ECM)–receptor interaction and focal adhesion were more dominantly activated in IFVPTC relative to those in EFVPTC (Fig. 2E and Supplementary Table S1; Supplementary Data are available online at
Comparison of transcriptomic profiles among subtypes of FVPTC with the BRAFV600E mutation
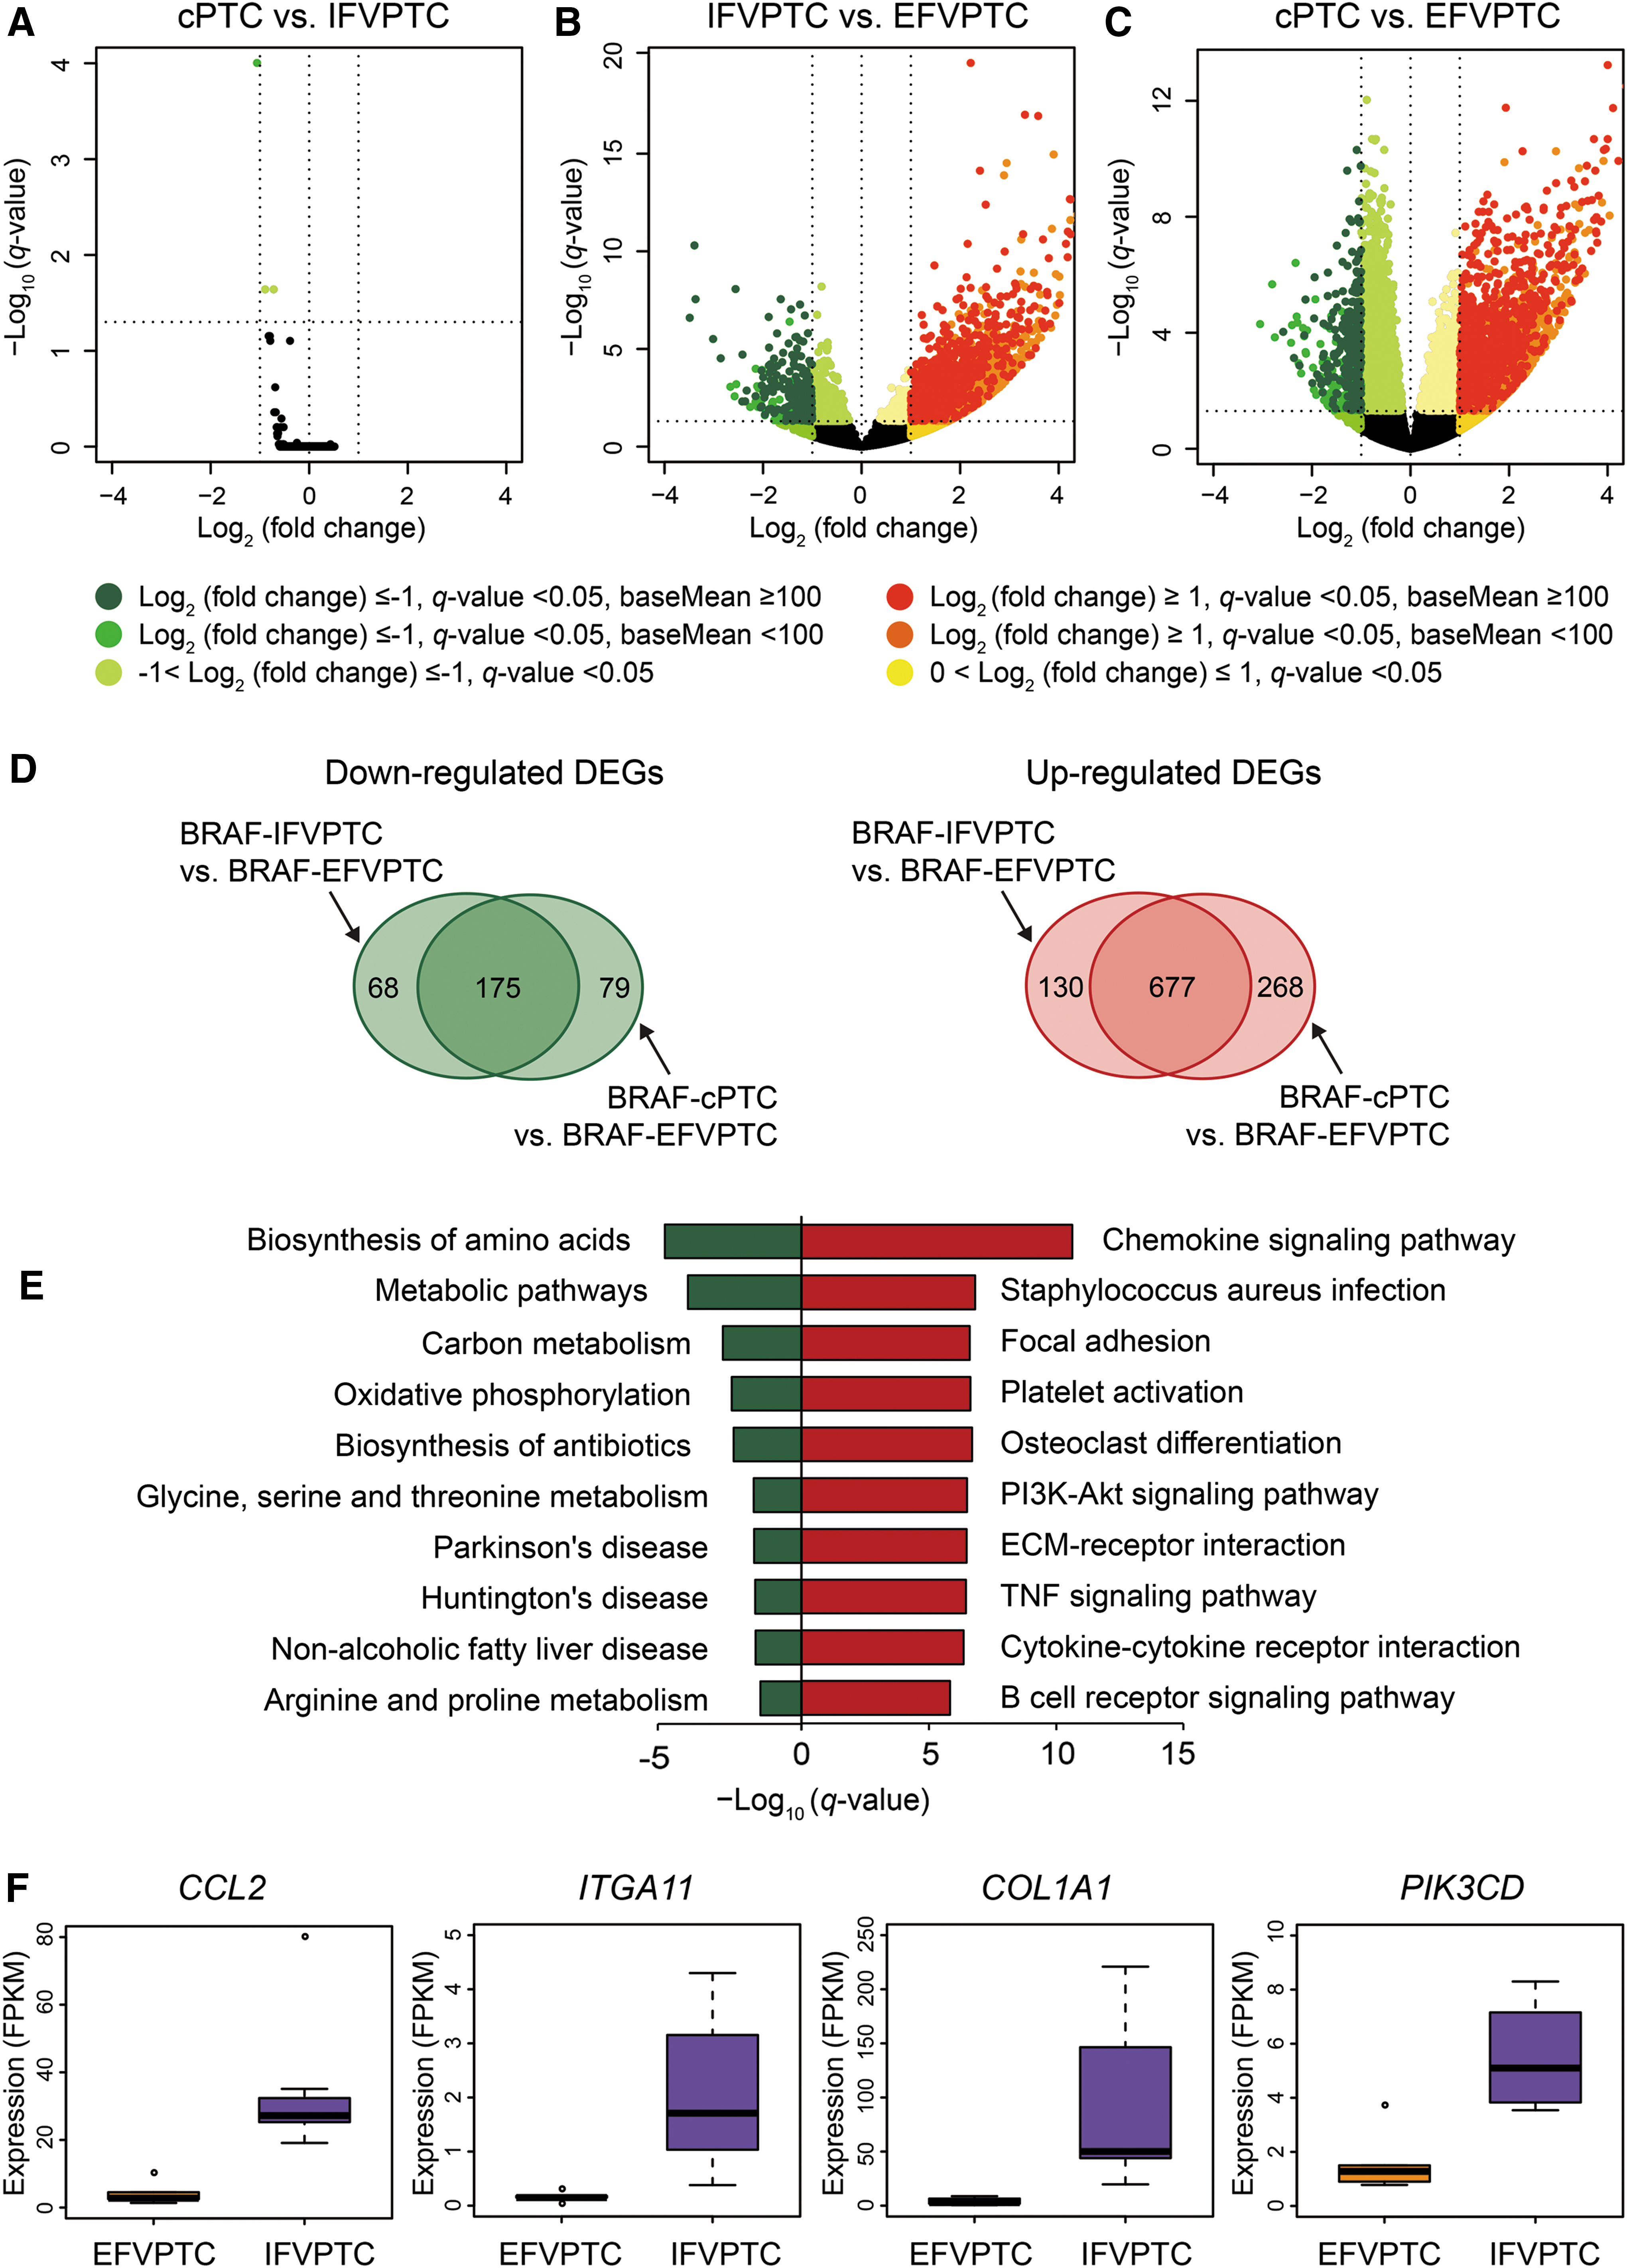
Next, the transcriptomic profiles of FVPTCs with the BRAFV600E mutation (n = 12) were compared according to the histologic subtypes. Because no NIFTP cases harbored the BRAFV600E mutation, all EFVPTCs were I-EFVPTC. IFVPTCs harboring the BRAFV600E mutation were indistinguishable from cPTC harboring the BRAFV600E mutation in terms of gene expression profile (Fig. 3A). Nonetheless, EFVPTC had a number of DEGs compared to IFVPTC (Fig. 3B) and cPTC (Fig. 3C); that is, the transcriptional profile of EFVPTC was significantly different from IFVPTC or cPTC, although they shared the BRAFV600E mutation. Thus, pathway enrichment analysis was performed on the 175 downregulated or 677 upregulated shared DEGs of IFVPTC and cPTC compared to EFVPTC (Fig. 3D). In general, the expression of metabolism-related genes was downregulated, and intracellular signaling pathways related to chemokine or cytokine production and cell adhesion or invasion, along with the PI3-Akt signaling pathway, were upregulated in cPTC or IFVPTC compared to in EFVPTC (Fig. 3E and Supplementary Table S2). Expression levels of major genes in upregulated pathways are shown in Figure 3F.
Comparison of transcriptomic profiles in FVPTC with the BRAFV600E
mutation. (
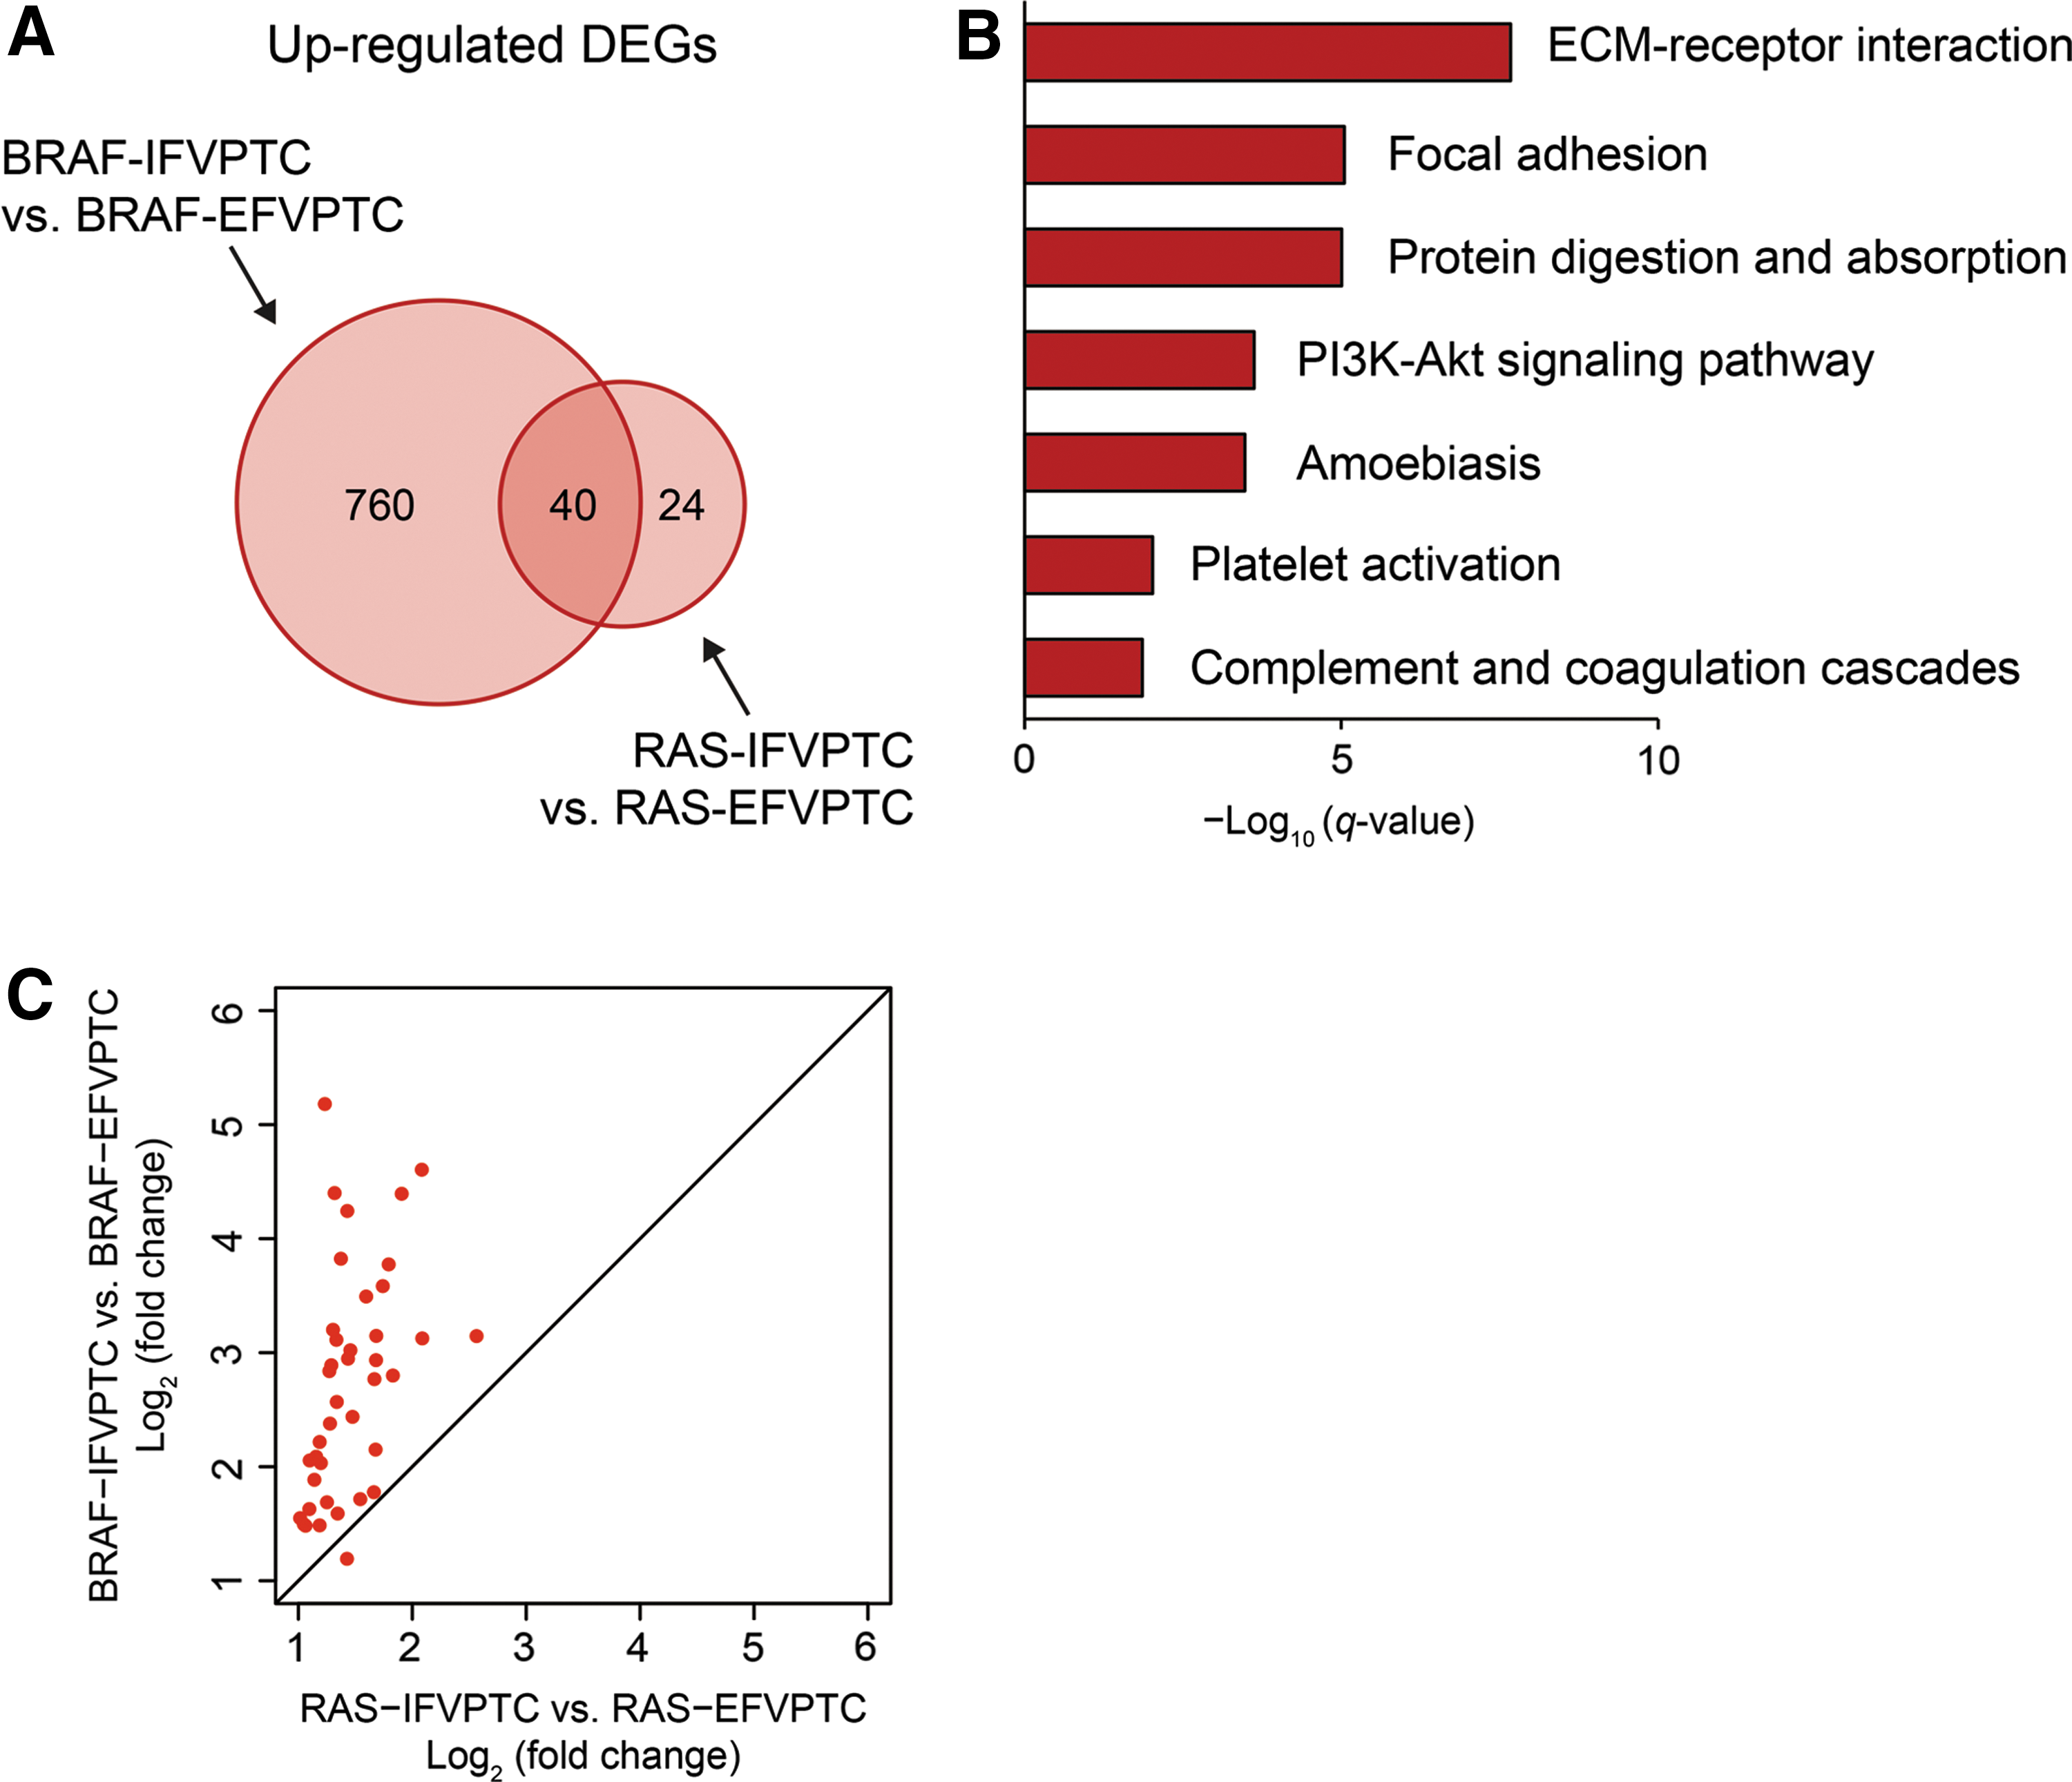
When genes upregulated in BRAFV600E -mutated IFVPTC versus BRAFV600E -mutated EFVPTC were compared to those upregulated in RAS-mutated IFVPTC versus RAS-mutated EFVPTC, 40 commonly upregulated DEGs were identified (Fig. 4A). Pathway enrichment analysis was performed with these overlapping DEGs (Fig. 4B), and it was found that molecular pathways such as ECM–receptor interaction, focal adhesion, and PI3K-Akt signaling pathway were commonly activated, demonstrating that similar molecular pathways are activated in IFVPTC and EFVPTC, regardless of the BRAFV600E or RAS mutational status. However, comparing expression levels of these commonly upregulated DEGs, the increment of expression relative to EFVPTC was greater in BRAFV600E -mutated IFVPTC than in RAS-mutated IFVPTC (p = 6.71 × 10⁻¹¹; Fig. 4C).
Commonly upregulated DEGs between IFVPTC with the BRAFV600E
mutation and that with RAS mutations compared to EFVPTC. (
Discussion
This study is the first investigation on the integrated transcriptomic, genomic, and clinical characterization of FVPTC subtypes. In NIFTP, the BRAFV600E mutation was not found, but RAS and other alterations were present in 64.7% and 17.6% of cases, respectively. On the other hand, in I-EFVPTC, the BRAFV600E mutation was found in 38.5% of cases, a similar proportion as in IFVPTC (38.9%). The proportion of RAS mutations (38.5% and 38.9%, respectively) or other alterations (15.4% and 16.7%, respectively) was also similar between I-EFVPTC and IFVPTC. In terms of the transcriptomic profile, EFVPTC with RAS mutations, including noninvasive and invasive subsets, had a RAS-like gene expression profile comparable to that of FA/miFTC, whereas IFVPTC with the BRAFV600E mutation had a BRAF-like profile similar to cPTC. Notably, intracellular signaling pathways related to cell adhesion and invasion were differentially activated in IFVPTC compared to EFVPTC, regardless of the BRAFV600E or RAS mutational status, suggesting the importance of those pathways during progression to a more invasive or infiltrative form of FVPTC.
Among FVPTC, EFVPTC is known to be similar to FA/miFTC. However, IFVPTC is close to cPTC in terms of both clinical behavior and mutational proportion (2,3). The gene expression profiles showed corresponding results, even if EFVPTC and IFVPTC have identical mutations. TCGA study (22) classified PTC into BRAF-like and RAS-like groups in which the tumor gene expression profile resembles either the BRAF or RAS mutant profile. In a previous study (9), in which FA and miFTC were also included, three distinct molecular subtypes were obtained, and it was demonstrated that intracellular pathways associated with cell proliferation or invasiveness, including MAPK pathways, were gradually activated from NBNR to RAS-like to BRAF-like, resulting in more aggressive tumor behavior. In the present study, in which tumors were subdivided by molecular subtype, most EFVPTCs were as RAS-like as FA/miFTC, even if they harbored the BRAFV600E mutation. On the other hand, all IFVPTCs harboring the BRAFV600E mutation showed BRAF-like features, similar to cPTC. Collectively, it can be inferred that NIFTP, I-EFVPTC, and FA/miFTC share activated molecular pathways and that IFVPTC and cPTC are within the same spectrum.
NIFTP had a transcriptomic profile similar to that of I-EFVPTC with RAS mutations, and both have a RAS-like molecular subtype. Moreover, the scores, which consist of combinations of specific gene expressions, did neither show distinct patterns between NIFTP and I-EFVPTC. In particular, the ERK, MAPK, and PI3K-Akt scores consisting of genes enriched in each pathway related to the proliferation and aggressiveness of thyroid cancer were relatively maintained compared to that in IFVPTC or cPTC. These results are consistent with recent studies using the Afirma gene expression classifier (24,25), which did not differentiate NIFTP from other thyroid malignancies in specimens with indeterminate cytology obtained through fine-needle aspiration biopsy. Denaro et al. (26) recently reported the miRNA expression profiles of NIFTP, even though they did not present mRNA expression data. They examined the mutational status of BRAF and RAS using direct DNA sequencing and showed that BRAF- or RAS-mutated NIFTPs had a miRNA expression profile similar to that of I-EFVPTC and IFVPTC, which deregulated the specific pathways involved in cell adhesion and migration, whereas wild-type NIFTPs had an expression profile resembling that of FA. In their study, 3/19 (15.8%) NIFTP cases harbored BRAF mutations. However, in the present study, none of the NIFTP cases had BRAF mutations, 11/17 (64.7%) cases had RAS mutations, and 6/17 (35.3%) cases were wild-type BRAF and RAS. Moreover, the molecular subtype of all RAS-mutated NIFTP was RAS-like, whereas most of the NIFTPs, which were wild-type RAS and BRAF harboring other fusion genes or unknown drivers, have the NBNR molecular subtype, which has the most indolent behavior, as demonstrated in a previous study (9).
In the pathway enrichment analysis, the molecular pathways associated with cell adhesion and invasion were activated in IFVPTC rather than in EFVPTC. This is consistent with the phenotype of IFVPTC, characterized by invasion to adjacent structures, that is, extrathyroidal extension and lymph node metastasis, rather than by distant metastasis. In terms of prognosis, among a total of 48 patients with FVPTC, only one IFVPTC patient showed progressive disease, and 47 patients were in remission. Thus, it was impossible to analyze associations between the histologic subtype or genetic profile and prognosis due to the small number of events. However, among IFVPTC, BRAFV600E -mutated tumors tended to have more aggressive clinicopathologic characteristics than observed in RAS-mutated tumors, which can be explained as follows on the basis of this comprehensive transcriptomic analysis. First, tumors with the BRAFV600E mutation show more changes in the gene expression profile between IFVPTC and EFVPTC compared to tumors with RAS mutations. Second, the degree of change in the expression of common DEGs was amplified in BRAFV600E -mutated IFVPTC compared to RAS-mutated IFVPTC. Third, the BRAFV600E -mutated IFVPTC had low TDS and relatively high ERK and MAPK scores. Moreover, the PI3K-Akt pathway genes were more strongly upregulated than in other histologic subtypes. Lastly, the transcriptomic profile of IFVPTC with the BRAFV600E mutation was not distinguishable from that of cPTC. Thus, a treatment strategy could be devised for IFVPTC cases, especially for those with the BRAFV600E mutation, similar to that for cPTC.
A previous study (9) reported that the frequencies of BRAFV600E and RAS mutations of FVPTC were intermediate between miFTC and cPTC, and the mutational profile of EFVPTC was similar to that of miFTC/FA, while that of IFVPTC was similar to cPTC. Regarding the transcriptomic profile, it was previously reported that the gene expression profile of EFVPTC or miFTC was indistinguishable from that of FA. However, in this study, EFVPTC was divided into NIFTP and I-EFVPTC, and it was also confirmed that the profiles of NIFTP and I-EFVPTC were not different from each other. In addition, this study shows that there was no DEG between IFVPTC and cPTC with the BRAFV600E mutation, indicating that their gene expression profiles were nearly identical. The stringent histologic classification of FVPTC subtypes is one of the strengths of this study. This contrasts with TCGA study (22), which included FVPTCs but had no information on subtypes, and a previous study (9), which classified FVPTCs only according to encapsulation. Moreover, because thyroid cancer has different gene expression patterns depending on the BRAFV600E or RAS mutation status (9,22), tumors were differentiated according to the mutational status to exclude the influences of the mutations, which enabled more accurate transcriptomic comparisons. Lastly, the application of pathway enrichment analysis or various enrichment scores to identify the molecular pathogenesis also distinguishes this study from the previous study.
Based on the observed transcriptomic, genomic, and clinical characteristics, the molecular profile of NIFTP and I-EFVPTC is shared with FA/miFTC, whereas that of IFVPTC is within the same spectrum as cPTC. Furthermore, the activation of cell adhesion and invasion pathways may play a key role in progression to the invasive phenotype of FVPTC.
Footnotes
Acknowledgments
This research was supported by the Basic Science Research Program through the National Research Foundation of Korea, funded by the Ministry of Science, ICT & Future Planning (grant number: NRF-2016R1A2B4012417), and by Korea Health Technology R&D Project through the Korea Health Industry Development Institute (KHIDI), funded by the Ministry of Health & Welfare, Republic of Korea (grant number: HI13C1927).
Author Disclosure Statement
The authors declare no conflict of interest.