
Abstract
Background:
TBX1 is a member of the T-box family of transcription factors characterized by a conserved DNA binding domain termed T-box. TBX1 has been reported to be downregulated in mouse skin tumors and is considered a negative regulator of tumor cell growth in mice. However, its role and exact mechanism in human cancers, including thyroid cancer, remain totally unknown.
Methods:
Quantitative reverse transcription polymerase chain reaction and Western blot assays were performed to evaluate the expression of investigated genes. Methylation-specific polymerase chain reaction and pyrosequencing were used to analyze TBX1 promoter methylation. The biological functions of TBX1 in thyroid cancer cells were determined by a series of in vitro and in vivo experiments. Chromatin immunoprecipitation sequencing and dual-luciferase reporter assays were used to identify its downstream targets.
Results:
This study demonstrates that TBX1 is frequently downregulated by promoter methylation in both papillary thyroid cancers and thyroid cancer cell lines. Ectopic expression of TBX1 in thyroid cancer cells dramatically inhibits cell viability, colony formation, and tumorigenic potential in nude mice, and induces cell-cycle arrest and apoptosis through modulating a panel of cell-cycle and apoptosis-related genes. In addition, ectopic expression of TBX1 significantly decreases the migration and invasion potential of thyroid cancer cells through inhibiting the process of epithelial–mesenchymal transition and the expression of matrix metalloproteinases. On the other hand, TBX1 knockdown markedly promotes thyroid cancer cell viability and invasiveness. Mechanistically, TBX1 exerts its tumor suppressor function in thyroid cancer cells through inhibiting phosphorylation of AKT at Ser473 and ERK via regulating its downstream targets such as RNF41, PARK2, and PHLPP2.
Conclusions:
The data show that TBX1 is frequently inactivated by promoter methylation and functions as a potential tumor suppressor in thyroid cancer through inhibiting the activities of the PI3K/AKT and MAPK/ERK signaling pathways.
Introduction
The incidence of thyroid cancer is growing the fastest among all malignancies worldwide, particularly in women (1,2). It is histologically classified into several types: papillary thyroid cancer (PTC), follicular thyroid cancer (FTC), poorly differentiated thyroid cancer (PDTC), anaplastic thyroid cancer (ATC), and medullary thyroid cancer. The majority of thyroid cancers are well differentiated thyroid carcinomas (WDTCs), including PTC and FTC, which generally have a good prognosis and can be efficiently cured by conventional therapies. However, some patients with WDTC may dedifferentiate into more aggressive disease such as metastatic differentiated thyroid cancer, PDTC, and ATC, which do not respond adequately to conventional therapies, ultimately leading to poor patient survival (3). Thus, there is a compelling need to explore the mechanisms underlying the pathogenesis and dedifferentiation of thyroid cancer.
Over the last decade, there has been an exponential growth in the elucidation of genetic events occurring in thyroid cancer. Most of these events are strongly associated with over-activation of the PI3K/AKT and MAPK/ERK signaling pathways. These two pathways play critical roles in the regulation of thyroid cancer cell growth, differentiation, metastasis, and survival, and have recently become major therapeutic targets for thyroid cancer (4,5). In addition to genetic events, aberrant epigenetic alterations also contribute to thyroid tumorigenesis (6,7). A well known example is DNA methylation by the enzymatic addition of methyl groups to CpG dinucleotides in gene promoter regions, which is considered as one of the major mechanisms to inactivate tumor suppressor genes, a mechanism also present in thyroid cancer (8). The identification of new genes functionally involved in thyroid tumorigenesis may help to find alternative strategies for diagnosis and therapy of thyroid cancer. The T-box (TBX) genes are part of a phylogenetically conserved family of genes involved in the regulation of developmental processes (9). In recent years, several members of this family have been demonstrated to be involved in tumorigenesis, such as TBX2, TBX3, and TBX5 (10,11). As a member of the T-box gene family, TBX1 is less well studied in tumor development and progression. To date, its role in the majority of human cancers, including thyroid cancer, remains totally unclear. It has been found to be deregulated in parathyroid tumors (12). It is also downregulated in mouse skin tumors and is considered as a negative regulator of tumor cell growth in mice (13).
The present study found a frequent inactivation of the TBX1 gene by promoter methylation in PTCs, and through a series of in vitro and in vivo experiments demonstrates that TBX1 exerts a tumor suppressor function in thyroid cancer cells. Mechanistically, TBX1 inhibits thyroid tumorigenesis through transcriptionally activating its downstream targets, thereby inhibiting the activities of the PI3K/AKT and MAPK/ERK cascades.
Methods
Clinical samples
This study was approved by the Institutional Review Board and Human Ethics Committee of the First Affiliated Hospital of Xi'an Jiaotong University. A total of 178 paraffin-embedded primary PTCs and 23 goiter tissues as normal control subjects were randomly obtained from the First Affiliated Hospital of Xi'an Jiaotong University. Moreover, 17 pairs of frozen surgical PTC and matched non-cancerous thyroid tissues were also obtained from this hospital. All of the tissues were histologically examined by two senior pathologists based on World Health Organization criteria. None of the patients received chemotherapy or radiotherapy before surgery. Informed consent was obtained from each patient before surgery.
RNA extraction, conventional reverse transcription polymerase chain reaction, and quantitative reverse transcription polymerase chain reaction
Tissue samples used for total RNA extraction include 17 pairs of frozen surgical PTC samples and their matched non-cancerous thyroid tissues. The protocols of RNA extraction, conventional reverse transcription polymerase chain reaction (RT-PCR), and quantitative RT-PCR (qRT-PCR) were performed, as described previously (14). The mRNA expression of the indicated genes was normalized to 18S rRNA cDNA. Each sample was run in triplicate. The primer sequences are presented in Supplementary Table S1.
Sodium bisulfite treatment, methylation-specific PCR, and pyrosequencing
Genomic DNA was isolated from paraffin-embedded tissues as previously described (15). Genomic DNA from cell lines was isolated using a standard phenol-chloroform protocol. The protocols of sodium bisulfite treatment, methylation-specific PCR (MSP), and pyrosequencing were performed, as described previously (15,16). The primer sequences for MSP and pyrosequencing are presented in Supplementary Table S1.
Cell lines and drug treatments
The thyroid cancer cell lines BCPAP, FTC133, IHH4, K1, 8305C, and normal thyroid epithelial cell–derived cell line HTori-3 were provided by Dr. Haixia Guan (The First Affiliated Hospital of China Medical University, Shenyang, P.R. China). C643 was provided by Dr. Lei Ye (Ruijin Hospital, Shanghai, P.R. China). To authenticate these thyroid cancer cell lines further, the STR DNA profiling of BCPAP, FTC133, IHH4, K1, 8305C, and C643 cell lines by Genesky Co. Ltd (Shanghai, P.R. China) was analyzed, and it was demonstrated that STR profiling of these cells was consistent with the database (COMIC;
Expression plasmids, short interfering RNAs, and transfection
A TBX1 expression plasmid (pcDNA3.1/myc-His[–] A-TBX1) containing a Myc tag was obtained from Yingrun Biotechnology Co., Ltd. (Changsha, P.R. China). Cells were transfected with pcDNA3.1/myc-His(–) A-TBX1 or pcDNA3.1/myc-His(–) A (empty vector) at 70% confluence using X-tremeGENE HP DNA Transfection Reagent (Thermo Fisher Scientific, Waltham, MA) according to the manufacturer's instructions. After 48 hours of transfection, the transfectants were selected in a medium containing 0.2–0.5 mg/mL of G418 (Merck KGaA, Darmstadt, Germany) for 14–20 days to generate stable transfected cells.
Oligonucleotides of target-specific and control short interfering RNAs (siRNAs) were obtained from GenePharma (Shanghai, P.R. China), and the sequences are presented in Supplementary Table S3. Cells were transfected at 50% confluence using Lipofectamine 3000 (Thermo Fisher Scientific) according to the manufacturer's instructions, with a final siRNA concentration of 50 nM. All experiments were performed in triplicate.
Cell viability and colony formation assay
Cells (1000–2000/well according to various cell lines) were plated and cultured on 96-well plates. An MTT assay was performed to evaluate cell viability at the indicated time points. In brief, cells were incubated with 20 μL of 5 mg/mL MTT agent (Sigma–Aldrich) for four hours, and then incubated with 150 μL of DMSO for another 15 minutes. The plates were then tested on a microplate reader with a test wavelength of 570 nm and a reference wavelength of 670 nm. The experiments were performed in triplicate to determine each data point. Statistical comparison was examined by using trend analysis.
The colony formation assay was performed using monolayer culture. Cells (500–800/well) were seeded on six-well plates and cultured with medium containing 0.1–0.2 mg/mL G418. The medium was refreshed every three days. After 14 days of culture, surviving colonies (≥50 cells per colony) were fixed with methanol, stained with 1.25% crystal violet, and counted. The experiments were performed in triplicate.
Cell-cycle and apoptosis assays
For the cell-cycle assay, cells transiently transfected with different constructs were harvested at 48 or 72 hours after transfection when the confluence reached 80–95%. Cells were washed twice with PBS, fixed in 70% ethanol on ice for at least 30 minutes, and then stained with propidium iodide solution (50 μg/mL propidium iodide, 50 μg/mL RNase A, 0.1% Triton-X, 0.1 mM EDTA). Cell-cycle distributions were assessed based on DNA contents by FACS using a flow cytometer (BD Biosciences, San Jose, CA).
For the apoptosis assay, cells with different treatments were harvested, washed with PBS, suspended in binding buffer, and sequentially stained with Annexin V-FITC Detection Kit (Roche Applied Science, Penzberg, Germany) according to the manufacturer's protocol. Next, apoptotic cells were detected using a flow cytometer. Each experiment was performed in triplicate.
Cell migration and invasion assays
Cell migration and invasion assays were evaluated by using Transwell chambers (8.0 μm pore size; EMD Millipore, Billerica, MA) pre-coated with rat-tail tendon collagen type I (0.5 mg/mL) on the lower surface. For the cell invasion assay, chambers were pre-coated with Matrigel (4 × dilution; 15 μL/well; BD Biosciences). Cells stably transfected with different constructs were starved overnight and then seeded in the upper chamber at a density of 2–3 × 10⁵ cells/mL in 200 μL of medium containing 0.5% FBS. Meanwhile, 1 mL of medium with 10% FBS was added to the lower chamber. After 24 hours of incubation, non-migrating (or non-invading) cells in the upper chamber were removed using a cotton swab, and migrating (or invading) cells were fixed with 100% methanol and stained with crystal violet solution (0.5% crystal violet in 2% ethanol). The number of migrating (or invading) cells is shown as the average number of five randomly microscopic fields. Each experiment was performed in triplicate.
Western blot analysis
Total protein was extracted using RIPA buffer containing protease inhibitors. Equal amounts of protein lysates were subjected to 10% sodium dodecyl sulfate polyacrylamide gel electrophoresis, and transferred onto polyvinylidene fluoride membranes (Roche Diagnostics GmbH, Mannheim, Germany). The membranes were immunoblotted overnight at 4°C with primary antibodies. Antibodies against TBX1, E-cadherin, N-cadherin, and Vimentin were purchased from Abcam (Cambridge, United Kingdom). Antibodies against phospho-AKT (Ser473), phospho-AKT (Thr308), total-AKT, phospho-ERK1/2, and total-ERK1/2 were purchased from Bioworld Technology, Inc. (St. Louis Park, MN). Antibodies against RNF41 (known as NRDP1) and PARK2 were purchased from Santa Cruz Biotechnology, Inc. (Santa Cruz, CA). An antibody against PHLPP2 was purchased from Abnova (Taipei, Taiwan). An antibody against GAPDH was purchased from Abgent, Inc. (San Diego, CA). The catalog number of antibodies used in this study is shown in Supplementary Table S4. This was followed by incubation with their respective horseradish peroxidase–conjugated secondary antibodies from ZSGB-bio (Beijing, P.R. China), and immunoblotting signals were visualized using the Western Bright ECL detection system (Advansta, Menlo Park, CA).
Chromatin immunoprecipitation sequencing and chromatin immunoprecipitation qPCR
The chromatin immunoprecipitation sequencing (ChIP-Seq) assay was performed to identify the target genes of TBX1 in BCPAP cells, as described previously (18). All the raw data sets have been deposited in the NCBI Gene Expression Omnibus (accession number GSE111072). Input and ChIP products were used as DNA templates for qPCR analysis. The primer sequences and positions are presented in Supplementary Table S5. The data were calculated by the 2−(Ct of IP sample − Ct of input sample) method and are presented as a percentage of input. Each experiment was performed in triplicate.
Dual-luciferase reporter assay
To construct luciferase reporter plasmids, the indicated promoter or intronic regions of TBX1 target genes were amplified from genomic DNA of HTori-3 cells. The promoter amplification products of AKAP12 and RNF41 were inserted into pre-digested pGL3-Basic vector (Promega Corp., Madison, WI) to produce the luciferase reporter plasmids. The intron amplification products of other target genes such as ABI3BP, NPR2, PARK2, PHLPP2, PPP2R2B, PTPRQ, RAP1GAP, RGS17, and THRB were inserted into pre-digested pGL3-Promoter vector (Promega Corp.). All of the constructs were verified by Sanger sequencing. The primers for plasmid constructs are presented in Supplementary Table S6. BCPAP and K1 cells were transfected with pcDNA3.1/myc-His(–) A -TBX1 or empty vector in six-well plates and were co-transfected with the indicated luciferase reporter plasmids and pRL-TK plasmids (Promega Corp.) using Lipofectamine 3000. The pRL-TK plasmid containing Renilla luciferase was used to normalize transfection efficiency. Cells were collected 36 hours post transfection, and luciferase activities were analyzed on an EnSpire Multimode Plate Reader (PerkinElmer, Fremont, CA) using the dual-luciferase reporter assay system (Promega Corp.) according to the manufacturer's instructions. Data are expressed as relative luciferase activity (Firefly luciferase activity/Renilla luciferase activity). Each experiment was performed in triplicate.
Animal studies
Four- to six-week-old female athymic mice were purchased from SLAC Laboratory Animal Co. Ltd. (Shanghai, P.R. China). The mice were randomly divided into two groups (five mice per group). Tumor xenografts were established by subcutaneous inoculation of 4 × 10⁶ FTC133 cells stably expressing TBX1 or control cells into the right armpit region of nude mice. From day 3 post injection, tumor size was measured every two days. Tumor volumes were calculated by the formula (length × width2 × 0.5). Statistical comparison of tumor growth curves was examined using trend analysis. The mice were sacrificed after 15 days, and tumors were harvested and weighted. Next, tumors obtained from representative animals were embedded in paraffin and sectioned at 5 μm until use. All experimental procedures involving animals were conducted in accordance with institution guidelines and were approved by the Laboratory Animal Center of Xi'an Jiaotong University.
Immunohistochemistry
Immunohistochemistry was performed to evaluate the levels of the indicated proteins in the xenograft tumors. Paraffin-embedded tissue sections (5 μm) were deparaffinized and rehydrated in a graded series of ethanol, and washed in distilled water. After antigen retrieval and blocking, the sections were incubated with different antibodies overnight at 4°C. Immunodetection was performed with the streptavidin-peroxidase system (ZSGB-bio) according to the manufacturer's protocol, followed by reaction with diaminobenzidine and counterstaining with hematoxylin.
Statistical analysis
The Mann–Whitney U-test was performed to compare TBX1 expression between tumor tissues and control subjects. Paired samples were compared by the paired t-test. Independent sample t-tests and chi-square tests were used to analyze continuous and categorical variables, respectively. All statistical analyses were performed using SPSS for Windows v11.5 (SPSS, Inc., Chicago, IL). All values are expressed as the mean ± standard deviation. A p-value of <0.05 was considered to be statistically significant.
Results
TBX1 is frequently downregulated by promoter methylation in primary PTCs and thyroid cancer cell lines
To explore the potential role of TBX1 in thyroid cancer, first TBX1 expression was examined in 17 primary PTCs and their matched non-cancerous thyroid tissues (control subjects) by qRT-PCR and Western blot assays. As shown in Figure 1A and B, TBX1 was significantly downregulated in PTCs at both mRNA and protein levels relative to control subjects. This was further supported by The Cancer Genome Atlas data set from the Cancer Browser database, which revealed that TBX1 expression in PTCs was significantly lower than that in non-cancerous thyroid tissues or their matched non-cancerous tissues (Fig. 1C and D). Given that promoter methylation is a major mechanism of gene silencing, next promoter methylation of TBX1 in PTCs was evaluated using a MSP assay. The data show that TBX1 methylation was found in 66/178 (37.1%) PTCs, while it was only found in 4/23 (17.4%) control subjects. MSP results of two representative PTCs are shown in Figure 1E. The association of TBX1 methylation with clinicopathologic characteristics was further analyzed in these 178 PTCs. However, no significant relationships were found between TBX1 methylation and most of the clinicopathologic characteristics, such as age, tumor invasion, lymph node metastasis, TNM stage, and recurrence. The study only found that TBX1 methylation was significantly correlated with sex (p = 0.006). This may be partly explained by the high incidence of thyroid cancer in women (Supplementary Table S7).

Frequent TBX1 inactivation by promoter methylation in papillary thyroid cancer (PTC) and thyroid cancer cell lines. (
Similarly, complete or partial TBX1 methylation was detected in all six thyroid cancer cell lines (Fig. 1F). Accordingly, it was found that TBX1 was silenced in four of six thyroid cancer cell lines, except for IHH4 and C643 (Fig. 1G, upper panel), while TBX1 exhibited relatively higher mRNA levels in the normal thyroid epithelial cell–derived cell line HTori-3 compared to most of the thyroid cancer cell lines (Supplementary Fig. S1). To determine the role of epigenetic mechanisms in TBX1 silencing further, cancer cells were treated with the DNMT inhibitor 5-Aza-dC or the HDAC inhibitor SAHA. As shown in Figure 1G (middle panel), 5-Aza-dC treatment resulted in the restoration of TBX1 expression in all cell lines. Moreover, SAHA treatment also induced TBX1 re-expression in some of these cell lines (Fig. 1G, lower panel). Next, pyrosequencing analysis was used to evaluate the effect of 5-Aza-dC on TBX1 methylation in BCPAP, FTC133, and K1 cells. As shown in Figure 1H, 5-Aza-dC treatment decreased methylation levels of all six CpG sites within the TBX1 promoter in these three cell lines relative to the controls, further confirming the role of promoter methylation in TBX1 inactivation. Taken together, the results indicate that promoter methylation is involved in transcriptional inactivation of TBX1 in thyroid cancer.
TBX1 inhibits thyroid cancer cell growth in vitro and in vivo
Frequent downregulation of TBX1 in thyroid cancer cells and PTCs suggests that it may be a potential tumor suppressor in thyroid cancer. Next, a series of loss-of-function and gain-of-function experiments were performed to illustrate the potential function of TBX1 in thyroid cancer cells. The data show that ectopic expression of TBX1 in BCPAP, K1, and FTC133 cells could be verified by qRT-PCR and Western blot assays (Fig. 2A), and TBX1 re-expression significantly inhibited thyroid cancer cell viability compared to controls (Fig. 2B). The growth-inhibitory effect of TBX1 in thyroid cancer cells was further confirmed by a colony formation assay. As shown in Figure 2C, the colonies formed in TBX1-transfected cells were significantly fewer than those formed in vector-transfected cells. On the other hand, knocking down TBX1 in C643 cells by using two different TBX1 siRNAs (si-TBX1 #1 and #2) dramatically promoted cell viability and the colony-forming ability compared to control siRNA (si-NC; Fig. 2D–F), further supporting the tumor suppressive role of TBX1 in thyroid cancer cells.
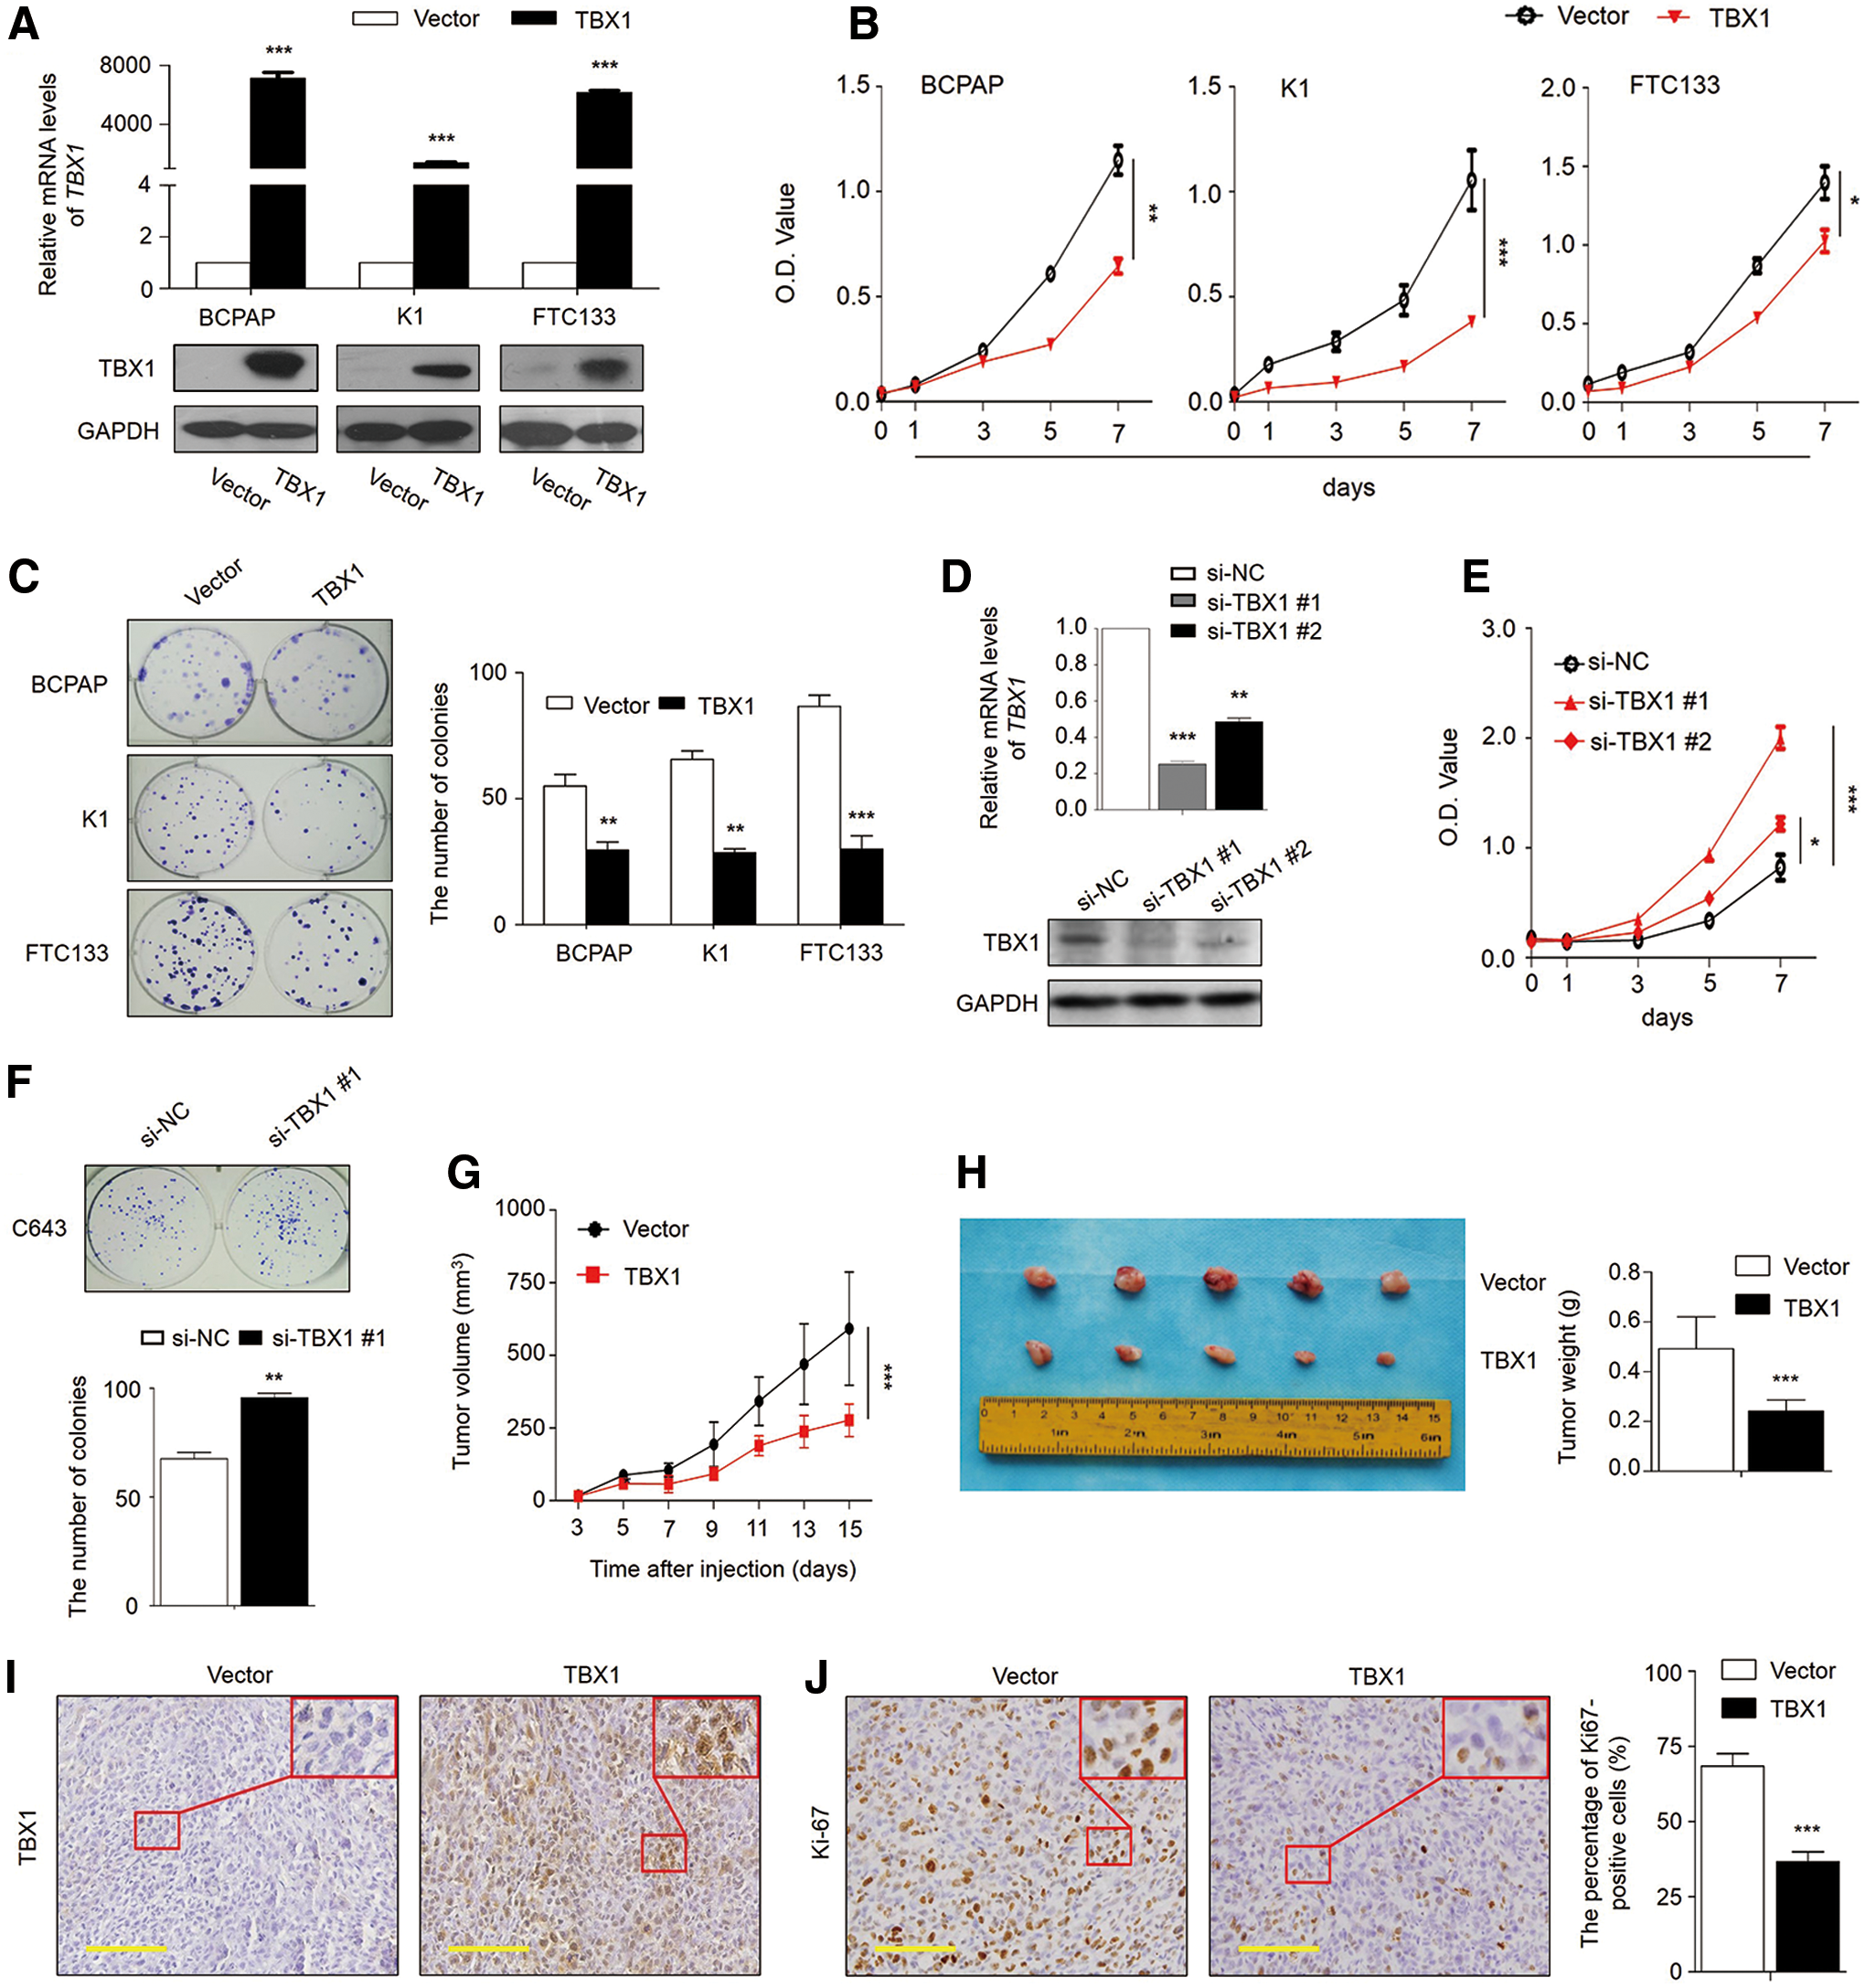
TBX1 inhibits thyroid cancer cell growth. (
Next, the tumor inhibitory effect of TBX1 was evaluated in nude mice in vivo. As shown in Figure 2G, the tumors induced by FTC133 cells stably expressing TBX1 exhibited significantly longer latency and smaller mean tumor volumes than control tumors. At the end of the experiments, xenograft tumors were isolated and weighed. The mean weight of the tumors stably expressing TBX1 was significantly less compared to control tumors (Fig. 2H). Meanwhile, the results show that the percentage of Ki-67 positive cells was significantly decreased in the tumors stably expressing TBX1 compared to control tumors (Fig. 2I and J). Taken together, the data indicate that TBX1 may be a tumor suppressor gene in thyroid cancer.
TBX1 induces G2/M cell-cycle arrest and apoptosis
The study also tested the effect of ectopic expression of TBX1 on thyroid cancer cell-cycle contributions. As shown in Figure 3A, relative to vector-transfected cells, the cell cycle was arrested at the G2/M phase in TBX1-transfected cells. The percentage of G2/M phase was increased from 9.05 ± 2.19% to 18.6 ± 2.1% in BCPAP cells (p < 0.001), from 21.66 ± 1.65% to 27.96 ± 1.59% in K1 cells (p < 0.001), and from 15.45 ± 1.93% to 25.35 ± 2.92% in FTC133 cells (p = 0.012), respectively. There is evidence showing that the Chk kinases such as Chk1or Chk2 prevent the activation of the Cyclin B/Cdc2 complex through inactivating Cdc25c (19). Thus, the effect of ectopic expression of TBX1 on the expression of Chk1, Chk2, Cdc25c, Cyclin B, and Cdc2 was tested in the above cell lines. As shown in Figure 3B, ectopic expression of TBX1 significantly upregulated the expression of Chk1 and Chk2 in BCPAP and FTC133 cells and Chk2 expression in K1 cells, and downregulated the expression of Cdc25c, Cyclin B, and Cdc2 in all three thyroid cancer cell lines.
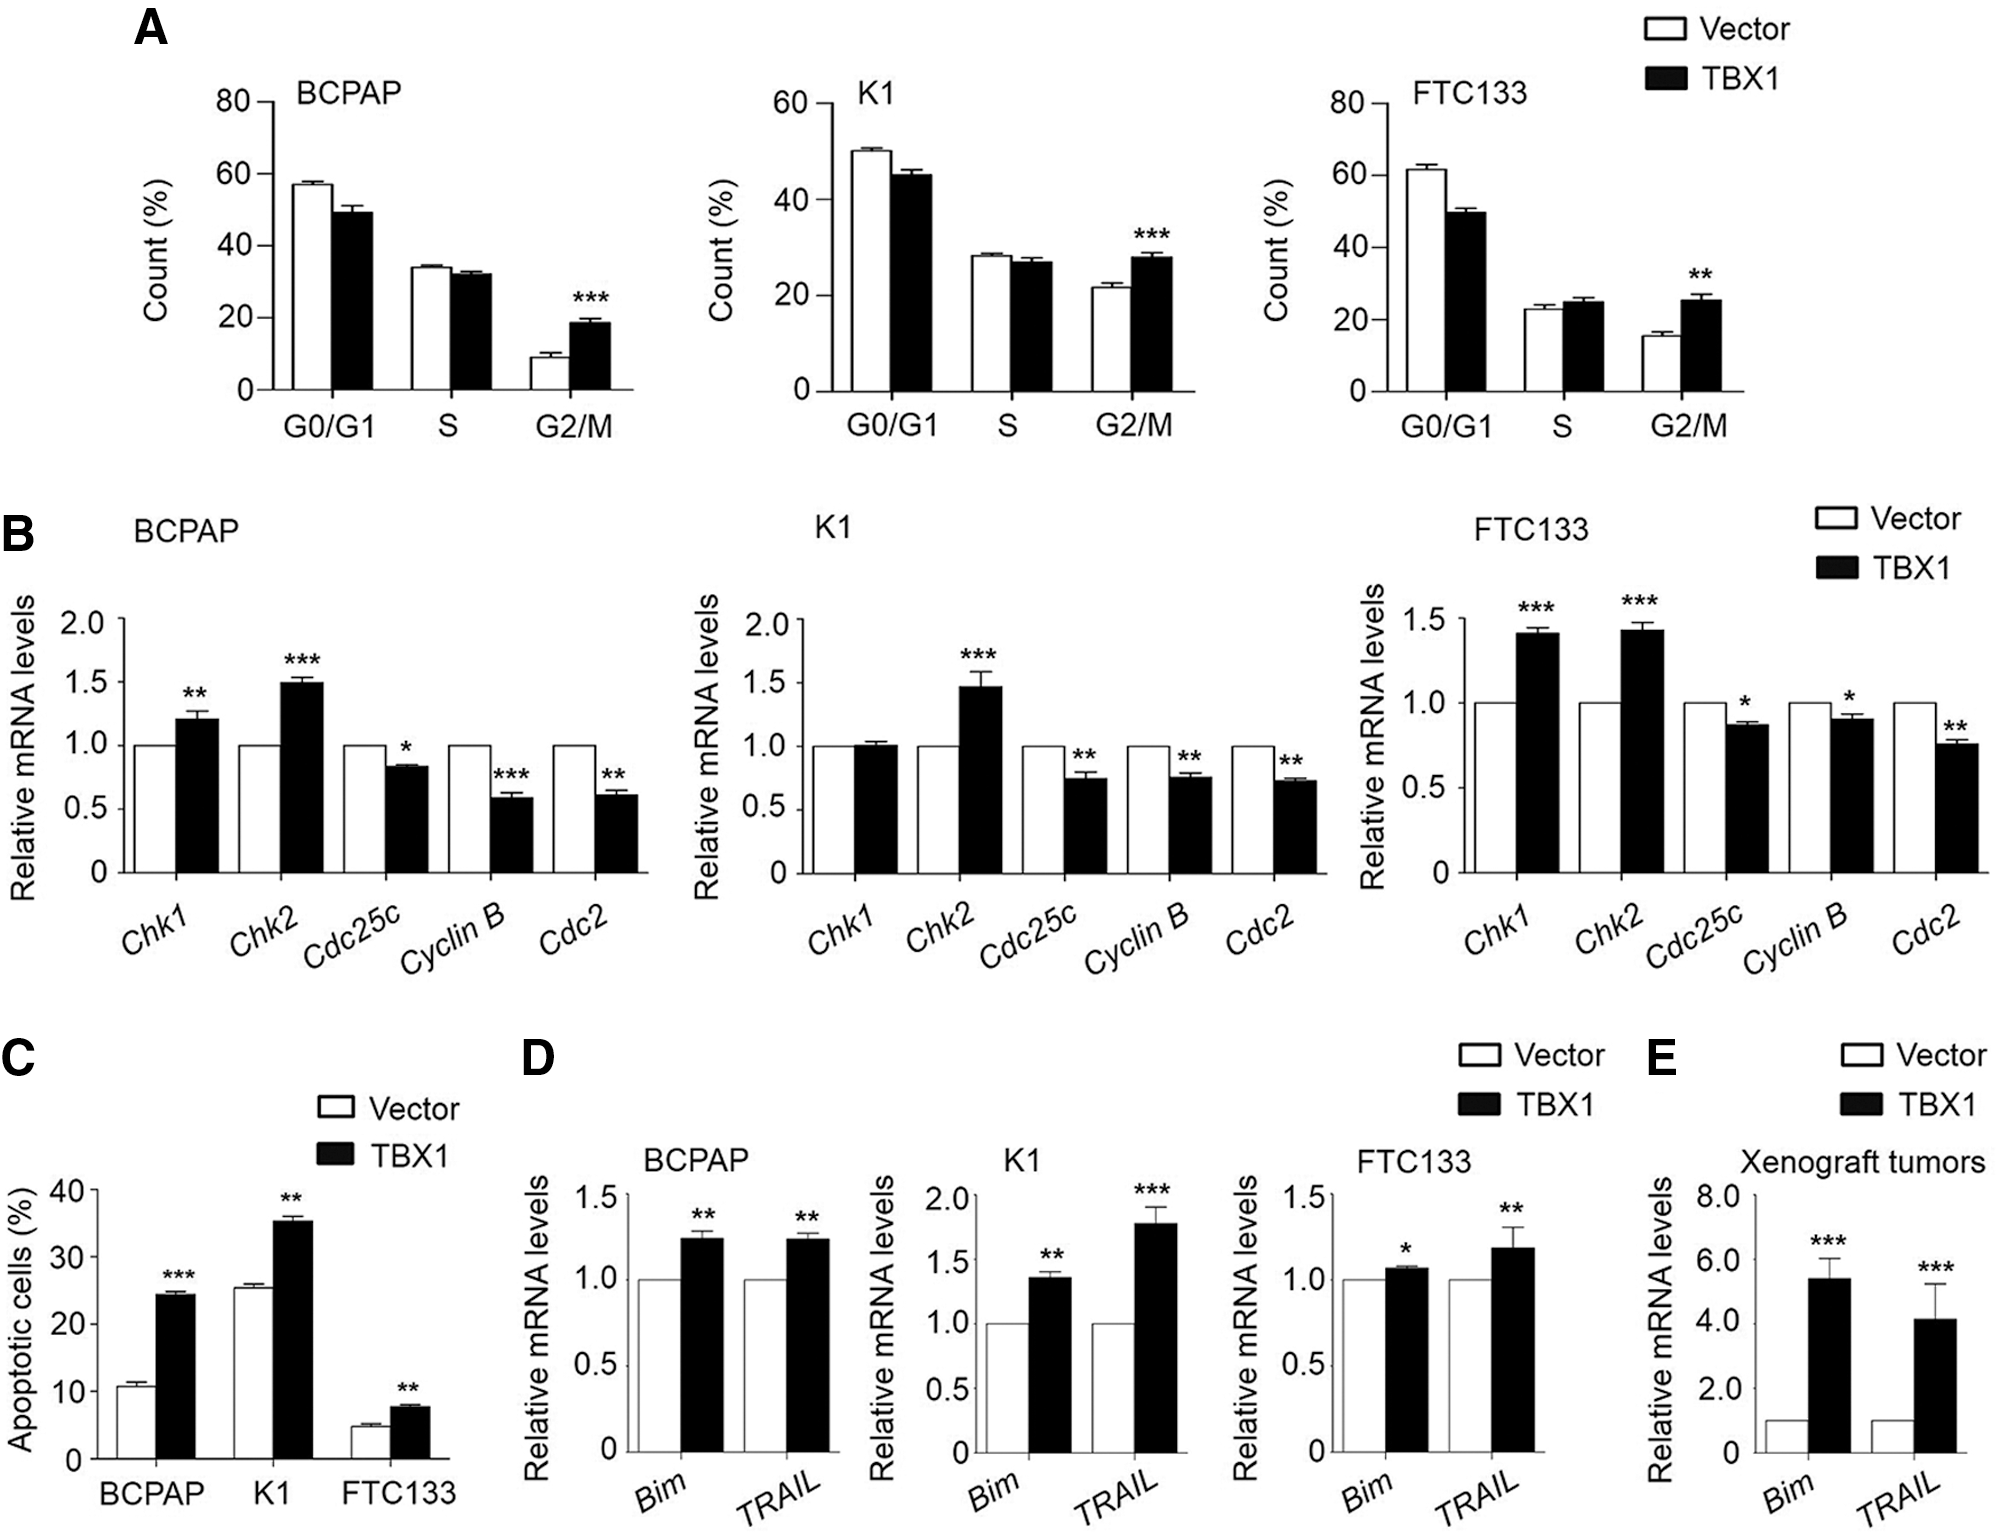
TBX1 induces G2/M phase arrest and apoptosis of thyroid cancer cells. (
Next, the effect of ectopic expression of TBX1 on cell apoptosis was evaluated. The results show that TBX1 transfection resulted in an increase in both early and late apoptosis compared to empty vector transfection (10.76 ± 1.08% vs. 24.37 ± 0.83% in BCPAP cells, p < 0.001; 25.4 ± 0.94% vs. 35.3 ± 1.21% in K1 cells, p < 0.001; 4.79 ± 0.66% vs. 7.71 ± 0.56% in FTC133 cells, p = 0.004; Fig. 3C and Supplementary Fig. S2). Meanwhile, it was also found that two important apoptosis-related genes, Bim and TRAIL, were significantly upregulated in the TBX1-transfected groups in vitro and in vivo when compared to control groups (Fig. 3D and E). These findings suggest that TBX1 induces G2/M cell-cycle arrest and apoptosis of thyroid cancer cells through regulating a panel of cell-cycle and apoptosis-related genes.
TBX1 inhibits thyroid cancer cell migration and invasion
Given that tumor metastasis is a leading cause of death in thyroid cancer, next the effect of ectopic expression of TBX1 on thyroid cancer cell migration and invasion was tested. As shown in Supplementary Figure S3A, the number of migrated cells in the TBX1-transfected cells was significantly decreased compared to that in the vector-transfected cells. Moreover, the invasion assay showed that the number of TBX1-transfected cells passing through the Matrigel-coated membrane was significantly decreased compared to vector-transfected cells. On the other hand, TBX1 knockdown enhanced thyroid cancer cell migration and invasion (Supplementary Fig. S3B). These data suggest that there is a potential link between epigenetic inactivation of TBX1 and metastatic phenotypes of thyroid cancer cells.
TBX1 inhibits the process of epithelial–mesenchymal transition and the expression of matrix metalloproteinases in thyroid cancer cells
Evidently, epithelial–mesenchymal transition (EMT) activation and matrix metalloproteinase (MMP) overexpression play critical roles in tumor invasion and metastasis (20,21). Thus, first the effect of TBX1 ectopic expression was tested on the expression of the epithelial cell marker E-cadherin and two well-known mesenchymal markers N-cadherin and Vimentin in BCPAP, K1, and FTC133 cells by qRT-PCR and Western blot assays. As shown in Figure 4A and B, E-cadherin was substantially upregulated, and N-cadherin and Vimentin were significantly downregulated in the TBX1-transfected cells relative to control cells. In addition, ectopic expression of TBX1 significantly downregulated the expression of the E-cadherin repressors Snail, Slug, and Twist in BCPAP and FTC133 cells, while it only downregulated the expression of Twist but not Snail and Slug in K1 cells (Fig. 4C). However, there is evidence showing that Twist itself plays an essential role in tumor metastasis, and ectopic expression of Twist can induce an EMT and confers a metastatic phenotype through regulating E-cadherin expression (22).
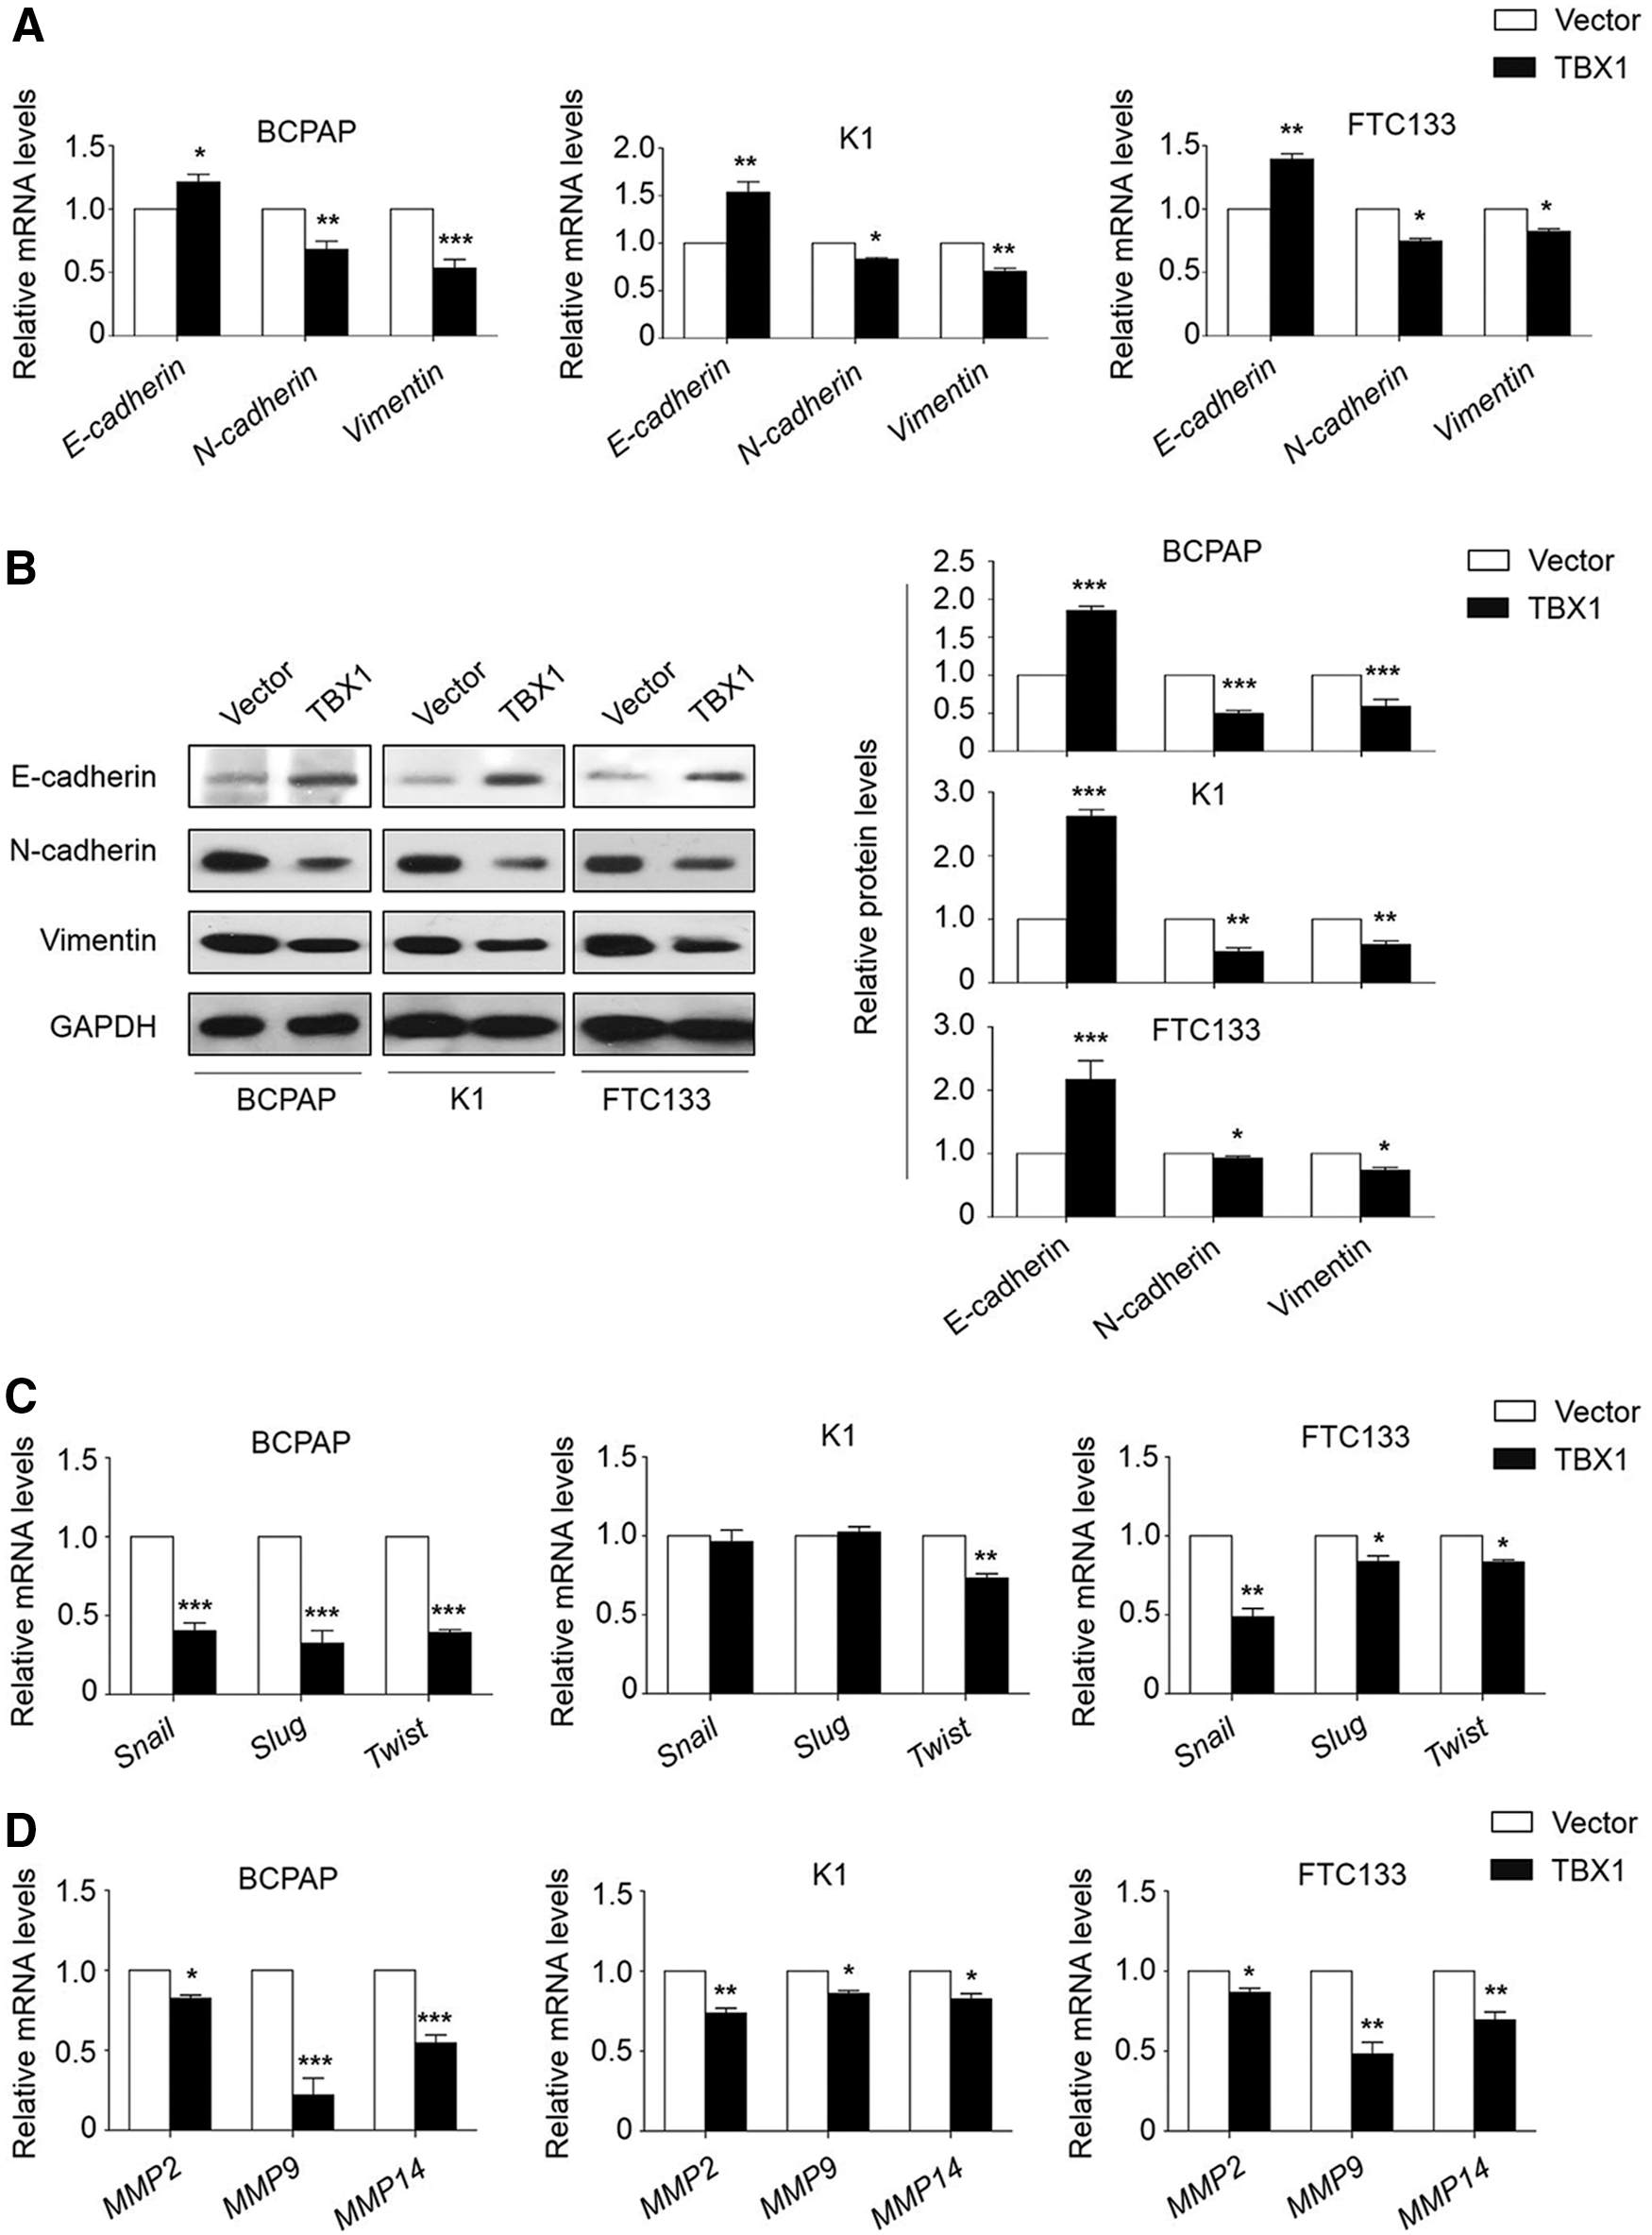
TBX1 inhibits the epithelial–mesenchymal transition (EMT) process and the expression of matrix metalloproteinases (MMPs). (
Next, the effect of ectopic expression of TBX1 was also evaluated on the expression of three key members of MMPs (MMP-2, -9, and -14) in the above three thyroid cancer cell lines. As expected, ectopic expression of TBX1 in these cells significantly inhibited the expression of these three MMP genes (Fig. 4D). Collectively, these results suggest that TBX1 inhibits thyroid cancer cell migration and invasion through blocking the EMT process and the expression of MMPs.
Identification of TBX1 target genes in thyroid cancer cells
Given that TBX1 is a member of the T-box family of transcription factors, thus it is considered that identification of its downstream targets is required to clarify the mechanism underlying its tumor suppressive activity. Next, ChIP-Seq assays were performed to identify TBX1 downstream targets. As shown in Figure 5A (upper panel), 3498 binding sites of TBX1 were identified: 247 binding sites located in the 2000 bp upstream of gene promoters, 1337 binding sites located in introns, 116 binding sites located within 2000 bp downstream of the respective gene, 1614 binding sites located in intergenic regions, 74 binding sites located in the 5′-UTR, 66 binding sites located in the 3′-UTR, and 44 binding sites located in the coding sequence (CDS) regions. In addition, a sequence motif of all TBX1-enriched regions was identified by using Multiple Em for Motif Elicitation (Fig. 5A, lower panel). Interestingly, among these TBX1 target genes, a number of genes have been demonstrated to be involved in modulating the activities of the PI3K/AKT and MAPK/ERK pathways, such as AKAP12, RNF41, ABI3BP, NPR2, PARK2, PHLPP2, PPP2R2B, PTPRQ, RAP1GAP, RGS17, and THRB. It is well documented that these two pathways play a prominent role in thyroid tumorigenesis (4,5). Thus, it is speculated that TBX1 inhibits thyroid tumorigenesis through modulating the activities of the PI3K/AKT and MAPK/ERK cascades.
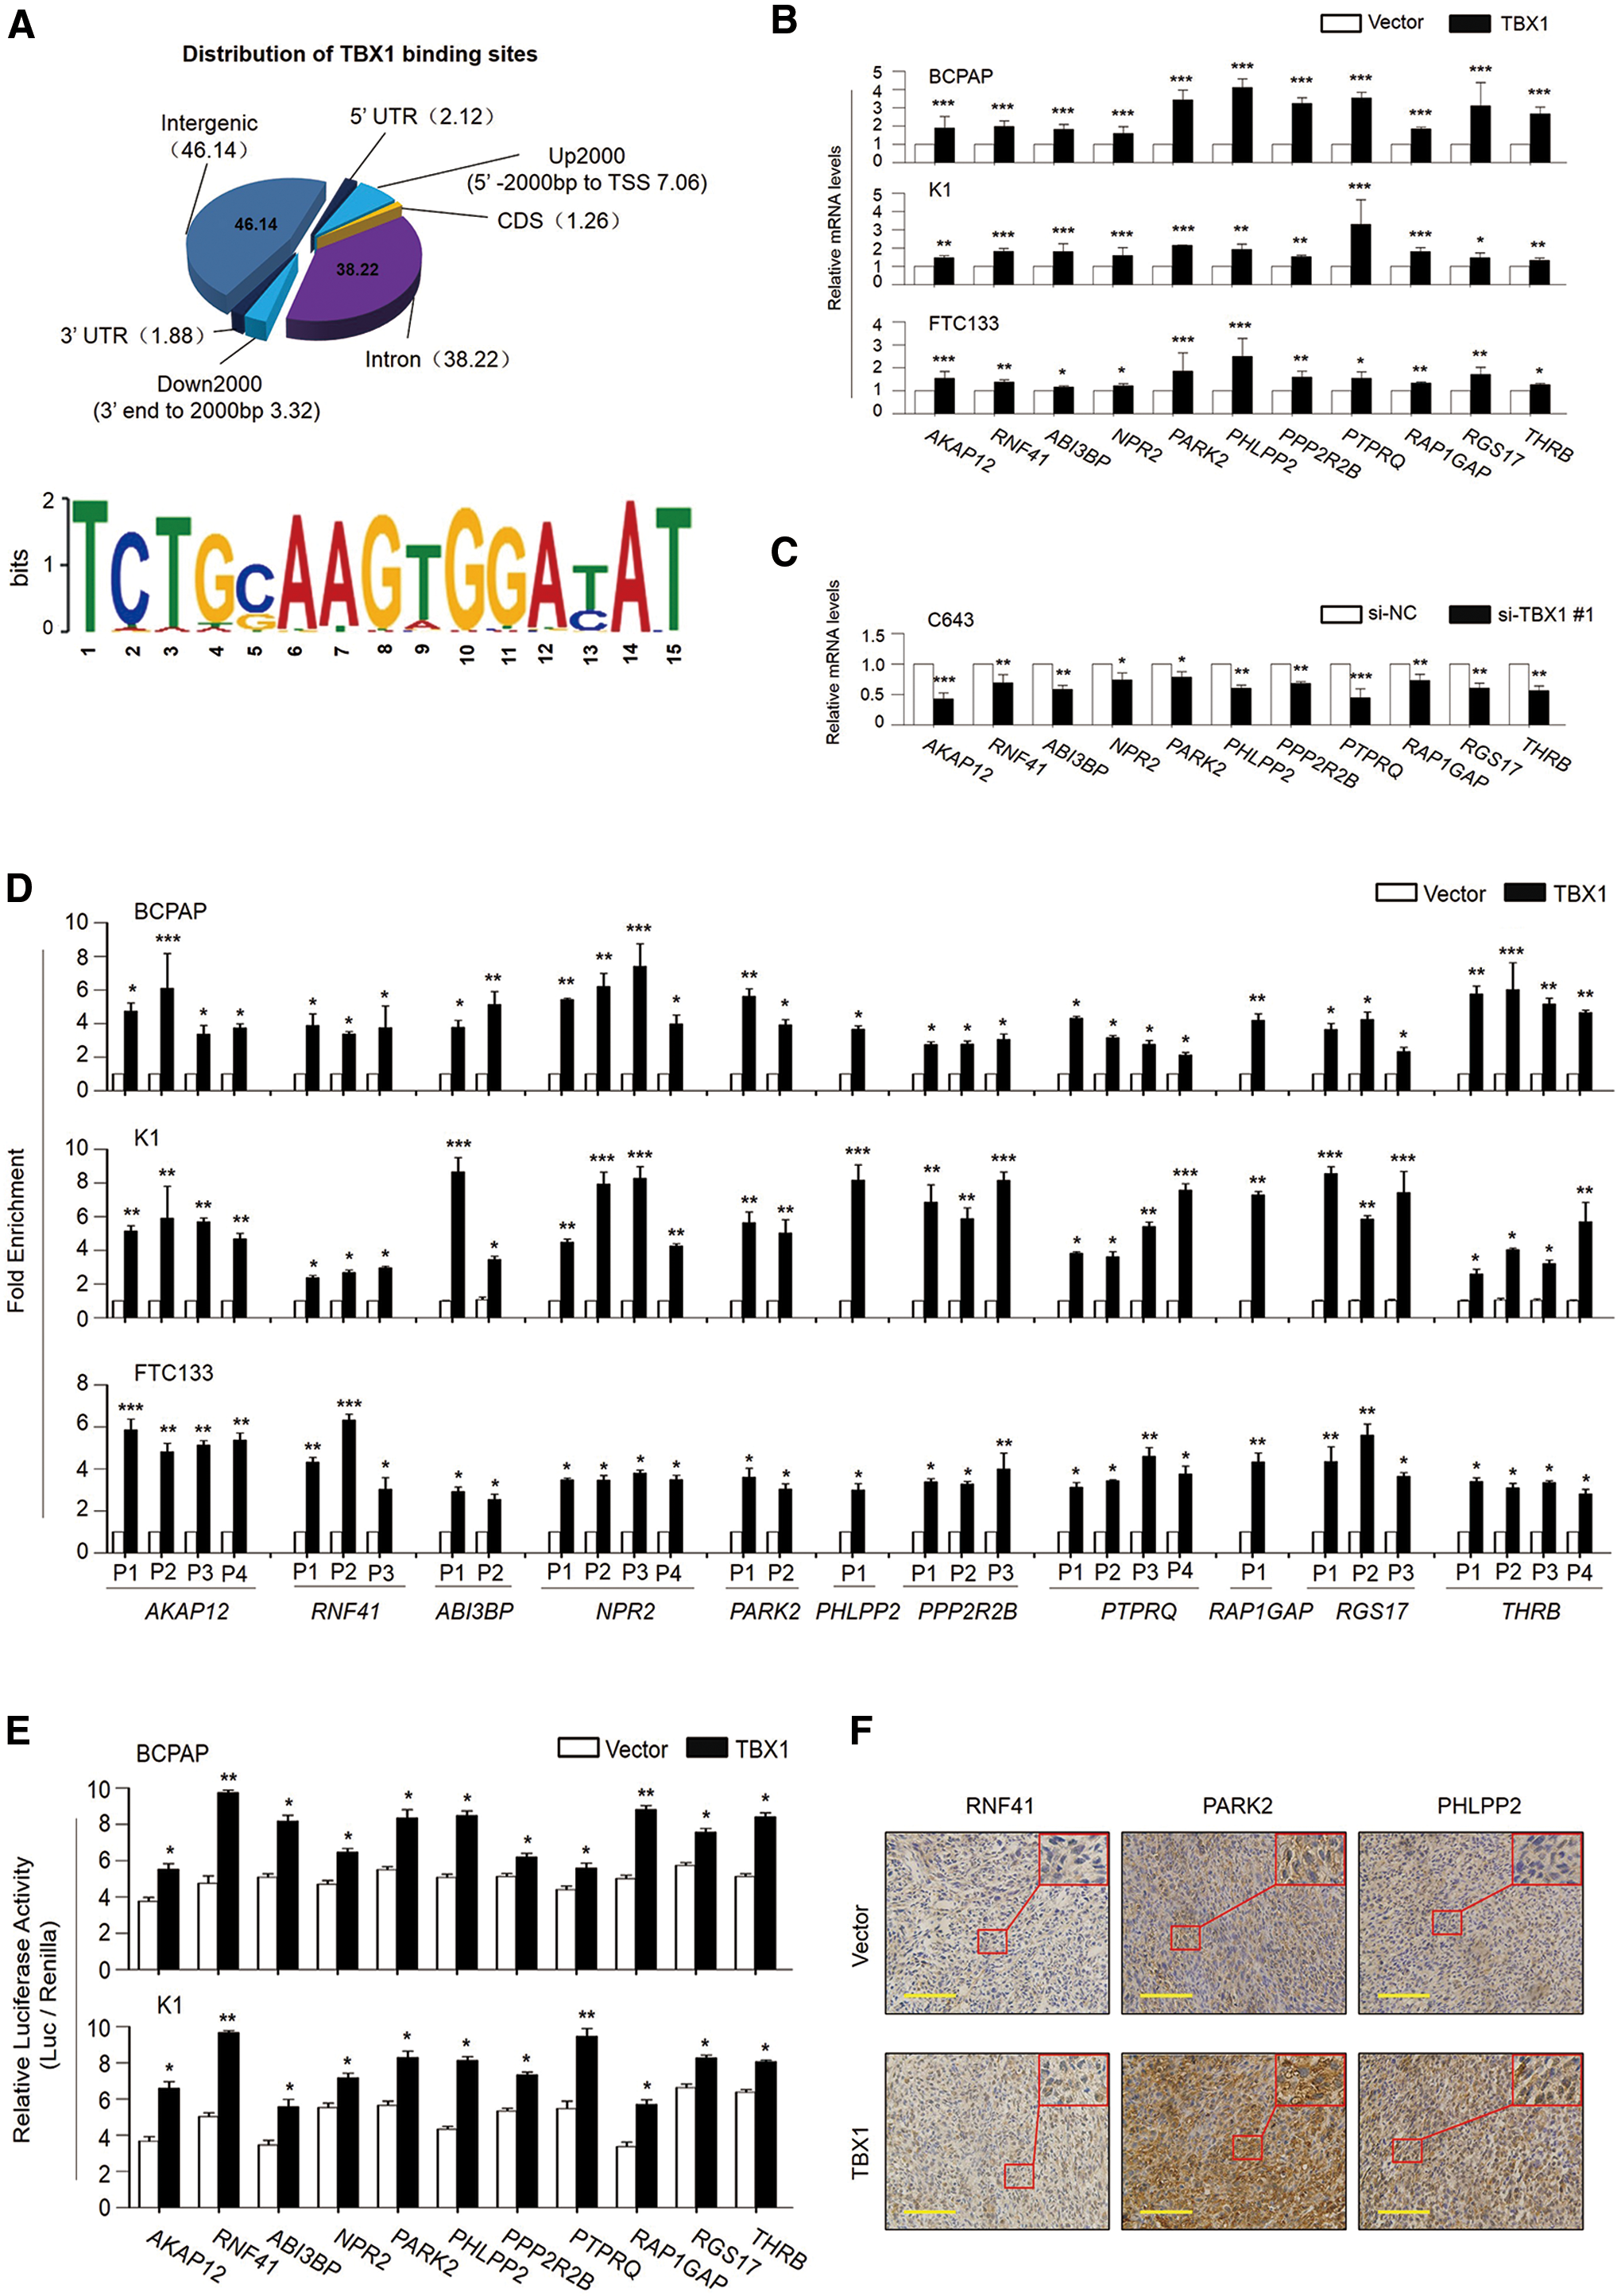
Identification of TBX1 target genes using chromatin immunoprecipitation sequencing (ChIP-Seq) analysis. (
To determine the role of TBX1 in the regulation of its target genes, first the above 11 potential TBX1 target genes were selected, and the effect of TBX1 on their expression in BCPAP, K1 and FTC133 cells was tested by qRT-PCR assay. As shown in Figure 5B, their expression was significantly upregulated in the TBX1-transfected cells relative to vector-transfected cells. On the contrary, knocking down TBX1 in C643 cells downregulated the expression of these genes (Fig. 5C). Next, to determine direct regulation of these target genes by TBX1 through binding to their promoters (including AKAP12 and RNF41) or introns (including ABI3BP, NPR2, PARK2, PHLPP2, PPP2R2B, PTPRQ, RAP1GAP, RGS17, and THRB), ChIP assays were performed in BCPAP, K1, and FTC133 cells expressing TBX1 and control cells using an anti-Myc tag antibody, followed by qPCR targeting their promoter regions. As expected, TBX1 strongly bound to the promoters or introns of these 11 potential targets at different levels in these three cell lines (Fig. 5D). In addition, to examine whether TBX1 is involved in directly regulating the transcription of these 11 genes, their promoters or introns were cloned into a pGL3 luciferase plasmid to construct luciferase reporter plasmids. The results show that ectopic expression of TBX1 was able to enhance transcriptional activity of these genes significantly in BCPAP and K1 cells compared to the control (Fig. 5E). To be consistent with the findings in Figure 5B, it was found that the expression levels of three representative TBX1 targets (RNF41, PARK2, and PHLPP2) were markedly increased in the xenograft tumors stably expressing TBX1 relative to control tumors (Fig. 5F). Altogether, these data further support that these genes are direct targets of TBX1.
TBX1 exerts tumor suppressive properties through inhibiting the activities of the PI3K/AKT and MAPK/ERK pathways via regulating its downstream targets
Considering that a number of TBX1 target genes may be involved in the regulation of the PI3K/AKT and MAPK/ERK pathways, the effect of ectopic expression of TBX1 was thus tested on the activities of these two pathways. As shown in Figure 6A, TBX1 re-expression significantly inhibited the activities of both pathways, characterized by reduced phosphorylation of AKT at Ser473 and ERK. However, ectopic expression of TBX1 almost did not affect phosphorylation of AKT at Thr308. On the other hand, knocking down TBX1 in C643 cells promoted phosphorylation of AKT (Ser473) and ERK (Fig. 6B). In addition, it was also found that phosphorylation of AKT (Ser473) and ERK were also significantly reduced in the xenograft tumors stably expressing TBX1 relative to control tumors (Fig. 6C). These data suggest that TBX1 functions as a tumor suppressor in thyroid cancer through blocking the activities of the PI3K/AKT and MAPK/ERK signaling pathways.

TBX1 inhibits the activities of the PI3K/AKT and MAPK/ERK pathways. Cells transfected with the indicated constructs and siRNAs were lysed, and the lysates were subjected to Western blot analysis. The antibodies against TBX1, phospho-AKT Ser473 (p-AKTS473), phospho-AKT Thr308 (p-AKTT308), total AKT (t-AKT), phospho-ERK (p-ERK), and total ERK (t-ERK) were used to evaluate the impact of ectopic expression (
To determine the role of TBX1 target genes in inhibiting thyroid tumorigenesis via modulating the activities of the above two pathways, three representative TBX1 target genes—RNF41, PARK2, and PHLPP2— were selected, which have been clearly shown to be involved in regulating the activities of the PI3K/AKT and MAPK/ERK cascades through distinct mechanisms (23 –25). First, a siRNA approach was used to knock down the expression of these three genes in BCPAP and K1 cells, and their effect on thyroid cancer cell viability and the activities of the PI3K/AKT and MAPK/ERK pathways was evaluated. Knockdown of RNF41, PARK2, and PHLPP2 by two different siRNAs was confirmed by qRT-PCR and Western blot assays (Fig. 7A). Moreover, the data show that knocking down these three genes in BCPAP and K1 cells significantly promotes cell viability (Fig. 7B) and colony formation ability (Supplementary Fig. S4) compared to controls. Next, the effect of knockdown of these three genes on phosphorylation of AKT and ERK in BCPAP and K1 cells was also tested. As expected, knockdown of RNF41 and PARK2 markedly increased phosphorylation of AKT (Ser473) and ERK but not AKT (Thr308), whereas PHLPP2 knockdown only increased phosphorylation of AKT (Ser473) but not AKT (Thr308) and ERK in BCPAP and K1 cells (Fig. 7C). This was consistent with the previous studies (23 –25). Next, to determine the role of RNF41, PARK2, and PHLPP2 in terms of a tumor-suppressive effect of TBX1 on thyroid cancer cell viability, these three genes were knocked down in BCPAP and K1 cells stably expressing TBX1. The results show that the viability-inhibiting effect of TBX1 on thyroid cancer cells was significantly attenuated upon knockdown of these three genes (Fig. 7D). In addition, the inhibitory effect of TBX1 on colony formation ability of thyroid cancer cells was also partially reversed upon knockdown of these three genes (Supplementary Fig. S5). Meanwhile, the data also demonstrate that the inhibitory effect of TBX1 on phosphorylation of both AKT (Ser473) and ERK was significantly attenuated upon knockdown of RNF41 and PARK2. However, PHLPP2 knockdown only partially reversed phosphorylation of AKT (Ser473) but not ERK in BCPAP and K1 cells (Fig. 7E). Collectively, these findings suggest that TBX1 functions as a tumor suppressor in thyroid cancer, at least partially through inhibiting the activities of the PI3K/AKT and MAPK/ERK pathways via regulating its downstream targets.

TBX1 functions as a tumor suppressor through transcriptionally activating its targets genes. (
Altogether, based on the above findings, a simple model is proposed to clarify the molecular mechanisms of TBX1 inhibiting thyroid tumorigenesis (Fig. 8). In brief, TBX1 transcriptionally activates its downstream targets, thereby inducing G2/M phase arrest and apoptosis of thyroid cancer cells, and inhibiting cell migration and invasion through blocking the activities of the PI3K/AKT and MAPK/ERK pathways.
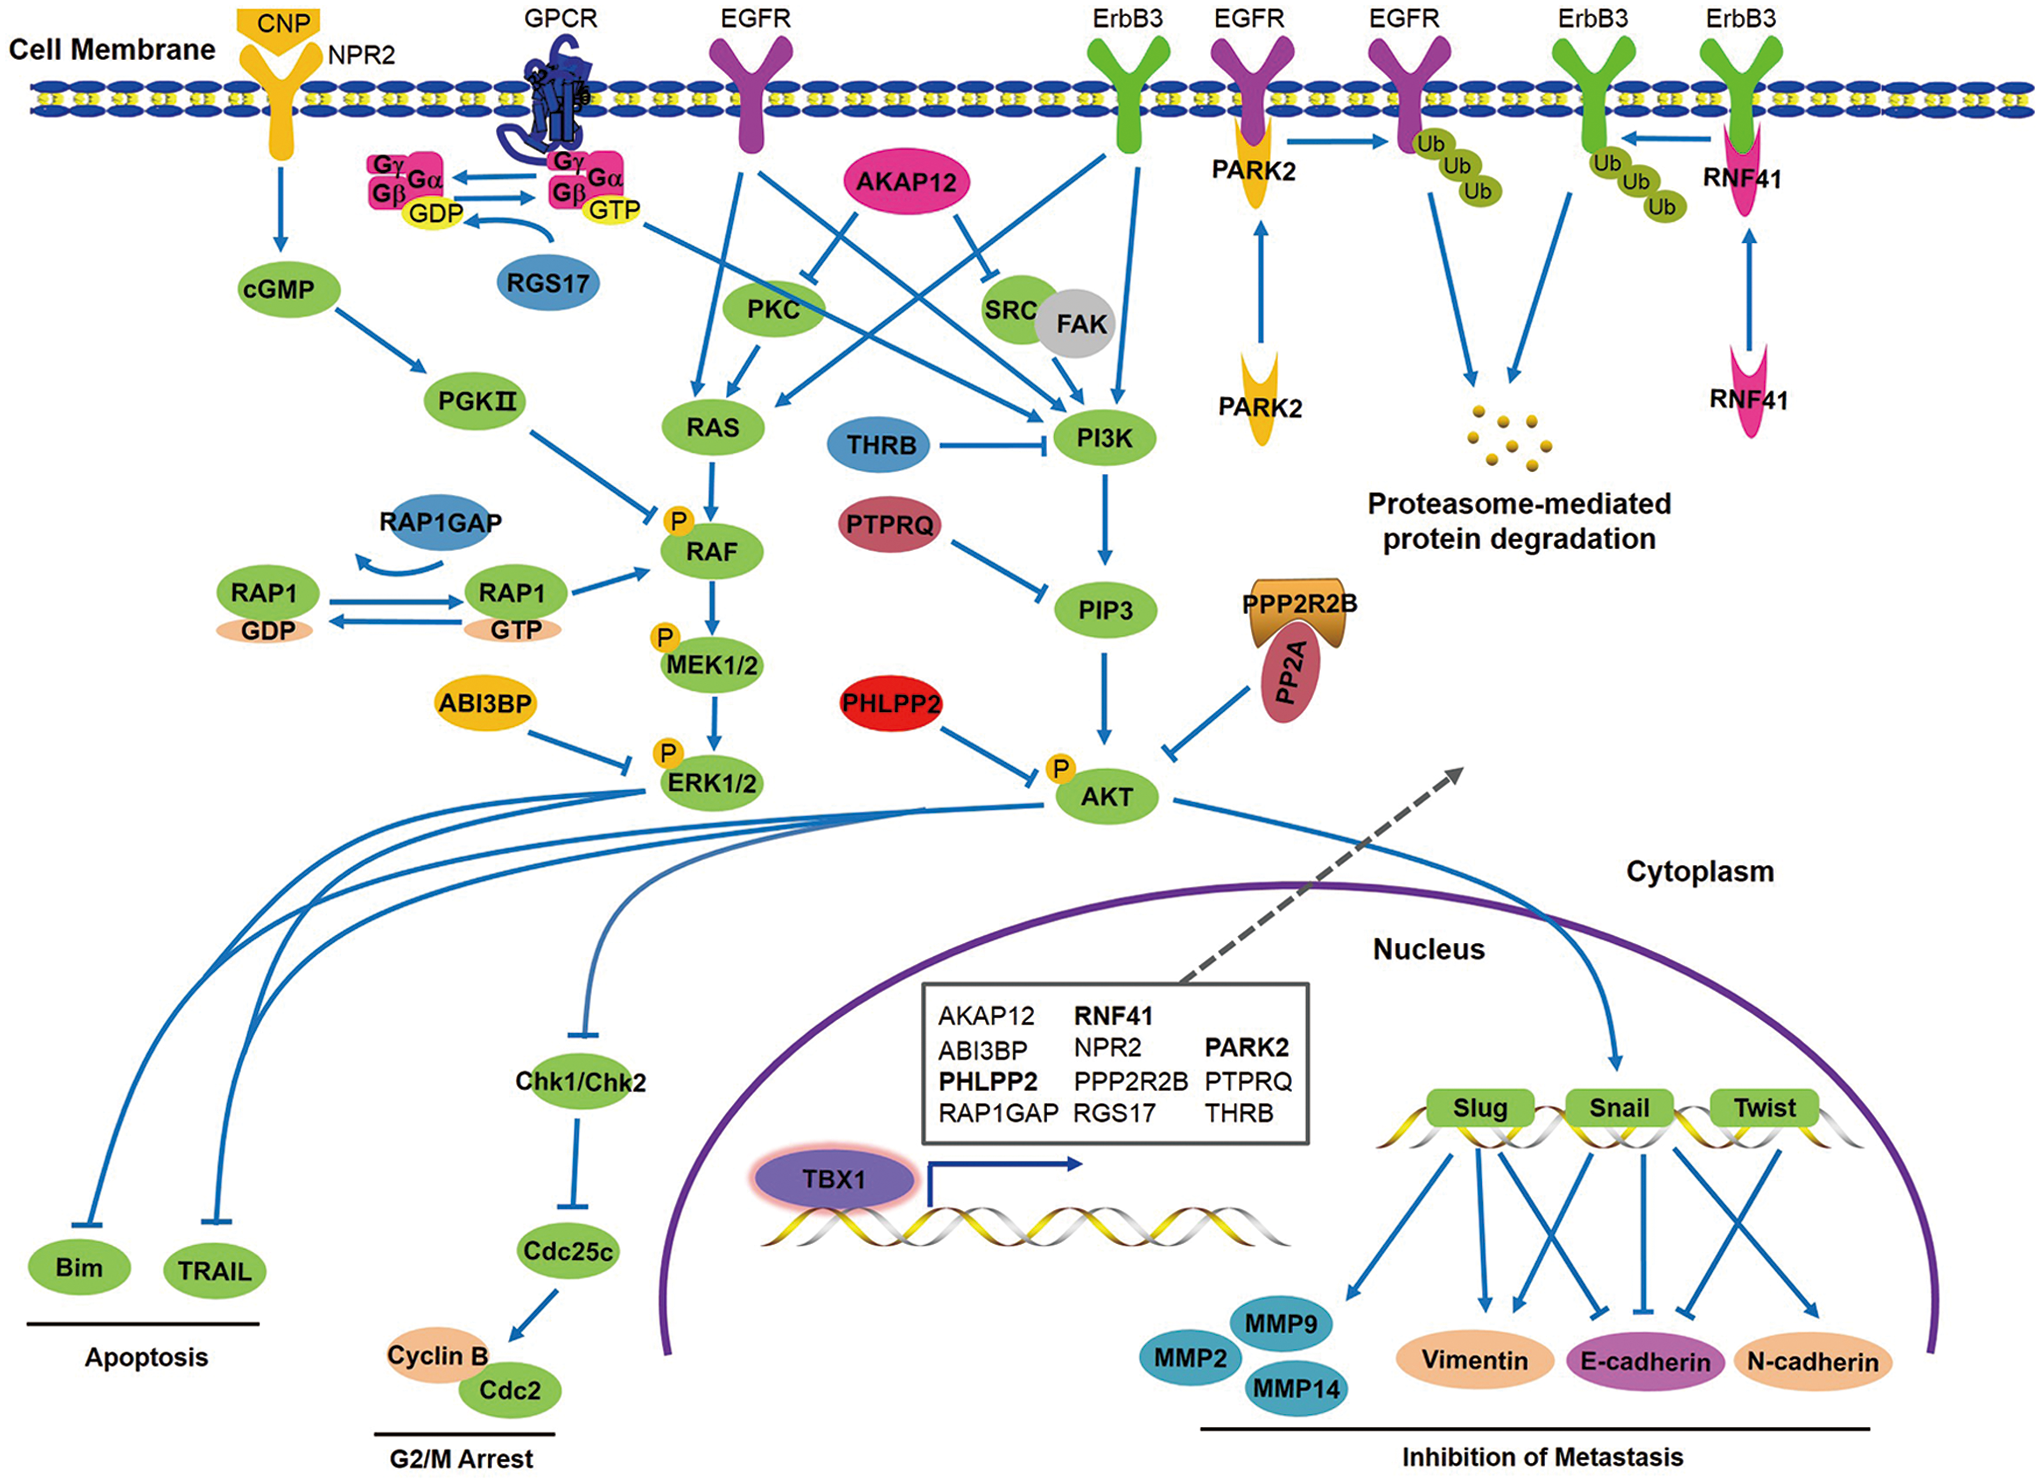
A schematic model of TBX1 inhibiting thyroid tumorigenesis through transcriptionally regulating its downstream targets. In thyroid cancer cells, TBX1 blocks the activities of the PI3K/AKT and MAPK/ERK signaling pathways, thereby inducing G2/M phase cell-cycle arrest and apoptosis, and inhibiting cell migration and invasion through distinct mechanisms via transcriptionally activating its downstream target genes. Color images are available online.
Discussion
The transcription factor TBX1 belongs to the T-box family, which plays important roles in differentiation or developmental processes (26). Although other members of the T-box family such as TBX2 and TBX3 have been well studied in human cancer, the role of TBX1 in human cancers, including thyroid cancer, still warrants further research. Evidently, TBX1 is expressed in adult parathyroid cells and deregulated in parathyroid tumors (12). In addition, TBX1 is a negative regulator of tumor cell growth in mouse models of skin cancer (13). In this study, the data provide strong evidence to support a tumor suppressive role of TBX1 in thyroid cancer. First, it was found that TBX1 is frequently downregulated in PTCs relative to matched non-cancerous thyroid tissues, and it was demonstrated that promoter methylation may be a major cause of TBX1 inactivation in PTCs and thyroid cancer cell lines by a MSP assay and demethylation treatment. In addition, the data show that histone modification may also contribute to TBX1 silencing. Second, ectopic expression of TBX1 in thyroid cancer cells significantly inhibits cell viability, colony formation, migration, invasion, and tumorigenic potential in nude mice, and the induction of G2/M phase arrest and apoptosis. On the other hand, TBX1 depletion significantly promotes cell viability and colony formation. These data indicate that TBX1 is a potential tumor suppressor in thyroid cancer.
Evidently, through inactivating Cdc25c, Chk kinases such as Chk1 or Chk2 prevent the activation of the Cyclin B/Cdc2 complex, which is pivotal in regulating the G2 phase transition (19). Thus, first the effect of TBX1 on the expression of Chk1, Chk2, Cdc25c, Cyclin B, and Cdc2 was tested in thyroid cancer cells. The results show that Chk1 or Chk2 expression was upregulated, while Cdc25c, Cyclin B, and Cdc2 were downregulated in the TBX1-transfected thyroid cancer cells compared to vector-transfected cells, suggesting that TBX1 induces G2/M phase arrest of thyroid cancer cells through inactivating the Cyclin B/Cdc2 complex. In general, apoptosis can be triggered via the intrinsic pathway that requires mitochondrial outer membrane permeabilization or the extrinsic pathway that involves activation of cell surface death receptors (27). BIM has emerged as an essential pro-apoptotic protein for initiating the intrinsic apoptotic pathway under many physiological and pathophysiological conditions (28). Tumor necrosis factor (TNF)-related apoptosis-inducing ligand (TRAIL) belongs to the superfamily of TNF. TRAIL induces the extrinsic pathway through binding two membrane-located receptors, TRAIL-R1 and TRAIL-R2 (29). Thus, the effect of TBX1 on the expression of BIM and TRAIL was evaluated in thyroid cancer cells. The results show that ectopic expression of TBX1 significantly upregulates their expression in vitro and in vivo compared to the control, suggesting that TBX1 promotes thyroid cancer cell apoptosis through regulating both intrinsic and extrinsic apoptotic pathways.
Given that tumor invasion and metastasis is the leading cause of cancer-related death including thyroid cancer, the effect of TBX1 on thyroid cancer cell migration and invasion was tested. Expectedly, the data demonstrate that TBX1 dramatically inhibits cell migration and invasion. It is well known that EMT, as a vital step of tumor transformation cascade, is strongly related to cancer progression and metastasis (30). In this study, the data show that ectopic expression of TBX1 in thyroid cancer cells upregulates the epithelial marker E-cadherin accompanied by decreased expression of its suppressors Snail, Slug, and Twist in BCPAP and FTC133 cells. Meanwhile, ectopic expression of TBX1 downregulates the mesenchymal markers N-cadherin and Vimentin in these two cell lines. Although TBX1 overexpression did not affect the expression of Snail and Slug in K1 cells, there is evidence indicating that Twist alone is capable to induce an EMT, thereby promoting tumor metastasis (22). These findings indicate that TBX1 inhibits the EMT process in thyroid cancer cells. In addition, considering that MMPs also play a critical role in tumor metastasis (21,31), the effect of TBX1 on expression levels of MMP-2, -9, and -14 was tested in thyroid cancer cells. The results demonstrate that ectopic expression of TBX1 significantly inhibits their expression. Collectively, TBX1 decreases the ability of migration and invasion of thyroid cancer cells through inhibiting the EMT process and the expression of MMPs.
It is clear that the PI3K/AKT and MAPK/ERK pathways play fundamental roles in the pathogenesis and progression of thyroid cancer (4,5). There is evidence showing that these two pathways enhance cancer cell growth, migration, and invasion through activating the Cyclin B/Cdc2 complex (32,33), inhibiting the expression of apoptosis-related genes (34), and promoting the EMT process or the expression of MMPs (35,36). In addition, through identification of TBX1 target genes using a ChIP-Seq approach, it was found that a number of genes are involved in modulating the activities of the PI3K/AKT and MAPK/ERK pathways, such as AKAP12 (37,38), RNF41 (23), ABI3BP (39), NPR2 (40), PARK2 (24), PHLPP2 (25), PPP2R2B (41), PTPRQ (42), RAP1GAP (43), RGS17 (44), and THRB (45). Thus, it is speculated that TBX1 inhibits thyroid cancer cell viability, colony-forming ability, and invasiveness through blocking the activities of the PI3K/AKT and MAPK/ERK pathways. Indeed, the data show that TBX1 strongly decreases the phosphorylation of AKT (Ser473) and ERK in thyroid cancer cells, indicating its inhibitory effect on the PI3K/AKT and MAPK/ERK cascades.
Next, to determine whether TBX1 inhibits thyroid tumorigenesis through blockade of the PI3K/AKT and MAPK/ERK pathways via regulating its downstream target genes, the three representative TBX1 target genes were selected—RNF41, PARK2, and PHLPP2—and their role in thyroid cancer cell viability and the inhibitory effect of TBX1 on the activities of these two pathways was tested. RNF41 or PARK2 encode an E3 ubiquitin ligase to promote ubiquitination and degradation of ErbB3 and EGFR by proteasomes, respectively, thereby blocking downstream pathways including the PI3K/AKT and MAPK/ERK pathways (23,24). PHLPP2 functions as a phosphatase specific for AKT (Ser473), resulting in the inactivation of the PI3K/AKT pathway (25). As expected, the data show that knockdown of RNF41 and PARK2 significantly promote thyroid cancer cell viability and colony formation, and activate both the PI3K/AKT and MAPK/ERK cascades. Knockdown of PHLPP2 enhances thyroid cancer cell viability and the activity of the MAPK/ERK pathway. In addition, the study also demonstrated that the inhibitory effects of TBX1 on thyroid cancer cell viability and the activities of these two pathways were attenuated upon knockdown of RNF41, PARK2, and PHLPP2.
In summary, this study shows that TBX1 is frequently downregulated by promoter methylation in thyroid cancer, and demonstrates that TBX1 is a putative tumor suppressor through a series of in vitro and in vivo experiments. Mechanistically, TBX1 inhibits thyroid tumorigenesis through transcriptionally regulating its downstream targets, thereby blocking the activities of the PI3K/AKT and MAPK/ERK signaling pathways.
Footnotes
Acknowledgments
We thank Dr. Haixia Guan (The First Affiliated Hospital of China Medical University, Shenyang, P.R. China) and Dr. Lei Ye (Ruijin Hospital, Shanghai, P.R. China) for kindly providing the thyroid cancer cell lines. This work was supported by the National Natural Science Foundation of China (nos. 81272933, 81572627, 81672645, and 81770787), and the Science and Technology Project of Shaanxi Province (no. 2014K11-01-01-19). The data set for the ChIP-Seq assay is available at NCBI Gene Expression Omnibus (GEO) under accession number GSE111072.
Author Disclosure Statement
The authors declare no conflicts of interest.
Supplementary Material
Supplementary Table S1
Supplementary Table S2
Supplementary Table S3
Supplementary Table S4
Supplementary Table S5
Supplementary Table S6
Supplementary Table S7
Supplementary Figure S1
Supplementary Figure S2
Supplementary Figure S3
Supplementary Figure S4
Supplementary Figure S5