
Abstract
Background:
Co-occurrence of TERT (telomerase reverse transcriptase) promoter (TERTp) mutations with BRAF/RAS mutations is associated with significantly more aggressive thyroid cancer. TERTp mutations are hypothesized to generate de novo binding sites for ETS transcription factors, which are themselves activated by BRAF/RAS-stimulated MEK-ERK activity. To date, a detailed study of this mechanism has been limited to only a few cancer types, and we hypothesized that ETS factors involved in TERTp activation could vary between different cancers.
Methodology:
Here we sought to identify ETS factor(s) required for TERTp activation in thyroid cancer, using a combination of in silico analyses of TCGA data, and experimentation using in vitro thyroid cell models analyzed by quantitative reverse transcription-PCR, immunoprecipitation (IP), chromatin IP, and gene reporter assays.
Results:
We found that ETV5 was abundantly expressed in papillary thyroid cancers from the TCGA data set, and in thyroid cancer cell line models. Furthermore, ETV5 was found to preferentially bind to the −124 bp(T) TERTp allele and stimulate TERT transcription in thyroid cancer cells devoid of GA binding protein transcription factor (GABP) activity. We also found that ETV5 functionally cooperates with the transcription factor FOXE1 to further enhance TERTp activity, a mechanism that may at least partially explain why FOXE1 represents a significant genetic determinant of thyroid cancer risk.
Conclusions:
ETS factors that activate mutant TERTp vary between cancer types, and here we show for the first time that ETV5 demonstrates mutant allele-specific affinity for TERTp in thyroid cancer, a property that has previously only been attributable to GABP.
Introduction
Thyroid cancer is the commonest malignancy of the endocrine system. The malignancy is driven by hyperactivation of the mitogen-activated protein kinase (MAPK) pathway, due to the mutation of key genes that encode components of this kinase signaling cascade, for example, BRAF, RAS, and RET/PTC. Advanced forms of the disease, particularly those that are iodine refractory, present a major clinical challenge with few treatment options. At present, the FDA-approved tyrosine kinase inhibitors lenvatinib and sorafenib, in keeping with their ability to inhibit MAPK activity, achieve modest improvements in progression-free survival. However, their use is frequently associated with a spectrum of toxicity-related adverse events (1). Thus, there is a pressing need to develop new therapies that can more effectively treat these lethal cancers.
Maintaining telomere integrity is a universal feature of cancer. Healthy human somatic cells cannot divide beyond a finite number of cell divisions, as progressive telomere loss ultimately triggers replicative senescence. In contrast, cancer cells possess unchecked proliferative capacity via the acquisition of DNA mutations that activate either telomerase or the alternative lengthening of telomeres pathway (2). For example, a commonly occurring feature of many cancer types is the somatic reactivation of TERT (telomerase reverse transcriptase), which encodes the catalytic subunit of telomerase. Somatic mutations of the TERT promoter (TERTp) are frequently observed in a wide range of malignancies, including melanoma, glioblastoma, bladder, and thyroid cancer (2,3).
The two commonest TERTp mutations, located −124 (chr5:1,295,228C>T known as “C228T”) and −146 (chr5:1,295,250C>T known as “C250T”) base pairs upstream of the TERT translational start site (ATG), are hypothesized to generate de novo DNA-binding motifs for ETS-transcription factors activated by the upstream MAPK pathway.
In several cancers, but most well studied in glioblastoma, the mutant TERTp allele, in combination with surrounding native ETS-binding sites, creates a unique architecture that is permissive to the selective recruitment of the tetrameric GABP (GA binding protein transcription factor) complex, consisting of two ETS-factor GABPA (GABP-alpha) subunits bound to two non-DNA binding GABPB (GABP-beta) subunits (4). The binding of GABP facilitates long-range chromatin interactions (5) and epigenetic changes around the mutant promoter that culminate in monoallelic transcription of the TERT gene (6,7). Whether this represents the only ETS factor-mediated mechanism by which mutant TERTp is activated, or whether any of the other 28 members of the ETS family also possess specific binding affinity for mutant TERTp, is presently unknown.
Certainly, aberrant activity of other ETS family members has been found to drive tumorigenesis and progression of a diverse range of cancer types (8). In the context of thyroid cancer, several ETS factors have been previously implicated in the disease pathogenesis. For instance, thyroid cell neoplastic transformation has been shown to be dependent upon overexpression of protein C-ETS-1 and -2 (ETS1 and ETS2) (9), whereas translocation ETS leukemia factor (ETV5) overexpression is associated with BRAF/RAS mutations, and regulates both the proliferation and epithelial–mesenchymal transition of malignant thyroid cells (10,11). Also, the ETS variant 6-neurotrophic tyrosine kinase receptor, type 3 (ETV6-NTRK3), is a fusion protein that arises from a chromosomal translocation commonly found in radiation-induced forms of thyroid cancer (12).
All 29 human ETS-transcription factors share the same winged helix-turn-helix DNA binding domain (DBD) that allows monomeric binding to the nucleotide sequence GGA(A/T). However, outside of the DBD there is considerable sequence and structural variation that enables ETS-family members to exhibit diverse transcriptional regulatory functions (8). For instance, most ETS factors are directly phosphorylated by MAPK signaling; however, there is considerable variation in the degree of their responsiveness to MAPK regulation. For instance, the ternary complex factors ELK1, ELK3, ELK4, and ETV5 are highly receptive to MAPK-mediated phosphorylation, while ETS factors such as GABPA appear to only be minimally phosphorylated (13).
Among thyroid cancer subtypes, the frequency of TERTp mutations correlates with disease aggressiveness. They occur at 9% in the usually more indolent papillary thyroid carcinomas (PTCs) (14), but in more aggressive poorly differentiated thyroid carcinoma and anaplastic thyroid carcinoma (ATC) subtypes, they are found in up to 40% and 73% of cases, respectively (15). In keeping with the hypothesized mechanism of action, TERTp mutations tend to co-occur with BRAF/RAS mutations (15), and co-occurrence of BRAF and TERTp mutations in PTC is strongly correlated with more aggressive disease (16 –18).
Thyroid cancer represents an attractive model to study mutant TERTp activity, since it is relatively homogenous in genetic terms and there is very strong evidence that TERT reactivation specifically underpins poor prognosis of the disease (17,19,20). As TERTp mutations are limited to cancer cells (2), identifying the precise molecular mechanism of TERTp activation may lead to chemotherapies that can repress TERT in an entirely cancer-specific manner.
Materials and Methods
TCGA gene expression and genotyping data
Raw count data for ETS genes were obtained from
Cell culture
NThy-ori-3.1, SW1736, C643, and TPC1 cells were grown at 5% CO2 concentration and 37°C in RPMI supplemented with 10% fetal calf serum (all reagents from Thermo Fisher Scientific, Waltham, MA). SW1736-TLuc1 was a modified subclone of the SW1736 cell line that stably expresses a mutant TERTp luciferase reporter gene and was created by M.B. (details available upon request), and grown and maintained in an identical manner to the parental cells. In the case of each cell line, the identity was confirmed by short tandem repeat profiling (CellBank Australia, Sydney, Australia) and the TERTp was genotyped by Sanger sequencing (Australian Genome Research Facility, Sydney, Australia).
MEK and PI3K inhibition
The day before treatment, cells were plated in a six-well culture plate at a density of 2 × 10⁵ cells per well. Then cells were treated with either 10 μM U0126 (Merck KGaA, Darmstadt, Germany) or 10 μM LY294002 (Sigma-Aldrich, St. Louis, MO) or DMSO (Sigma-Aldrich) vehicle control for 24 hours, before the extraction of protein or total RNA.
siRNA transfection
The day before transfection, cells were plated in a six-well culture plate at a density of 2 × 10⁵ cells per well. Cells were transiently transfected using Roche's X-tremeGene siRNA transfection reagent (Roche, Basel, Switzerland) with 20 nM of ETS-specific siRNA or AllStars negative siRNA control (Qiagen, Hilden, Germany). Forty-eight hours after transfection, RNA was extracted or luciferase reporter assays were performed (Promega, Madison, WI), as described below.
Quantitative reverse transcription-polymerase chain reaction
Total RNA was extracted and purified, then contaminating genomic DNA was removed using RNeasy Plus mini kit and DNAse I (Qiagen), and cDNA was subsequently generated using Superscript III reverse transcriptase (Thermo Fisher Scientific). The normal thyroid tissue cDNA control was reverse transcribed from a commercially available pool of total RNA extracted and purified from 65 male/female Caucasians, ages 15–61 years (Clontech Laboratories, Mountain View, CA). Gene expression was determined using ETS-specific TaqMan probes (Thermo Fisher Scientific) and run on an AB7900HT. Ribosomal 18S expression was used as a normalizer in all experiments.
Western blot
First, the protein concentration of whole-cell lysates harvested in radioimmunoprecipitation assay (RIPA) buffer (1% NP40, 0.5% sodium deoxycholate, 0.1% sodium dodecyl sulfate [SDS] and phosphate-buffered saline [PBS], pH 7.5) was measured using the RC DC Protein Assay kit (Bio-Rad, Hercules, CA), and then 10 μg of each protein sample was resolved by SDS–polyacrylamide gel electrophoresis (SDS-PAGE) and electroblotted onto a Hybond ECL membrane (GE Healthcare Life Sciences, Chicago, IL).
The membrane was incubated overnight at 4°C with anti-ETV5 (#AB102010; Abcam, Cambridge, United Kingdom); anti-ELK1 (C-term; #AB32106); anti-GABPA (#AB109328); anti-ELK3 (#AB83186); anti-ETS1 (#AB109212); anti-GABPB1/2 (#sc-271571; Santa Cruz, Biotechnology, Dallas, TX), anti-phospho ERK (Thr202/Tyr204, #4370; Cell Signaling Technology, Danvers, MA); anti-total ERK (#4695; CST); anti-phospho AKT (Ser473, #4060; CST); anti-total AKT (#4691; CST); or anti-GAPDH (#2118; CST), using dilutions recommended by the manufacturer.
The blot was then probed for one hour at room temperature with a 1:10,000 dilution of either a goat anti-rabbit (#7074; CST) or anti-mouse (#P0447; Agilent Technologies, Santa Clara, CA) IgG horseradish peroxidase-linked antibody and developed using the ECL-Prime Western Blotting Detection Reagent (GE Healthcare Life Sciences). Densitometric analysis of Western blots was performed using a multigauge imaging system (Fujifilm, Tokyo, Japan).
Chromatin immunoprecipitation assays
Formaldehyde crosslinked chromatin was prepared from C643, TPC1, or NThy-ori-3.1 thyroid cells using a protocol adapted from the methodology developed by the Myers laboratory (HudsonAlpha Institute for Biotechnology, Huntsville, AL) (23). Briefly, 2 × 10⁷ cells were fixed in PBS containing 1% formaldehyde, incubated at room temperature for 10 minutes, and then inactivated by the addition of glycine to a final concentration of 125 mM.
Fixed cells were then lysed in 1 mL ice-cold Farnham lysis buffer (0.5% NP-40, 85 mM KCl, and 5 mM PIPES, pH 8.0), and the lysate was then centrifuged at 16,000 g for 5 minutes at 4°C. The supernatant was discarded and the nuclear pellet was resuspended in 1 mL ice-cold RIPA buffer. The nuclear lysates were sonicated on ice for 10 minutes (20 × 30-second bursts), and the shearing of the chromatin into 100–600 bp fragments was confirmed by agarose gel analysis. The preparation was then cleared of debris by centrifugation at 16,000 g for 5 minutes at 4°C, and the supernatant was transferred to a new tube.
For each chromatin immunoprecipitation (ChIP) purification, the nuclear lysates were combined with 200 μL Dynabeads® sheep anti-mouse (or rabbit) IgG combined with 10 μg of anti-ETV5 (#AB102010), anti-ELK1 (C-term; #AB32106), anti-GABPA (H-180, #sc-22810; Santa Cruz, Biotechnology, Dallas, TX), or anti-GABPB1/2 (#sc-271571) precipitating primary antibody (or IgG negative control), and incubated overnight at 4°C.
The following day, the beads were subjected to six 1 mL washes with ice-cold LiCl wash buffer (500 mM LiCl, 1% NP-40, 1% sodium deoxycholate, 100 mM Tris pH 7.5) and then a single wash with 1 mL ice-cold Tris-EDTA buffer (0.1 mM EDTA, 10 mM Tris-HCl, pH 7.5). Purified ChIP DNA was then eluted from the beads in 200 μL elution buffer (1% SDS, 0.1 M NaHCO3) and incubated at 65°C for 1 hour. Finally, the DNA was reverse crosslinked by a further overnight incubation at 65°C and then purified using a ChIP DNA Clean & Concentrator kit (Zymo Research, Irvine, CA).
Quantification of ChIP DNA by quantitative polymerase chain reaction (qPCR) was performed on the AB7900HT and using a SensiMix SYBR Hi-ROX kit (Bioline Australia, Eveleigh, Australia), according to the manufacturer's manual. Supplementary Table S1 contains the primer sequences used to amplify regions of the TERTp.
Allele-specific analysis of ChIP DNA
ChIP PCR products were ligated into Promega's pGEM-T TA cloning vector following the manufacturer's protocol, and the resulting plasmid used to transform chemically competent E. coli (α-select silver; Bioline Australia) using standard laboratory cloning techniques. Plasmid DNA was extracted from bacterial cultures using Promega's Wizard® Plus SV Miniprep DNA Purification kit, and the cloned alleles were genotyped by Sanger sequencing (Australian Genome Research Facility) with the T7 vector-specific primer (5′-TAATACGACTCACTATAGGG-3′).
Coimmunoprecipitation
For each immunoprecipitation (IP), 1 × 10⁷ SW1736 cells were seeded in 175 cm3 flasks and the following day transiently transfected with 10 μg flagged-tagged FOXE1 expression plasmid using Roche's X-tremeGene HP liposomal-based, according to the manufacturer's protocol. Forty-eight hours posttransfection, whole-cell lysates were prepared with 1 mL chilled protein lysis buffer (0.1% Triton-X100, 150 mM NaCl, 1 mM EGTA, 1 mM EDTA, and 20 mM Tris-HCl, pH 7.5), containing 1 × Halt protease and phosphatase inhibitor cocktail (Thermo Scientific).
For each IP, the lysates were combined with 50 μL Dynabeads sheep anti-mouse IgG combined with 1 μg of Sigma-Aldrich's anti-flag (M2) antibody (or IgG negative control), and incubated overnight at 4°C. The following day, the beads were subjected to six 1 mL washes with ice-cold lysis buffer. Finally, the purified proteins were eluted in 20 μL Laemmli buffer incubated at 95°C for 10 minutes, which were then examined by Western blotting.
Identification of transcribed TERT alleles
Regions of the promoter and exon 2 of TERT were amplified using HotStar Taq DNA polymerase (Qiagen) with the PCR primers specified in Supplementary Table S1. PCR products were purified using the Wizard SV Gel and PCR Clean-up System (Promega) according to the manufacturer's instructions, and then genotypes were determined by Sanger sequencing (Australian Genome Research Facility).
Luciferase reporter assays
The day before transfection, SW1736 cells were plated in a 24-well culture plate at a density of 5 × 10⁴ cells per well. The cells were transiently transfected with Roche's X-tremeGene HP liposomal-based transfection reagent, with 500 ng TERTp luciferase reporter plasmid (24), 50 ng Renilla luciferase reporter plasmid, and a total of 50 ng of p3XFlag-FOXE1 (24), pCMV6-ETV5 (Origene, Rockville, MD), or both cDNA expression plasmids (made up to a total of 100 ng with empty expression plasmids). Transfected cells were incubated for 48 hours, before they were lysed in 100 μL of Promega's passive lysis buffer, and then, each sample was assayed in triplicate using the substrates from Promega's Dual-Luciferase® Reporter Assay kit.
Statistical analyses
Differences in transcription factor binding, gene expression, and reporter activity were analyzed using Student's t-test. Differences in allele distribution between ChIP DNA and matched input DNA control were calculated by Fisher's exact test. All these analyses were performed using GraphPad Prism version 7.02.
Results
Hyperactive MAPK activity leads to ETV5 upregulation in thyroid cancer
We hypothesized that the ETS factor(s) responsible for TERT activation would be those most abundantly expressed in thyroid cancer. Thus, we investigated the comparative expression levels of ETS genes using the TCGA (The Cancer Genome Atlas) thyroid cancer RNA-seq data, which contains global gene expression profiles of 498 PTCs and 59 matched nontumoral thyroid control samples. As the ETS family is large, for this study we decided to focus on a subset of ETS genes (ETS1, ETS2, ELK1, ELK3, ELK4, ETV5, and ETV6) for which there was literature already implicating their involvement in thyroid tumorigenesis and/or mediating MAPK signaling (9 –12,24,25). In addition, we also examined GABPA, GABPB1, and GABPB2 genes, which encode for the subunits of the GABP complex that has been observed to activate the mutant TERTp in several cancers.
Figure 1A shows the four ETS genes that were transcriptionally upregulated in PTCs compared with normal thyroid tissue. ETV5 was the most highly expressed ETS factor in PTC, being upregulated by 3.25-fold (p < 0.0001). In contrast, transcript levels of ETV6, ELK3, and ELK1 were modestly increased in PTC by 1.17-, 1.35-, and 1.47-fold, respectively (p < 0.0001) (p-values shown in Supplementary Table S2). The other four ETS genes examined were either downregulated in PTC (ETS2, ELK4, GABPA, and GABPB2) or remained unaltered between the two groups (ETS1 and GABPB1) (Supplementary Fig. S1A and Supplementary Table S2).
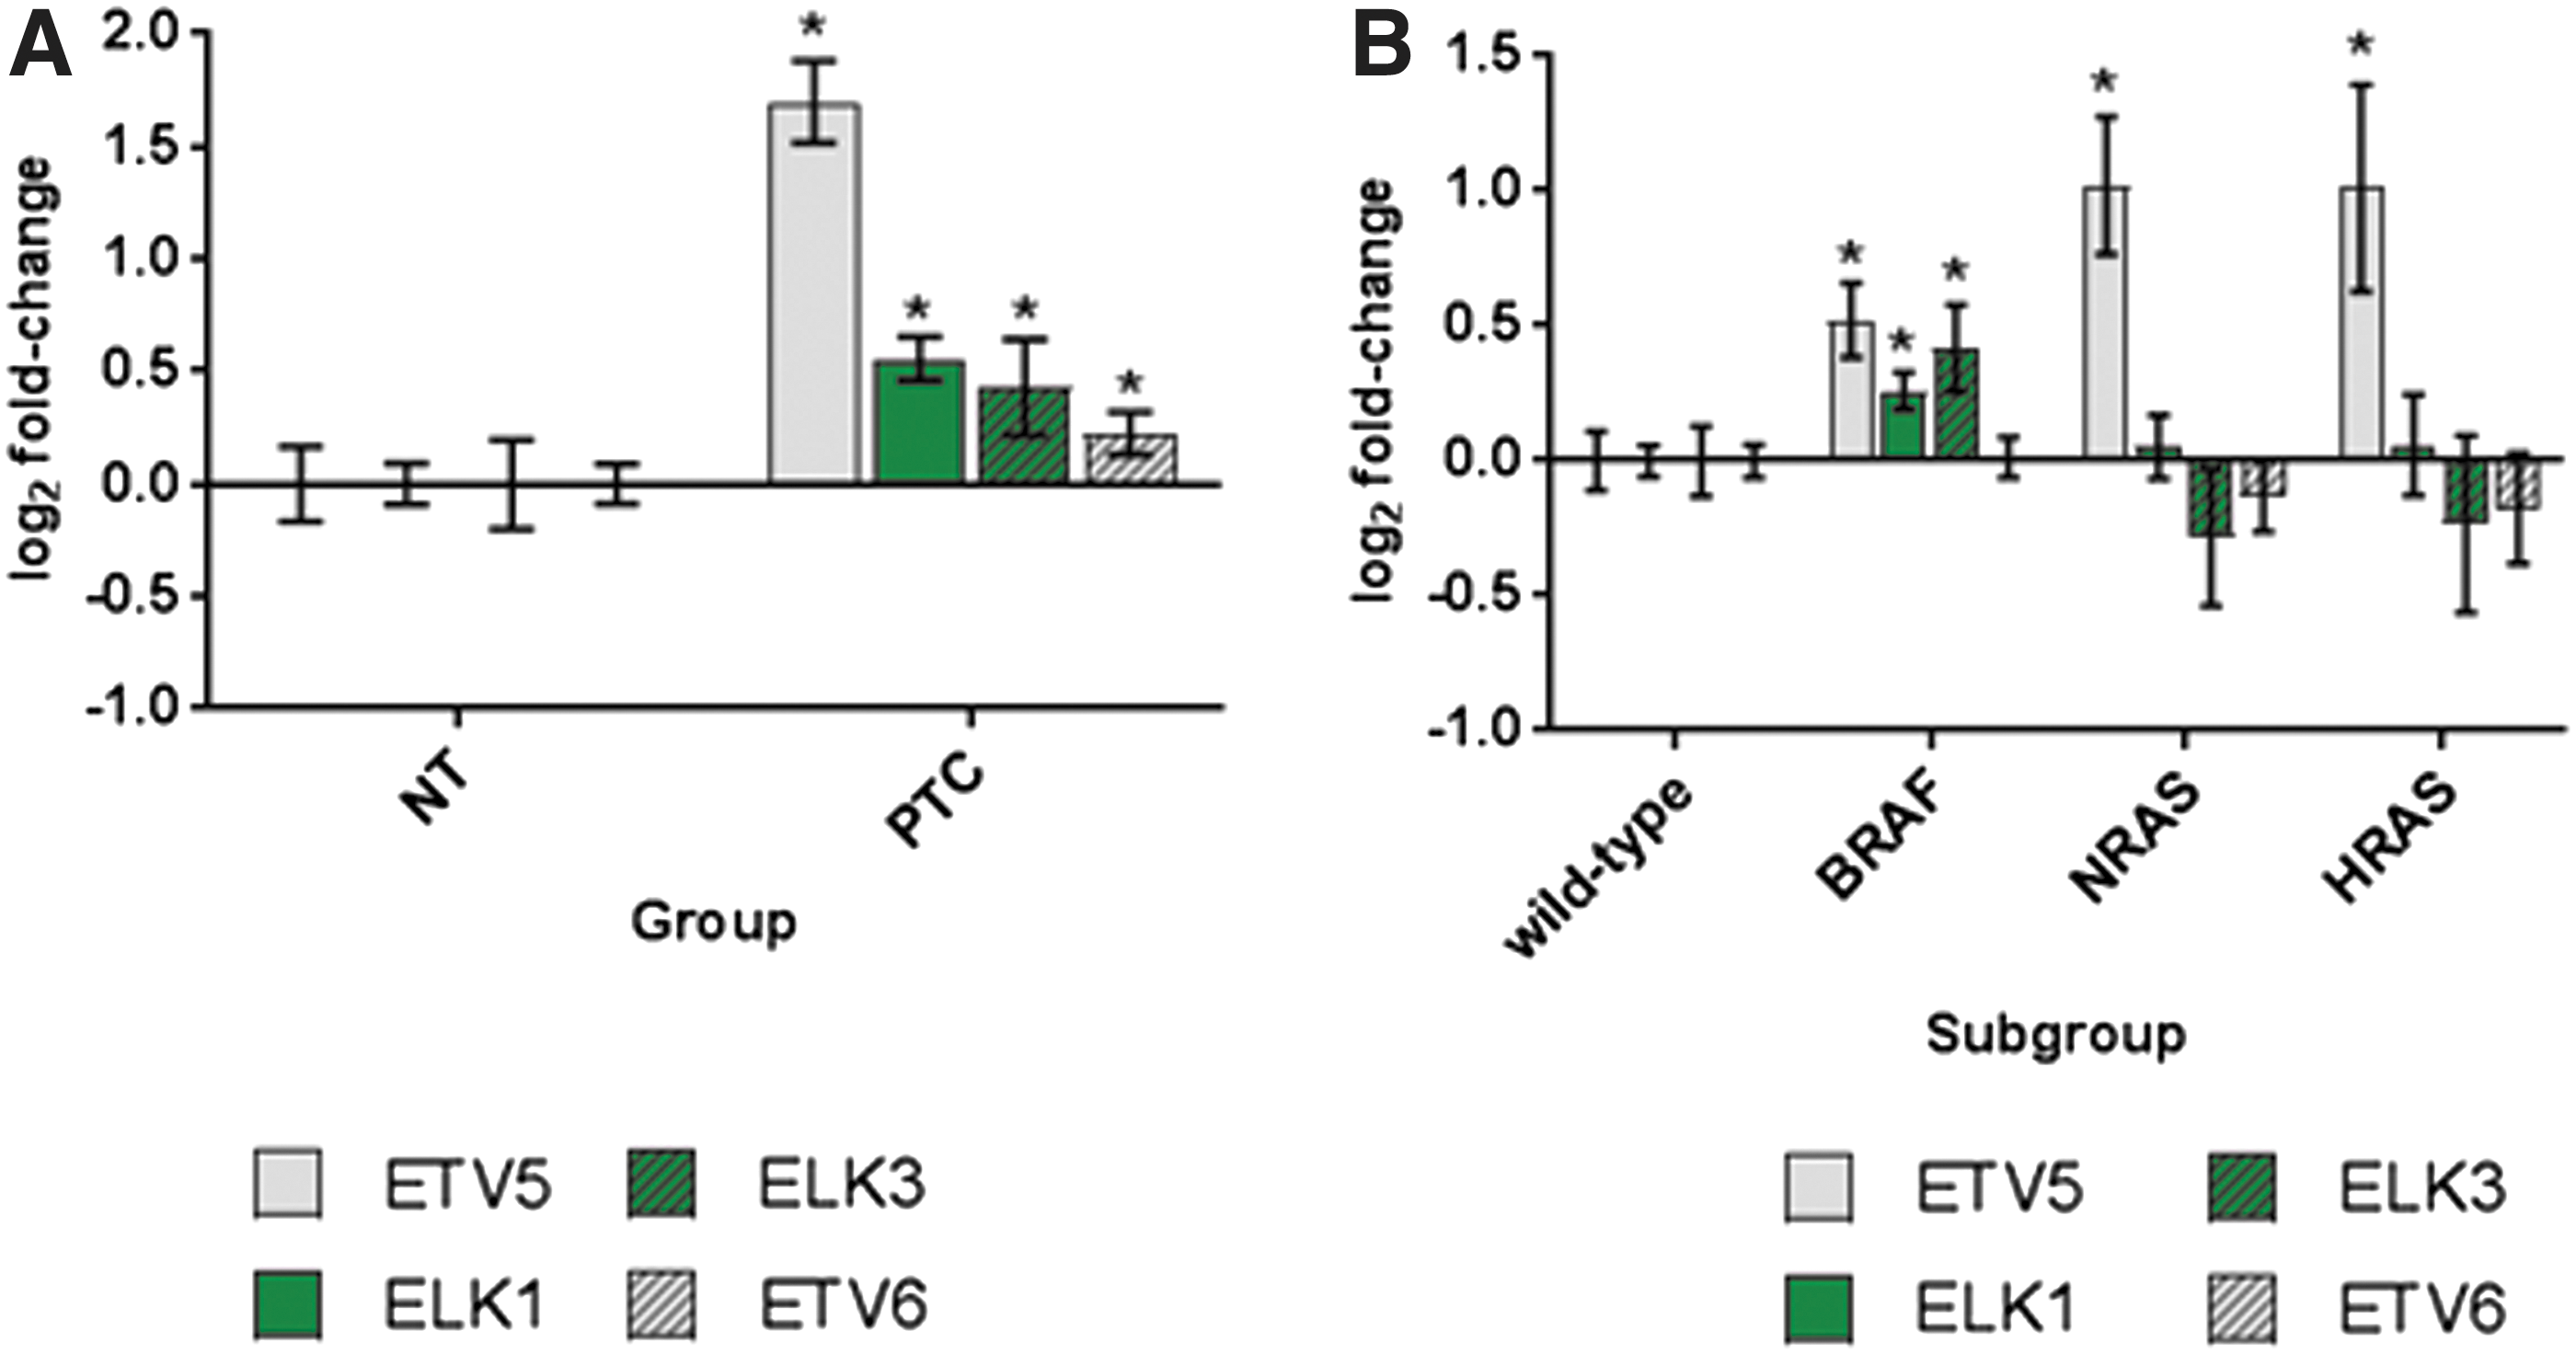
ETV5 is the most transcriptionally upregulated ETS gene in PTC and is strongly correlated with BRAF and RAS mutational status. (
Analysis of the PTCs stratified according to mutational status revealed that ETV5 was significantly more abundant in PTCs containing mutant BRAF (1.43-fold, p = 2.99 × 10⁻¹²), HRAS (2.02-fold, p = 2.81 × 10⁻⁶), or NRAS (2.10-fold, p = 2.40 × 10⁻¹³) compared with PTCs containing neither RAS nor BRAF mutations. Upregulated ELK1 and ELK3 levels were also positively correlated with BRAF, however, no association with either RAS mutation could be detected (Fig. 1B). In contrast, the other ETS genes were found not to be differentially expressed across the four subgroups, apart from ETS2, which was downregulated 0.8-fold (p = 2.90 × 10⁻⁵) in NRAS-positive tumors versus wild-type tumors (Supplementary Fig. S1B and Supplementary Tables S3, S4, S5).
We were interested to determine if ETV5 upregulation was similarly associated with ATC, for which clinical samples are not included in the TCGA data set. We therefore performed quantitative reverse transcription-PCR (qRT-PCR) expression profiling of the ATC-derived SW1736 and C643 cell lines, which possess BRAF and RAS oncogenes, respectively, and which both harbor the −124 bp[T] TERTp mutation and demonstrate correspondingly upregulated TERT expression (Supplementary Fig. S2). We also examined the RET/PTC and 124 bp[T] TERTp mutation-positive PTC-derived cell line TPC1, which also has upregulated TERT expression (Supplementary Fig. S2).
Gene expression levels were compared in these malignant cells with nontumoral (NThy-ori-3.1 cells) and normal thyroid tissue (Fig. 2A). Similar to our observations in TCGA samples, ETV5 mRNA levels were upregulated 4.1-fold in TPC1 when compared with normal thyroid tissue (Fig. 2A, p < 0.05). In comparison, ETV5 was even more strongly upregulated by 8.2- and 8.0-fold in SW1736 and C643 cell lines, respectively (Fig. 2A, p < 0.05). Also consistent with TCGA data, ELK1 and ELK3 were found to be significantly upregulated in the malignant cell lines compared with NThy-ori-3.1 cells and normal thyroid tissue (Fig. 2A).
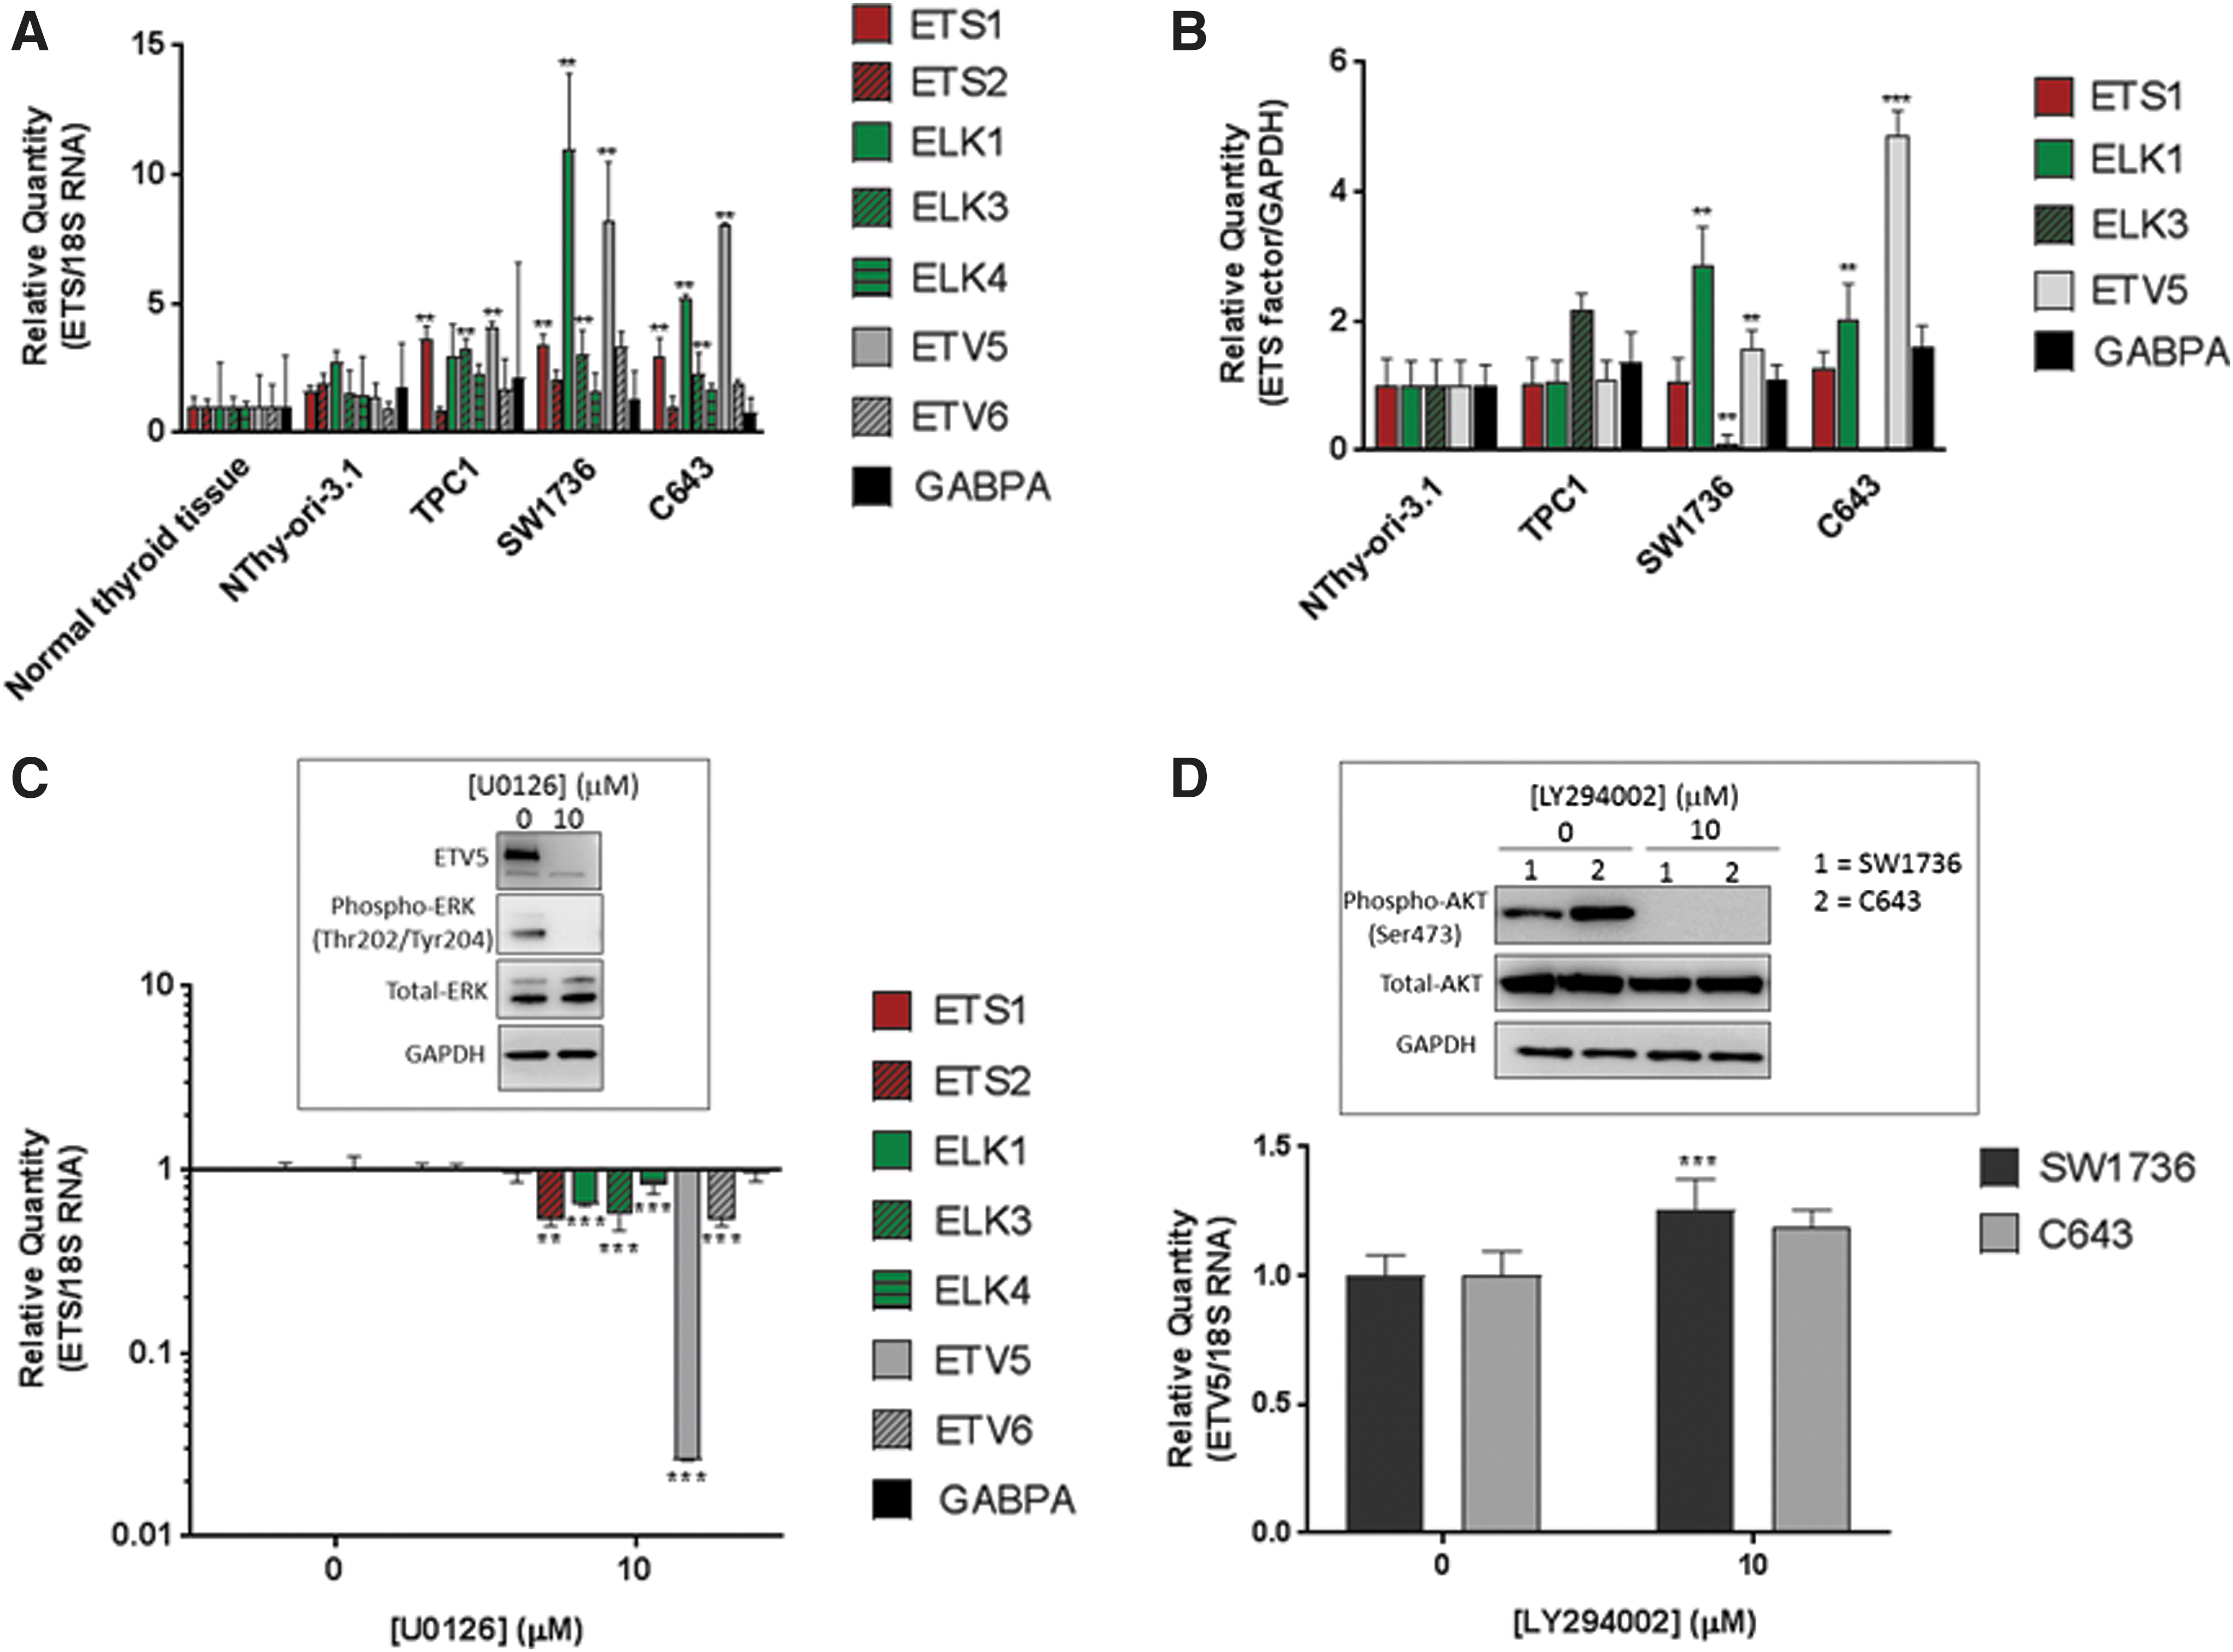
Hyperactive MAPK signaling causes upregulation of ETV5 in thyroid cancer in vitro models. (
In a similar manner to ETV5, ELK1 upregulation was also more pronounced in SW1736 and C643 ATC cells (11.01- and 5.22-fold, respectively, p < 0.05) than in the TPC1 cells (2.96-fold, p < 0.05). However, ETS1 was upregulated 3.0-fold (p < 0.05) across all three cancer cell lines compared with normal controls, which differs from the TCGA data where the increase in tumors did not reach statistical significance.
To confirm that elevated ETS gene expression correlates with the corresponding ETS protein levels, we profiled the same four cell lines using semiquantitative Western blotting with antibodies with specificity for the ETS proteins of interest. Figure 2B shows mean ± standard deviation normalized densitometry readings for each ETS protein, expressed as fold-change relative to the expression level detected in NThy-ori-3.1 cells (representative blots shown in Supplementary Fig. S3A).
Of the three cancer cell lines, significantly upregulated ETV5 protein was observed in both SW1736 (1.56-fold, p < 0.05) and C643 (4.89-fold, p < 0.01) cells. The only other upregulated ETS protein we detected was ELK1, which was significantly increased in both the SW1736 and C643 cell lines (2.85- and 2.03-fold, respectively, p < 0.05). Of note, despite transcriptional upregulation, ELK1 protein levels in TPC1 cells were indistinguishable from basal levels of NThy-ori-3.1 cells (Fig. 2B).
We also determined that GABPA was present in all three cancer cell lines, although on the lower limit of the assay, while its abundance appeared to be even lower in NThy-ori-3.1 cells, such that it was not consistently detected in all replicate samples tested (see representative blot in Supplementary Fig. S3A).
The pivotal role that the MEK-ERK pathway plays in thyroid cancer led us to investigate whether hyperactive MEK-ERK signaling was driving the thyroid cancer-associated ETS gene expression changes that we had observed. We treated SW1736 cells for 24 hours with 10 μM MEK1/2-specific U0126 or vehicle control. Having confirmed by Western blot that the treatment successfully achieved sustained inhibition of MEK activity (Fig. 2C, inset), we profiled ETS mRNA expression by qRT-PCR using RNA harvested from the treated cells. Figure 2C shows that MEK inhibition most significantly downregulated ETV5 (p < 0.01), but also to a lesser extent ELK1, ELK3, ELK4, ETV6 (p < 0.01), and ETS2 (p < 0.05). In contrast, ETS1 and GAPBA gene expression remained unaltered by this treatment.
Western blot analysis of lysates harvested from similarly treated SW1736 cells revealed the MEK inhibition was sufficient to confer a dramatic downregulation in ETV5 expression, such that the protein was undetectable at 48 hours posttreatment (Fig. 2C, inset). Similar ETV5 transcriptional responses to MEK inhibition were also seen in inhibitor-treated TPC1 and C643 cells (Supplementary Fig. S3B).
Unlike oncogenic BRAF that only activates downstream MEK-ERK signaling, RAS kinases also activate the PI3K-AKT pathway. Therefore, we investigated whether it is simultaneous activation of both pathways by RAS that leads to maximal ETV5 expression in thyroid cancer cells. However, treatment of both C643 and SW1736 cells for 24 hours with the PI3K-inhibitor LY294002 (10 μM) has no effect on ETV5 expression in C643 cells, and led to a slight increase in expression in the SW1736 cells (1.26-fold, p < 0.01) (Fig. 2D).
ETV5 and ELK1 bind to the core promoter of TERT in thyroid cancer cells
Having determined that ETV5 and ELK1 were the most significantly upregulated ETS factors in these thyroid cell lines, we next sought to determine the extent of ETV5 and ELK1 binding at TERTp versus GABP as a comparator. ChIP assays were performed using formaldehyde crosslinked chromatin isolated from SW1736, C643, TPC1, and NThy-ori-3.1 cells. Figure 3A shows that in all three cell lines, there was a small yet significant enrichment (p < 0.05) of both ETV5 and ELK1 binding to a region of the TERTp proximal to the TSS and −124 bp site, compared with the negative control loci located 4 kb upstream from the TSS, which does not contain ETS-binding sites.
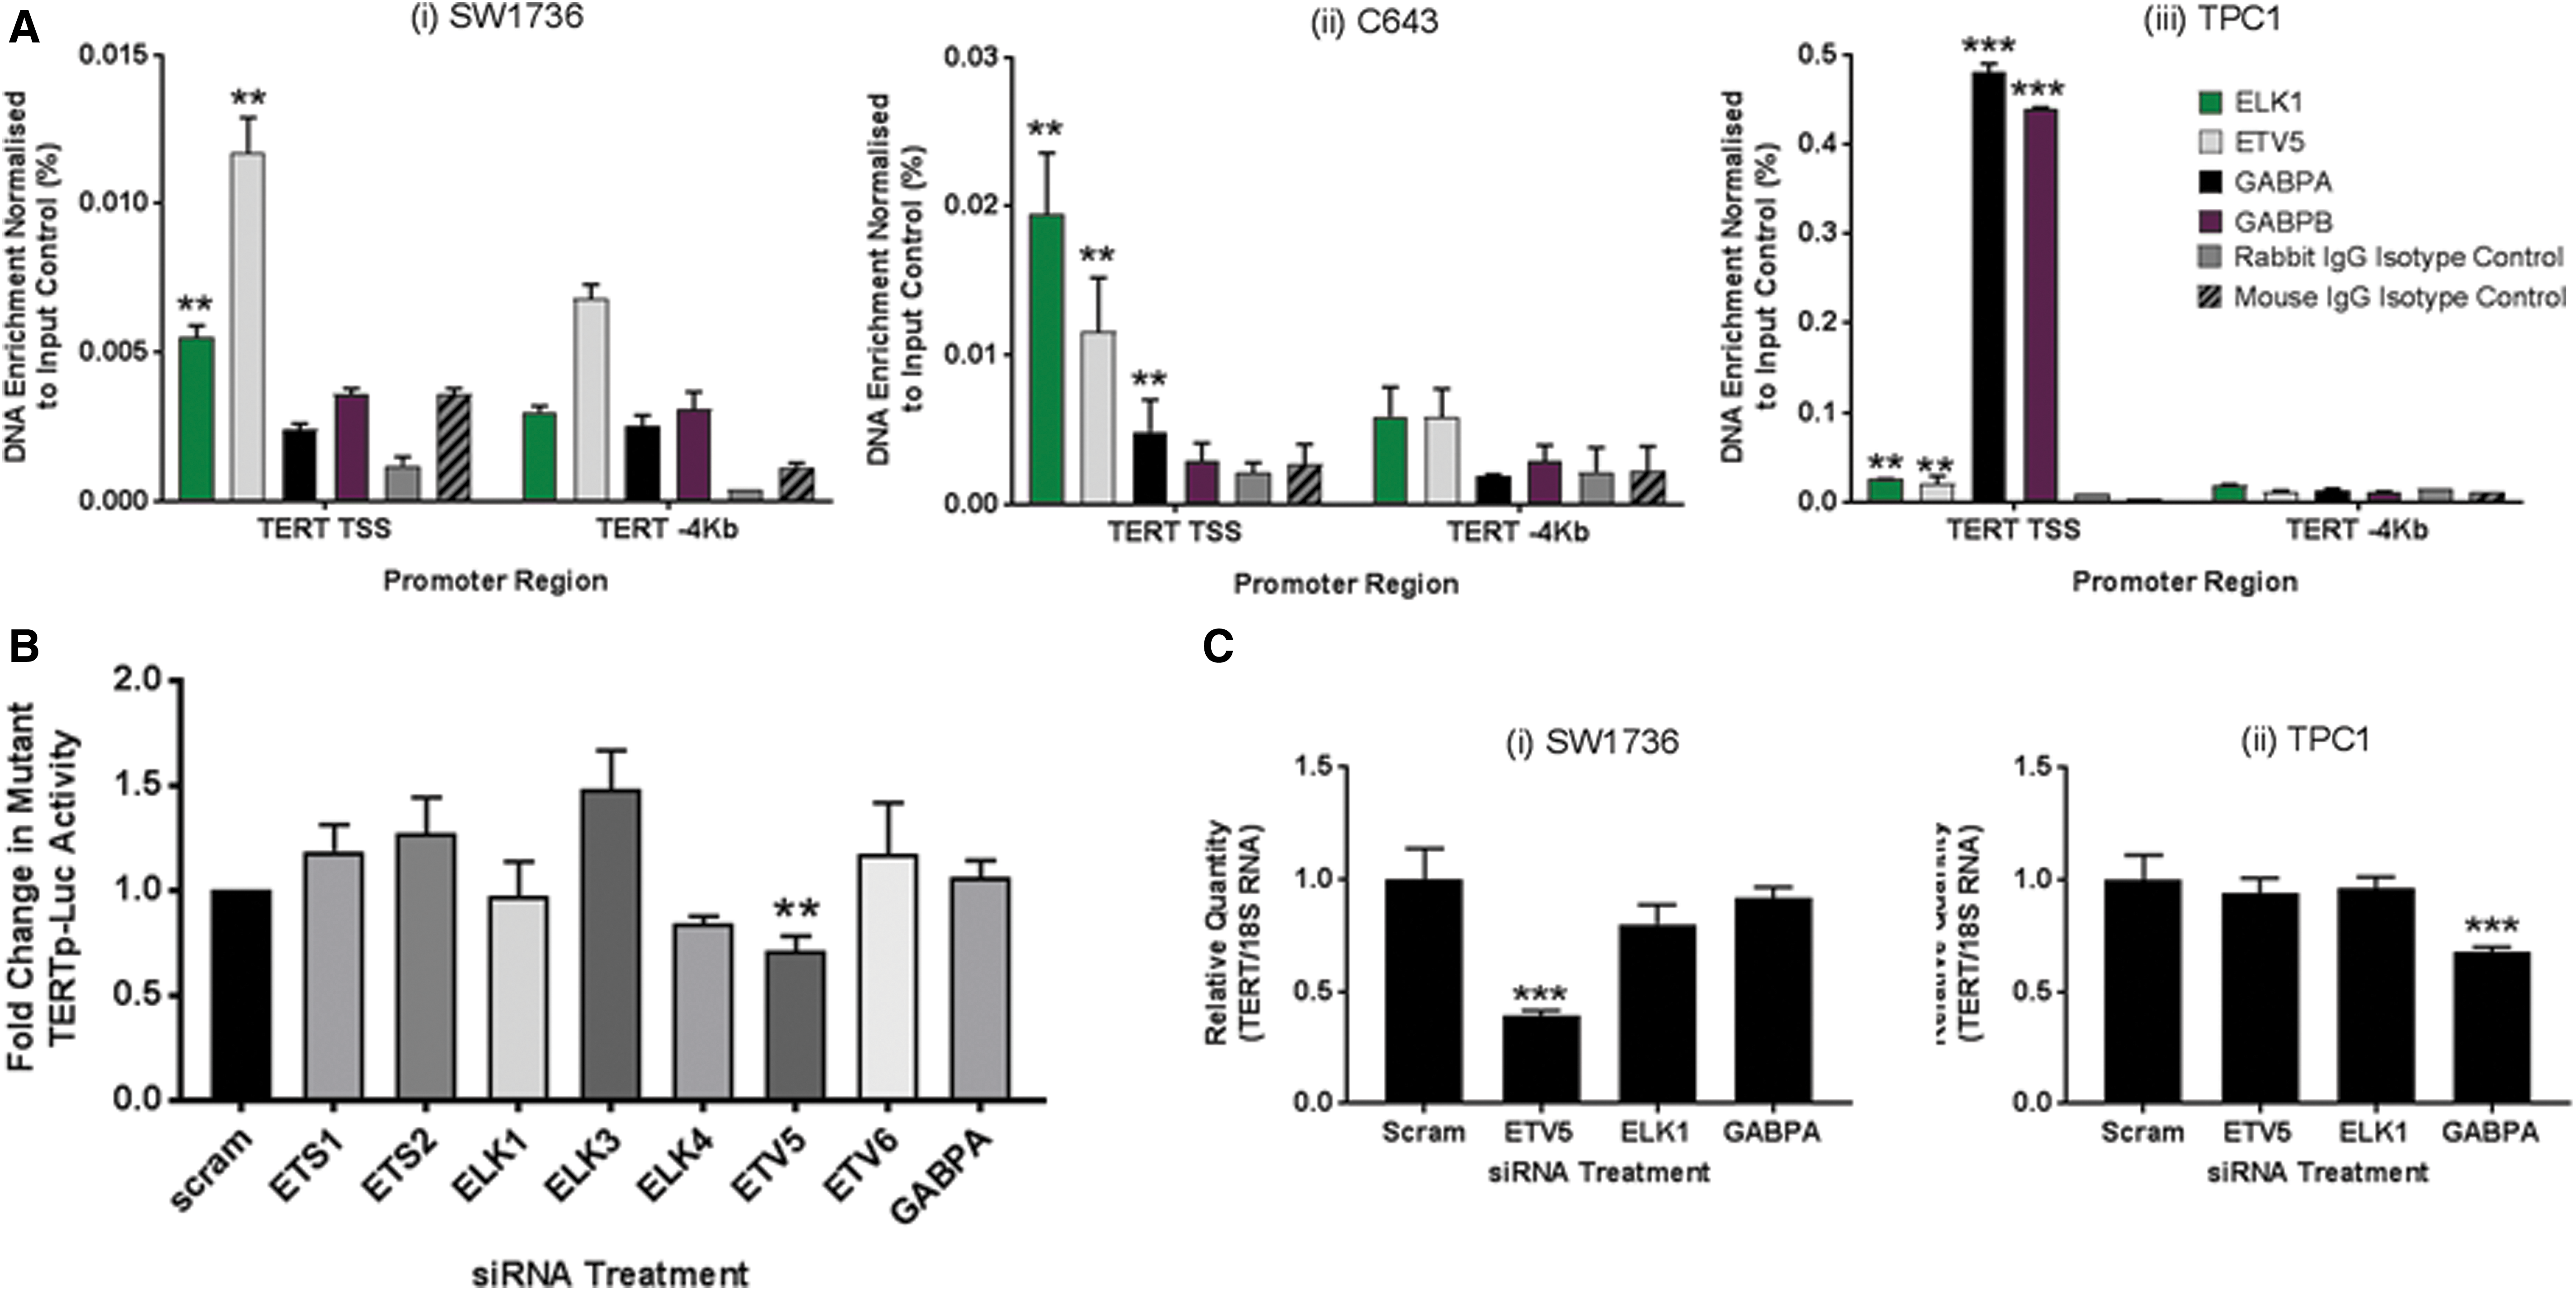
ETV5 and ELK1 are both recruited to the TERTp in thyroid cancer cells, but only loss of ETV5 leads to downregulation of TERT transcription. (
In contrast, GABP complex recruitment to the TERTp, as evidenced by simultaneous detection of both GABPA and GABPB binding, was clearly evident in TPC1 cells. Weak GABPA binding was detectable in C643 cells, yet the absence of GABPB makes it likely that these were transcriptionally inactive monomers. As expected, the wild-type TERTp in nontumoral NThy-ori-3.1 cells demonstrated no detectable enrichment of ETV5, ELK1, or GABP binding (Supplementary Fig. S4).
To determine which of these ETS factors regulate TERTp activity, we screened an ETS-targeting siRNA library with a modified subclone of the SW1736 cell line (SW1736-TLuc1), stably expressing a luciferase reporter gene under regulation by the −124 bp[T]-containing TERTp. Cells were transfected with pools of siRNA previously validated by Western blot to reduce each target ETS factor by >50% (dns), and gene reporter activity was measured following a 48-hour incubation period (Fig. 3B). ETV5 knockdown led to a reduction of 30% (p < 0.05) in TERTp activity, whereas targeting of the GAPBA subunit, ELK1, and six other ETS factors had no discernible impact on TERTp activity in this thyroid cancer model.
To determine that reduced TERTp activity following ETV5 depletion leads to downregulation of TERT mRNA levels, qRT-PCR determination of TERT mRNA was performed using total RNA isolated from siRNA-treated SW1736 cells. Figure 3C shows that ETV5 knockdown led to a 61% reduction (p < 0.01) in TERT mRNA expression 48 hours following siRNA transfection. In contrast, the targeting of ELK1 and GABPA had no effect on TERT expression. Next, we tested ETV5 knockdown in GABP-expressing TPC1 cells and found no effect on TERT expression in these cells (Fig. 3C). In contrast, GABPA knockdown led to a 32% decrease (p < 0.01) in TERT expression at 48 hours following transfection (Fig. 3C). As with SW1736 cells, ELK1 knockdown had no apparent effect on TERT expression indicating that its interaction with the promoter appears to be redundant in these thyroid cancer cell lines.
ETV5 exhibits affinity for mutant TERTp in thyroid cancer cells
Previous studies have shown that TERTp mutations lead to mutation allele-specific TERT expression. The ETV5-specific responsiveness of the TERTp in thyroid cancer cells led us to investigate whether ETV5 is selectively recruited to the transcriptionally active mutant allele. We chose to use the TPC1 and C643 cell lines for these experiments because they are both heterozygous for the −124 bp[T] mutation (Supplementary Fig. S2A), thus providing a suitable cellular context in which we could simultaneously assay the wild-type and mutant TERTp alleles for both transcription factor recruitment and epigenetic markers of transcriptional status.
First, we confirmed monoallelic expression by performing ChIP assays with antibodies against trimethylated lysine residues 4 (H3K4Me3) and 27 (H3K27Me3) of histone 3, which are epigenetic marks for transcriptionally active and silenced genes, respectively. Consistent with previous reports, PCR-cloning of ChIP DNA and sequencing isolated alleles revealed H3K4Me3 to be unique to the mutated DNA strand (Fig. 4A, C). Conversely, the H3K27Me3 was present almost exclusively (97% in TPC1, 99% in C643 cells) on the wild-type allele strand (Fig. 4A, C). In addition, using an approach developed by Stern et al. (6), the polymorphism rs2736098[A/G] located within exon 2 of TERT was used to provide further evidence that TERT was expressed from the −124 bp[T] mutated DNA strand, and the wild-type strand was transcriptionally silent in both cell lines (Fig. 4B).
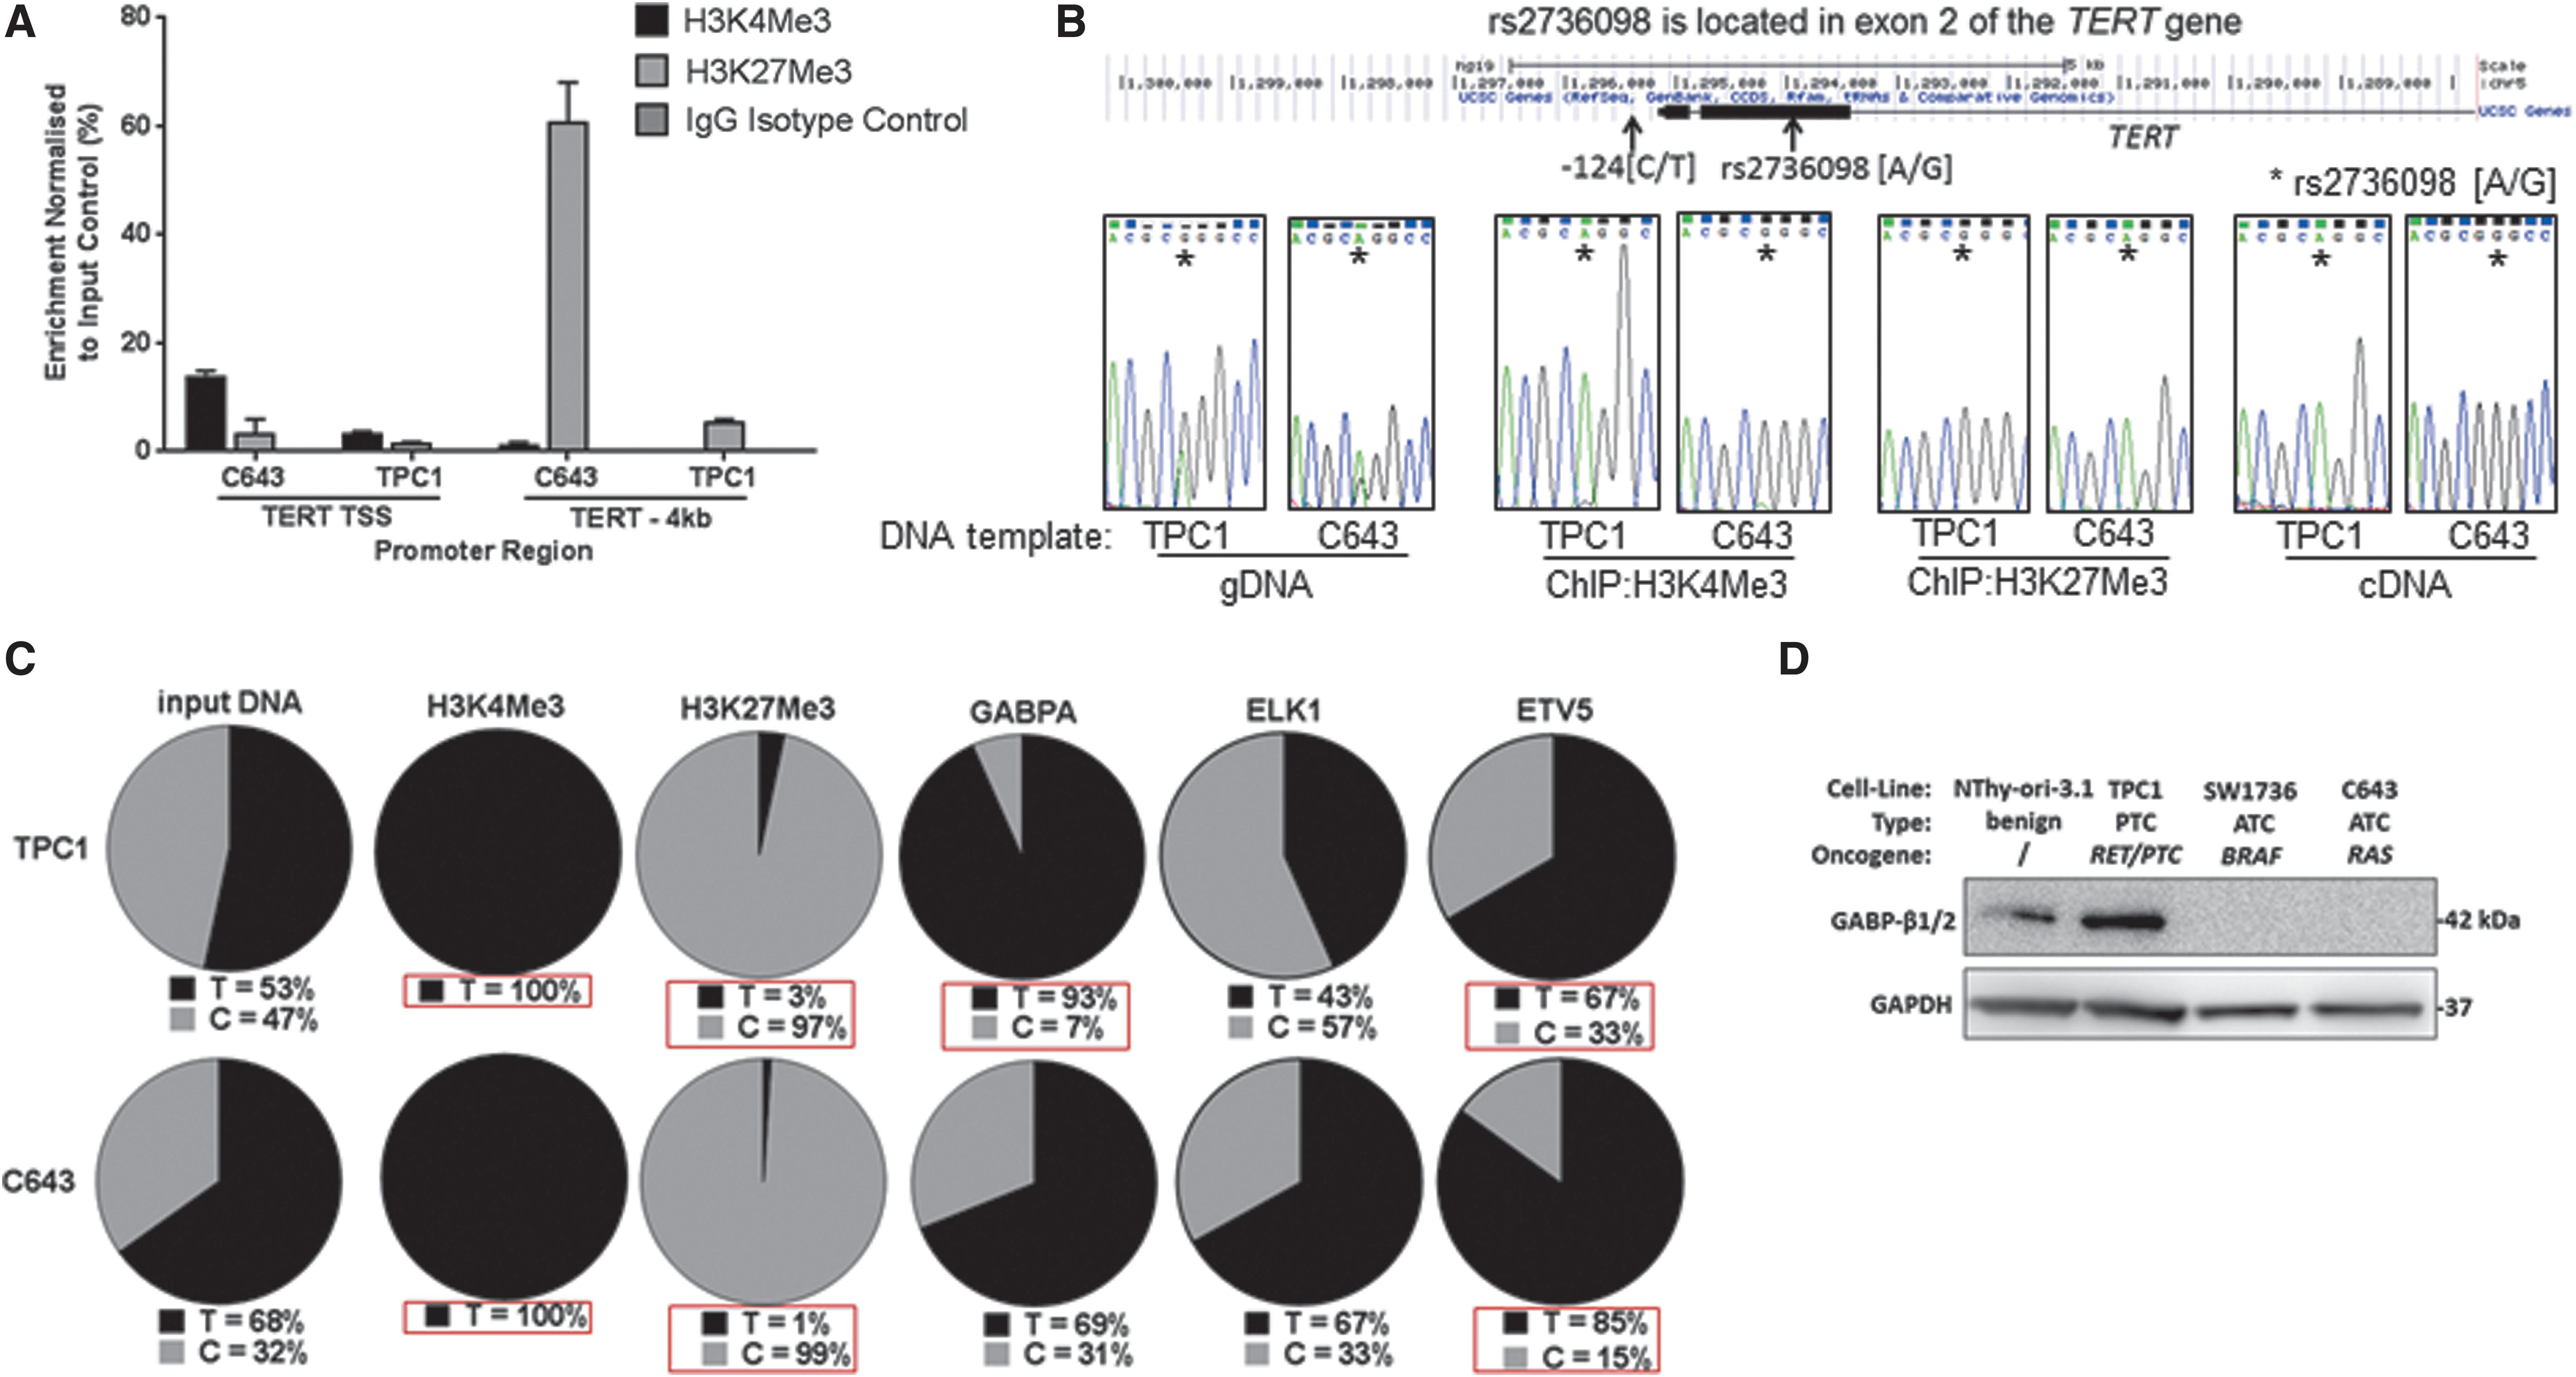
Monoallelic TERT expression follows selective recruitment of ETV5 to the mutant TERTp in thyroid cancer cells. (
Having confirmed monoallelic expression, we then examined whether TERTp-bound ETS factors exhibited differential allele specificities. As before, TERTp was PCR amplified from Chip DNA and individual alleles separated by cloning. First, analysis of TPC1 and C643 input DNA controls revealed each cell line to possess mutant/wild-type allelic ratios of 1:1 and 2:1, respectively (Fig. 4C).
Then, we examined GABPA-subunit binding in TPC1 cells and found significant enrichment of the −124[T] allele (13:1 allelic ratio, p < 0.01), agreeing with previous reports demonstrating that the GABP complex preferentially binds the mutated TERTp. In contrast, the allelic ratio GABPA ChIP DNA from C643 cells was indistinguishable from the input DNA control. However, ETV5 binding demonstrated enrichment of the mutated allele in both cell lines, with allelic ratios of 2:1 and 6:1 in TPC1 and C643 cells, respectively (p < 0.01). In contrast, we found that in both cell lines, ELK1 binding did not exhibit any apparent allele-specific binding preference.
GABPA is recruited by the mutated TERTp solely in the form of the tetrameric GABP complex, which is dependent on the simultaneous expression of GABPB subunit. Thus, we hypothesized that our inability to detect GABP binding in C643 cells might be due to the absence of GABPB expression. Indeed, Western blot analysis, with an antibody specific for the two major isoforms GABPB1 and GABPB2, revealed no detectable expression in both the ATC cell lines SW1736 and C643. This contrasts with the PTC TPC1 and benign NThy-ori-3.1 cell lines, which both express readily detectable levels of GABPB (Fig. 4D).
Binding of ETV5 to the mutated TERTp may use a similar mechanism of transcriptional complex formation by heterodimerization. Previously we reported that ELK1 was a binding partner of FOXE1, a forkhead transcription factor encoded by a gene strongly linked to increased risk of thyroid cancer (24). Intriguingly, we found that this interaction facilitated indirect recruitment of FOXE1 to TERTp and thereby increasing TERT transcription; however, this activity appeared not to be sensitive to the presence or absence of the −124 bp[T] mutation.
Here we extended these early observations to show that ETV5 is also able to physically interact with FOXE1. Figure 5A shows representative immunoblots (n = 3) for co-IP assays using cell lysates from SW1736 cells transfected with flag-tagged FOXE1. Significant enrichment of both ETV5 and ELK1 was achieved on immunoprecipitating exogenous FOXE1-flag with an anti-flag antibody, while ETS factors ELK3, ELK4, ETS1, ETS2, ETV6, and GABPA demonstrated no detectable affinity for the forkhead transcription factor.
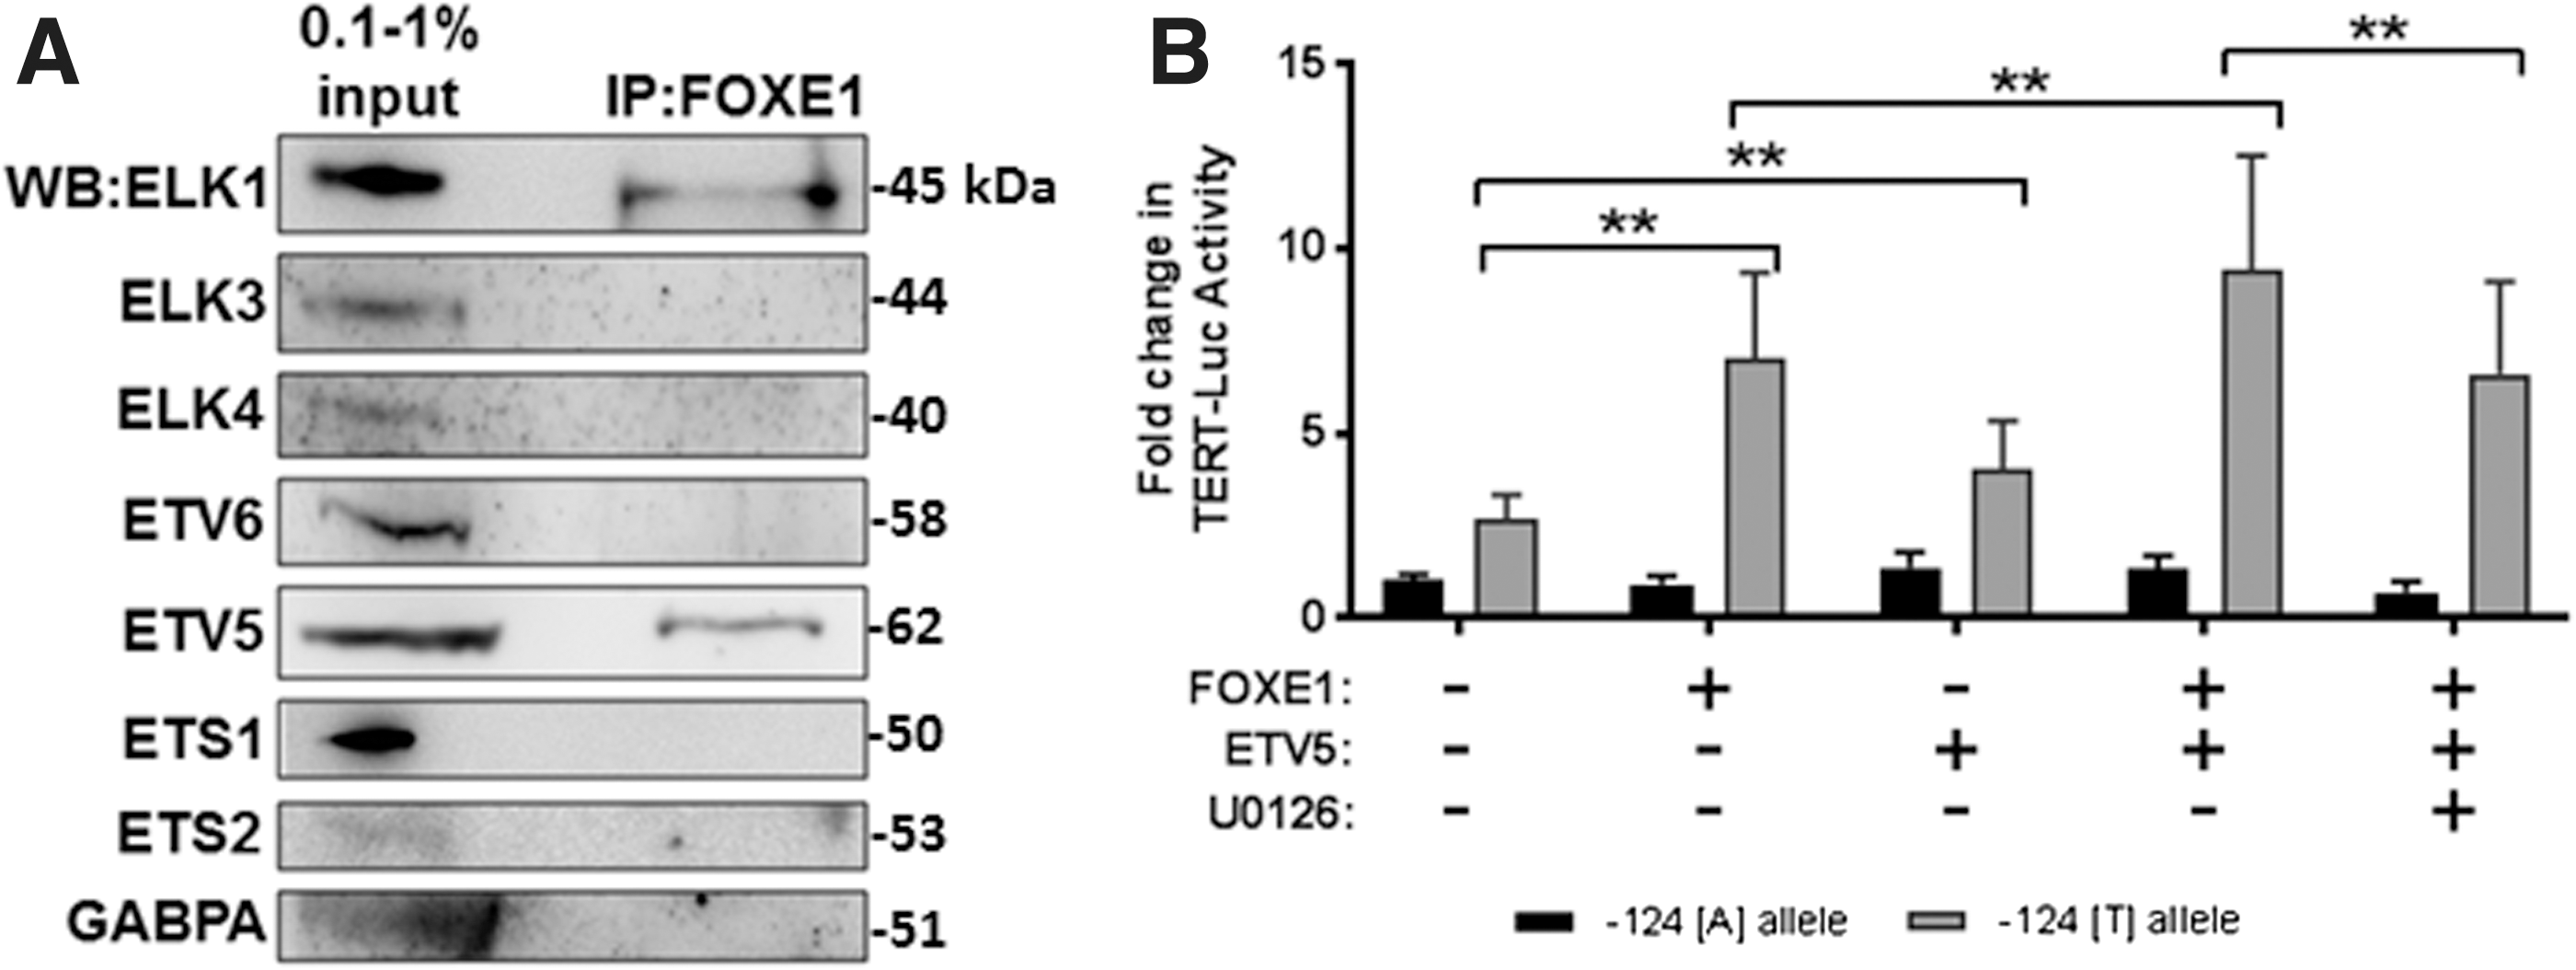
Among the ETS factor family, ETV5 and ELK1 uniquely interact with thyroid cancer risk-associated factor FOXE1. (
We then investigated whether FOXE1 functionally cooperates with ETV5 in a similar manner to that previously observed for ELK1. Figure 5B shows that overexpression of either FOXE1 or ETV5 in SW1736 cells stimulated TERT reporter activity by 2.4- and 1.4-fold, respectively (p < 0.05). In support of our hypothesis that ETV5 cooperates with FOXE1 to stimulate the TERTp, simultaneous co-expression of FOXE1 with ETV5 further enhanced TERT reporter activity by 1.4-fold, relative to FOXE1 alone (p < 0.05). Also, mirroring our previous finding that MAPK pathway inhibition disrupts the interaction between FOXE1 and ELK1, the enhancement of promoter activity following FOXE1 and ETV5 coexpression was lost in the presence of MEK1/2 inhibitor U0126 (p < 0.05).
Discussion
Here we report a detailed examination of ETS factors that activate the mutated TERTp in thyroid cancer. We show that ETV5 is abundantly expressed in thyroid cancers and positively correlates with both BRAF and RAS mutations. Furthermore, ETV5 demonstrates preferential binding to the −124 bp(T) cancer-associated TERTp allele and stimulates TERT transcription in thyroid cancer cells. This is the second reported instance of an ETS factor possessing cancer allele-specific activity, following the initial discovery that GABP performs the same function in the cellular context of glioblastoma.
Liu et al. (25) recently made the observation that GABP can regulate TERT expression in thyroid cancer via an FOS-mediated oncogenic BRAF activation of GABPB expression. However, our data show that the GABPA and GABPB1 genes are significantly downregulated in PTC compared with normal thyroid, and there was no detectable association between BRAF status and expression of either GABPB1 or GABPB2. In the cancer cell lines we examined, we could measure significant TERTp enrichment of GABP in the PTC cell line TPC1, whereas this interaction was undetectable in both the ATC cell lines SW1736 and C643. Further analysis revealed very low abundance of GABPB, necessary for mutant allele-specific GABP complex formation, in the two studied ATC cell lines.
Overall, our data suggest that ETV5 may be at least as relevant as GABP for mutant TERTp activation, particularly in the absence of GABPB expression. In further support of a non-GABP-mediated TERTp activation in thyroid cancer, a recent study found GABPA to be negatively correlated with TERTp mutation/TERT expression, and to also function as a tumor suppressor by inhibiting metastasis (26).
Our in vitro data show that MEK inhibition leads to a marked decrease in ETV5 expression, indicating that the MEK-ERK pathway positively regulates ETV5 transcription. However, we observed that the highest ETV5 upregulation in PTC clinical samples is associated with oncogenic RAS. Unlike oncogenic BRAF that only activates downstream MEK-ERK signaling, RAS kinases also activate the PI3K-AKT pathway. However, we could not show that PI3K inhibition affects ETV5 expression (and it was associated with a slight increase in ETV5 in SW1736 cells). Our data are therefore most consistent with MEK activation via either BRAF or RAS signaling as the most relevant stimulus for ETV5 expression. Recently, Puli et al. (11) showed similar results using the PTC cell line KTC1, and our results from a wider range of thyroid cell lines are supportive of their findings.
We extended our previous observation that FOXE1 could be recruited indirectly to the TERTp via its physical interaction with ETS factors to coregulate TERT transcription (21). Since FOXE1 physically associates with ETV5 to coregulate TERT expression, and since ETV5 exhibits specific binding for the mutant TERTp allele, our data provide a plausible mechanism to explain the strong association between FOXE1 and thyroid cancer (27 –32). Interestingly, we compared several factors representing all the major subgroups of the ETS family, and it appears that the ability to interact with FOXE1 is a unique property shared by ETV5 and ELK1. Future experiments will be required to establish the interaction motif(s) shared by both proteins that are responsible for this unique interaction.
Until now, the mainstay strategy of targeted chemotherapy has been the inhibition of kinase signaling pathways. Despite some notable successes, the majority of approved kinase inhibitors only achieve modest improvements on progression-free survival. Transcription factors as the downstream effectors of kinase signaling provide an alternative drug target, due to the more cell-type-specific nature of their biological function. Future therapies that inhibit ETV5 activity may be particularly effective in the treatment of mutant TERTp-harboring thyroid cancers.
Footnotes
Author Disclosure Statement
No competing financial interests exist.
Funding Information
This work was partly supported by the Australian NHMRC project grant 1061941 awarded to A/Prof. Clifton-Bligh. Dr. Bullock was supported by a project grant from the Rebecca L. Cooper Medical Research Foundation.
Supplementary Material
Supplementary Figure S1
Supplementary Figure S2
Supplementary Figure S3
Supplementary Table S1
Supplementary Table S2
Supplementary Table S3
Supplementary Table S4
Supplementary Table S5